Introduction
In progressive cancer, signals emanating from the
tumor will affect the host and result in physiological and
behavioral changes that include anorexia, lethargy, fatigue and
inflammation. Nearly 80% of patients with progressive cancer are at
risk of eventually developing a wasting condition referred to as
cancer anorexia-cachexia syndrome (CACS) (1,2). This
syndrome is marked by a decrease in nutritional intake and a
simultaneous wasting of peripheral tissues, skeletal and adipose
tissues primarily, whereas brain and organ tissues appear to be
spared (3,4). The specific mechanisms behind CACS are
not yet clear, but it is reasonable to suggest that regulatory
centers for feeding and homeostasis in the central nervous system
(CNS) are involved (5,6).
In the present study, we explored the host response
to an anorexia-inducing pro-inflammatory tumor with respect to
various feeding regulatory signals present in the hypothalamus and
hindbrain. MCG101 is an undifferentiated, endothelial-like,
non-metastasizing, solid tumor that produces high amounts of the
pro-inflammatory mediator prostaglandin E2 (7). This mouse model presents with a
progressive reduction in ad libitum feeding accompanied by
peripheral wasting of fat and skeletal muscle masses (8–10),
thus resembling CACS in cancer patients. We presently focused on
genes coding for corticotropin-releasing hormone (CRH), cocaine-
and amphetamine-regulated transcript (CART), nesfatin-1,
thyrotropin (TSH) and its receptor (TSHR) as these neuroendocrine
factors are able to attenuate food intake at a central level
(11–14). These genes are of particular
interest since inflammation is a common characteristic of CACS and
the hypothalamic expression levels of these substances are
responsive to acute inflammation (15–18, data not shown). We
recently showed that acute inflammation produces a robust elevation
in plasma CART peptide (CARTp) levels in a prostanoid-independent
manner as well (data not shown). Given the pro-inflammatory
features of most cancers, it would be reasonable to suspect that a
similar plasma CARTp response may manifest in a progressive tumor
model as well.
In the present study, we thus tested the hypothesis
that host mRNA expression of Crh, Cartpt,
Tshb, Tsh and Nucb2 in hypothalamic, hindbrain
and pituitary tissues are altered as part of the response to
MCG101-induced CACS. The possible impact of tumor-induced anorexia
vs. food restriction per se was also investigated in order
to uncover whether changes detected are directly due to tumor
factors, or due to a secondary adaptation to reduced caloric
intake. Secondly, we aimed to determine whether changes in gene
expression are paralleled by altered levels of TSH and CARTp in
plasma.
Materials and methods
Animals
Female mice (C57Bl/6JBomTac; Taconic, Denmark)
weighing 18–23 g were used in the present study. All animals were
kept under controlled ambient conditions: lights on 07:00–19:00 h,
temperature 21±1°C and relative humidity 45–55%. Ethical approval
was obtained from the Gothenburg Regional Animal Ethics
Committee.
Mice were separated into three weight-matched groups
(n=8/group) and housed in pairs. This was carried out to reduce the
potential risk of confounding effects of estrus cyclicity, since
cage mates tend to synchronize their cycles. Thus, it could be
assumed that any random variations in estrogen levels would be
equally distributed across groups. The cages were equipped with
wire floors, a solid 20-cm square acrylic floor panel and nesting
material. Mice were acclimated to the wire floor cages three days
prior to tumor- or sham-implantation.
Mice assigned to the tumor-bearing (TB) group were
given bilateral subcutaneous implants of MCG101 tumor pieces (~1–3
mm3) under isoflurane anesthesia. The freely fed (FF)
and pair-fed (PF) control mice underwent sham-implantation.
Feeding and body weight
Food intake and individual body weight were daily
recorded at the same time point (07:30–09:30 h). The order in which
the cages were checked was performed at random each day. The ad
libitum feeding was measured for the FF and TB groups. The
daily food intake was corrected for food spillage. The PF group was
provided with a restricted amount of food equal to that which was
consumed by the TB group.
Tissue collection
Fourteen days after tumor implantation, the mice
were anesthetized with a mixture of xylazine (5 mg/kg mouse) and
ketamine (100 mg/kg mouse) i.p. in a volume of 0.1 ml. EDTA-blood
was collected by cardiac puncture and plasma was subsequently
isolated by centrifugation (2,000 × g, 10 min, 4°C). Whole brains
and pituitaries were collected for mRNA expression analysis. The
whole brains were subdivided into the brainstem and the
hypothalamus (defined as caudal to the optic chiasm and rostral to
the mammillary bodies). From the hypothalamus, two areas were
microdissected using 2 mm biopsy punches. The arcuate nucleus (ARC)
was defined as the ventral portion of the third ventricle. The
paraventricular area (PVN) was defined as the tissue surrounding
the dorsal two-thirds of the third ventricle. All tissues were
placed in RNA-Later solution according to the manufacturer's
recommendations (Ambion, Life Technologies, The Netherlands) and
stored at −20°C until processing.
Relative expression of mRNA
Tissues were homogenized with a rotor/stator
homogenizer in QIAzol lysis reagent supplied with the RNeasy Lipid
Tissue Mini kit (Qiagen AB, Sweden). Total RNA was extracted, with
a DNase digestion step included, according to the manufacturer's
protocol. RNA concentration was determined using a NanoDrop ND-1000
instrument, and RNA integrity was established in a Bioanalyzer 2100
with an Agilent RNA 6000 Nano kit (Agilent Technologies, Germany).
The RNA integrity numbers were above 7.5 for all tissue
extracts.
Synthesis of cDNA (SuperScript VILO; Life
Technologies) was conducted on 0.2–1.0 µg RNA. Resultant
cDNA was assayed in triplicate using Power SYBR-Green PCR Master
Mix (Life Technologies) in an ABI Prism 7000 HT instrument (Applied
Biosystems, Life Technologies). QuantiTect Primer Assay kits for
TSHβ (Tshb, QT00135303), TSHR (Tshr, QT00136955),
CART (Cartpt, QT00130396), nesfatin (Nucb2,
QT02281965), CRH (Crh2, QT01055789) and GAPDH (Gapdh,
QT001658692) were purchased from Qiagen Sciences (Germantown, MD,
USA). Each 10 µl PCR reaction consisted of 5 µl
Master Mix, 1 µl primer assay and 4 µl cDNA diluted
in nuclease-free water. All assays underwent 40 thermocycles
(10-sec melting at 95°C and 60-sec annealing/elongation at 60°C).
Gene expression data were calculated relative to Gapdh mRNA
using the 2−ΔΔCt method.
Plasma assays
Plasma samples were assayed for TSH, CARTp and serum
amyloid P component (SAP) levels by ELISA (kamiya Biomedical
Company, Seattle, WA, USA; RayBiotech, Inc., Norcross, GA, USA;
R&D Systems, Bio-Techne EMEA, UK). Plasma samples were assayed
in duplicate. Plasma aliquots were thawed on ice, briefly
vortex-mixed and subsequently prepared according to the respective
manufacturer's protocols.
Statistical analysis
Body weights and feeding data were assessed by
one-way analysis of variance followed by post hoc Fisher's LSD
tests. Between group differences for mRNA and plasma data were
evaluated using Kruskal-Wallis analyses followed by pair-wise
Mann-Whitney U tests where applicable. Correlations reported were
performed on ranked data to obtain Spearman correlation
coefficients (ϱ) and P-values. P-values <0.05 were regarded as
statistically significant. Data were assessed using SPSS statistics
version 20 (IBM Corp., Armonk, NY, USA).
Results
One TB mouse spontaneously died on post-implantation
day 11 and was therefore excluded from analysis. Group sizes at the
experimental endpoint were TB (n=7), FF (n=8) and PF (n=8). The
group sample sizes for ARC relative expression were FF (n=6), TB
(n=5), PF (n=7) due to low RNA yield for this tissue.
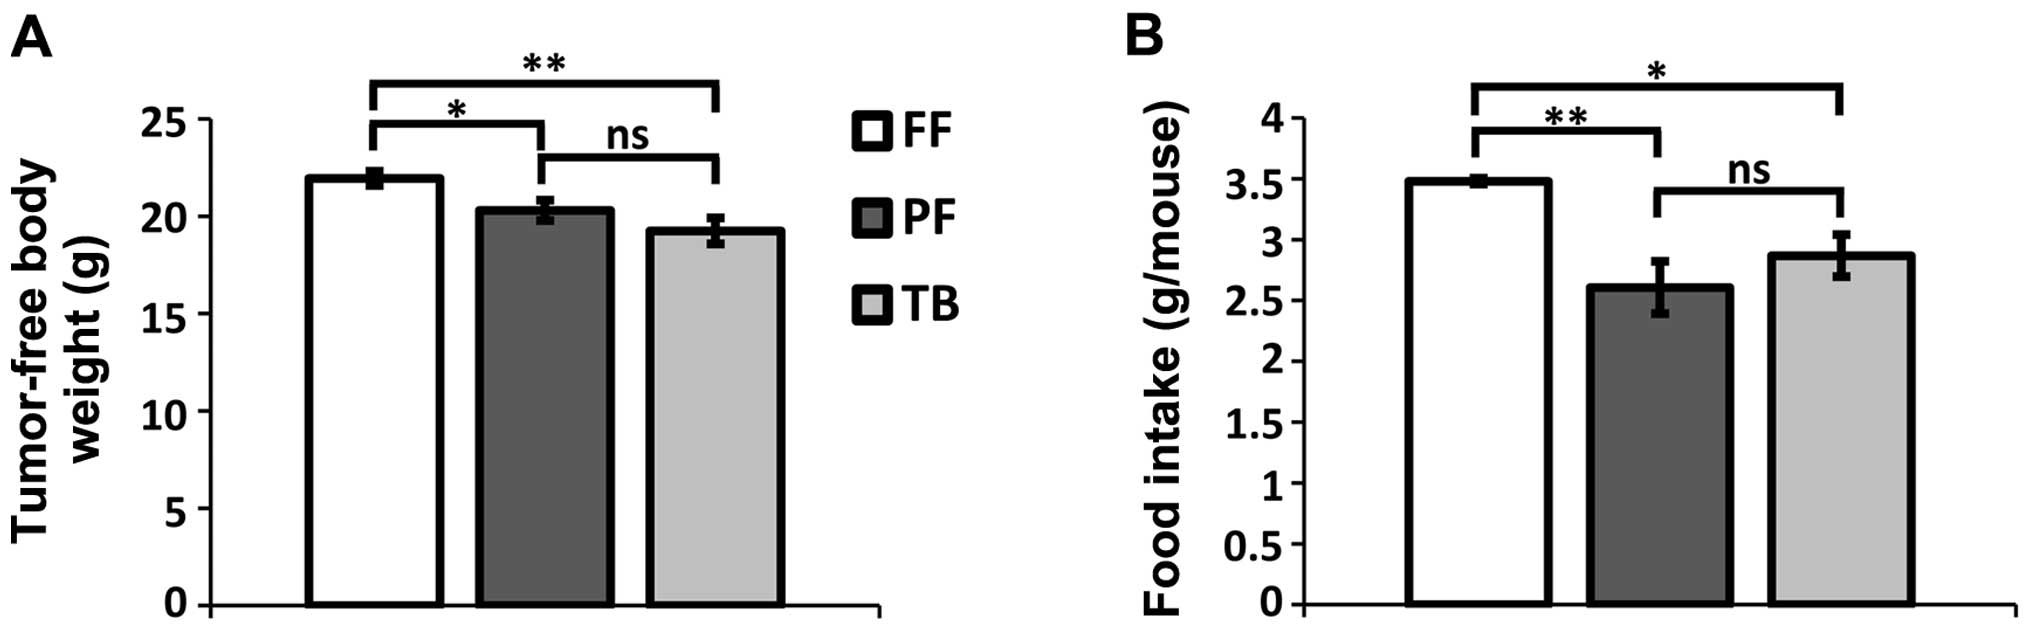
Body weight and feeding
There was no difference in baseline body weight
between the groups (F2,20=0.38; P=0.69), but at the
experimental endpoint there was a significant difference in
tumor-free body weight among the groups (Fig. 1A; F2,20= 6.81; P=0.006).
Both TB and PF mouse groups had lower average body weights than the
FF control group (P=0.002 and P=0.033, respectively). There was no
difference between the TB and PF mice with respect to tumor-free
body weight (Fig. 1A; P=0.17).
Baseline food intake was defined as the average food
intake/mouse during the first three post-implantation days. There
was no difference in basal feeding between groups
(F2,9=0.34; P=0.72). The endpoint food intake was
similarly defined as the average food intake during the final three
observation days. There was a significant difference in endpoint
food consumption (Fig. 1B;
F2,9= 7.90; P = 0.01). Post hoc comparisons confirmed
that the TB and PF mouse groups did not differ in food intake
(P=0.28) and that both groups consumed less food than the FF group
(P=0.02 and P=0.004, respectively).
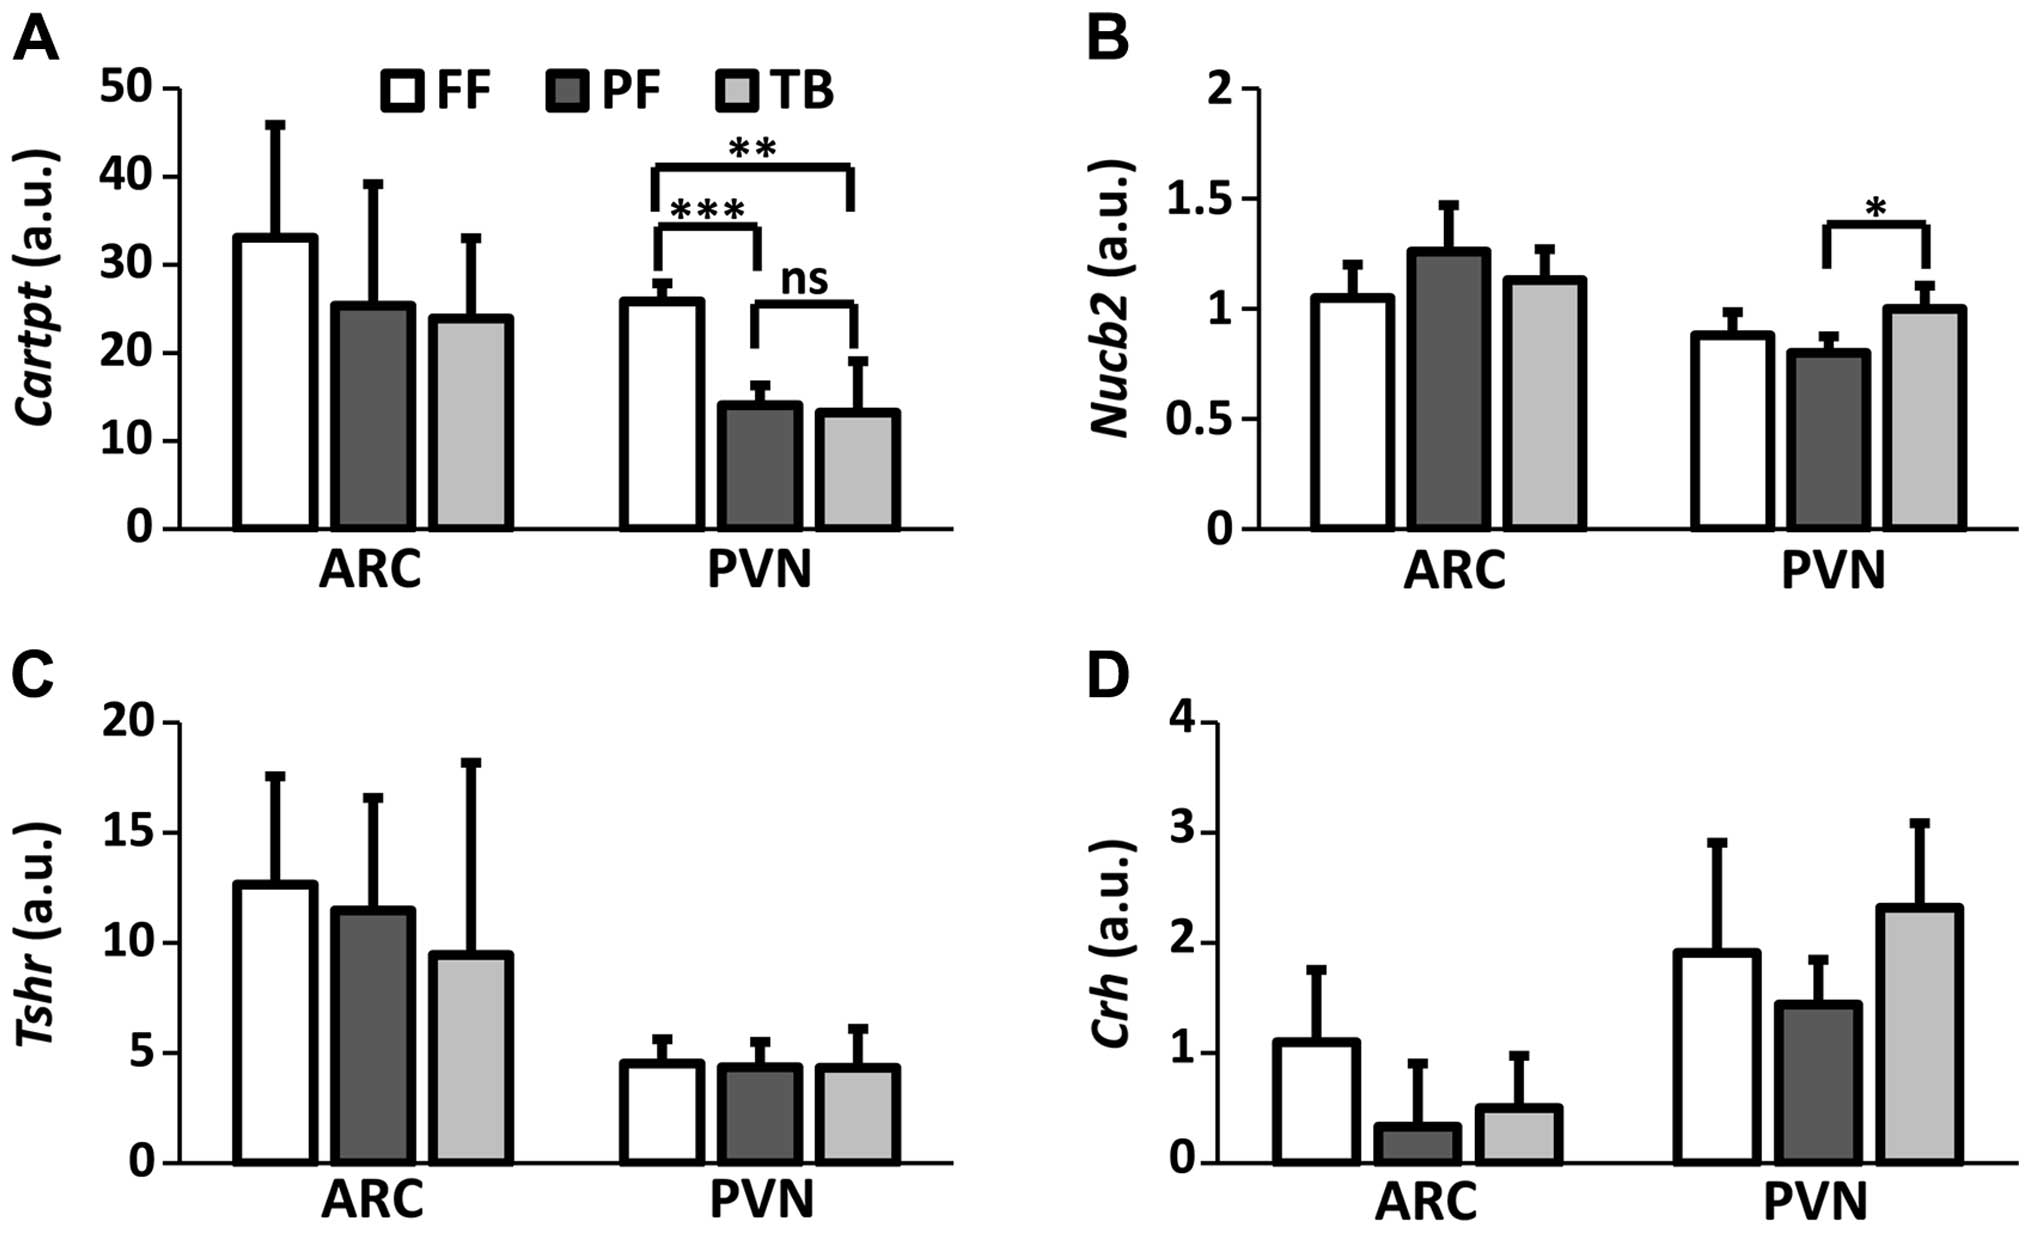
Relative expression of mRNA
In the PVN, there was an overall effect on
Cartpt (χ2=13.12; df=2; P=0.001) and Nucb2
(χ2=7.10; df=2; P=0.03) mRNA expression. Cartpt
mRNA expression was significantly reduced in both the TB
(P<0.01) and PF (P<0.001) groups compared to FF controls
(Fig. 2A). The reduced
Cartpt mRNA expression was similar between the TB and PF
groups (P=0.69). The Nucb2 mRNA expression in the PVN
differed between the TB and PF groups (P<0.05) with the FF group
having intermediate expression (Fig.
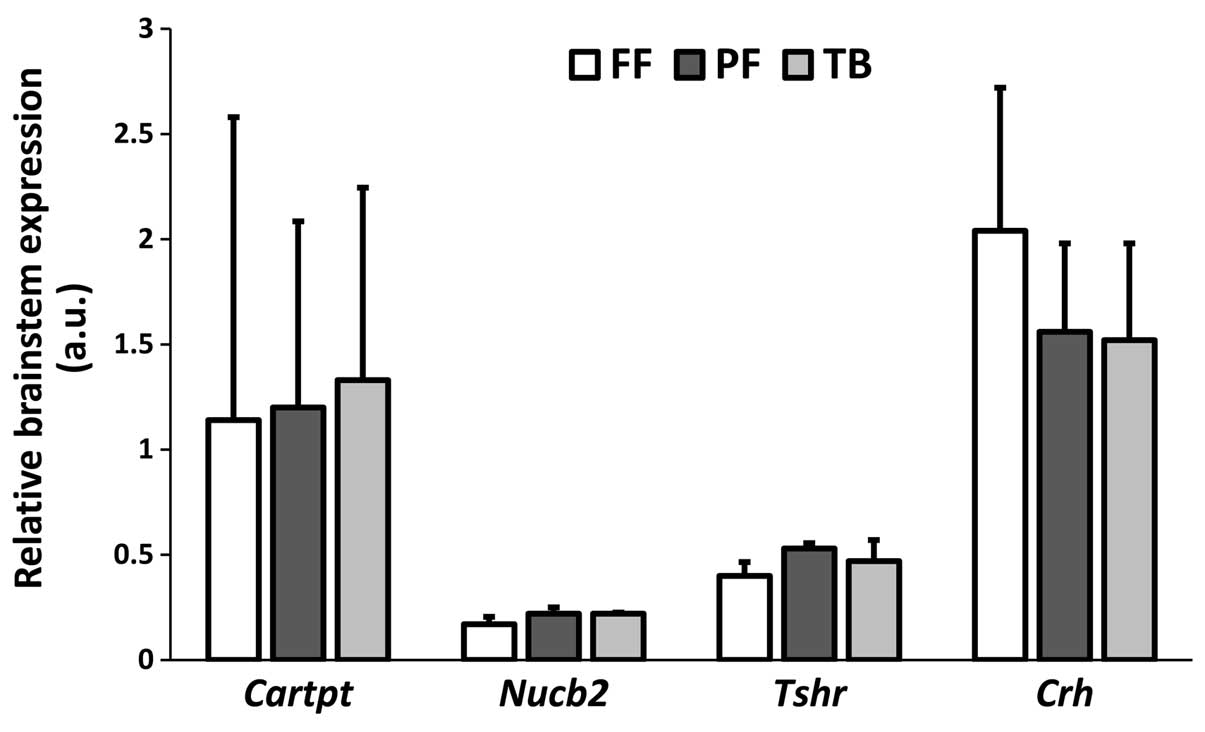
2B). Neither chronic tumor burden nor food restriction affected
gene expression in the ARC (Fig. 2)
and brainstem (Fig. 3) with respect
to Cartpt, Nucb2, Tshr and Crh mRNA.
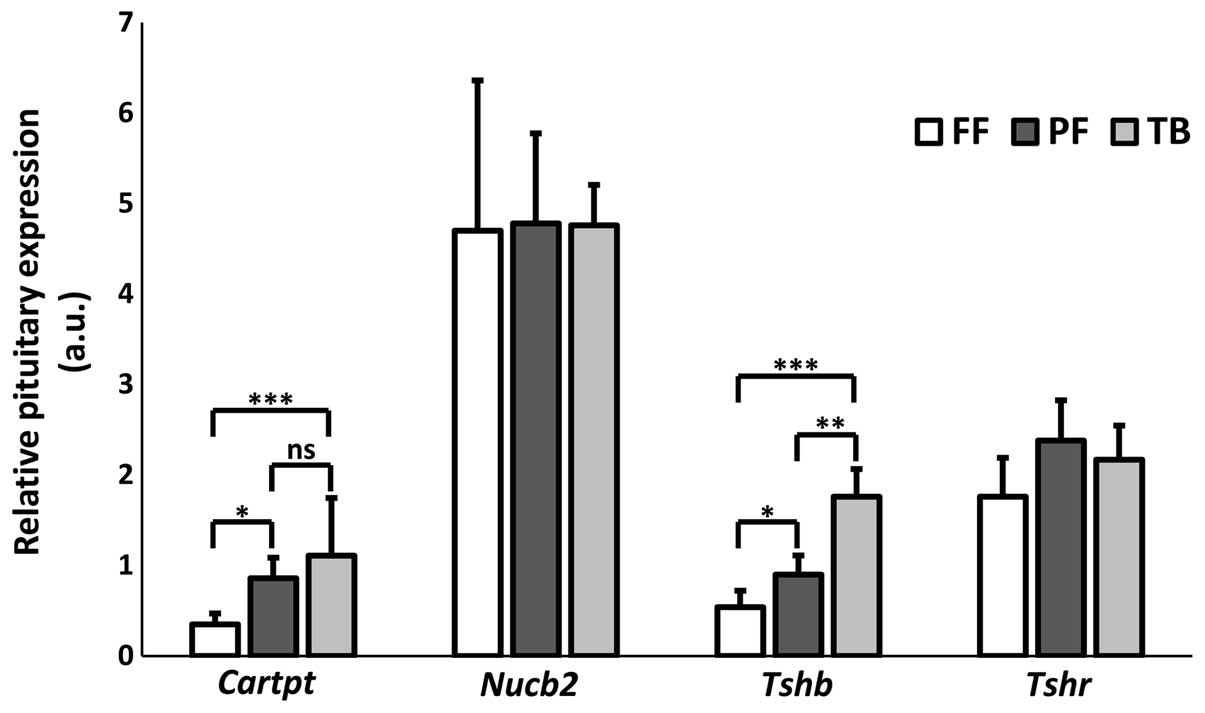
There was an overall effect on pituitary
Cartpt (χ2=12.73; df=2; P=0.002) and Tshb
(χ2=15.89; df=2; P<0.001) mRNA expression (Fig. 4). Subsequent post hoc tests
indicated that CART mRNA expression was greater in the TB
(P<0.001) and PF (P<0.05) mice compared to the FF controls
(Fig. 4). Tshb mRNA
expression, which was only detectable in the pituitary, was
significantly higher in the TB compared to both the FF (P<0.001)
and PF (P<0.01) groups (Fig. 4).
Food restriction in the PF group was capable of elevating pituitary
Tshb mRNA (P<0.05) but not to the extent of the TB
condition.
Plasma TSH, CARTp and SAP levels
Kruskal-Wallis analysis revealed that there was an
overall effect on plasma CARTp levels (Table I). Mann-Whitney U tests further
showed that TB mice had a significantly higher plasma CARTp
concentrations than the FF (P<0.01) or PF (P<0.01) groups.
Plasma CARTp appeared on average to be elevated in the PF group but
the difference was not significantly different from the FF controls
(P=0.08). Given the elevated plasma CARTp in TB animals, we
hypothesized that the MCG101 tumors per se were a source of
circulating CARTp. However, we found Cartpt mRNA to be below
the limit of detection in the tumors (data not shown).
 | Table IPlasma concentrations of TSH, CARTp
and SAP in freely fed (FF), tumor-bearing (TB) or pair-fed (PF)
mice presented as medians (interquartile range). |
Table I
Plasma concentrations of TSH, CARTp
and SAP in freely fed (FF), tumor-bearing (TB) or pair-fed (PF)
mice presented as medians (interquartile range).
| FF n=8 | TB n=7 | PF n=8 | χ2 | P-value |
|---|
| TSH pg/ml | 172 (82) | 302 (318) | 243 (206) | 0.85 | 0.653 |
| CARTp pg/ml | 190 (373) | 1,661
(1,834)a | 512 (370)c | 11.72 | 0.003 |
| SAP
µg/ml | 1.9 (0.8) | 55 (40)b | 1.5 (0.6)d | 14.35 |
<0.001 |
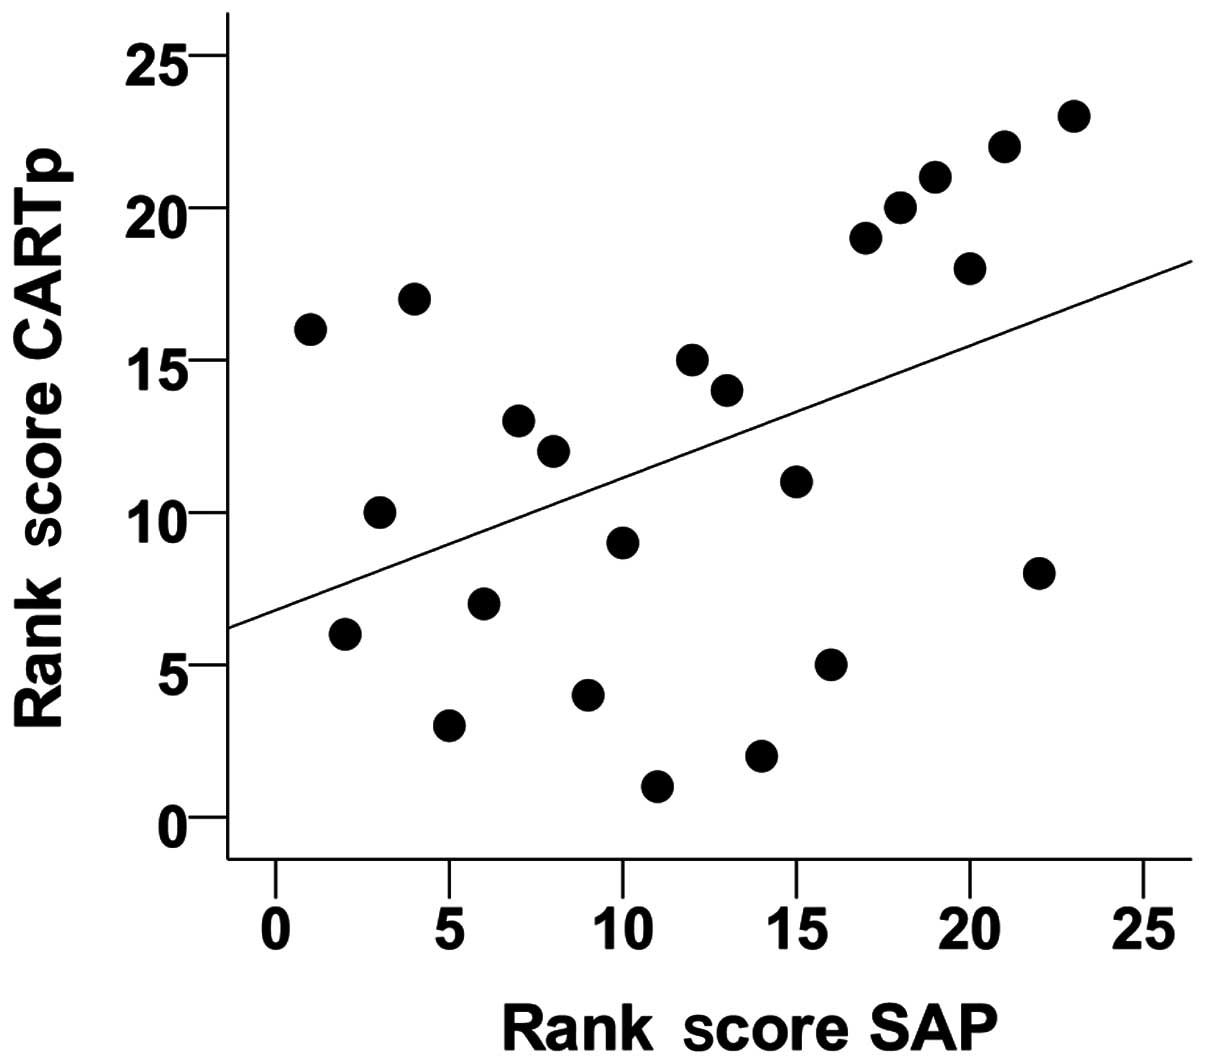
As expected, the presence of the
PGE2-producing tumor resulted in a stark elevation of
plasma SAP (Table I) compared to
both the FF (P<0.001) and PF (P<0.001) animals. Plasma CARTp
and SAP concentrations had a positive correlation (Fig. 5; ϱ=0.43; P=0.04; n=23). Plasma TSH
concentrations did not differ significantly among the groups
(Table I).
Discussion
In the present experiment, we investigated whether
expression of various neuroendocrine signals that negatively
regulate food intake in the CNS in the healthy state may be altered
in response to CACS. We used the MCG101 mouse model which displays
CACS to answer this question. In the present study, we showed that
Nucb2 was elevated in the PVN of TB animals in contrast to
the PF controls (Fig. 2B). The
bioactive Nucb2 peptide product, nesfatin-1, inhibits food
intake at a central level (14,19,20).
Our finding is noteworthy since it may suggest that induction of
Nucb2 in the PVN could play a primary role in promoting the
tumor-induced anorexia response of the host. To the best of our
knowledge, there are no clinical studies regarding any possible
central role of nesfatin-1 in man, although circulating nesfatin-1
is reported to be affected in patients with CACS (21). Progressive cancer in CACS has a
major impact on the organism and it is reasonable to assume that
physiological stress mechanisms will be recruited, for example HPA
axis activation. Notably, there is an overlap of nesfatin-1- and
CRH-containing cells within a small subset of neurons in the
PVN of the rat (22). In contrast
to Nucb2, we could not detect any significant change in
Crh mRNA expression in the PVN in either the TB or PF
animals, however (Fig. 2D). In
fact, the lack of any differences in Crh mRNA levels between
groups in the PVN may imply that chronic tumor exposure does not
lead to an activation of the HPA axis by CRH. Since
Crh mRNA remained unaltered, our conclusion is that the
MCG101 tumor induces a CRH-independent increase in Nucb2
mRNA in the PVN. Our data further raises the possibility that
nesfatin-1 could participate in the tumor-induced reduction of
caloric intake set point observed in CACS.
Besides nesfatin-1 and CRH as possible
central-acting anorexigens of relevance in CACS, we investigated
changes in Cartpt mRNA expression in the PVN and ARC as
well. CARTp have potent anorexigenic effects and are proposed as
endogenous satiety signals (12).
It was shown in the rat that CACS induced by LC-6-JCK tumors can
lead to lowered Cartpt expression in the ARC (23). This cited study did not, however,
incorporate a pair-fed control group. Whereas we found no effect on
Cartpt mRNA in the ARC, there was a strong suppression of
Cartpt in the PVN in the TB animals vs. FF controls. This
finding on its own would have led us to believe that tumor signals
would directly cause suppression of Cartpt mRNA in the PVN.
However, Cartpt was suppressed to a similar degree in
animals pair-fed vs. the TB group (Fig.
2A). These findings suggest that the suppression of
Cartpt in the PVN is a phenomenon secondary to the reduced
caloric intake which results from tumor-induced anorexia. Thus,
CART suppression in the PVN appears to be adaptive rather than
causal with respect to CACS. The reduction of hypothalamic CART in
PF animals vs. FF controls (Fig.
2A) corresponds to some previous studies in food-deprived vs.
post-prandial rats (12), cf
(24). Our results are also
consistent with a study in rats carrying an MNU-induced mammary
tumor, wherein CACS animals were unresponsive to intraventricular
CARTp and CART antiserum, and they displayed weaker immunostaining
in hypothalamic structures suggestive of reduced CARTp activity
(25). Together, our results
clearly support that decreased hypothalamic Cartpt
expression is a compensatory mechanism, likely aimed at defending
caloric intake. This compensatory reduction in hypothalamic
Cartpt expression was a result of the anorexia per se
rather than a direct response to tumor factor impact. In
conjunction with previous studies (23,25),
our data further support that such an adaptive CARTp-mechanism may
be common feature in CACS, since it is neither restricted to one
single species, nor to a specific tumor type.
In addition to examining putative hypothalamic
effects in CACS, we also investigated such responses in the
pituitary and brainstem which are of importance in mediating
central-peripheral signaling. In contrast to the PVN, Cartpt
mRNA in the pituitary (Fig. 4) was
elevated in response to chronic MCG101 exposure or to food
restriction. The pituitary Cartpt mRNA levels did not differ
between the TB and PF groups. Whereas there was no effect on
pituitary Tshr or Nucb2 mRNA expression in any of the
groups, there was a slight but significant increase in Tshb
mRNA in response to food restriction. Notably, however, this
expression was effectively doubled in the TB animals. Thusly, the
TB condition gave rise to a Tshb response which can only be
partially explained by reduced caloric intake (Fig. 4). The present change in Tshb
gene expression was not paralleled by any changes in plasma TSH
levels (Fig. 4 and Table I). The plasma TSH data are
consistent with previous studies in cancer cachexia patients and
experimental MCG101-bearing mice (26,27).
In these cited studies, patients and animals with CACS showed
normal circulating TSH levels but apparent hypothyroidism, which
was also not completely explained by nutritional status alone. The
increase in pituitary Tshb mRNA in the TB group seen in this
study, is therefore likely a synergistic effect of a response to
tumor signals in combination with a response to the reduced caloric
intake. With regard to the brainstem, we found no significant
effects on any of the investigated genes (Fig. 3). In contrast to the hypothalamic
tissue, we did not micro-dissect specific brainstem nuclei.
Therefore, we cannot completely exclude the possibility of
reciprocal gene responses, cancelling out any otherwise detectable
changes in mRNA expression within the different brainstem
substructures.
Circulating CARTp levels are reported to be elevated
in conditions of progressive cancer, and CART expression in
neuroendocrine tumors is associated with worse survival (28−30). An
interesting finding of the present study was that plasma
concentrations of CARTp were significantly higher in tumor-bearing
animals. In order to address whether the plasma CARTp was tumor- or
host-derived, we thus analyzed the possible presence of
Cartpt mRNA in MCG101 tumors. Cartpt was below the
limit of detection in the tumor samples (data not shown). Although
we cannot identify the originating tissue from which the CARTp was
released, we can say with certainty that the elevation in plasma
can be entirely attributed to a host response. While previous
studies have suggested CARTp as a candidate biomarker for cancer
(28–30), our current data supporting plasma
CARTp as a host response challenges the usefulness of CARTp as a
diagnostic biomarker for cancers. We further found plasma CARTp
levels to be correlated to plasma SAP levels (Fig. 5). This correlation is similar to our
own previous findings where lipopolysaccharide induced a robust
increase in plasma CARTp, which was also associated with the degree
of inflammation (data not shown). The physiological role for
circulating CARTp remains to be conclusively determined. Although
acutely administered doses of CARTp in the periphery do not appear
to influence feeding or gastric function (31–34),
the long-term chronic effects of circulating CARTp on food intake
or metabolism have yet to be elucidated.
In conclusion, Nucb2 mRNA was increased in
the PVN of MCG101 tumor-bearing mice compared to pair-fed mice,
which may suggest a role for hypothalamic nesfatin-1 in the
etiology of CACS. Cartpt expression- in the PVN and the
pituitary are also altered in response to CACS, but these changes
appear to be adaptive to reduced caloric intake rather than caused
by tumor-specific signals. The present findings in conjunction with
previous reports suggest that increased concentration of CARTp in
plasma is a peripheral host response to cancer anorexia-cachexia.
Since the levels of plasma CARTp correlate to plasma levels of SAP,
it is possible that the increase in circulating CART is driven by
tumor-induced inflammation.
Acknowledgments
Gene expression analyses were performed by the
Genomics Core Facility at the Sahlgrenska Academy, university of
Gothenburg. The present study was funded in part by the Byggmästare
Olle Engkvist Foundation, the Assar Gabrielsson Foundation, the
Hjalmar Svensson Foundation, the Wilhelm and Martina Lundgren
Science Fund, and the Sahlgrenska university Hospital (ALF/LUA
grants).
References
|
1
|
Bruera E: ABC of palliative care.
Anorexia, cachexia, and nutrition. BMJ. 315:1219–1222. 1997.
View Article : Google Scholar : PubMed/NCBI
|
|
2
|
Tisdale MJ: Cachexia in cancer patients.
Nat Rev Cancer. 2:862–871. 2002. View
Article : Google Scholar : PubMed/NCBI
|
|
3
|
Tisdale MJ: Cancer cachexia. Curr Opin
Gastroenterol. 26:146–151. 2010. View Article : Google Scholar
|
|
4
|
Fearon K, Strasser F, Anker SD, Bosaeus I,
Bruera E, Fainsinger RL, Jatoi A, Loprinzi C, MacDonald N,
Mantovani G, et al: Definition and classification of cancer
cachexia: An international consensus. Lancet Oncol. 12:489–495.
2011. View Article : Google Scholar : PubMed/NCBI
|
|
5
|
Konsman JP and Blomqvist A: Forebrain
patterns of c-Fos and FosB induction during cancer-associated
anorexia-cachexia in rat. Eur J Neurosci. 21:2752–2766. 2005.
View Article : Google Scholar : PubMed/NCBI
|
|
6
|
Ruud J and Blomqvist A: Identification of
rat brainstem neuronal structures activated during cancer-induced
anorexia. J Comp Neurol. 504:275–286. 2007. View Article : Google Scholar : PubMed/NCBI
|
|
7
|
Lonnroth C, Svaninger G, Gelin J, Cahlin
C, Iresjo B, Cvetkovska E, Edstrom S, Andersson M, Svanberg E and
Lundholm K: Effects related to indomethacin prolonged survival and
decreased tumor-growth in a mouse-tumor model with cytokine
dependent cancer cachexia. Int J Oncol. 7:1405–1413.
1995.PubMed/NCBI
|
|
8
|
Lundholm K, Karlberg I, Ekman L, Edström S
and Scherstén T: Evaluation of anorexia as the cause of altered
protein synthesis in skeletal muscles from nongrowing mice with
sarcoma. Cancer Res. 41:1989–1996. 1981.PubMed/NCBI
|
|
9
|
Cahlin C, Körner A, Axelsson H, Wang W,
Lundholm K and Svanberg E: Experimental cancer cachexia: The role
of hostderived cytokines interleukin (IL)-6, IL-12,
interferon-gamma, and tumor necrosis factor alpha evaluated in gene
knockout, tumor-bearing mice on C57 Bl background and
eicosanoid-dependent cachexia. Cancer Res. 60:5488–5493.
2000.PubMed/NCBI
|
|
10
|
Iresjö BM, Svanberg E and Lundholm K:
Reevaluation of amino acid stimulation of protein synthesis in
murine- and human-derived skeletal muscle cells assessed by
independent techniques. Am J Physiol Endocrinol Metab.
288:E1028–E1037. 2005. View Article : Google Scholar
|
|
11
|
Lin MT, Chu PC and Leu SY: Effects of TSH,
TRH, LH and LHRH on thermoregulation and food and water intake in
the rat. Neuroendocrinology. 37:206–211. 1983. View Article : Google Scholar : PubMed/NCBI
|
|
12
|
Kristensen P, Judge ME, Thim L, Ribel U,
Christjansen KN, Wulff BS, Clausen JT, Jensen PB, Madsen OD, Vrang
N, et al: Hypothalamic CART is a new anorectic peptide regulated by
leptin. Nature. 393:72–76. 1998. View
Article : Google Scholar : PubMed/NCBI
|
|
13
|
Grill HJ, Markison S, Ginsberg A and
Kaplan JM: Long-term effects on feeding and body weight after
stimulation of forebrain or hindbrain CRH receptors with urocortin.
Brain Res. 867:19–28. 2000. View Article : Google Scholar : PubMed/NCBI
|
|
14
|
Oh-I S, Shimizu H, Satoh T, Okada S,
Adachi S, Inoue K, Eguchi H, Yamamoto M, Imaki T, Hashimoto K, et
al: Identification of nesfatin-1 as a satiety molecule in the
hypothalamus. Nature. 443:709–712. 2006. View Article : Google Scholar : PubMed/NCBI
|
|
15
|
Bonnet MS, Djelloul M, Tillement V,
Tardivel C, Mounien L, Trouslard J, Troadec JD and Dallaporta M:
Central NUCB2/nesfatin-1-expressing neurones belong to the
hypothalamic-brain-stem circuitry activated by hypoglycaemia. J
Neuroendocrinol. 25:1–13. 2013. View Article : Google Scholar
|
|
16
|
Schnydrig S, Korner L, Landweer S, Ernst
B, Walker G, Otten U and Kunz D: Peripheral lipopolysaccharide
administration transiently affects expression of brain-derived
neurotrophic factor, corticotropin and proopiomelanocortin in mouse
brain. Neurosci Lett. 429:69–73. 2007. View Article : Google Scholar : PubMed/NCBI
|
|
17
|
Sergeyev V, Broberger C and Hökfelt T:
Effect of LPS administration on the expression of POMC, NPY,
galanin, CART and MCH mRNAs in the rat hypothalamus. Brain Res Mol
Brain Res. 90:93–100. 2001. View Article : Google Scholar : PubMed/NCBI
|
|
18
|
van Zeijl CJ, Surovtseva OV, Wiersinga WM,
Fliers E and Boelen A: Acute inflammation increases pituitary and
hypothalamic glycoprotein hormone subunit B5 mRNA expression in
association with decreased thyrotrophin receptor mRNA expression in
mice. J Neuroendocrinol. 23:310–319. 2011. View Article : Google Scholar : PubMed/NCBI
|
|
19
|
Aydin S: Multi-functional peptide hormone
NUCB2/nesfatin-1. Endocrine. 44:312–325. 2013. View Article : Google Scholar : PubMed/NCBI
|
|
20
|
Maejima Y, Shimomura K, Sakuma K, Yang Y,
Arai T, Mori M and Yada T: Paraventricular nucleus nesfatin-1
neurons are regulated by pituitary adenylate cyclase-activating
polypeptide (PACAP). Neurosci Lett. 551:39–42. 2013. View Article : Google Scholar : PubMed/NCBI
|
|
21
|
Cetinkaya H, Karagöz B, Bilgi O, Ozgün A,
Tunçel T, Emirzeoğlu L, Top C and Kandemir EG: Nesfatin-1 in
advanced lung cancer patients with weight loss. Regul Pept.
181:1–3. 2013. View Article : Google Scholar
|
|
22
|
Kohno D, Nakata M, Maejima Y, Shimizu H,
Sedbazar U, Yoshida N, Dezaki K, Onaka T, Mori M and Yada T:
Nesfatin-1 neurons in paraventricular and supraoptic nuclei of the
rat hypothalamus coexpress oxytocin and vasopressin and are
activated by refeeding. Endocrinology. 149:1295–1301. 2008.
View Article : Google Scholar
|
|
23
|
Hashimoto H, Azuma Y, Kawasaki M, Fujihara
H, Onuma E, Yamada-Okabe H, Takuwa Y, Ogata E and Ueta Y:
Parathyroid hormone-related protein induces cachectic syndromes
without directly modulating the expression of hypothalamic
feeding-regulating peptides. Clin Cancer Res. 13:292–298. 2007.
View Article : Google Scholar : PubMed/NCBI
|
|
24
|
de Rijke CE, Hillebrand JJ, Verhagen LA,
Roeling TA and Adan RA: Hypothalamic neuropeptide expression
following chronic food restriction in sedentary and wheel-running
rats. J Mol Endocrinol. 35:381–390. 2005. View Article : Google Scholar : PubMed/NCBI
|
|
25
|
Nakhate KT, Kokare DM, Singru PS, Taksande
AG, Kotwal SD and Subhedar NK: Hypothalamic cocaine- and
amphetamine-regulated transcript peptide is reduced and fails to
modulate feeding behavior in rats with chemically-induced mammary
carcinogenesis. Pharmacol Biochem Behav. 97:340–349. 2010.
View Article : Google Scholar : PubMed/NCBI
|
|
26
|
Persson H, Bennegård K, Lundberg PA,
Svaninger G and Lundholm K: Thyroid hormones in conditions of
chronic malnutrition. A study with special reference to cancer
cachexia. Ann Surg. 201:45–52. 1985.PubMed/NCBI
|
|
27
|
Svaninger G, Lundberg PA and Lundholm K:
Thyroid hormones and experimental cancer cachexia. J Natl Cancer
Inst. 77:555–561. 1986.PubMed/NCBI
|
|
28
|
Bech P, Winstanley V, Murphy KG, Sam AH,
Meeran K, Ghatei MA and Bloom SR: Elevated cocaine- and
amphetamine-regulated transcript immunoreactivity in the
circulation of patients with neuroendocrine malignancy. J Clin
Endocrinol Metab. 93:1246–1253. 2008. View Article : Google Scholar : PubMed/NCBI
|
|
29
|
Landerholm K, Falkmer SE, Järhult J,
Sundler F and Wierup N: Cocaine- and amphetamine-regulated
transcript in neuroendocrine tumors. Neuroendocrinology.
94:228–236. 2011. View Article : Google Scholar : PubMed/NCBI
|
|
30
|
Landerholm K, Shcherbina L, Falkmer SE,
Jarhult J and Wierup N: Expression of cocaine- and
amphetamine-regulated transcript is associated with worse survival
in small bowel carcinoid tumors. Clin Cancer Res. 18:3668–3676.
2012. View Article : Google Scholar : PubMed/NCBI
|
|
31
|
Jensen PB, Kristensen P, Clausen JT, Judge
ME, Hastrup S, Thim L, Wulff BS, Foged C, Jensen J, Holst JJ, et
al: The hypothalamic satiety peptide CART is expressed in anorectic
and non-anorectic pancreatic islet tumors and in the normal islet
of Langerhans. FEBS Lett. 447:139–143. 1999. View Article : Google Scholar : PubMed/NCBI
|
|
32
|
Okumura T, Yamada H, Motomura W and Kohgo
Y: Cocaineamphetamine-regulated transcript (CART) acts in the
central nervous system to inhibit gastric acid secretion via brain
corticotropin-releasing factor system. Endocrinology.
141:2854–2860. 2000.PubMed/NCBI
|
|
33
|
Skibicka KP, Alhadeff AL and Grill HJ:
Hindbrain cocaine-and amphetamine-regulated transcript induces
hypothermia mediated by GLP-1 receptors. J Neurosci. 29:6973–6981.
2009. View Article : Google Scholar : PubMed/NCBI
|
|
34
|
Tebbe JJ, Ortmann E, Schumacher K,
Mönnikes H, Kobelt P, Arnold R and Schäfer MK: Cocaine- and
amphetamine-regulated transcript stimulates colonic motility via
central CRF receptor activation and peripheral cholinergic pathways
in fed, conscious rats. Neurogastroenterol Motil. 16:489–496. 2004.
View Article : Google Scholar : PubMed/NCBI
|