Introduction
Colorectal cancer (CRC) ranks as the third most
prevalent cancer in men and second in women. In 2012 alone,
~1,361,000 CRC diagnoses were made, with 694,000 deaths worldwide.
Due to the asymptomatic nature of CRC in the early stages of the
disease, the majority of CRC-related deaths are due to distant
organ metastases and recurrence (1). Unfortunately, the lack of more
reliable biomarkers for early CRC detection further contributes to
increased mortality rates. Over the past few decades, CRC
investigators have been dedicated to studying the genetic mutations
particularly protein-coding genes, such as APC (2), DNA mismatch repair genes (3) and AXIN (4). To date, since CRC is a
multi-factorial, multi-step disease, the molecular mechanisms
underlying pathogenesis and progression are yet to be completely
elucidated. To further understand this disease, we need to break
away from traditional views and adopt a fresh perspective, in which
case, long non-coding RNAs (lncRNAs) have attracted increased
attention in recent years.
lncRNAs are a new class of non-coding RNAs which are
longer than 200 nucleotides and lack protein-coding potential
(5), and were once thought to be
non-functional. However, a growing body of evidence indicates that
lncRNAs play important roles in many aspects of cell activity.
Indeed, lncRNAs are involved in almost all aspects of gene
regulation, including chromosome dosage compensation, control of
imprinting, epigenetic regulation, nuclear and cytoplasmic
trafficking, transcription, mRNA splicing and translation (6). As a direct result of such biological
functions, lncRNAs participate in cell differentiation,
proliferation, growth, apoptosis, maintenance of pluripotency, and
invasion and metastasis of tumor cells (7,8).
Several lncRNAs have been reported to be abnormally expressed in
CRC; and not only were they involved in tumor progression, but were
also considered potential candidate biomarkers for prognosis and
staging of CRC. For instance, colon cancer-associated transcript 1
(CCAT1) was found to be overexpressed in CRC, and its upregulation
was also correlated with clinical stage, metastasis and patient
survival time (9). HOX antisense
intergenic RNA (HOTAIR) was found to have a significant effect on
CRC cell migration and invasion, but not proliferation; it played a
crucial role in cancer development and was considered as an
effective predictor for poor prognosis (10).
Since the lncRNA expression profile in CRC is not
yet completely understood, herein, we aimed to identify lncRNAs
that are differentially expressed in CRC. We performed micro-array
analysis to assess the expression profiles of lncRNAs in colorectal
cancer tissues and matched adjacent normal samples. Bioinformatics
analysis was subsequently used for functional annotation of the
differentially expressed lncRNAs. Our findings demonstrated that
lncRNAs were differentially expressed between CRC tissues and
normal tissues, and the aberrant expression of lncRNAs may
contribute to colon carcinogenesis.
Materials and methods
Patient samples
Samples from 5 colon adenocarcinoma patients
including tumor and paired non-cancerous tissues were collected and
immediately cryo-preserved in liquid nitrogen following surgery at
The Sanming First Hospital Affiliated to Fujian Medical University
from October 2014 to November 2014. All diagnoses of colon
adenocarcinoma were confirmed by pathology, and the non-cancerous
samples were obtained 5 cm away from the edge of the tumor and were
free of tumor cells, as evaluated by a pathologist. Tumor stage was
evaluated based on the tumor-node-metastasis (TNM) staging system
of the International Union against Cancer (Table I). At the time of the study, no
patient had received chemotherapy, radiotherapy or other
preoperative treatments. The study procedures were reviewed and
approved by the Ethics Committees of the Sanming First Hospital
Affiliated to Fujian Medical University [permit number: 2013(96)].
Informed written consent was obtained from all of the subjects.
 | Table IClinical parameters of the 4 colon
adenocarcinoma patients. |
Table I
Clinical parameters of the 4 colon
adenocarcinoma patients.
| Specimen no. | Gender | Age (years) | Histology | Histologic
differentiation | TNM stage |
|---|
| No. 1 | Male | 69 | Ulcerative | Moderate | T2N1M0 |
| No. 2a | Male | 43 | Ulcerative | Moderate | T4bN1bM0 |
| No. 3 | Female | 57 | Ulcerative | Well-Moderate | T4aN0M0 |
| No. 4 | Female | 61 | Ulcerative | Well-Moderate | T4aN0M0 |
| No. 5 | Male | 61 | Ulcerative | Moderate | T4aN2M0 |
RNA isolation
Total RNA from all 8 samples were extracted using
TRIzol reagent (Invitrogen Life Technologies) following the
manufacturer's protocol. RNA quantity and quality were assessed by
a NanoDrop ND-1000 spectrometer (NanoDrop Technologies), and RNA
integrity was evaluated by standard denaturing agarose gel
electrophoresis methods.
Microarray
Arraystar Human LncRNA Microarray V3.0, which is
designed for the global profiling of human lncRNAs and
protein-coding transcripts, was used in this study. Microarray V3.0
was updated from the previous V2.0, and approximately 30,586
lncRNAs and 26,109 coding transcripts can be detected by this
third-generation lncRNA microarray. All the sequences were
collected from authoritative data sources, such as National Center
for Biotechnology Information (NCBI) RefSeq, University of
California-Santa Cruz (UCSC), Ultra Conserved Regions (UCRs), and
related literature. Each transcript is represented by a specific
exon or splice junction probe which can accurately distinguish
between individual transcripts. The microarray hybridization and
bio-information analysis was performed by KangChen Bio-tech
(Shanghai, China).
RNA labeling and array hybridization
Sample labeling and array hybridization were
performed according to the Agilent One-Color Microarray-Based Gene
Expression Analysis protocol (Agilent Technologies) with minor
modifications. Briefly, mRNA was purified from total RNA using
mRNA-ONLY Eukaryotic mRNA isolation kit (Epicentre) after removal
of rRNA. Subsequently, each specimen was magnified and transcribed
into fluorescent cRNA along the entire length of the transcripts
without 3′ bias using Arraystar Flash RNA labeling kit (Arraystar),
which is a random priming method. The labeled cRNAs were depurated
using the RNeasy Mini kit (Qiagen). The concentration and specific
activity of the labeled cRNAs (pmol Cy3/µg cRNA) were
measured by NanoDrop ND-1000 (NanoDrop Technologies). One microgram
of each labeled cRNA was fragmented by adding 5 µl 10X
blocking agents and 1 µl 25X fragmentation buffer, and the
mixture was heated at 60°C for 30 min. Next, 25 µl 2X GE
hybridization buffer was added to dilute the labeled cRNA. Fifty
microliters of hybridization solutions was dispensed into the
gasket slide and assembled to the lncRNA expression microarray
slide. The slides were incubated for 17 h at 65°C in an Agilent
hybridization oven. The hybridized arrays were washed, fixed, and
scanned using an Agilent DNA Microarray scanner (part number
G2505C).
Data analysis
Acquired array images were analyzed using Agilent
Feature Extraction software (version 11.0.1.1). Quantile
standardization and subsequent data processing were performed by
GeneSpring GX v12.1 software package (Agilent Technologies).
Differentially expressed lncRNAs and mRNAs with statistical
significance between the two groups were identified through
p-value/FDR filtering and fold change filtering (fold change ≥2.0).
Hierarchical clustering and combined analysis were performed using
homemade scripts.
Co-expression network
Gene co-expression networks were built according to
the normalized signal intensity of specifically expressed genes.
The network construction procedures included the following: i)
Preprocess data: the same mRNAs with different transcripts taking
the median value represent the gene expression values, without
special treatment of the lncRNA expression value; ii) screen data:
remove the subset of data according to the lists showing the
differential expression of lncRNAs and mRNAs; iii) calculate the
Pearson's correlation coefficient and use R-value to calculate the
correlation coefficient between lncRNAs and mRNAs; and iv) screen
by Pearson's correlation coefficient: select the Pearson's
correlation coefficient greater than 0.98 as the meaningful value
and draw the lncRNA/mRNA co-expression network by using the
Cytoscape program. To make a visual representation, only the
strongest correlations (≥0.9994 for DKK4, MMP7, SFRP4 and WIF1;
≥0.994 for MYC, CTNNB1 and PLCB4; ≥0.9975 for SFRP2 and WNT11;
≥0.98 for LEF1) were included in these renderings.
Quantitative real-time PCR (qRT-PCR)
Total RNA was extracted using TRIzol reagent
(Invitrogen) according to the manufacture's protocol. The first
strand cDNA was synthesized using SuperScript™ III First Strand
kits (Invitrogen). GAPDH was used as an internal control. The
difference in expression of lncRNA was calculated using the
2−ΔCt method described by Schmittgen and Livak (11). Primers used in this study are listed
in Table II.
| Table IIPrimers used in qRT-PCR. |
Table II
Primers used in qRT-PCR.
| Seqname | Primers |
|---|
| GAPDH | F:
5′-GGGAAACTGTGGCGTGAT-3′; | R:
5′-GAGTGGGTGTCGCTGTTGA-3′ |
| NR_045617 | F:
5′-GGATGAGGAGAAGAAGCCAA-3′; | R:
5′-TGATGCGTCATTACCACTTTG-3′ |
| uc002ywy.3 | F:
5′-TTACATAGGTGTCCAGCCATC-3′; | R:
5′-GCAACTGAAGGGGCAATCT-3′ |
| uc003dtq.3 | F:
5′-GAAAAGCAAAGGCATAGAAGG-3′; | R:
5′-CACACAATGAGGTTTTTCCCA-3′ |
|
ENST00000502076 | F:
5′-GGCTAAATGCCTGCTACACA-3′; R: |
5′-TGGGCGACAGAACAGACTC-3′ |
| NR_037661 | F:
5′-AGTGCAGGTGGAAACCATCTC-3′; | R:
5′-GAGACCGCTGTACTGTCACC-3′ |
|
ENST00000440498 | F:
5′-CCGCTTGCTGAGTCTTTCT-3′; | R:
5′-GAGGTCCTAAGTCAGGGTCG-3′ |
|
ENST00000552364 | F:
5′-TTGGTGTGTTTCAGGTCATCC-3′; | R:
5′-CAGTGTTCTTGCTTTGGTTCC-3′ |
Statistical analysis
Statistical analysis was performed using SPSS 17.0
software package. Significant differential expression levels of
lncRNAs or mRNAs were analyzed by Student's t-test and FDR
filtering was used for comparative analysis. The p-value ≤0.0.5
(two-tailed) and fold change ≥2.0 were considered statistically
significant.
Results
Overview of the microarray data
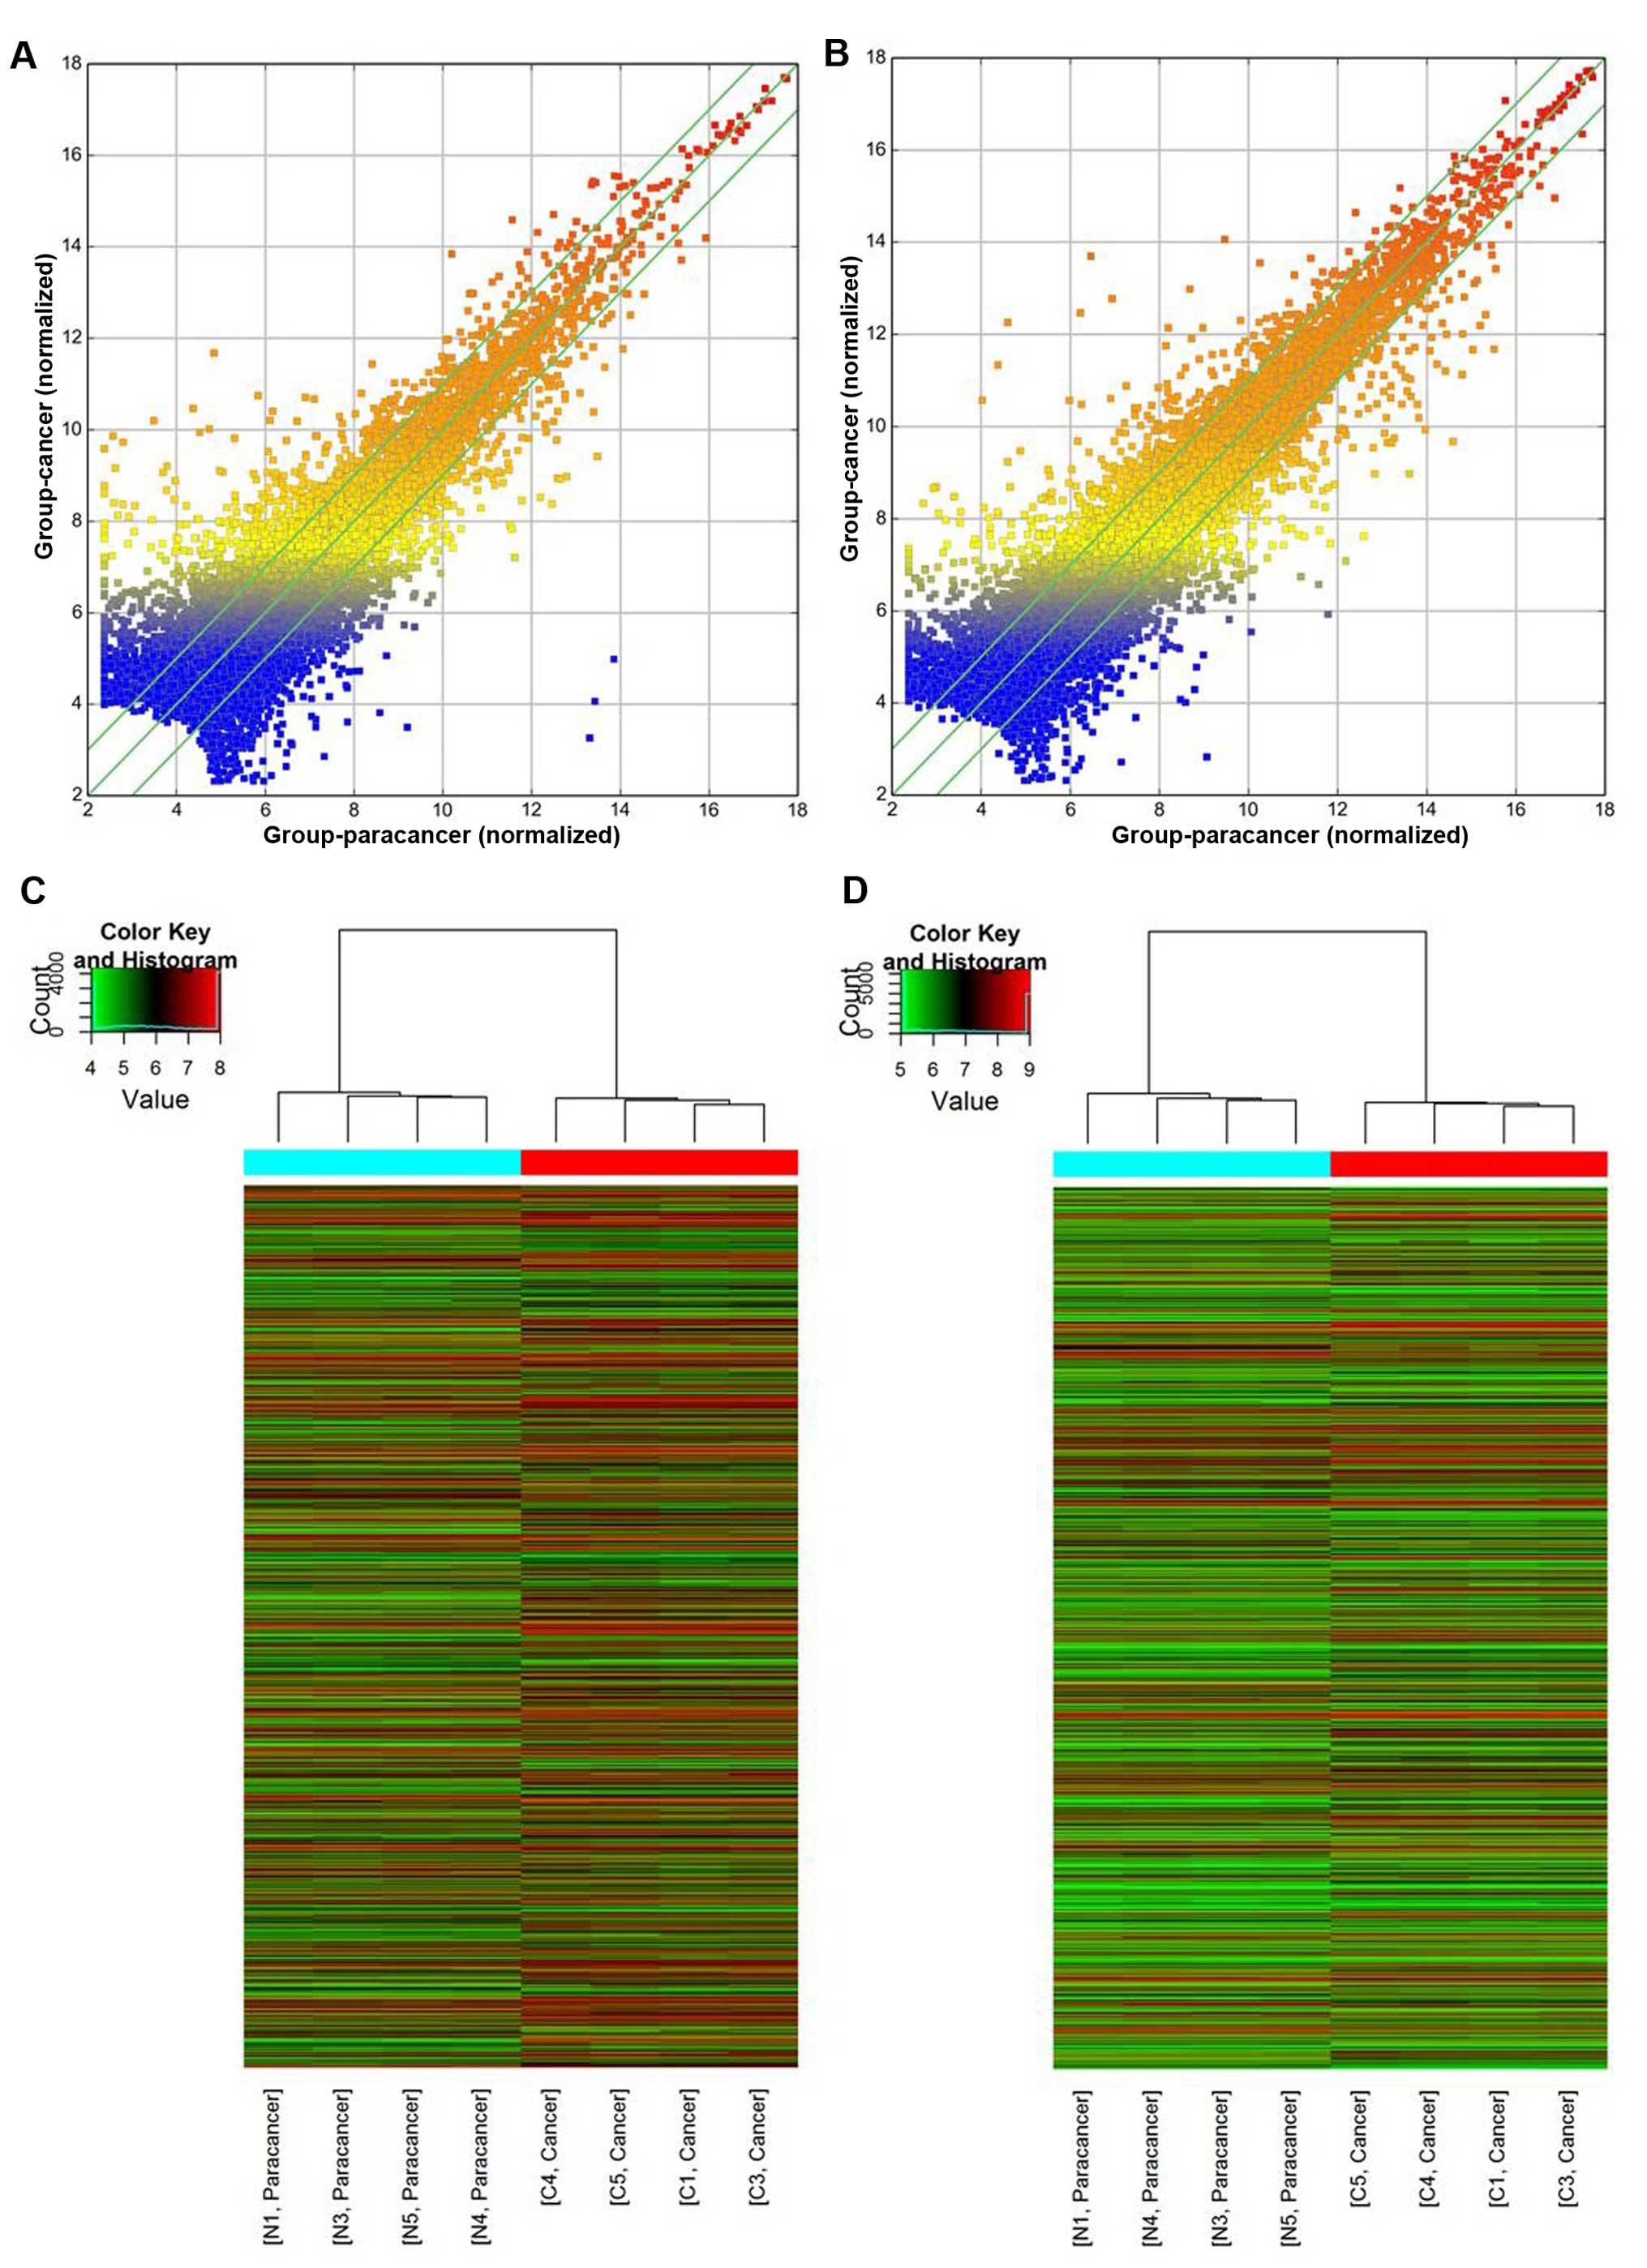
To distinguish the abnormality of lncRNAs in CRC, we
contrasted the expression profile between CRC tissues and adjacent
non-cancerous tissues from 4 colon adenocarcinoma patients
(Fig. 1). Microarray data showed
that a total of 3,523 lncRNAs and 2,515 mRNAs were consistently
differentially expressed in the CRC tissues in comparison to the
non-cancerous tissues. Among them, 1,989 lncRNAs were upregulated
with 1,534 lncRNAs downregulated and 1,471 mRNAs were upregulated
with 1,044 mRNAs downregulated (see additional file 1 and 2; http
addresses are shown in Fig. 1
legend). The top 15 upregulated and top 15 downregulated lncRNAs
and mRNAs are listed in Tables
III and IV. Furthermore, 156
lncRNAs (108 upregulated and 48 downregulated) and 99 mRNAs (60
upregulated and 39 downregulated) were highly differentially
expressed with an absolute fold change >10 [see additional file
1 and 2].
| Table IIIThe top 15 differentially expressed
lncRNAs [cancer (C) vs. normal (N)]. |
Table III
The top 15 differentially expressed
lncRNAs [cancer (C) vs. normal (N)].
Upregulated lncRNAs
| Downregulated
lncRNAs
|
|---|
| Seqname | Fold change
(C/N) | Seqname | Fold change
(C/N) |
|---|
| TCONS_00022031 | 157.90 |
ENST00000434839 | 1049.22 |
| AA558434 | 149.01 |
ENST00000421322 | 651.81 |
|
ENST00000438158 | 122.61 | uc004ebm.1 | 463.49 |
|
ENST00000447898 | 114.53 | uc002yjs.3 | 51.76 |
|
ENST00000559321 | 105.64 |
ENST00000548051 | 26.97 |
| uc002zku.3 | 93.45 | TCONS_00020621 | 22.01 |
| NR_034119 | 85.35 | TCONS_00003800 | 21.17 |
| NR_051996 | 75.45 |
ENST00000483245 | 18.81 |
| NR_051996 | 75.45 |
ENST00000572964 | 16.82 |
| NR_036484 | 68.59 |
ENST00000497872 | 16.60 |
| NR_036484 | 68.59 | TCONS_00003799 | 14.12 |
|
ENST00000529081 | 56.37 | TCONS_00019318 | 13.91 |
|
ENST00000504989 | 48.23 | NR_047535 | 13.18 |
|
ENST00000426240 | 48.03 | NR_047535 | 13.18 |
| NR_046711 | 43.91 | NR_047538 | 13.17 |
| Table IVThe top 15 differentially expressed
mRNAs [cancer (C) vs. normal (N)]. |
Table IV
The top 15 differentially expressed
mRNAs [cancer (C) vs. normal (N)].
Upregulated mRNAs
| Downregulated mRNAs
|
|---|
| Seqname | Fold change
(C/N) | Seqname | Fold change
(C/N) |
|---|
| NM_015515 | 203.83 | NM_001048 | 74.70 |
| NM_033260 | 151.46 |
ENST00000372581 | 57.54 |
| NM_019844 | 125.16 | NM_005478 | 34.00 |
|
ENST00000375825 | 93.85 | NM_005396 | 31.79 |
| NM_002423 | 76.24 |
ENST00000328886 | 30.99 |
| NM_015424 | 57.47 | NM_002054 | 29.88 |
| NM_001445 | 53.51 | NM_033553 | 24.69 |
| NM_003247 | 52.28 | NM_016602 | 23.57 |
|
ENST00000304749 | 49.95 |
ENST00000399889 | 22.68 |
| NM_002422 | 34.13 |
ENST00000425175 | 22.46 |
| NM_205841 | 33.74 | NM_000717 | 21.43 |
| NM_170736 | 31.58 |
ENST00000432364 | 21.29 |
| NM_153488 | 29.34 | NM_001159710 | 20.88 |
| NM_003014 | 28.57 | NM_002196 | 20.54 |
| NM_001012512 | 27.97 | NM_030667 | 16.52 |
Gene Ontology (GO) analysis
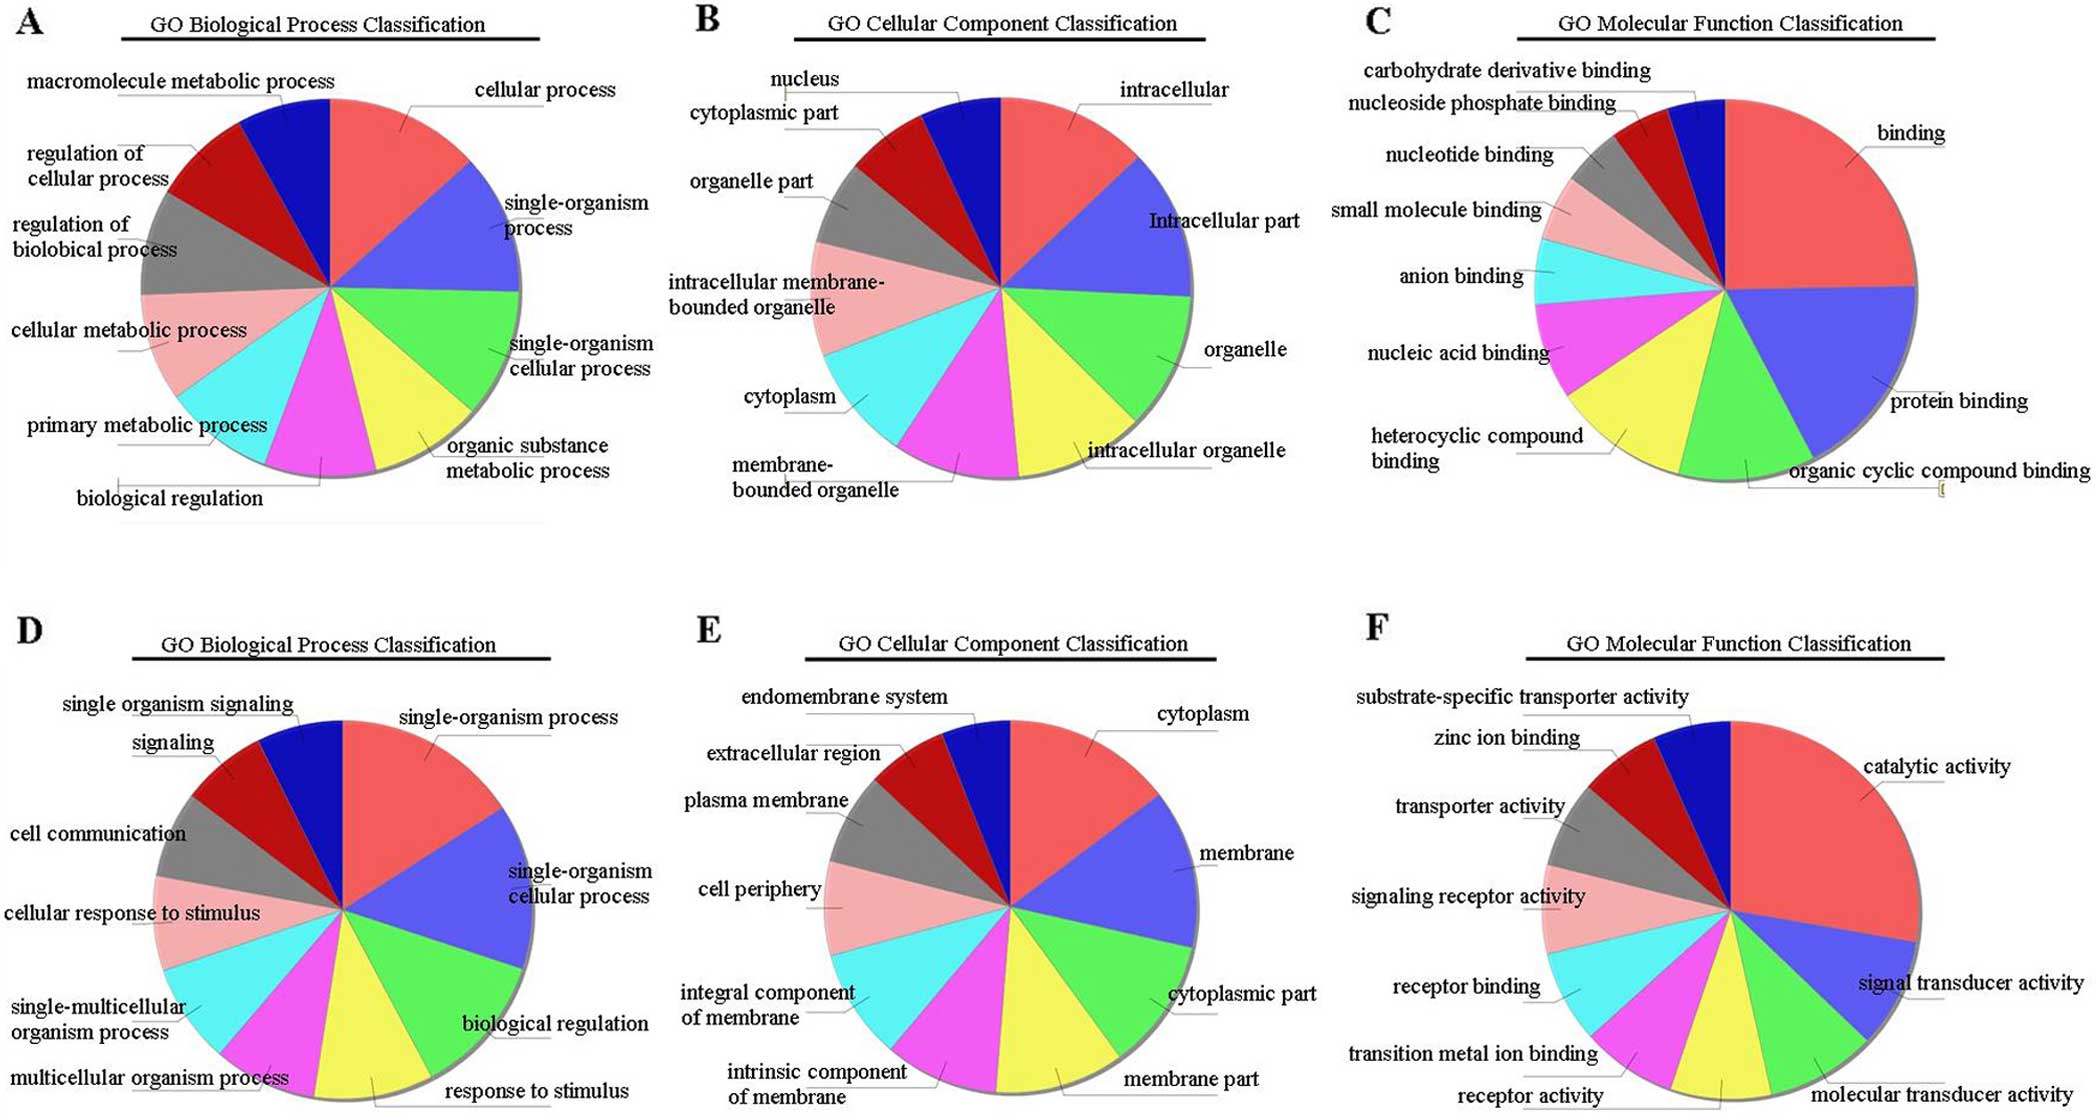
To deduce the function of differentially expressed
lncRNAs and mRNA transcripts, GO analysis was used. GO enrichment
analysis annotated the biological processes, cellular components
and molecular functions of the transcripts (12). P-value assessment was performed to
estimate the significance of GO term enrichment in the
differentially expressed lncRNAs and mRNAs; a lower p-value
indicated that the GO term was more significant than a higher value
(p-value ≤0.05 was considered to be statistically significant). Our
data showed that the most enriched GO terms were DNA metabolic
processes (Fig. 2A),
non-membrane-bound organelles (Fig.
2B) and protein binding (Fig.
2C) in upregulated transcripts (GO: 0006259 under biological
process, p=4.71932E-11; GO: 0043228 under cellular components,
p=7.26282E-14 and GO: 0005515 under molecular function,
p=1.36123E-10, respectively). In downregulated transcripts, the
most enriched GO terms were organic hydroxyl compound metabolic
processes (Fig. 2D), extracellular
regions (Fig. 2E) and steroid
binding (Fig. 2F) (GO: 1901615
under biological processes, p=2.57819E-10; GO: 0005576 under
cellular components, p=8.92426E-08 and GO: 0005496 under molecular
function, p=1.19953E-05, respectively).
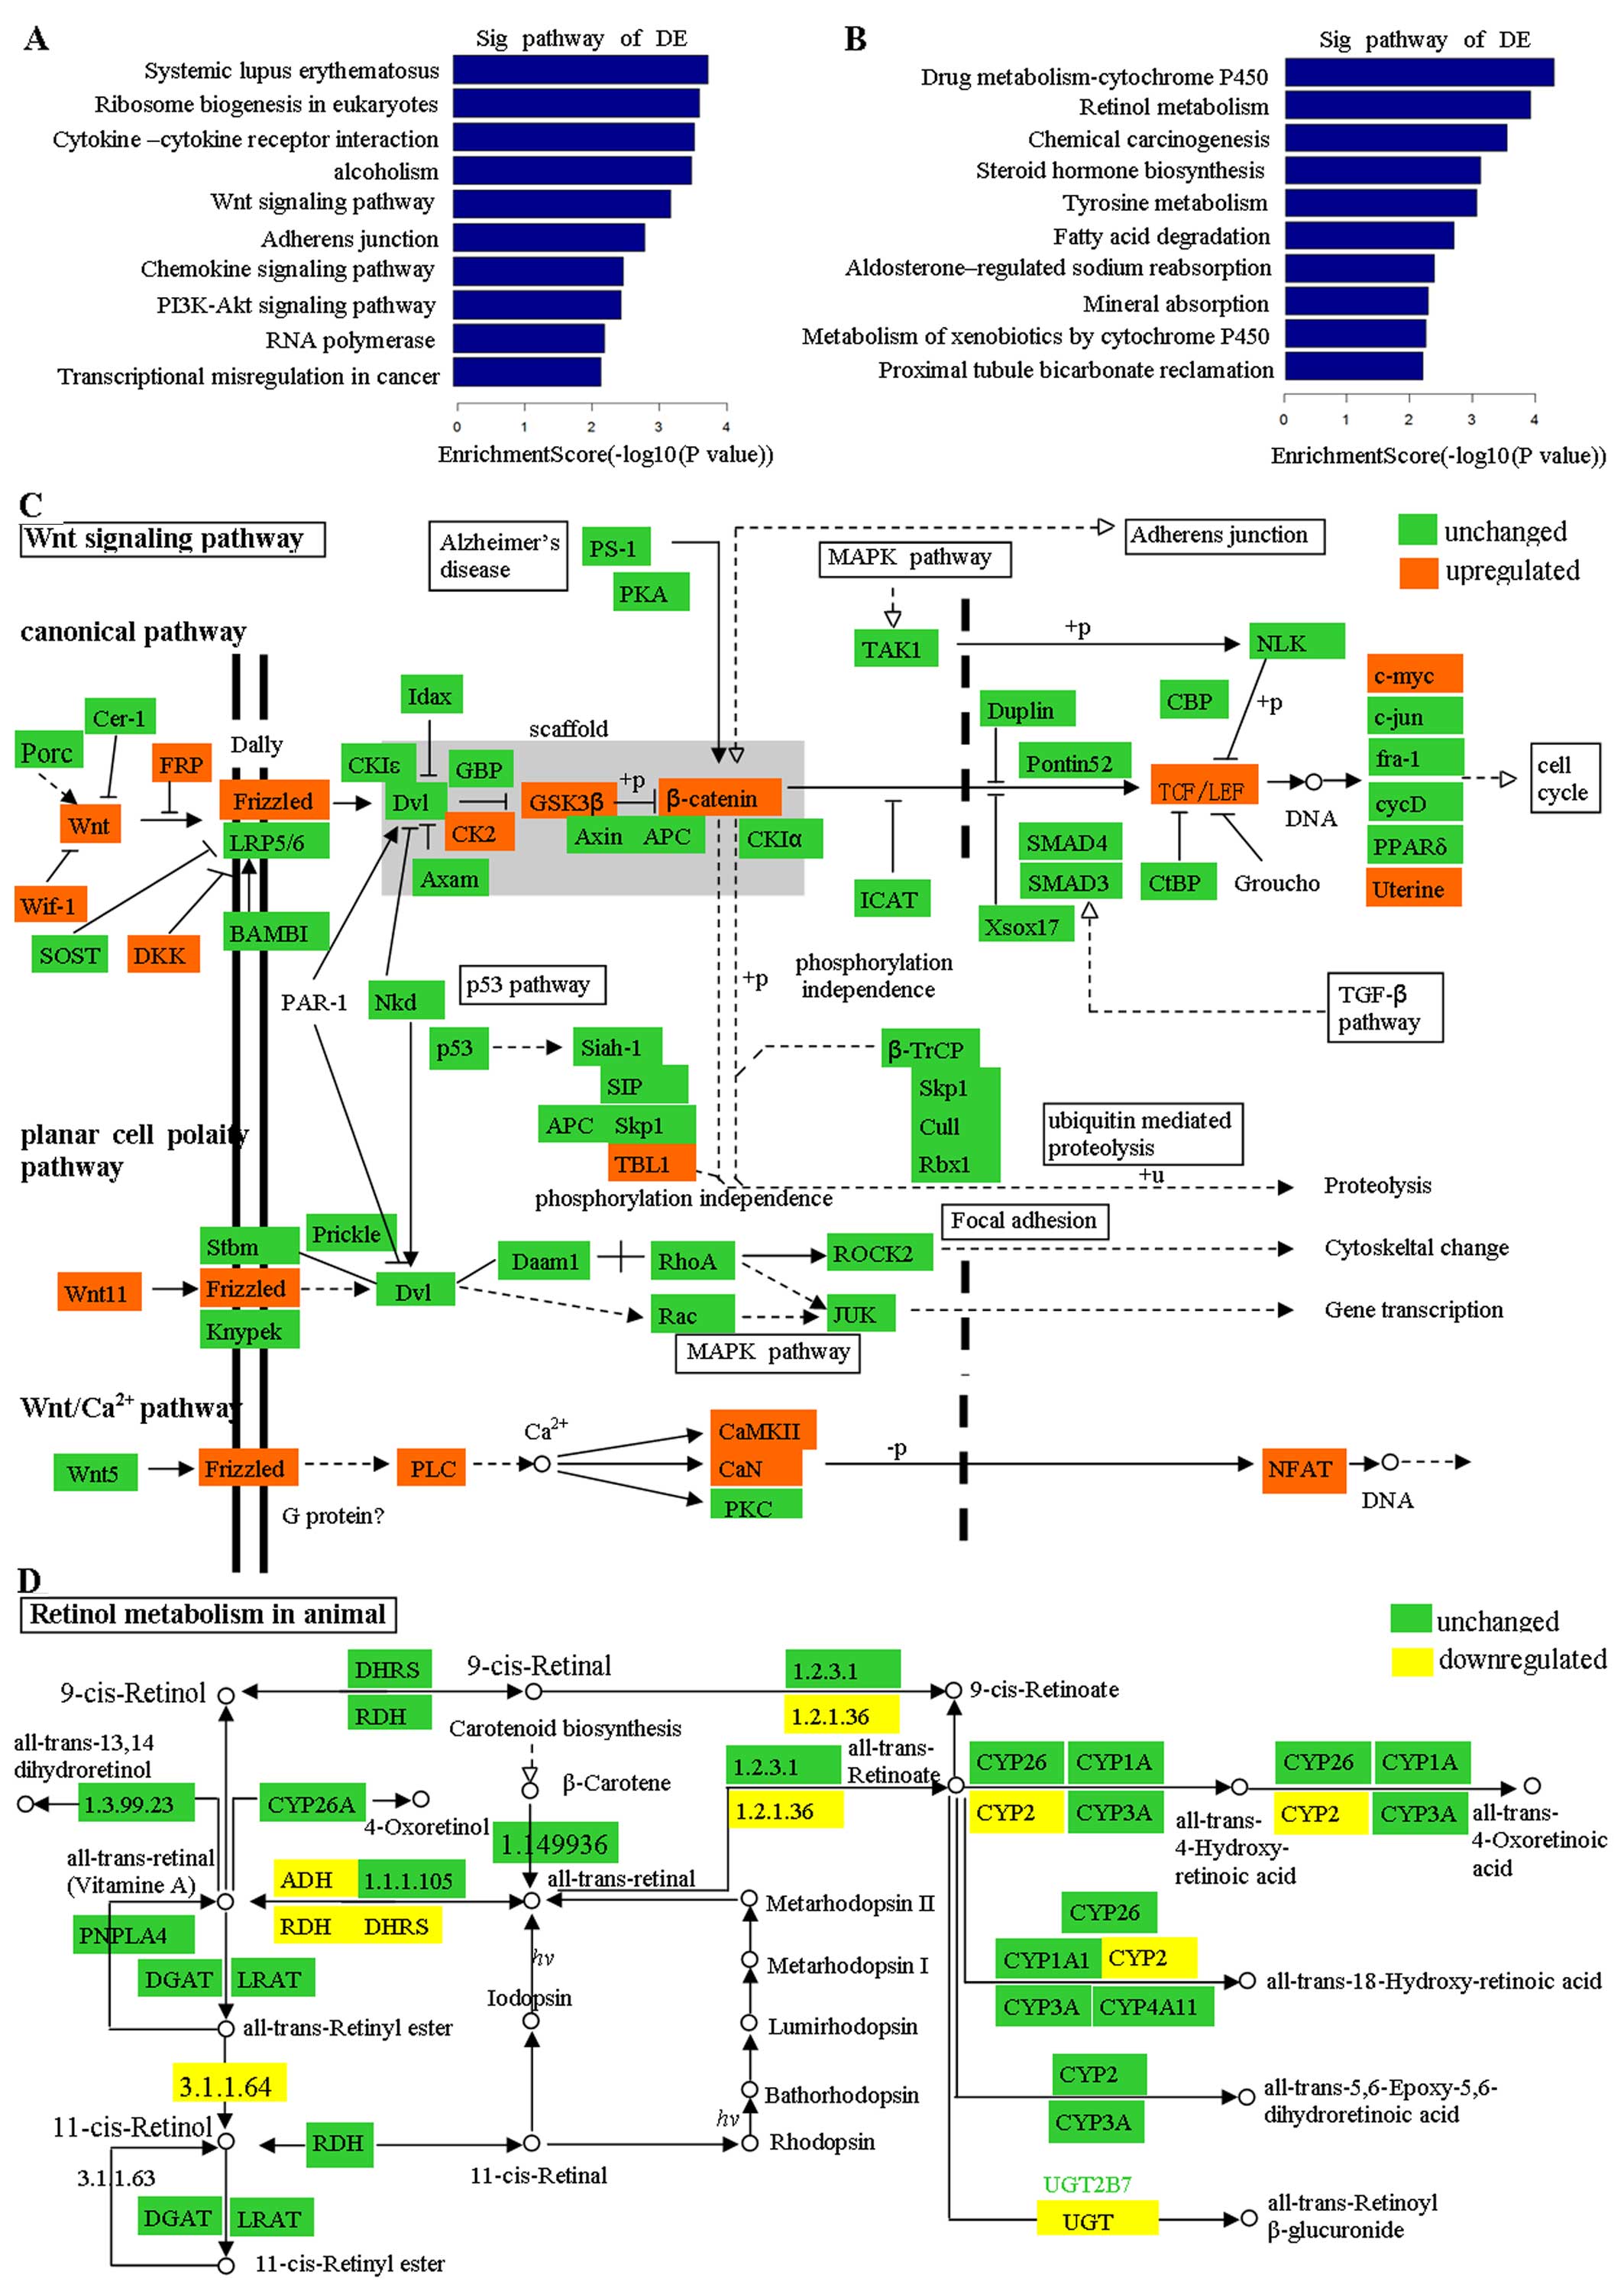
KEGG pathway analysis
KEGG pathway analysis indicated that 22 pathways
were related to the upregulated transcripts, with the most enriched
pathway identified as hsa05322 (Systemic lupus
erythematosus-Homo sapiens) (Fig. 3A), and 22 transcripts were
associated with this pathway [see additional file 3, http address
shown in Fig. 3A legend]. Moreover,
24 pathways correlated with the downregulated transcripts, with the
most enriched pathway being hsa00982 (Drug metabolism-cytochrome
P450-Homo sapiens) (Fig.
3B), and 13 transcripts were associated with this pathway [see
additional file 4, http address shown in Fig. 3B legend). Among the top 10
upregulated pathways, the deregulation of the 'Wnt signaling
pathway' was previously identified as a crucial initiation step of
colorectal cancer (13), and was
reported to be correlated with prognosis in CRC patients (14) (Fig.
3C). The gene category 'lupus erythematosus' has been proven to
be associated with several types of cancer, including non-Hodgkin's
lymphoma, leukemia, vulva, thyroid, lung, and possibly liver
cancers (15). Moreover, the gene
categories 'chemokine signaling pathway' (14) and 'PI3K-Akt signaling pathway'
(16) have been shown to be
associated with CRC. Among the top 10 downregulated pathways, the
gene category 'Retinol metabolism' has been reported to be involved
in colorectal cancer metastatic multiplicity and the gene category
'Steroid hormone biosynthesis' was found to play important roles in
reducing the risk of CRC in many research studies (17) (Fig.
3D).
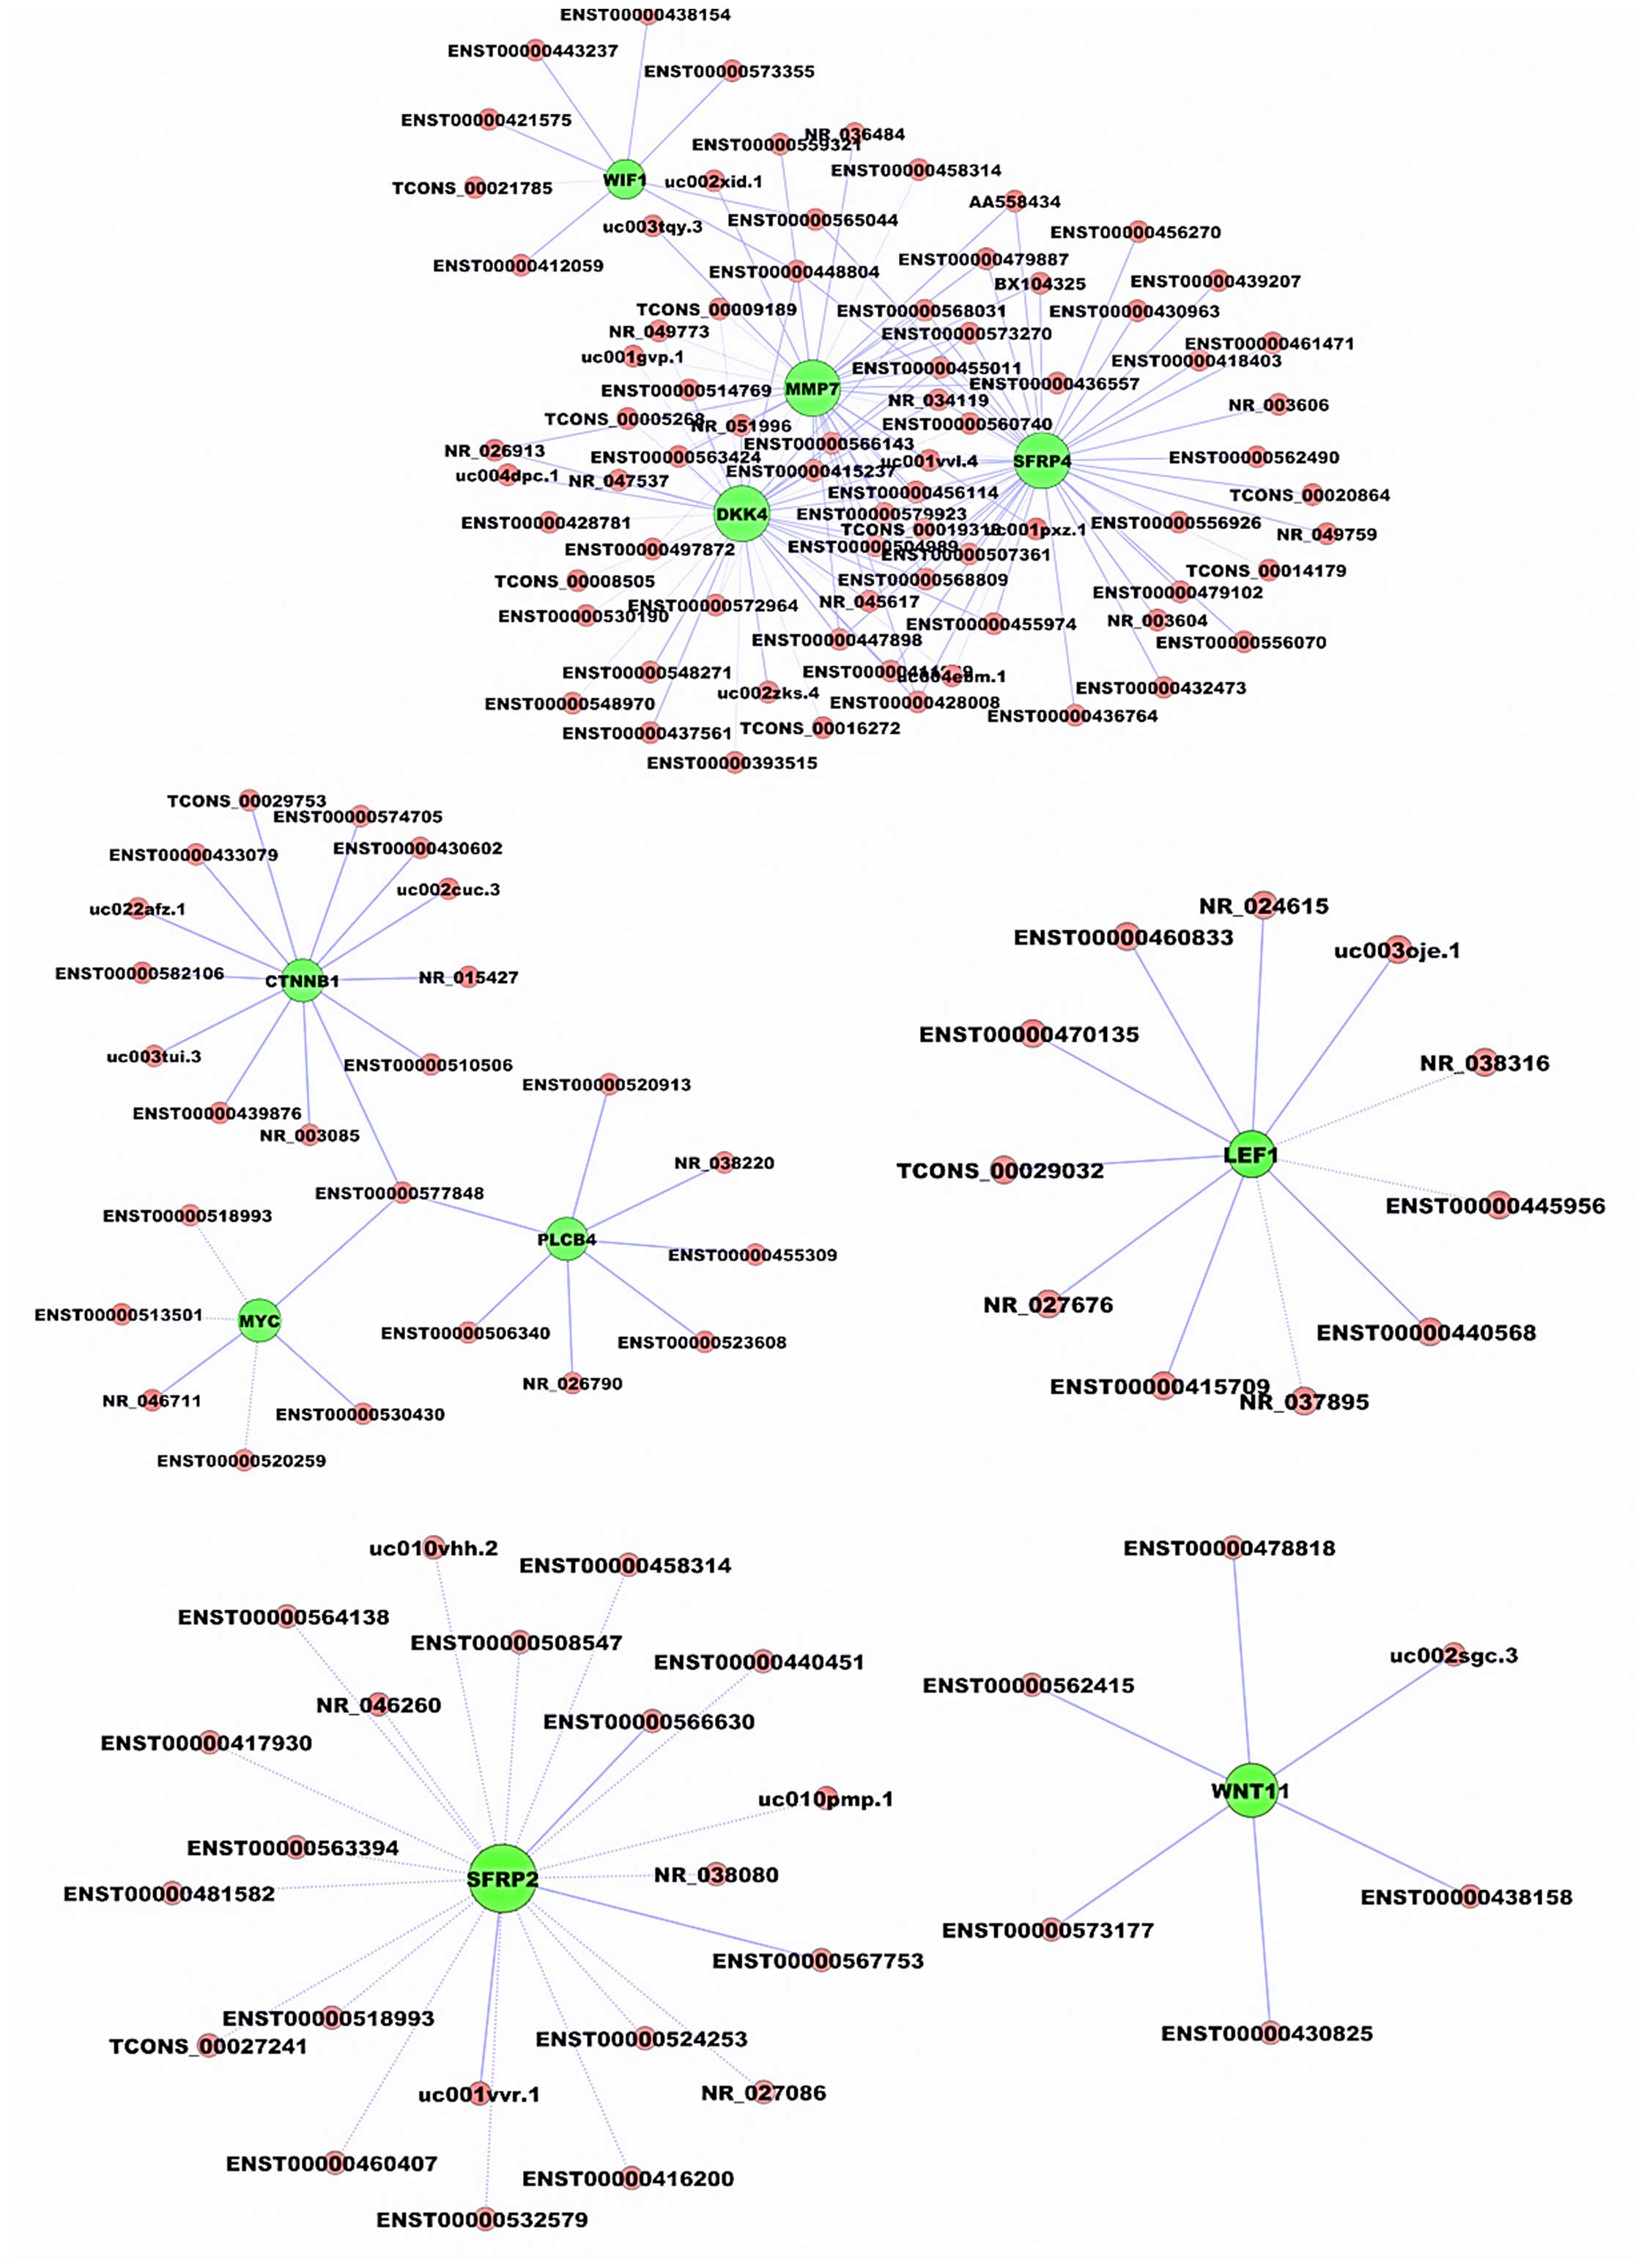
Coding-non-coding gene co-expression
network construction
As mentioned above, the 'Wnt signaling pathway' was
upregulated in CRC tissues compared to non-cancerous tissues.
Therefore, we aimed to ascertain whether these differentially
expressed Wnt signaling pathway components were correlated with
these differentially expressed lncRNAs. To explore this problem,
coding-non-coding gene co-expression network (CNC network) was
constructed between the top 10 differentially expressed 'Wnt
signaling pathway' genes and all differentially expressed lncRNAs.
We found that the co-expression network was composed of 1,468 nodes
and 9,940 connections between 1,458 lncRNAs and 10 coding genes,
including 6,004 positively correlated and 3,936 negatively
correlated lncRNA-mRNA pairs in the cancer/para-cancer groups [see
additional file 5, http address is shown in Fig. 4 legend). These results suggested
that the expression of Wnt signaling pathway genes correlated
closely with lncRNAs in CRC, and that a possible functional
correlation existed between these lncRNAs and Wnt signaling pathway
genes in CRC. The representative co-expression networks are shown
in Fig. 4.
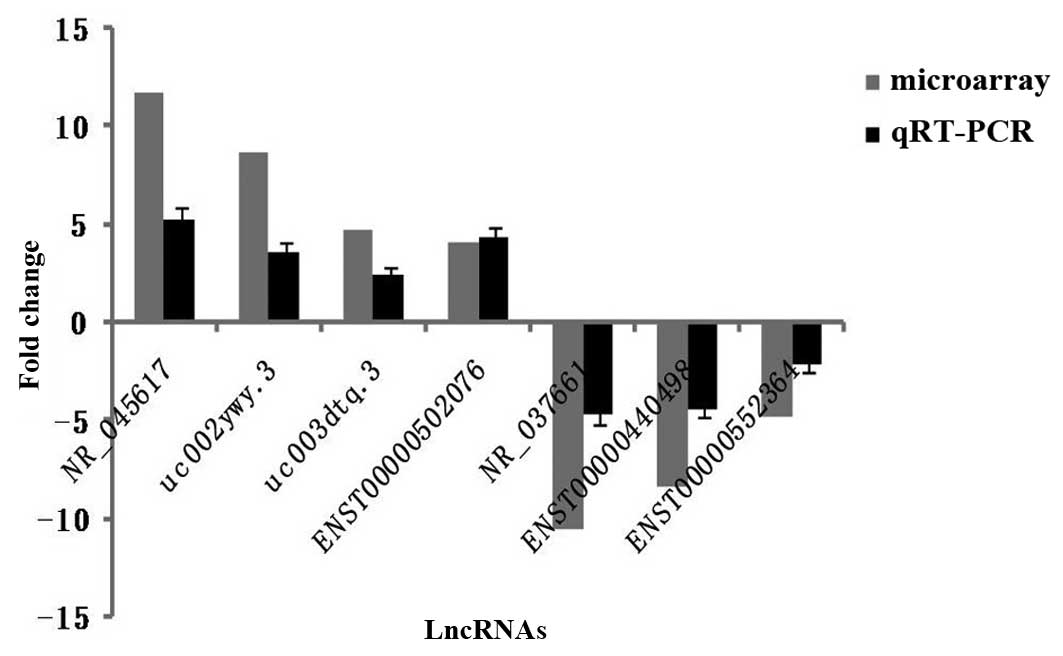
qRT-PCR validation
To verify the microarray results, we randomly
selected 4 upregulated lncRNAs and 3 downregulated lncRNAs from the
differentially expressed lncRNAs in the microarray (Table II). qRT-PCR method was used to
confirm the expression levels of the selected lncRNAs in the CRC
tissues and paired adjacent normal tissues used in the microarray
test. As shown in Fig. 5, despite
the fact that the fold change of each selected lncRNA in the
qRT-PCR test was not in full accord with the microarray data, the
variation tendency of each lncRNA was consistent with the result of
the micro-array. H19, an lncRNA which was reported to be
upregulated in multiple solid tumors such as breast, bladder,
esophageal and lung was also found to be increased by an average
fold of 3.6 in CRC samples compared to normal tissues.
Discussion
In the present study, we identified that lncRNAs and
mRNAs were differentially expressed between colon cancer tissues
and paired adjacent normal tissues. To address the underlying
biology of those differentially expressed transcripts, GO analysis
and KEGG pathway analysis were performed in our study.
GO analysis suggested that upregulated transcripts
were predominantly enriched in DNA metabolic processes,
non-membrane-bound organelles and protein binding. DNA metabolic
processes consist of any cellular metabolic process involved in
deoxyribonucleic acid, including replication, repair, recombination
and so on. Dysregulation of each metabolic pathway may play a
different role in the malignant transformation of pre-cancerous
colorectal lesions (18).
Non-membrane-bounded organelles include the ribosome, the
cytoskeleton and chromosome, of which ribosome biogenesis is
considered as a new pathway linking inflammation to CRC based on
the inflammatory cytokine IL-6-mediated down-regulation of P53
(19).
Pathway analysis revealed that 22 pathways were
associated with the upregulated transcripts, while 24 pathways were
associated with the downregulated transcripts. The most enriched
pathway was systemic lupus erythematosus-Homo sapiens in
upregulated transcripts. The gene category in this pathway was
previously reported to be associated with a variety of cancers,
highlighting increased risks of non-Hodgkin's lymphoma, leukemia,
vulva, thyroid, lung, and possibly liver cancers (20). Upregulation of the Wnt signaling
pathway was also identified in pathway analysis, which has been
shown to play an important role in colon carcinogenesis. However
the majority of previous research has focused on the genetic
mutations of signal transducers lying on the different level of
this pathway (21–23), and the reports concerning the
upregulation of this pathway at the mRNA level is rare so far. To
our surprise, SRFP2, SRFP4, WIF and DKK4, which are known as Wnt
signal antagonists, were also found to be upregulated in colon
cancers in our study. There is increasing evidence indicating that
these Wnt signal antagonists are associated with cancer biology.
For example, SRFP2 and DKK4 have been proven to be associated with
breast cancer angiogenesis (24)
and colon cancer chemoresistance (25), respectively. SRFP4 serves as a tumor
suppressor in a variety of human cancers (26–28),
whose expression was also reported to be upregulated in colon
cancer, although its exact role in the context of colon cancer is
still unknown (29). 'Steroid
hormone biosynthesis' was the fourth most enriched downregulated
pathway in colon cancers in our study. In accordance with this, E2,
the principal estrogen, which has been shown to play a vital role
in reducing the risk of CRC (17)
and to mediate the growth inhibition of colon cancer cells
(30) was downregulated in CRC
(31). More significantly, the
expression of CYP19A1 and HSD3B1 (32), two estrogen synthesis gene, were
decreased by 4.4- and 13.7-fold, respectively, in the colon cancer
tissues compared to the adjacent normal tissues in our study.
Aberrant activation of the Wnt signaling pathway
plays a central role in colon carcinogenesis (21). CNC co-expression analysis showed
that the expression of Wnt signaling pathway genes is closely
correlated with the expression of lncRNAs. Since genes with similar
expression patterns in different conditions may have similar
functions (33) or be involved in
related biological pathways (34),
we suggest that lncRNAs may play an important role during colon
cancer initiation, progression or metastasis. The observations that
the upregulation of Wnt signaling transducers at the mRNA level,
and that lncRNAs have a functional correlation with this pathway
may provide us with a novel mechanism, which is responsible for the
aberrant activation of the Wnt signaling pathway in CRCs.
According to their genomic proximity to
protein-coding genes, lncRNAs are mainly divided into five
categories: intergenic, intronic, bidirectional, antisense and
sense (35). Several studies
indicate that the classification of lncRNAs may reflect functional
characterization. For example, antisense lncRNAs can regulate the
expression of neighboring genes in cis, or distant genes in
trans, through base pair complementarity or through the
ability to bind to proteins (36).
Microarray data showed that 45 antisense lncRNAs were upregulated
and 30 antisense lncRNAs were downregulated in cancer samples
compared to paired normal samples. Among them, ENST00000496491 was
upregulated, and its neighboring gene TM4SF1, which shows
high expression in colon cancer, is closely related to the invasion
and migration in CRC cells (37).
On the other hand, Uc010fkt.3, which we found to be downregulated
in CRC samples, is in close proximity to the gene PAX8,
which was previously reported to have 100% negative expression in
colon cancer (38). Another type of
lncRNA is enhancer-like lncRNAs, which act as an enhancer-like
element to influence the expression of nearby genes. In our data,
ENST00000438158 was the highest upregulated enhancer-like lncRNA in
cancer tissues compared to the normal tissues. ENST00000438158 is
located downstream of the DUSP10 gene, which is upregulated
in CRC (39), and can promote cell
multiplication by inhibiting the JNK signaling pathway in
pancreatic cancer cells (40).
NR_034119 was another upregulated enhancer-like lncRNA, which is
located downstream of the ARGLU1 gene. ARGLU1 was previously
shown to have a significant stimulating effect on breast cancer
cell growth (41).
While still a relatively new field, lncRNAs are now
known to play many important roles in various types of cancers.
Results of the microarray and bioinformatics analysis in our study
strongly suggest that lncRNAs are likely to participate in colon
cancer progression through different mechanisms and may be novel
types of tumor markers for diagnosis or potential therapeutic
targets for cancer treatment. Further studies are needed to
investigate the exact biological functions and the underlining
molecular mechanisms exerted by these abnormally expressed lncRNAs
in CRC, and other cancers as well.
Acknowledgments
This study was supported by the Natural Science
Foundation of Fujian Province, China (grant no. 2015J01566).
Abbreviations:
|
CRC
|
colorectal cancer
|
|
lncRNAs
|
long non-coding RNAs
|
|
GO
|
gene ontology
|
|
APC
|
adenomatous polyposis coli
|
|
AXIN
|
axis inhibition protein
|
|
CCAT1
|
colon cancer-associated transcript
1
|
|
HOTAIR
|
HOX antisense intergenic RNA
|
|
CSE
|
cystathionine-γ-lyase
|
|
CYP19A1
|
cytochrome p450, family 19, subfamily
A, polypeptide 1
|
|
HSD3B1
|
hydroxy-δ-5-steroid dehydrogenase, 3
β- and steroid δ-isomerase 1
|
|
TM4SF1
|
transmembrane 4 L six family member
1
|
|
PAX8
|
paired box 8
|
|
DUSP10
|
dual specificity phosphatase 10
|
|
ARGLU1
|
arginine and glutamate rich 1
|
|
CEA
|
carcinoembryonic antigen
|
References
|
1
|
Zauber AG, Winawer SJ, O'Brien MJ,
Lansdorp-Vogelaar I, van Ballegooijen M, Hankey BF, Shi W, Bond JH,
Schapiro M, Panish JF, et al: Colonoscopic polypectomy and
long-term prevention of colorectal-cancer deaths. N Engl J Med.
366:687–696. 2012. View Article : Google Scholar : PubMed/NCBI
|
|
2
|
Irving AA, Yoshimi K, Hart ML, Parker T,
Clipson L, Ford MR, Kuramoto T, Dove WF and Amos-Landgraf JM: The
utility of Apc-mutant rats in modeling human colon cancer. Dis
Model Mech. 7:1215–1225. 2014. View Article : Google Scholar : PubMed/NCBI
|
|
3
|
Thompson BA, Goldgar DE, Paterson C,
Clendenning M, Walters R, Arnold S, Parsons MT, Michael DW,
Gallinger S, Haile RW, et al Colon Cancer Family Registry: A
multifactorial likelihood model for MMR gene variant classification
incorporating probabilities based on sequence bioinformatics and
tumor characteristics: A report from the Colon Cancer Family
Registry. Hum Mutat. 34:200–209. 2013. View Article : Google Scholar :
|
|
4
|
Schneikert J, Ruppert JG, Behrens J and
Wenzel EM: Different roles for the axin interactions with the SAMP
versus the second twenty amino acid repeat of adenomatous polyposis
coli. PLoS One. 9:e944132014. View Article : Google Scholar : PubMed/NCBI
|
|
5
|
Maruyama R and Suzuki H: Long noncoding
RNA involvement in cancer. Biochem Mol Biol Rep. 45:604–611.
2012.
|
|
6
|
Kim ED and Sung S: Long noncoding RNA:
Unveiling hidden layer of gene regulatory networks. Trends Plant
Sci. 17:16–21. 2012. View Article : Google Scholar
|
|
7
|
Clark MB and Mattick JS: Long noncoding
RNAs in cell biology. Semin Cell Dev Biol. 22:366–376. 2011.
View Article : Google Scholar : PubMed/NCBI
|
|
8
|
Gupta RA, Shah N, Wang KC, Kim J, Horlings
HM, Wong DJ, Tsai MC, Hung T, Argani P, Rinn JL, et al: Long
non-coding RNA HOTAIR reprograms chromatin state to promote cancer
metastasis. Nature. 464:1071–1076. 2010. View Article : Google Scholar : PubMed/NCBI
|
|
9
|
Ma MZ, Li CX, Zhang Y, Weng MZ, Zhang MD,
Qin YY, Gong W and Quan ZW: Long non-coding RNA HOTAIR, a c-Myc
activated driver of malignancy, negatively regulates miRNA-130a in
gallbladder cancer. Mol Cancer. 13:1562014. View Article : Google Scholar : PubMed/NCBI
|
|
10
|
Wu ZH, Wang XL, Tang HM, Jiang T, Chen J,
Lu S, Qiu GQ, Peng ZH and Yan DW: Long non-coding RNA HOTAIR is a
powerful predictor of metastasis and poor prognosis and is
associated with epithelial-mesenchymal transition in colon cancer.
Oncol Rep. 32:395–402. 2014.PubMed/NCBI
|
|
11
|
Schmittgen TD and Livak KJ: Analyzing
real-time PCR data by the comparative C(T) method. Nat Protoc.
3:1101–1108. 2008. View Article : Google Scholar : PubMed/NCBI
|
|
12
|
Ashburner M, Ball CA, Blake JA, Botstein
D, Butler H, Cherry JM, Davis AP, Dolinski K, Dwight SS, Eppig JT,
et al: Gene ontology: Tool for the unification of biology. The Gene
Ontology Consortium Nat Genet. 25:25–29. 2000.
|
|
13
|
Watanabe K, Biesinger J, Salmans ML,
Roberts BS, Arthur WT, Cleary M, Andersen B, Xie X and Dai X:
Integrative ChIP-seq/microarray analysis identifies a CTNNB1 target
signature enriched in intestinal stem cells and colon cancer. PLoS
One. 9:e923172014. View Article : Google Scholar : PubMed/NCBI
|
|
14
|
de Sousa E, Melo F, Colak S, Buikhuisen J,
Koster J, Cameron K, de Jong JH, Tuynman JB, Prasetyanti PR,
Fessler E, van den Bergh SP, et al: Methylation of
cancer-stem-cell-associated Wnt target genes predicts poor
prognosis in colorectal cancer patients. Cell Stem Cell. 9:476–485.
2011. View Article : Google Scholar
|
|
15
|
Naba A, Clauser KR, Whittaker CA, Carr SA,
Tanabe KK and Hynes RO: Extracellular matrix signatures of human
primary metastatic colon cancers and their metastases to liver. BMC
Cancer. 14:5182014. View Article : Google Scholar : PubMed/NCBI
|
|
16
|
Wang F, Ruan XJ and Zhang HY: BDE-99
(2,2′,4,4′,5-pentabro-modiphenyl ether) triggers
epithelial-mesenchymal transition in colorectal cancer cells via
PI3K/Akt/Snail signaling pathway. Tumori. 101:238–245. 2015.
View Article : Google Scholar : PubMed/NCBI
|
|
17
|
Simpson ER: Sources of estrogen and their
importance. J Steroid Biochem Mol Biol. 86:225–230. 2003.
View Article : Google Scholar : PubMed/NCBI
|
|
18
|
Maglietta R, Liuzzi VC, Cattaneo E, Laczko
E, Piepoli A, Panza A, Carella M, Palumbo O, Staiano T, Buffoli F,
et al: Molecular pathways undergoing dramatic transcriptomic
changes during tumor development in the human colon. BMC Cancer.
12:6082012. View Article : Google Scholar : PubMed/NCBI
|
|
19
|
Brighenti E, Calabrese C, Liguori G,
Giannone FA, Trerè D, Montanaro L and Derenzini M: Interleukin 6
downregulates p53 expression and activity by stimulating ribosome
biogenesis: a new pathway connecting inflammation to cancer.
Oncogene. 33:4396–4406. 2014. View Article : Google Scholar : PubMed/NCBI
|
|
20
|
Bernatsky S, Ramsey-Goldman R, Labrecque
J, Joseph L, Boivin JF, Petri M, Zoma A, Manzi S, Urowitz MB,
Gladman D, et al: Cancer risk in systemic lupus: An updated
international multi-centre cohort study. J Autoimmun. 42:130–135.
2013. View Article : Google Scholar : PubMed/NCBI
|
|
21
|
Bienz M and Clevers H: Linking colorectal
cancer to Wnt signaling. Cell. 103:311–320. 2000. View Article : Google Scholar : PubMed/NCBI
|
|
22
|
Polakis P: Wnt signaling in cancer. Cold
Spring Harb Perspect Biol. 4:a0080522012. View Article : Google Scholar : PubMed/NCBI
|
|
23
|
Polakis P: Wnt signaling and cancer. Genes
Dev. 14:1837–1851. 2000.PubMed/NCBI
|
|
24
|
Siamakpour-Reihani S, Caster J, Bandhu
Nepal D, Courtwright A, Hilliard E, Usary J, Ketelsen D, Darr D,
Shen XJ, Patterson C, et al: The role of calcineurin/NFAT in SFRP2
induced angiogenesis - a rationale for breast cancer treatment with
the calcineurin inhibitor tacrolimus. PLoS One. 6:e204122011.
View Article : Google Scholar
|
|
25
|
Ebert MP, Tänzer M, Balluff B,
Burgermeister E, Kretzschmar AK, Hughes DJ, Tetzner R, Lofton-Day
C, Rosenberg R, Reinacher-Schick AC, et al: TFAP2E-DKK4 and
chemoresistance in colorectal cancer. N Engl J Med. 366:44–53.
2012. View Article : Google Scholar : PubMed/NCBI
|
|
26
|
Ford CE, Jary E, Ma SS, Nixdorf S,
Heinzelmann-Schwarz VA and Ward RL: The Wnt gatekeeper SFRP4
modulates EMT, cell migration and downstream Wnt signalling in
serous ovarian cancer cells. PLoS One. 8:e543622013. View Article : Google Scholar : PubMed/NCBI
|
|
27
|
Warrier S, Bhuvanalakshmi G, Arfuso F,
Rajan G, Millward M and Dharmarajan A: Cancer stem-like cells from
head and neck cancers are chemosensitized by the Wnt antagonist,
sFRP4, by inducing apoptosis, decreasing stemness, drug resistance
and epithelial to mesenchymal transition. Cancer Gene Ther.
21:381–388. 2014. View Article : Google Scholar : PubMed/NCBI
|
|
28
|
Wu Y, Bai J, Li Z, Wang F, Cao L, Liu C,
Yu S, Yu G and Zhang Y: Low expression of secreted frizzled-related
protein 4 in aggressive pituitary adenoma. Pituitary. 18:335–342.
2015. View Article : Google Scholar
|
|
29
|
Huang D, Yu B, Deng Y, Sheng W, Peng Z,
Qin W and Du X: SFRP4 was overexpressed in colorectal carcinoma. J
Cancer Res Clin Oncol. 136:395–401. 2010. View Article : Google Scholar
|
|
30
|
Hartman J, Edvardsson K, Lindberg K, Zhao
C, Williams C, Ström A and Gustafsson JA: Tumor repressive
functions of estrogen receptor beta in SW480 colon cancer cells.
Cancer Res. 69:6100–6106. 2009. View Article : Google Scholar : PubMed/NCBI
|
|
31
|
Rawłuszko AA, Antoniucci M, Horbacka K,
Lianeri M, Krokowicz P and Jagodziński PP: Reduced expression of
steroid sulfatase in primary colorectal cancer. Biomed
Pharmacother. 67:577–582. 2013. View Article : Google Scholar
|
|
32
|
Shimodaira M, Nakayama T, Sato I, Sato N,
Izawa N, Mizutani Y, Furuya K and Yamamoto T: Estrogen synthesis
genes CYP19A1, HSD3B1, and HSD3B2 in hypertensive disorders of
pregnancy. Endocrine. 42:700–707. 2012. View Article : Google Scholar : PubMed/NCBI
|
|
33
|
Lee HK, Hsu AK, Sajdak J, Qin J and
Pavlidis P: Coexpression analysis of human genes across many
microarray data sets. Genome Res. 14:1085–1094. 2004. View Article : Google Scholar : PubMed/NCBI
|
|
34
|
Eisen MB, Spellman PT, Brown PO and
Botstein D: Cluster analysis and display of genome-wide expression
patterns. Proc Natl Acad Sci USA. 95:14863–14868. 1998. View Article : Google Scholar : PubMed/NCBI
|
|
35
|
Rinn JL and Chang HY: Genome regulation by
long noncoding RNAs. Annu Rev Biochem. 81:145–166. 2012. View Article : Google Scholar : PubMed/NCBI
|
|
36
|
Villegas VE and Zaphiropoulos PG:
Neighboring gene regulation by antisense long non-coding RNAs. Int
J Mol Sci. 16:3251–3266. 2015. View Article : Google Scholar : PubMed/NCBI
|
|
37
|
Wang D, Chen N, Peng M, Xu Q and Zhou J:
Construction of a eukaryotic expression vector of TM4SF1 and its
effect on migration and invasion of colorectal cancer cells. Nan
Fang Yi Ke Da Xue Xue Bao. 34:847–851. 2014.In Chinese. PubMed/NCBI
|
|
38
|
Tacha D, Zhou D and Cheng L: Expression of
PAX8 in normal and neoplastic tissues: A comprehensive
immunohistochemical study. Appl Immunohistochem Mol Morphol.
19:293–299. 2011. View Article : Google Scholar : PubMed/NCBI
|
|
39
|
Nomura M1, Shiiba K, Katagiri C, Kasugai
I, Masuda K, Sato I, Sato M, Kakugawa Y, Nomura E, Hayashi K, et
al: Novel function of MKP-5/DUSP10, a phosphatase of
stress-activated kinases, on ERK-dependent gene expression, and
upregulation of its gene expression in colon carcinomas. Oncol Rep.
28:931–936. 2012.PubMed/NCBI
|
|
40
|
He G, Zhang L, Li Q and Yang L:
miR-92a/DUSP10/JNK signaling axis promotes human pancreatic cancer
cells proliferation. Biomed Pharmacother. 68:25–30. 2014.
View Article : Google Scholar
|
|
41
|
Zhang D, Jiang P, Xu Q and Zhang X:
Arginine and glutamate-rich 1 (ARGLU1) interacts with mediator
subunit 1 (MED1) and is required for estrogen receptor-mediated
gene transcription and breast cancer cell growth. J Biol Chem.
286:17746–17754. 2011. View Article : Google Scholar : PubMed/NCBI
|