Introduction
Insulinomas are neuroendocrine neoplasms derived
from the β-cells of the pancreas. They belong to the group of
pancreatic neuroendocrine tumors (PNETs). Most insulinomas are
benign with only 10% showing malignant features (1,2); in
the latter situation, the liver and regional nymph nodes are the
main sites of metastases (3–5).
Despite the general pancreatic origin of insulinomas, there are
reports of some cases originating from ectopic pancreatic tissue
(6,7). Although rare, insulinomas represent
the most common functioning pancreatic neuroendocrine neoplasm with
an incidence of 1–4 per million per year (1). The only curative treatment is complete
surgical resection (8).
PNETs occur sporadically or are inherited as part of
the multiple endocrine neoplasia type 1 (MEN1) syndrome.
Individuals with MEN1 syndrome have constitutional mutations in the
MEN1 gene which render them genetically predisposed to
endocrine tumors. Although insulinomas account for 10–30% of
pancreatic tumors in patients with MEN1, only few patients with
insulinomas harbor MEN1 mutations (4–6%) (1,9).
Little is known about the other genetic alterations in insulinomas
and it has been shown that the most common oncogenes are uninvolved
in PNETs (10). Comparative genomic
hybridization (CGH) studies have demonstrated genomic imbalances in
insulinomas (9–17). High frequencies of gains at 5p, 5q,
7p, 7q, 9p, 9q, 12q, 14q, 17p, 17q, and 20q were detected whereas
frequent losses were scored at 1p, 1q, 2q, 3q, 9p, 6p, 6q, 10q,
11p, 11q, and 22q (10,13). Chromosomal band 9q34 was found
gained in 50% of insulinomas (11,13).
Furthermore, array-CGH and FISH analyses showed that gain of 9q32
and loss of 22q13.1-q13.31 are early and independent genetic events
in insulinomas while losses of 11q23.3-q24.3 and 22q13.31-q13.32
are associated with tumor development (12).
Gene fusions are common and pathogenetically
essential in many types of neoplasia. The chimeric fusions and
resulting abnormal protein products may not only be important in
tumorigenesis, but they also constitute ideal diagnostic features
and may be therapeutic targets (18). Since the major genetic alterations
in sporadic insulinomas are still unknown, we decided to perform
RNA sequencing on two such tumors looking for possible fusion
transcripts.
Materials and methods
Ethics statement
The study was approved by the regional ethics
committee (Regional Komité for Medisinsk Forskningsetikk Sør-Øst,
Norge, http://helseforskning.etikkom.no; project number
2011/1945), and written informed consent was obtained from the
patients.
Case history
Case 42: A 37-year-old female showing unexplained
fatigue, rapid heartbeat, trouble thinking clearly, and repetitive
episodes where low blood sugar values were measured was referred to
our hospital for further examination. Biochemical evidence of
insulinoma was found. Cross-sectional imaging showed a small solid
lesion in the pancreatic tail but no sign of metastatic disease. A
laparoscopic distal spleen-preserving pancreatectomy was performed.
Histology showed a 13 mm insulinoma with a Ki-67 of 6% and ENETS
TNM stage pT1N0 (data not shown). There was no sign of recurrence
25 months after surgery (19).
Case 59: A 30-year-old male with a known history of
acute lympoblastic leukemia (ALL) in remission was admitted to our
hospital with left-sided abdominal and lower back pain. Shortly
afterwards he had an episode of unconsciousness and severe
hypoglycemia was measured. Cross-sectional imaging showed a large
left-sided retroperioneal tumor with infiltration of the adrenal
gland and kidney. Because a malignant adrenal tumor was suspected,
the patient underwent concomitant left nephrectomy and
adrenalectomy. Intraoperatively, suspicious liver lesions were
detected which were biopsied. Histology showed a malignant
insulinoma with a Ki-67 of 38%. Postoperative octreotide
scintigraphy and FDG-PET/CT showed pathologic uptake in the
pancreas and liver as well as in the thoracic lymph nodes. Medical
treatment was started (temozolomide, everolimus, bevacizumab). Due
to continuous hypoglycemic symptoms the patient was referred for
debulking surgery. A laparoscopic distal spleen-preserving
pancreatectomy and a simultaneous laparoscopic resection of two
metastases in the right liver lobe were performed. Histology showed
a 15-mm insulinoma in the pancreatic tail with a Ki-67 of 9% and
ENETS TNM stage pT1N1M1 (data not shown). The patient has stable
disease after ongoing medical treatment 27 months after the first
surgery (19).
Case 45: The control sample was harvested from
normal pancreatic tissue from a 40-year-old male who underwent
laparoscopic distal pancreatectomy with splenectomy for a
nonfunctioning pancreatic neuroendocrine neoplasm. Histology of the
pancreatic lesion showed neuroendocrine morphology with a Ki-67 of
2% and ENETS TNM stage pT1N0 (data not shown). The control sample
was harvested from the same surgical specimen separated from the
actual neuroendocrine lesion. The patient has no sign of recurrence
of the disease 40 months after surgery.
High-throughput paired-end
RNA-sequencing
Tumor tissue adjacent to that used for histologic
examination was frozen and stored at −80°C. Total RNA was extracted
from the insulinomas (cases 42 and 59) and one control sample (case
45) using miRNeasy Mini kit according to the manufacturer's
instructions (Qiagen Nordic, Oslo, Norway). Tumor tissue was
disrupted and homogenized in QIAzol Lysis Reagent using a 5 mm
stainless steel bead and TissueLyser II (both from Qiagen).
Subsequently, total RNA was purified using QIAcube (Qiagen). The
RNA quality was evaluated using the Experion automated
electrophoresis system (Bio-Rad Laboratories, Hercules, CA, USA).
Three micrograms of total RNA for cases 42 and 59 were sent for
high-throughput paired-end RNA-sequencing at the Norwegian
Sequencing Centre, Ullevål Hospital (http://www.sequencing.uio.no/). The RNA was sequenced
using an Illumina HiSeq 2000 instrument and the Illumina software
pipeline was used to process image data into raw sequencing data.
The TruSeq Stranded mRNA sample preparation protocol was used
(http://support.illumina.com/downloads/truseq_stranded_mrna_sample_preparation_guide_15031047.ilmn)
giving reads of a length of 100 base pairs. The Illumina software
pipeline was used to process image data into raw sequencing data
and only sequence reads marked as 'passed filtering' were used in
the downstream data analysis. A total of 103 and 98 millions reads,
respectively, were obtained. The FastQC software was used for
quality control of the raw sequence data (http://www.bioinformatics.babraham.ac.uk/projects/fastqc/).
We used the fusion discovery software FusionMap (release date
16-04-2012) and the pre-built Human B37 and RefGene from the
FusionMap website (http://www.omicsoft.com/fusionmap/) (20).
RT-PCR
RNA was purified for cases 42 and 59 as well as for
the normal tissue used as the control (case 45). The purification
was as described in the 'High-throughput paired-end RNA-sequencing'
method-section except that an optional 'on column' DNase-treatment
step was included as recommended by the manufacturer (Qiagen). Five
micrograms of total RNA were reverse-transcribed in a 100 µl
reaction volume using iScript Advanced cDNA Synthesis Kit for
RT-qPCR according to the manufacturer's instructions (Bio-Rad
Laboratories). For case 45, 1.33 µg of total RNA were
reverse-transcribed in a 40 µl reaction volume. RNA was
diluted in RNase-free water to a concentration equivalent to 15
ng/µl DNase treated RNA. For PCR reactions requiring higher
start-amounts of template, 2 µg of RNA from the
'RNA-sequencing' method-section was reverse-transcribed in a 20
µl reaction volume before being diluted in RNase-free water
to a concentration equivalent to 50 ng/µl RNA.
The 25 µl PCR volume contained 12.5 µl
of Premix Ex Taq Hot Start (Takara Bio Inc., Otsu, Japan), 0.25–2
µl of cDNA, and 0.4 µM of each of the forward and
reverse primers. The primers used for PCR amplification and
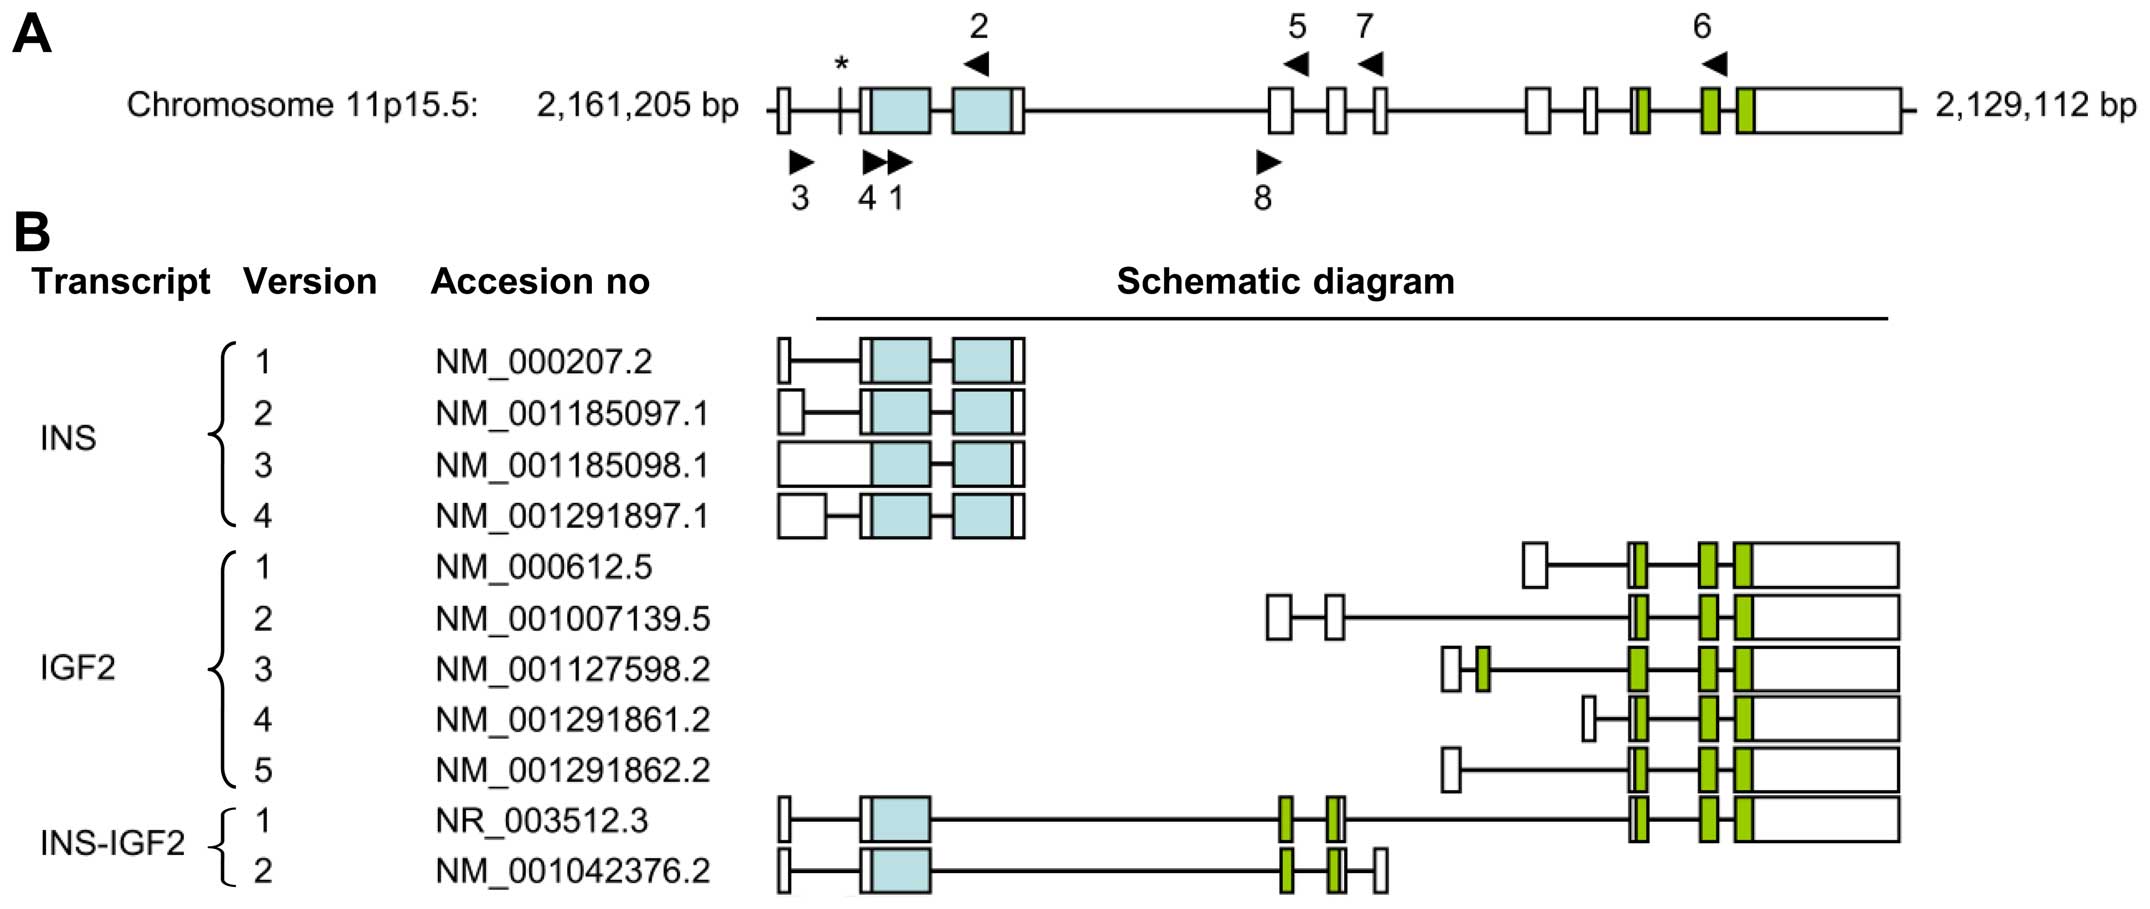
sequencing are listed in Table I
(for primer localization, see Fig.
1). For primer combinations, cDNA concentration and volume of
cDNA used, see figure legends and Table II. The PCR conditions for all
amplifications, except for primer combinations 4+6, 4+7, and 3+5,
were: an initial denaturation at 94°C for 30 sec followed by 35
cycles of 7 sec at 98°C and 2 min at 68°C, and a final extension
for 5 min at 68°C. For the amplifications using the primer sets
4+6, 4+7 or 3+5, the PCR conditions were: an initial denaturation
at 94°C for 1 min followed by 35 cycles of 10 sec at 98°C, 1 min at
66°C and 2 min at 72°C, followed by a final extension for 5 min at
72°C. The PCRs were run on a C-1000 Thermal cycler (Bio-Rad
Laboratories). Four or 10 µl of the PCR products were
analyzed by electrophoresis through a 1.5 or 1% agarose gel stained
with GelRed (Biotium, Inc., Hayward, CA, USA), and photographed.
The PCR products were purified using the QIAquick PCR purification
kit (Qiagen) or the QIAquick Gel extraction kit (Qiagen) and direct
sequencing was performed using the light run sequencing service of
GATC Biotech (http://www.gatc-biotech.com/en/sanger-services/lightrun-sequencing.html).
The BLAST software (http://www.ncbi.nlm.nih.gov/BLAST/) was used for
computer analysis of the sequence data.
 | Table IPrimers used for RT-PCR analysis. |
Table I
Primers used for RT-PCR analysis.
| Primer | Name | Target
| Sequence |
|---|
| Transcript | Isoform | Accession no. | Exon |
|---|
| 1 | INSIGF2-96F | INS | 1 | NM_000207.2 | Ex2 |
CTGCTGGCCCTCTGGGGACCT |
| 2 | INS1-388R | INS | 1 | NM_000207.2 | Ex3 |
GCCTGCGGGCTGCGTCTAGT |
| 3 | INS2-42F | INS | 2 | NM_001185097.1 | Ex1 |
GGTCTGTTCCAAGGGCCTTTGCGT |
| 4 | INSIGF2-55F | INS | 1 | NM_000207.2 | Ex2 |
CTGCCATGGCCCTGTGGATGCG |
| 5 | INSIGF2-378R | IGF2 | 2 | NM_001007139.5 | Ex1 |
GGTGCCCAAGGCTCTCTGCCG |
| 6 |
INSIGF2_1-1000R | IGF2 | 2 | NM_001007139.5 | Ex4 |
CGGAAGCACGGTCGGAGGGGT |
| 7 | INSIGF2_2-752R |
INS-IGF2 | 2 | NM_001042376.2 | Ex5 |
CCCGGCTTCTATCTGGGATGGGCA |
| 8 | IGF2-48F | IGF2 | 2 | NM_001007139.5 | Ex1 |
CCCCAGCGGCCTCAGCACTAC |
| 9 | ABL-91F | ABL | A | NM_005157.5 | Ex2 |
CAGCGGCCAGTAGCATCTGACTTTG |
| 10 | ABL-404R1 | ABL | A | NM_005157.5 | Ex3 |
CTCAGCAGATACTCAGCGGCATTGC |
| Table IIPrimer combinations used for
RT-PCR. |
Table II
Primer combinations used for
RT-PCR.
| Primer
combinationa | Transcript | Isoform | Size (bp) |
|---|
| 1+2 | INS | 1 | 312 |
| | 2 | 312 |
| | 3 | 312 |
| | 4 | 312 |
| 3+2 | INS | 2 | 392 |
| | 3 | 545 |
| | 4 | 426 |
| 4+5 |
INS-IGF2 | 1 | 344 |
| | 2 | 344 |
| 4+6 |
INS-IGF2 | 1 | 966 |
| 4+7 |
INS-IGF2 | 2 | 721 |
| 3+5 |
INS-IGF2 | Novel | 383/536/417b |
| 8+5 | IGF2 | 2 | 363 |
| 9+10 | ABL | A | 338 |
Real-time PCR
DNase-treated RNA for cases 42, 59, and 45, purified
as detailed in the 'RT-PCR' method section, was diluted in
RNase-free water to a concentration equivalent to 30 ng/µl
DNase-treated RNA. For quantification of the expression of the
proinsulin precursor (INS), insulin-like growth factor 2
(IGF2), INS-IGF2, and β-actin (ACTB)
transcripts, four TaqMan-based real-time assays with
FAM-MGB-labelled probes were performed, all supplied by Applied
Biosystems (Thermo Fisher Scientific Inc., Waltham, MA, USA). Assay
Hs04185271_g1 was used for expression of the INS-IGF2
read-through transcript. This assay is specific for the exon 2–3
boundary of INS-IGF2 and detects both isoforms of the
INS-IGF2 read-through transcript (accession nos. NR_003512.3
and NM_001042376.2). Assay Hs02741908_m1 was used for the
expression of INS. This assay is specific for the exon 2–3
boundary of INS1 and detects all four isoforms (accession
nos. NM_000207.2, NM_001185097.1, NM_001185098.1, and
NM_001291897.1). Assay Hs04194920_s1 was used for detection of
IGF2. This assay is specific for exon 1 of isoform 2 of
IGF2 (accession no. NM_001007139.5), with a probe located at
a region not present in the INS-IGF2 transcripts (249 bp in
isoform 2 of IGF2 is located within the probe). Isoform 2 is
the isoform of IGF2 that is part of the INS-IGF2
read-through transcript. The assay Hs01060665_g1 is specific for
the exon 2–3 boundary of ACTB (accession no. NM_001101.3)
and was used as an endogenous control for relative gene expression
quantification. To quantify the expression of the INS
transcript with a deletion in exon 3, primers and a TaqMan probe
were generated to span this region. The primers and probe used
were: forward, 5′-TGC AGGCTGGAGAA-3′; reverse, 5′-CTGGTTCAAGGGCT
TTA-3′; and probe, 5′-CGCCTCCTGCACCGA-3′. The probe was labelled
with FAM-MGB. A 20X concentrated mixture of these generated primers
and probe was made (INSdel-mix) containing 18 µM of
each primer and 5 µM of the probe, which is identical to the
concentrations used in the 20X TaqMan Gene Expression Mix (Applied
Biosystems). Four replicates of each sample were used to ensure
statistical representativity. The 20 µl reaction volume
contained 1X TaqMan Universal Mix, 1X TaqMan Gene Expression Mix or
1X INSdel mix, and 1 µl cDNA (concentration
equivalent to 30 ng/µl DNase-treated RNA). Real-time PCR was
run on a CFX96 Touch™ Real-Time PCR Detection system (Bio-Rad
Laboratories). The thermal cycling included an initial step at 50°C
for 2 min, followed by 10 min at 95°C and 40 cycles of 15 sec at
95°C and 1 min at 60°C. The data were analyzed using the Bio-Rad
CFX Manager software (Bio-Rad Laboratories) and the
Microsoft® Excel Software (Microsoft Corporation,
Redmond, WA, USA). Expression of the different transcripts was
normalized to ACTB expression before calculation of the
relative expression level using the comparative Cq method (ΔΔCq)
(21).
Results
High-throughput paired-end RNA-sequencing
analysis
Using the FusionMap software with the fastq files
obtained from the Norwegian Sequencing Centre, Ullevål Hospital
(http://www.sequencing.uio.no/), a list
of >1,000 possible fusion genes was obtained for both tumors
(1,018 and 1,159, respectively). Involvement of the INS and
the IGF2 genes was noted in both. More specifically,
involvement of the INS-IGF2 read-through as one of the
fusion partners ranked as number two and three in case 42, with 98
and 66 reads, respectively (164 reads in total) (Table III). In all, a total of 472 reads
showed the involvement of INS, IGF2 and/or the
read-through INS-IGF2 as one of the fusion partners in case
42. Case 59 showed ten fusions involving INS, IGF2
and/or the read-through INS-IGF2 with different partners
(Table III). As FusionMap detects
INS-IGF2 as a fusion partner, this read-through will not be
detected by the software as a fusion by itself.
| Table IIIFusion transcripts involving
INS, IGF2 and/or the read-through INS-IGF2
detected upon RNA-sequencing analysis. |
Table III
Fusion transcripts involving
INS, IGF2 and/or the read-through INS-IGF2
detected upon RNA-sequencing analysis.
| Casea | Rank | 5′ gene | 5′ gene
junction | 3′ gene | 3′ gene
junction | Seed reads |
|---|
| 42 | 1 | SPTBN5 | chr15:42164047 | INS | chr11:2181187 | 443 |
| 2 | INS-IGF2,
IGF2 | chr11:2170573 | INS | chr11:2181184 | 98 |
| 3 | INS-IGF2,
IGF2 | chr11:2170575 | INS | chr11:2181101 | 66 |
| 18 | INS-IGF2,
INS | chr11:2182184 | PSAP | chr10:73576794 | 13 |
| 25 | INS-IGF2,
INS | chr11:2182184 |
AURKAIP1 | chr:11309510 | 11 |
| 30 | INS-IGF2,
INS | chr11:2182063 | FAM159B | chr5:63991473 | 9 |
| 35 | CHGA | chr14:93401433 | INS | chr11:2181068 | 8 |
| 36 | INS-IGF2,
INS | chr11:2182159 | EDF1 | chr9:139757890 | 8 |
| 37 | INS-IGF2,
INS | chr11:2182193 | FTL | chr19:49469598 | 8 |
| 44 | INS-IGF2,
INS | chr11:2182147 | GAPDH | chr12:6646957 | 7 |
| 59 | 37 | SPTBN5 | chr15:42164047 | INS | chr11:2181187 | 10 |
| 716 | RER1 | chr1:2336736 | INS-IGF2,
INS | chr11:2182217 | 2 |
| 717 | JTB | chr1:153949707 | INS-IGF2,
INS | chr11:2182028 | 2 |
| 724 | INS-IGF2,
IGF2 | chr11:2152930 | GPR123 |
chr10:134944378 | 2 |
| 743 | INS | chr11:2181214 | WBP11 | chr12:14940366 | 2 |
| 805 | INS-IGF2,
INS | chr11:2182184 | PDIA3 | chr15:44038744 | 2 |
| 868 | COL1A1 | chr17:48262336 | INS | chr11:2181174 | 2 |
| 869 | INS-IGF2,
INS | chr11:2182167 | PNPO | chr17:46026276 | 2 |
| 870 | INS-IGF2,
INS | chr11:2182202 | VPS25 | chr17:40925822 | 2 |
| 939 | PRKD2 | chr19:47177673 | INS-IGF2,
INS | chr11:2182075 | 2 |
Expression of different INS
transcripts
RNA sequencing identified possible involvement of
exons from the INS and IGF2 genes in formation of
fusion genes. The INS and IGF2 loci are located
sequentially on chromosome subband 11p15.5 (Fig. 1). Notably, these loci also encode
the previously described INS-IGF2 read-through transcript
(22), a fusion transcript
containing exons of the INS locus 5′ fused to exons of the
IGF2 locus 3′ (Fig. 1). The
detection of transcripts by RNA sequencing that could potentially
involve the INS-IGF2 read-through transcript caught our
interest as read-through transcripts have not been described in
insulinomas. We therefore decided to investigate in more detail
whether the INS-IGF2 transcript itself could be expressed in
insulinomas.
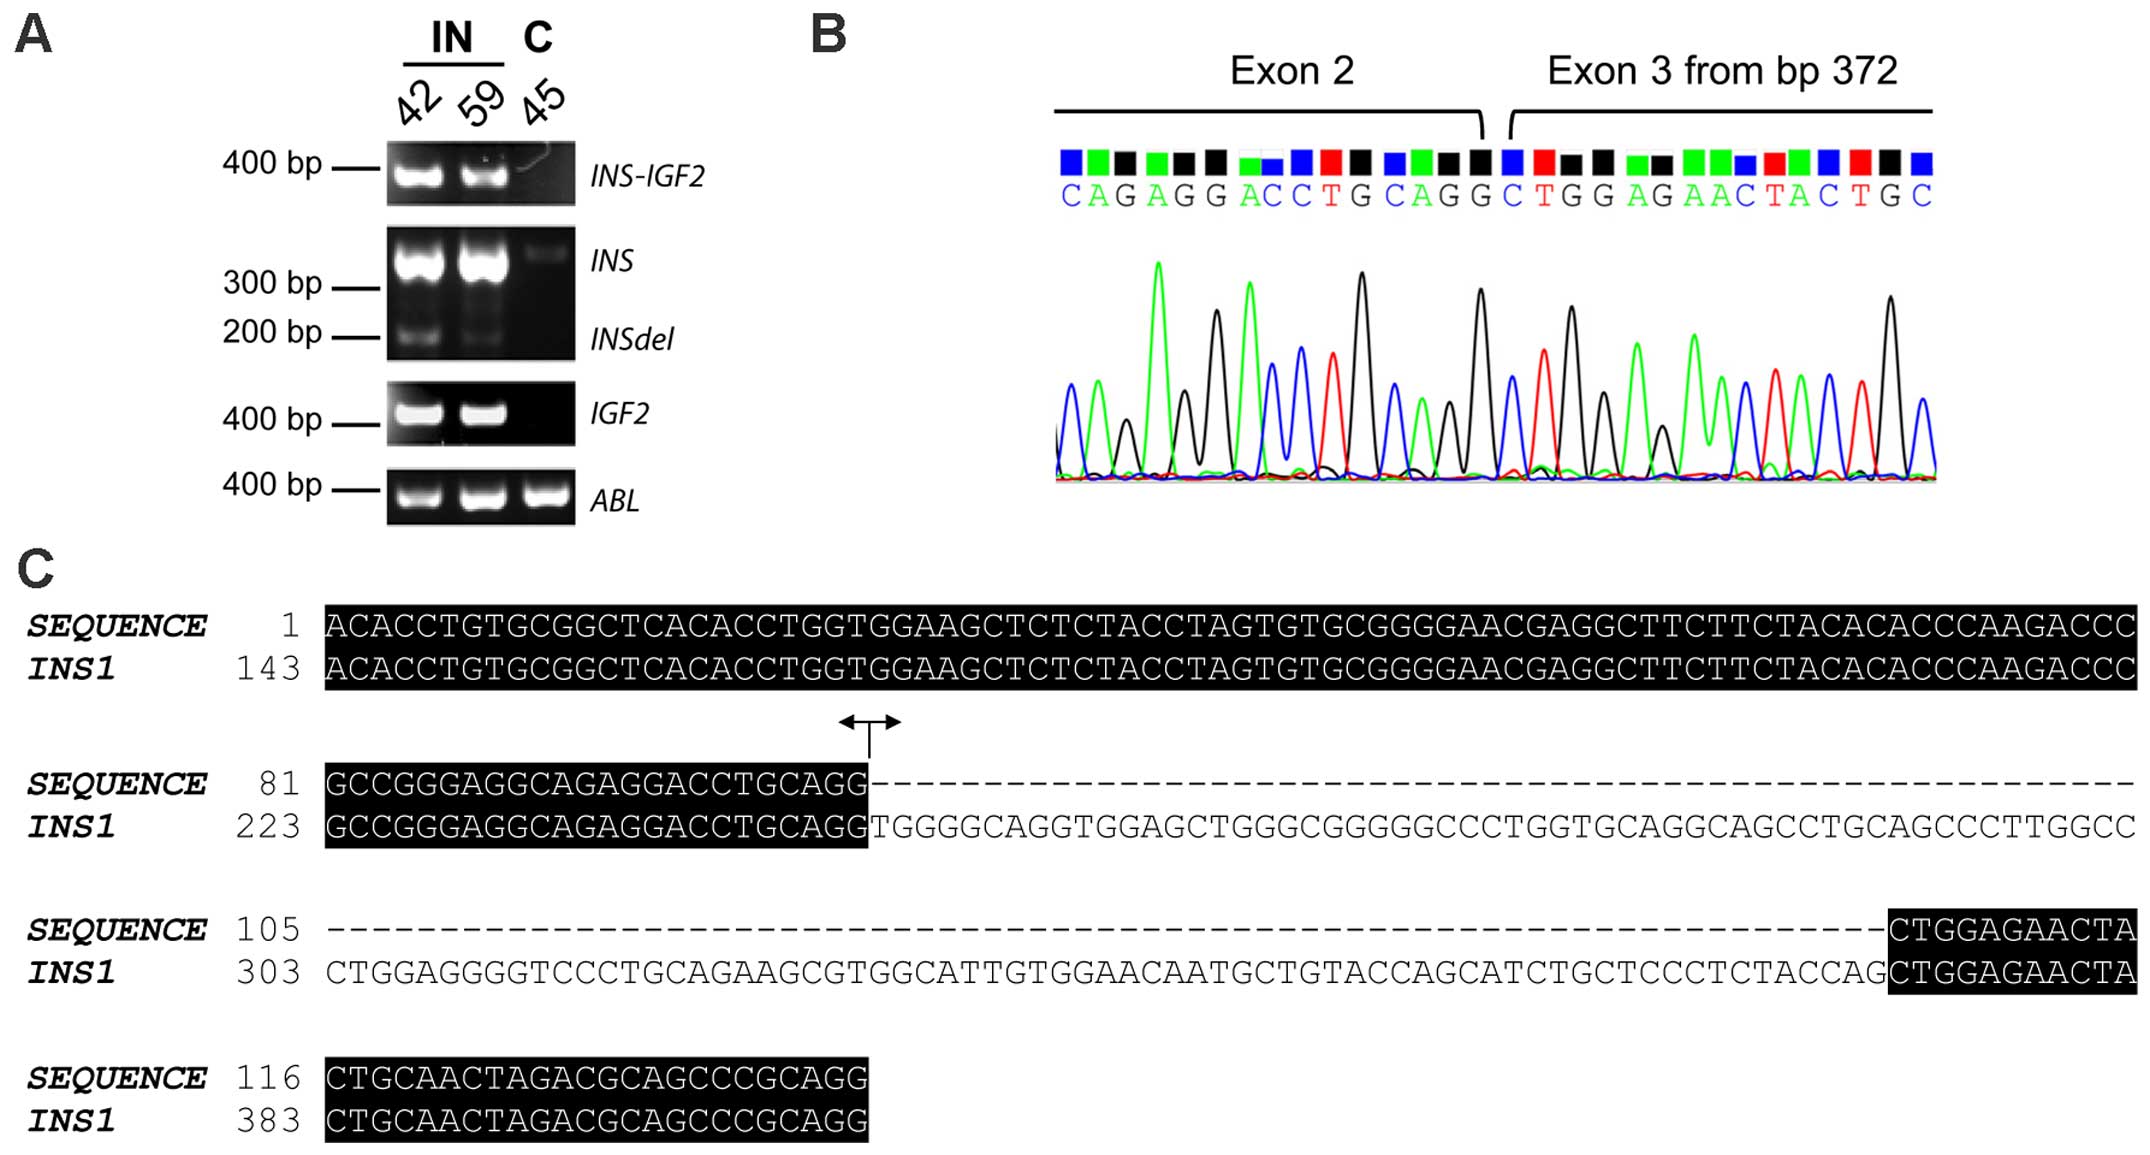
In order to investigate the possible expression of
INS-IGF2 in insulinomas, we performed PCR analysis of the
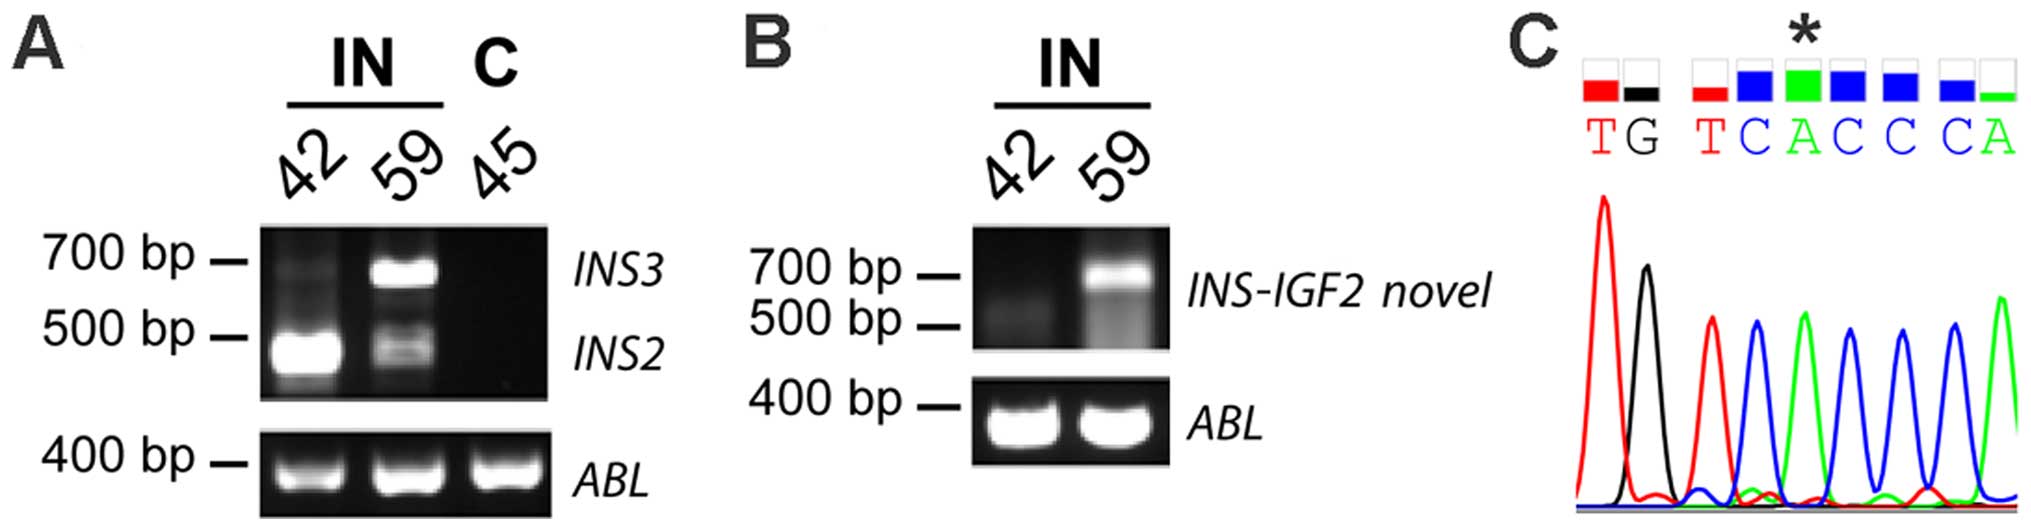
two insulinomas together with a control sample from normal
pancreatic β-cells (case 45) (Fig.
2; for primer combinations, Table
II). INS-IGF2 read-through PCR-fragments could be
detected in both insulinomas but not in the control sample
(Fig. 2A). Sanger sequencing
confirmed the identity of the PCR-fragments, clearly identifying
expression of the read-through INS-IGF2 in insulinomas.
Transcripts of the INS gene could be detected in all
samples, although the expression level was clearly higher in both
insulinomas compared to the control (Fig. 2A). A PCR-fragment with a lower
molecular weight than the INS PCR-fragment (called
INSdel) was detected in all samples upon PCR-detection of
INS, showing the same expression pattern as INS with
higher expression in the insulinomas (Fig. 2A). Sanger sequencing identified this
INSdel transcript as a shorter version of the INS
transcript, with a deletion of the first 125 bp in exon 3 (Fig. 2B and C). This short
INS-transcript was identical to one of the suggested
alternative INS-transcripts detected by transcriptome
sequencing. The INSdel transcript has an out-of-frame
deletion and lacks a STOP-codon, giving a novel non-coding
INS-transcript. IGF2 could also be detected in all
samples with a clearly higher expression level in insulinomas than
in the control sample (Fig. 2A).
Two additional control samples from normal pancreatic β-cells
showed the same expression pattern of INS-IGF2 and
INS as the control sample used in this study (data not
shown). Due to the limited material available, these two control
samples were not included.
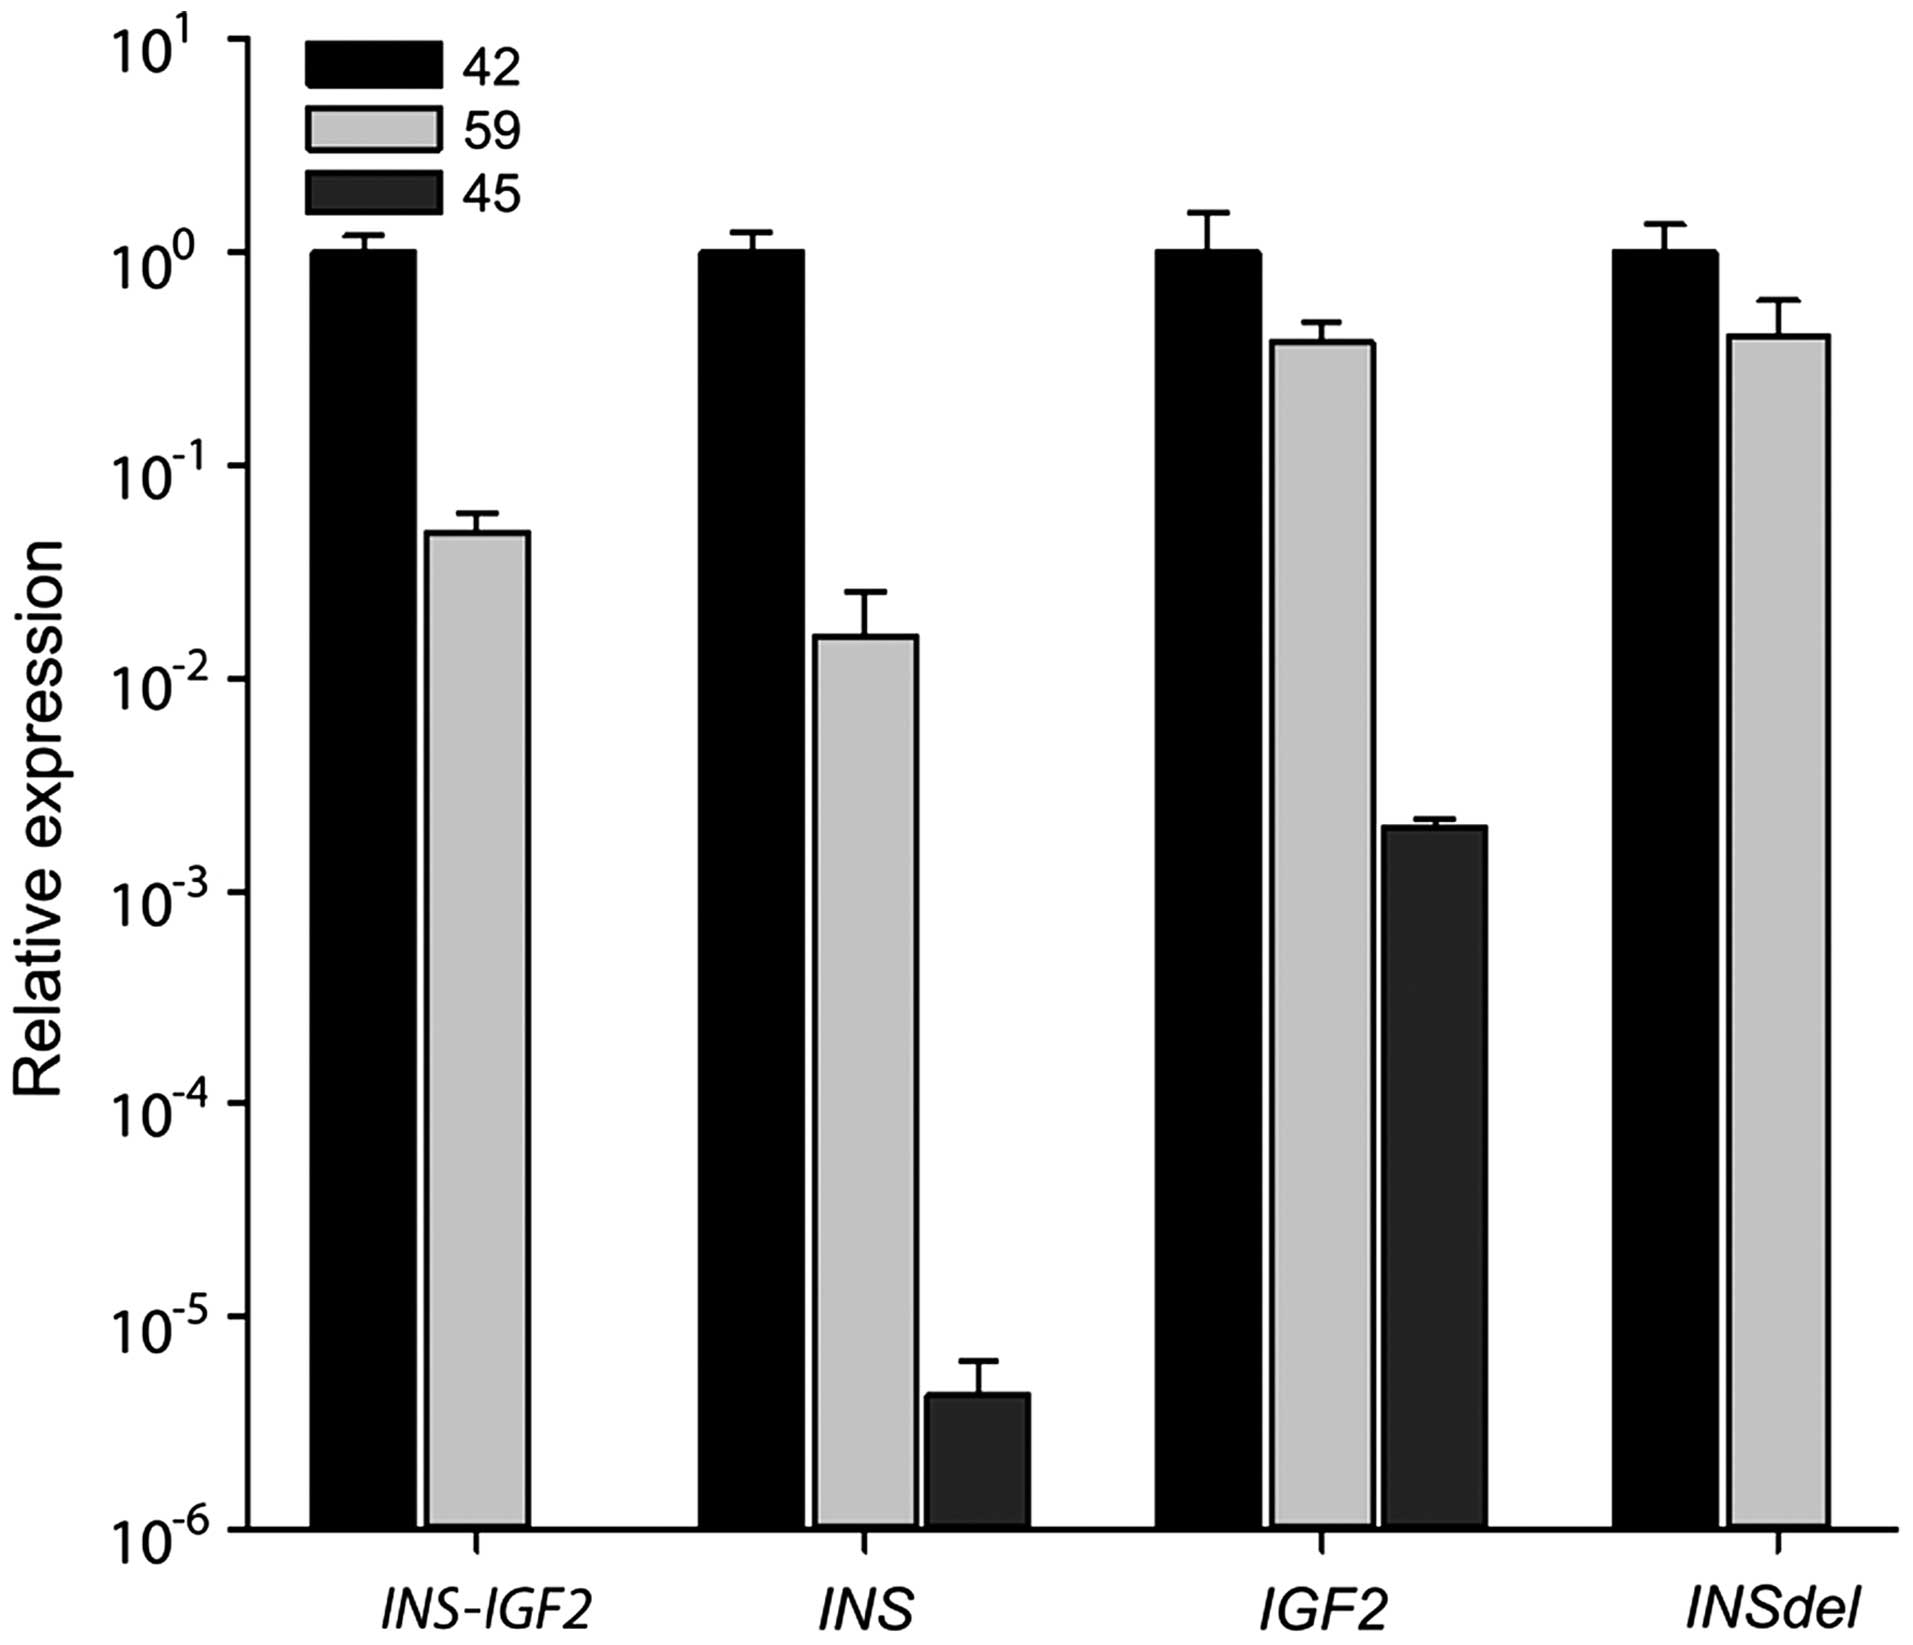
To quantify the relative expression of
INS-IGF2 read-through transcript, real-time PCR was
performed (Fig. 3). Expression of
the different transcripts was normalized to ACTB expression
before the relative expression was calculated (2−ΔΔCq)
and set as 1 for case 42. We could clearly detect INS-IGF2
in the two insulimonas (Cq values were 30.13±0.069 and 33.12±0.063
for cases 42 and 59, respectively) but were unable to detect
expression in the control sample. INS expression was high in
the insulinomas (Cq values, 19.21±0.186 and 23.81±0.626 for cases
42 and 59, respectively) compared to the control case (Cq value,
35.60±0.529), giving an increase in INS expression in the
insulinomas of ~2.5×10⁵ and 4×10³-fold for
cases 42 and 59, respectively, when comparing the 2−ΔΔCq
values. Expression of the short INS transcript with an
out-of-frame deletion (INSdel) could only be detected in the
two insulinomas (Cq values, 29.70±0.340 and 29.60±0.431 for cases
42 and 59, respectively). Additionally, expression of IGF2
version 2 was increased in the two insulinomas (Cq values,
32.08±0.568 and 32.09±0.034 for cases 42 and 59, respectively)
compared to the control sample where IGF2 could only be
detected in one out of the four replicates (Cq value, 39.60). The
expression levels of the four transcripts, INS-IGF2,
INS, INSdel, and IGF2 version 2, were all
clearly higher in one of the insulinomas (case 42; Fig. 3).
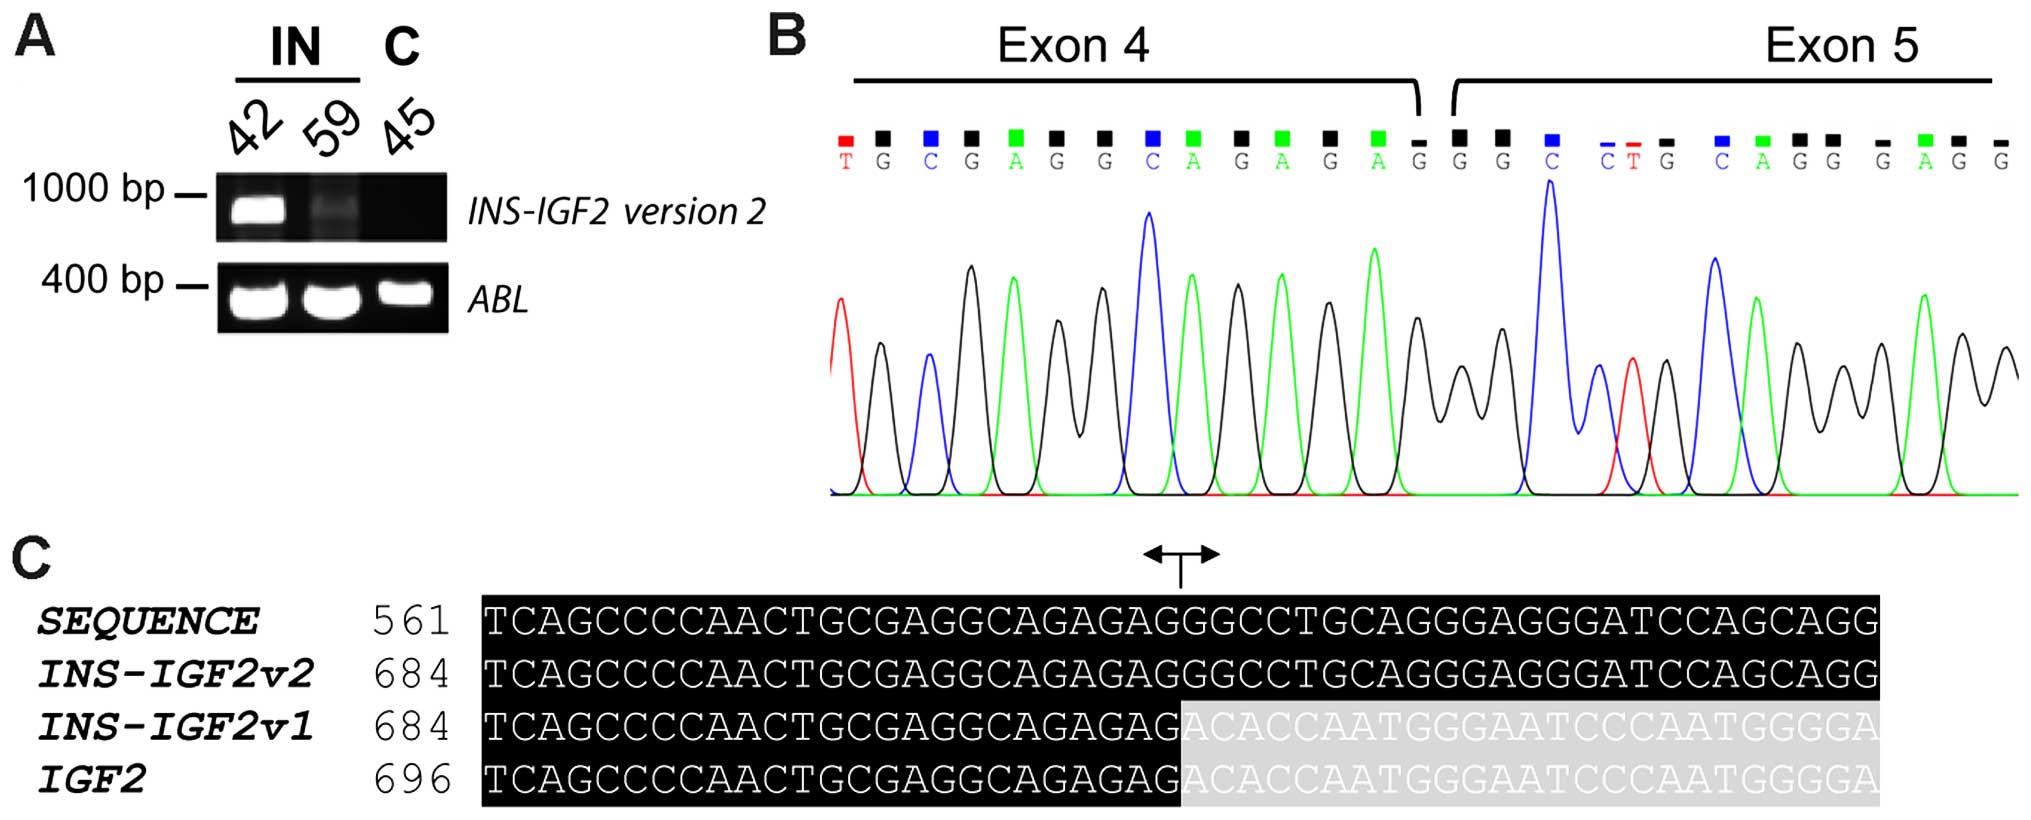
Molecular genetic confirmation of
different INS-IGF2 transcripts
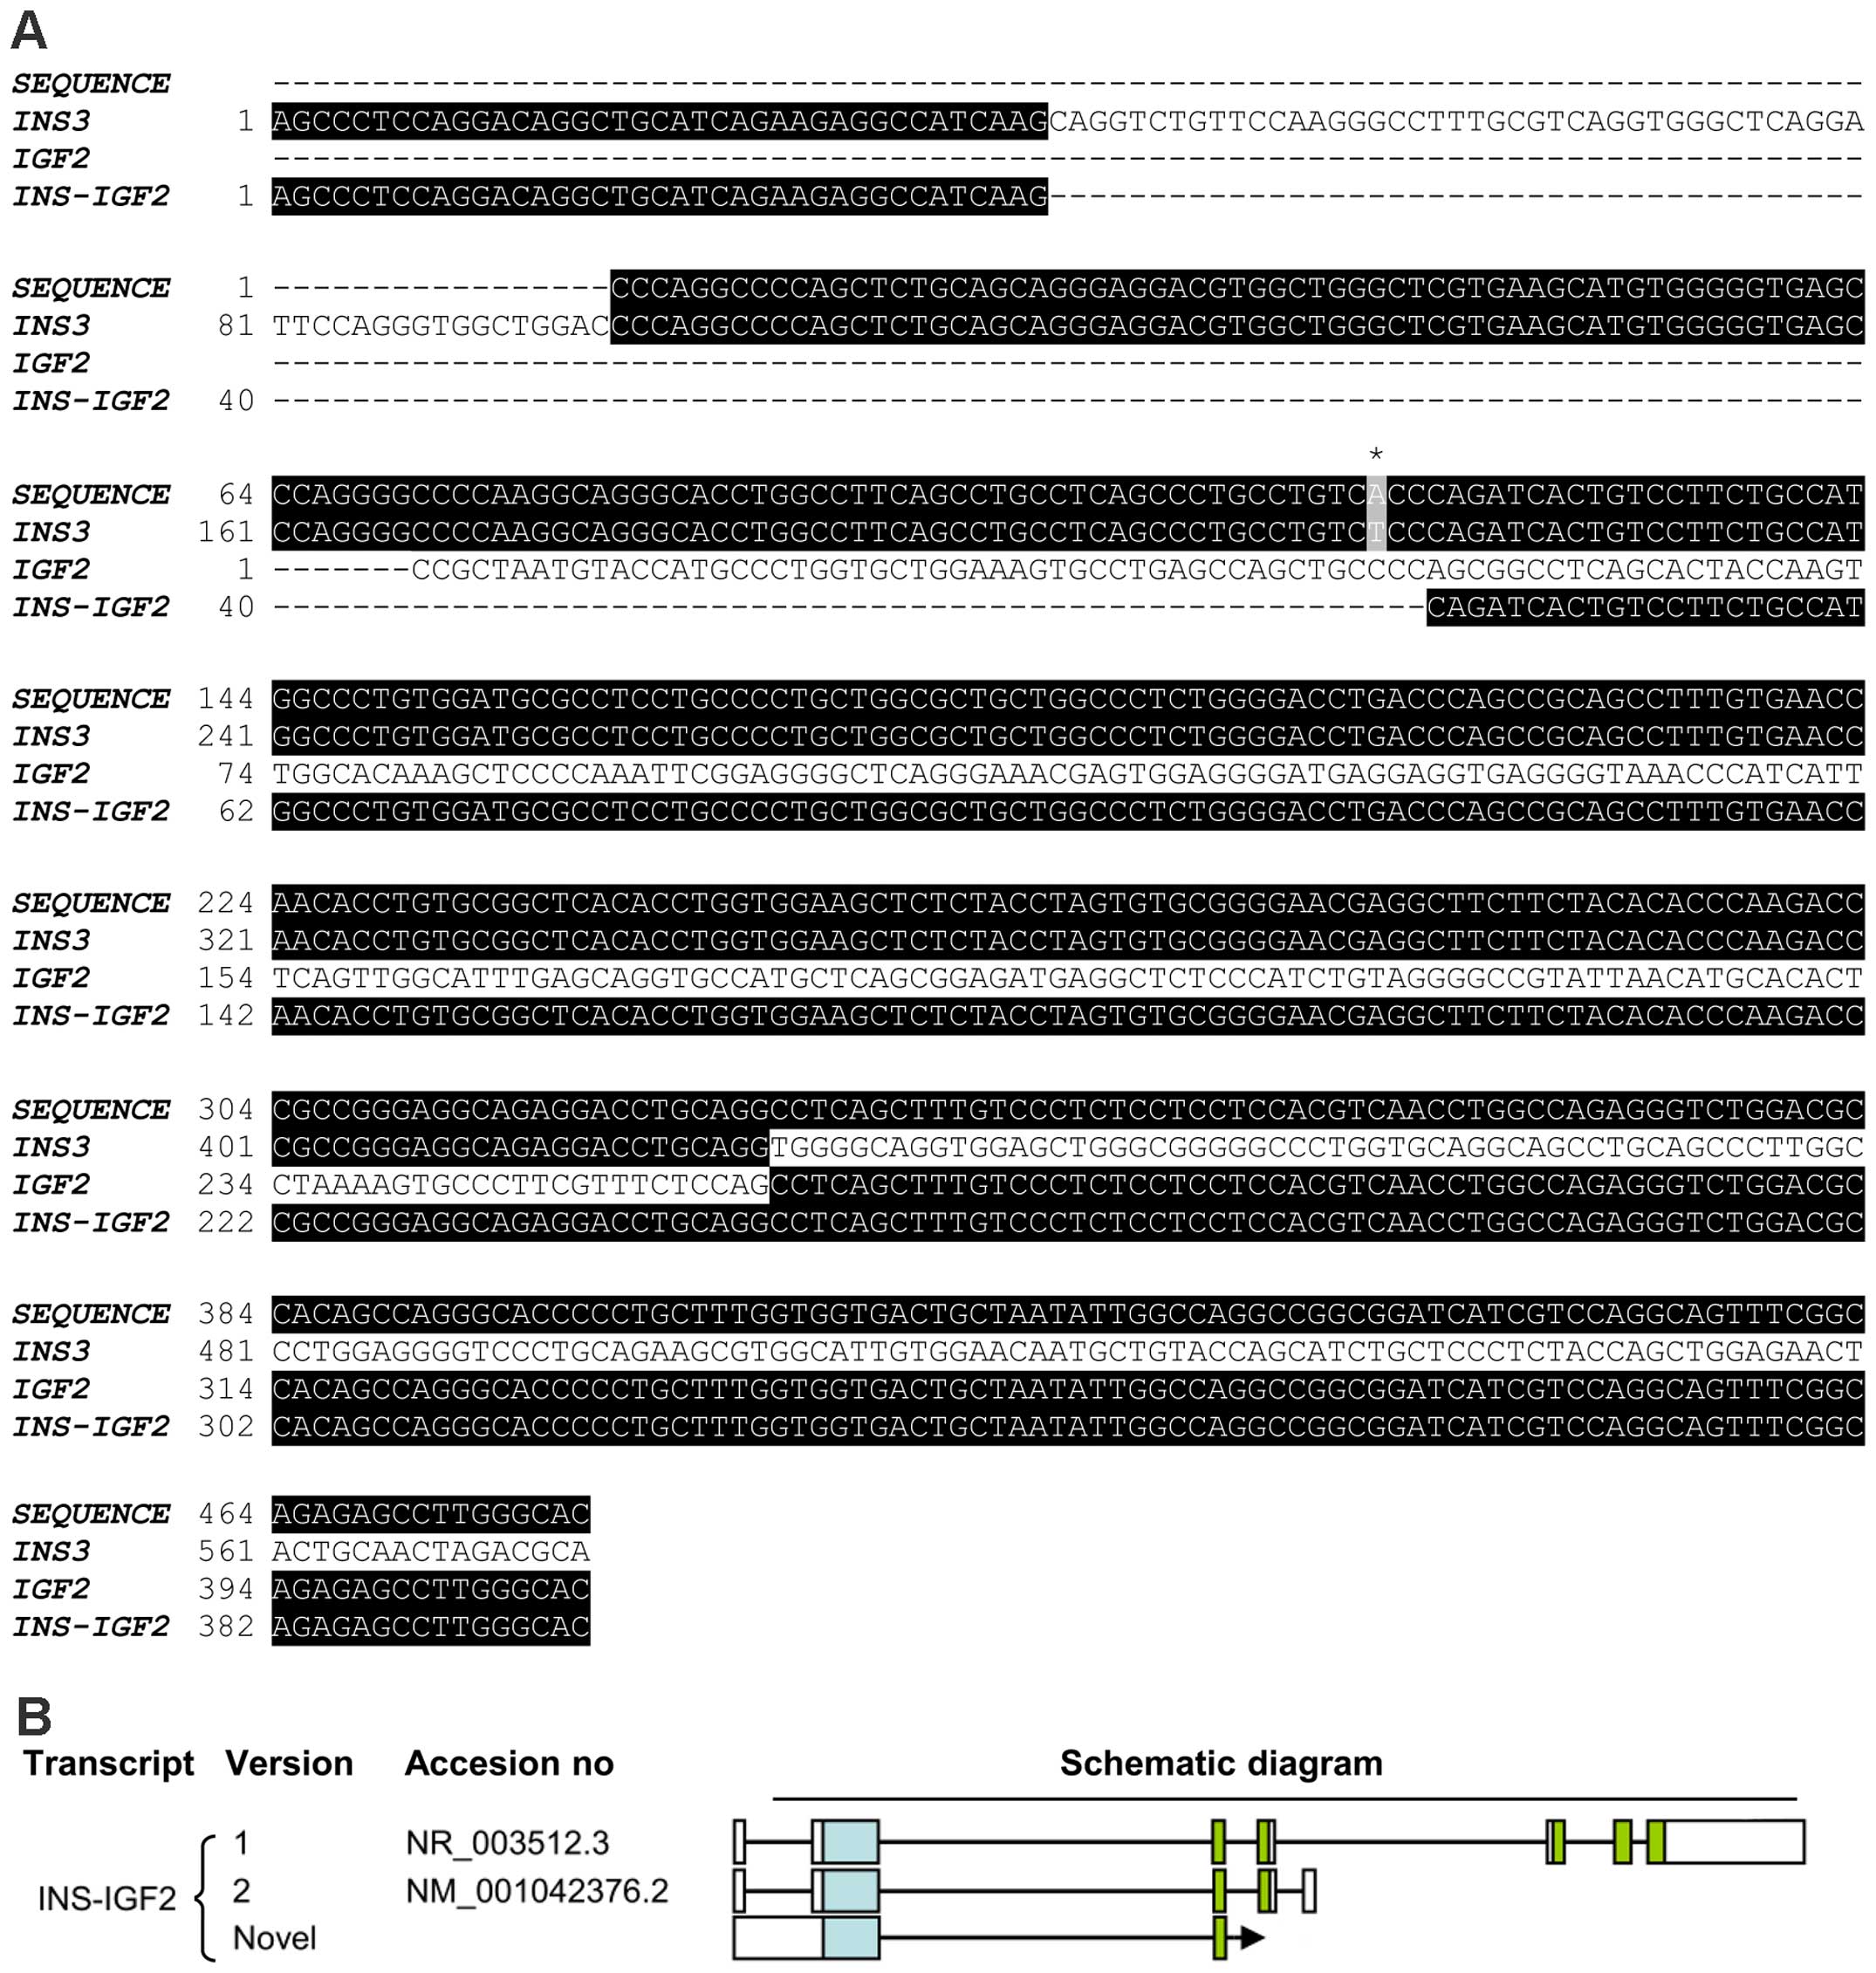
Two INS-IGF2 transcripts have been described
(Fig. 1) (22). Transcript version 1 is a long
transcript that is a candidate for nonsense mediated decay (NMD;
accession no. NR_003512.3). Transcript version 2 is translated into
a protein of 200 aa (accession no. NM_001042376.2). As translation
of INS-IGF2 transcript into protein may be dependent upon
the version of INS-IGF2 transcript present, we performed
additional PCR-analyses with primers specific for either transcript
version 1 or transcript version 2 of INS-IGF2. We were not
able to detect the transcript version 1 of INS-IGF2 (data
not shown). However, a PCR fragment for transcript version 2 was
detected in the two insulinomas but not in the normal control
(Fig. 4A). Sanger sequencing of the
PCR-fragment confirmed that this fragment was the transcript
version 2 of INS-IGF2 (Fig. 4B
and C).
Alternative splicing in the 5′-untranslated region
of INS gives rise to four INS transcripts coding for
the same protein (http://www.ncbi.nlm.nih.gov/nucleotide/) (Fig. 1). The first 26 bp of intron 1 in the
INS1-transcript are present in exon 1 of the INS2-4
transcripts and has been postulated to increase the translational
efficiency of the INS protein (23). In insulinomas, increased expression
of the INS2-transcript has been reported (23). As INS and INS-IGF2
share the same transcriptional start site, we wanted to investigate
whether the alternative splicing mechanisms described for
INS, regulating a switch from INS1 to INS2,
may also affect the INS-IGF2 read-through transcript.
PCR-analysis of the 5′-untranslated region of INS-IGF2 and
INS using a forward primer specific for the reported 5′ 26
bp intron 1 sequence of INS1 (23), the forward primer only recognizing
INS2-4, detected high expression of INS in the two
insulinomas (Fig. 5A). In one of
them (case 59), two bands were detected. Sanger sequencing
identified the higher band in case 59 as INS3, the lower
band had a readable sequence found in all four INS isoforms,
identifying this band as INS2 and/or INS4. For
INS-IGF2, a band with a higher molecular weight than
expected was detected in case 59 (Fig.
5B). Sanger sequencing identified this fragment as a novel
splice variant of INS-IGF2, containing exon 1 of INS3
spliced to exon 1 of IGF2 (Fig.
6A and B). Upon examination of the novel INS-IGF2
transcript and the INS3 transcript expressed in case 59, we
found them to have the A allele of the SNP rs689 (located at bp 216
in the INS3 transcript) (Fig.
5C and Fig 6A). The sequence
containing SNP rs689 can only be found in exon 1 of INS3,
not in exons of INS1, INS2 and INS4 (Fig. 1).
Discussion
Fusion genes are known to be produced by chromosomal
rearrangements including small deletions, as exemplified by
TMPRSS2-ERG in prostate cancer where two genes mapping to
chromosome 21 are fused (24).
Recently, many chimeric RNAs where adjacent genes are fused have
been identified (25,26). These fusion transcripts have been
described by the terms 'gene read-through' and 'co-transcription
and intergenic splicing' (27).
Such read-through transcripts have been detected in different
malignancies like prostate cancer (showing a SLC45A3-ELK4
transcript) (25, 26) and melanoma (with a CDK2-RAB5B
transcript) (28). In addition to
giving rise to new chimeric proteins or entirely novel proteins,
read-through transcripts have been suggested to play a regulatory
role by altering the expression of the parent genes (27).
Here we demonstrated, for the first time, expression
of an INS-IGF2 read-through transcript in insulinomas. In
some instances, the chimeric transcripts found by computation
analysis of transcriptome sequencing data are false positives due
to algorithm artefacts; these 'fusions' are not detectable by
PCR-based methods. We could clearly detect the INS-IGF2
fusion transcript, identified as a fusion partner upon
RNA-sequencing, by PCR-based methods, indicating that this is
indeed a true fusion transcript.
The INS and IGF2 genes are located
sequentially in a large imprinted domain on chromosome subband
11p15.5 (Fig. 1). Two
INS-IGF2 read-through transcripts have been described that
are splice variants of INS and exons of the IGF2-gene
(22). Transcript 1 (long form,
accession no. NR_003512.3) contains exons 1 and 2 of INS1
and the 3′ part of exon 1 of IGF2 version 2 starting at bp
259, followed by exons 2–5 of IGF2 version 2. Transcript 2
(short form, accession no. NM_001042376.2) contains exons 1 and 2
of INS1 and the 3′ part of exon 1 of IGF2 version 2
starting at bp 259, followed by exon 2 of IGF2 version 2 and
an additional exon following exon 2 in the IGF2 locus that
is not present in the IGF2 transcripts (Fig. 1) (22).
Transcript 2 of INS-IGF2 encodes a protein
which shares the N-terminus with the INS protein (signal peptide,
B-chain, and eight amino acids of the C-peptide) and has a
C-terminus containing the coding sequences of the two proximal ORFs
of the IGF2 gene. The IGF2-part of the INS-IGF2 protein
stems from noncoding exons in the IGF2 gene that give rise
to a novel 138-amino acid C-terminal region unrelated to
prepro-IGF2 (22). Recently,
however, Wernersson et al (29) found that although transcript 2 of
INS-IGF2 can be translated (22), expression of the INS-IGF2 protein in
human β-cells was below the detection level in proteomic analysis.
Transcript variant 1 of INS-IGF2 is bisistronic, containing
ORFs both for INS-IGF2 (same sequence as in transcript
variant 2) and IGF2 (transcript variant 2) (22). INS-IGF2 transcript variant 1
is a candidate for NMD as the primary ORF (INS-IGF2) has the
stop codon more than 50 nucleotides from the terminal splice site.
Therefore, it remains uncertain whether or not the two ORFs in
transcript variant 1 are translated. Notably, our data showed that
transcript variant 2 of INS-IGF2 is expressed in the
insulinomas (Fig. 4), although
conclusions regarding protein expression can not be made, this
indicates that the INS-IGF2 chimeric protein may be expressed.
Although the precise function of the INS-IGF2 protein remains
unidentified, Kanatsuna et al (30,31)
recently found INS-IGF2 to be recognized by autoantibodies
associated with diabetes mellitus type 1 (DM1). In DM1, pancreatic
β-cells are destroyed due to the recognition of pancreatic islets
autoantigens, like insulin, by autoreactive T lymphocytes leading
to a T-lymphocyte-mediated immune response (32,33).
The appearance of several autoantibodies towards these pancreatic
islets autoantigens is a sign of autoimmunity (32). The authors therefore suggested that
INS-IGF2 may enhance the ability of insulin to trigger the
development of DM1 (30,31).
Normal INS-IGF2 expression is restricted to
the limbs, eyes, and pancreas (22,30).
In the limbs and eyes, INS-IGF2 expression is maternally
imprinted. However, in the pancreas the expression of
INS-IGF2 is biallelic (22).
Specific detection of the short transcript of INS-IGF2
demonstrated restricted expression in the human pancreas and eyes
only (22). As the INS-IGF2
read-through expression is controlled by the INS
transcriptional start site, one would expect the INS and
INS-IGF2 transcripts to show the same pattern of expression
in insulinomas. We found INS expression to be higher in
insulinomas compared to the control sample (Fig. 3). The same pattern of expression
could be seen for INS-IGF2 although the relative expression
of INS was 2×10³–4×10⁴ times higher
than that of INS-IGF2 in insulinomas. Notably, in a recent
reanalysis of deep RNA sequencing data originally published by Nica
et al (34), Wernersson
et al (29) found the
INS-IGF2 transcript in β-cells to have a >20,000 fold
lower expression than the INS transcript (29), which is in line with our findings in
insulinomas. Additionally, INS-IGF2 expression was below the
detection level in our normal pancreatic tissue control (Fig. 3), in line with Wernersson et
al (29) who found
INS-IGF2 expression to be barely detectable in normal
pancreatic tissue. Kim et al (35) states that read-through transcripts
are expressed at extremely low levels in human tissues with
read-through transcripts showing a tumor-biased expression.
Increased expression-level of read-through transcripts and
increased number of read-through transcripts expressed seems
therefore to be a cancer-specific event (35).
Increased INS protein production in insulinomas can
in part be explained by increased expression of the INS2
splice variant of INS where a 26 bp of intron 1 in
INS1 is retained, changing the 5′-untranslated region
(23). This splice variant has
increased translation efficiency and the ratio of this splice
variant to normal INS is increased more than 50-fold in
insulinomas (23). We found
INS2 and/or INS4 to be highly expressed in
insulinomas but we were not able to detect an INS-IGF2
transcript with the retained 26 bp of intron 1 in INS1
(exons 1 and 2 of INS2 fused to exon 1 of IGF2),
indicating that the splicing mechanisms regulating a switch from
INS1 to INS2 expression does not affect the
INS-IGF2 transcript. Notably, however, in one case (case 59)
we found transcripts with the A allele of the SNP rs689 which has
been demonstrated to alter the efficiency of intron 1 splicing in
INS1, resulting in the expression of longer isoforms
(36). In case 59, we found the
expression of the longest INS transcript, INS3, and,
of note, a novel INS-IGF2 transcript containing exon 1 of
INS3 fused to exon 1 of IGF2 (Figs. 5 and 6). Both transcripts may be explained by
the effect of the A allele of the SNP rs689 on splicing of intron 1
in INS1, indicating that the splicing mechanism affected by
SNP rs689 similarly affects INS and INS-IGF2. The A
allele of SNP rs689 is associated with increased methylation of
neighboring CpGs, especially CpG-180 whose hypermethylation is
associated with DM1 (37).
Furthermore, the AA genotype of the SNP rs689 is associated with
DM1-risk and positivity for insulin autoantibodies (38). Based on our results we cannot
determine whether case 59 has an AT or AA genotype of the SNP
rs689.
Dejeux et al (39) demonstrated a correlation between
differentially methylated region 2 (DMR2) hypermethylation and
overexpression of IGF2 both at the RNA and the protein
level. Gain of methylation in the DMR2 of the IGF2 gene
distinguishes insulinomas from other PNETs (39). In correlation with the findings by
Dejeux et al (39) we found
IGF2-expression to be increased in the two insulinomas.
Interestingly, IGF2 is a regulator of cyclin D1, which has been
detected in 36% of insulinomas (40), by activation of Akt upon binding to
its receptor IGF-R type 2.
Based on the present results, we cannot but
speculate on the mechanism behind the expression of the
INS-IGF2 read-through, whether it is due to genomic
rearrangement or trans-splicing. A combination of the two
mechanisms is also possible. The identification of the increased
expression of the INS-IGF2 read-through transcript in tumor
tissue but not in the normal pancreatic tissue used as a control,
suggests that this may be a cancer-specific event. Although further
studies are required, our findings may have clinical applications
as INS-IGF2 could potentially be a biomarker candidate for
insulinoma patients.
Acknowledgments
This study was supported by grants from the
Norwegian Cancer Society; the Research Council of Norway through
its Centres of Excellence funding scheme, project no. 179571;
Carcinor, the Norwegian patient advocacy association for
neuroendocrine cancer; the Norwegian Society of Gastroenterology,
and the Henrik Homan Foundation. The authors thank Lisbeth Haugom
and Dr Jim Thorsen for expert technical help.
References
|
1
|
Service FJ, McMahon MM, O'Brien PC and
Ballard DJ: Functioning insulinoma-incidence, recurrence, and
long-term survival of patients: A 60-year study. Mayo Clin Proc.
66:711–719. 1991. View Article : Google Scholar : PubMed/NCBI
|
|
2
|
Hirshberg B, Livi A, Bartlett DL, Libutti
SK, Alexander HR, Doppman JL, Skarulis MC and Gorden P:
Forty-eight-hour fast: The diagnostic test for insulinoma. J Clin
Endocrinol Metab. 85:3222–3226. 2000. View Article : Google Scholar : PubMed/NCBI
|
|
3
|
Sarmiento JM, Que FG, Grant CS, Thompson
GB, Farnell MB and Nagorney DM: Concurrent resections of pancreatic
islet cell cancers with synchronous hepatic metastases: Outcomes of
an aggressive approach. Surgery. 132:976–982; discussion 982–983.
2002. View Article : Google Scholar : PubMed/NCBI
|
|
4
|
Danforth DN Jr, Gorden P and Brennan MF:
Metastatic insulin-secreting carcinoma of the pancreas: Clinical
course and the role of surgery. Surgery. 96:1027–1037.
1984.PubMed/NCBI
|
|
5
|
Hirshberg B, Cochran C, Skarulis MC,
Libutti SK, Alexander HR, Wood BJ, Chang R, Kleiner DE and Gorden
P: Malignant insulinoma: Spectrum of unusual clinical features.
Cancer. 104:264–272. 2005. View Article : Google Scholar : PubMed/NCBI
|
|
6
|
La Rosa S, Pariani D, Calandra C, Marando
A, Sessa F, Cortese F and Capella C: Ectopic duodenal insulinoma: A
very rare and challenging tumor type. Description of a case and
review of the literature. Endocr Pathol. 24:213–219. 2013.
View Article : Google Scholar : PubMed/NCBI
|
|
7
|
Stefanini P, Carboni M, Patrassi N and
Basoli A: Beta-islet cell tumors of the pancreas: Results of a
study on 1,067 cases. Surgery. 75:597–609. 1974.PubMed/NCBI
|
|
8
|
Haugvik SP, Marangos IP, Røsok BI,
Pomianowska E, Gladhaug IP, Mathisen O and Edwin B: Long-term
outcome of laparoscopic surgery for pancreatic neuroendocrine
tumors. World J Surg. 37:582–590. 2013. View Article : Google Scholar
|
|
9
|
Jonkers YM, Ramaekers FC and Speel EJ:
Molecular alterations during insulinoma tumorigenesis. Biochim
Biophys Acta. 1775:313–332. 2007.PubMed/NCBI
|
|
10
|
Capurso G, Festa S, Valente R, Piciucchi
M, Panzuto F, Jensen RT and Delle Fave G: Molecular pathology and
genetics of pancreatic endocrine tumours. J Mol Endocrinol.
49:R37–R50. 2012. View Article : Google Scholar : PubMed/NCBI
|
|
11
|
Speel EJ, Scheidweiler AF, Zhao J, Matter
C, Saremaslani P, Roth J, Heitz PU and Komminoth P: Genetic
evidence for early divergence of small functioning and
nonfunctioning endocrine pancreatic tumors: Gain of 9Q34 is an
early event in insulinomas. Cancer Res. 61:5186–5192.
2001.PubMed/NCBI
|
|
12
|
Jonkers YM, Claessen SM, Feuth T, van
Kessel AG, Ramaekers FC, Veltman JA and Speel EJ: Novel candidate
tumour suppressor gene loci on chromosomes 11q23-24 and 22q13
involved in human insulinoma tumourigenesis. J Pathol. 210:450–458.
2006. View Article : Google Scholar : PubMed/NCBI
|
|
13
|
Jonkers YM, Claessen SM, Perren A, Schmid
S, Komminoth P, Verhofstad AA, Hofland LJ, de Krijger RR, Slootweg
PJ, Ramaekers FC, et al: Chromosomal instability predicts
metastatic disease in patients with insulinomas. Endocr Relat
Cancer. 12:435–447. 2005. View Article : Google Scholar : PubMed/NCBI
|
|
14
|
Speel EJ, Richter J, Moch H, Egenter C,
Saremaslani P, Rütimann K, Zhao J, Barghorn A, Roth J, Heitz PU, et
al: Genetic differences in endocrine pancreatic tumor subtypes
detected by comparative genomic hybridization. Am J Pathol.
155:1787–1794. 1999. View Article : Google Scholar : PubMed/NCBI
|
|
15
|
Chung DC, Brown SB, Graeme-Cook F,
Tillotson LG, Warshaw AL, Jensen RT and Arnold A: Localization of
putative tumor suppressor loci by genome-wide allelotyping in human
pancreatic endocrine tumors. Cancer Res. 58:3706–3711.
1998.PubMed/NCBI
|
|
16
|
Stumpf E, Aalto Y, Höög A, Kjellman M,
Otonkoski T, Knuutila S and Andersson LC: Chromosomal alterations
in human pancreatic endocrine tumors. Genes Chromosomes Cancer.
29:83–87. 2000. View Article : Google Scholar : PubMed/NCBI
|
|
17
|
Zhao J, Moch H, Scheidweiler AF, Baer A,
Schäffer AA, Speel EJ, Roth J, Heitz PU and Komminoth P: Genomic
imbalances in the progression of endocrine pancreatic tumors. Genes
Chromosomes Cancer. 32:364–372. 2001. View Article : Google Scholar : PubMed/NCBI
|
|
18
|
Capdeville R, Buchdunger E, Zimmermann J
and Matter A: Glivec (STI571, imatinib), a rationally developed,
targeted anticancer drug. Nat Rev Drug Discov. 1:493–502. 2002.
View Article : Google Scholar : PubMed/NCBI
|
|
19
|
Haugvik SP, Gorunova L, Haugom L, Eibak
AM, Gladhaug IP, Heim S and Micci F: Loss of 11p11 is a frequent
and early event in sporadic nonfunctioning pancreatic
neuroendocrine neoplasms. Oncol Rep. 32:906–912. 2014.PubMed/NCBI
|
|
20
|
Ge H, Liu K, Juan T, Fang F, Newman M and
Hoeck W: FusionMap: Detecting fusion genes from next-generation
sequencing data at base-pair resolution. Bioinformatics.
27:1922–1928. 2011. View Article : Google Scholar : PubMed/NCBI
|
|
21
|
Livak KJ and Schmittgen TD: Analysis of
relative gene expression data using real-time quantitative PCR and
the 2−ΔΔCTmethod. Methods. 25:402–408. 2001. View Article : Google Scholar
|
|
22
|
Monk D, Sanches R, Arnaud P, Apostolidou
S, Hills FA, Abu-Amero S, Murrell A, Friess H, Reik W, Stanier P,
et al: Imprinting of IGF2 P0 transcript and novel alternatively
spliced INS-IGF2 isoforms show differences between mouse and human.
Hum Mol Genet. 15:1259–1269. 2006. View Article : Google Scholar : PubMed/NCBI
|
|
23
|
Minn AH, Kayton M, Lorang D, Hoffmann SC,
Harlan DM, Libutti SK and Shalev A: Insulinomas and expression of
an insulin splice variant. Lancet. 363:363–367. 2004. View Article : Google Scholar : PubMed/NCBI
|
|
24
|
Yoshimoto M, Joshua AM, Chilton-Macneill
S, Bayani J, Selvarajah S, Evans AJ, Zielenska M and Squire JA:
Three-color FISH analysis of TMPRSS2/ERG fusions in prostate cancer
indicates that genomic microdeletion of chromosome 21 is associated
with rearrangement. Neoplasia. 8:465–469. 2006. View Article : Google Scholar : PubMed/NCBI
|
|
25
|
Rickman DS, Pflueger D, Moss B, VanDoren
VE, Chen CX, de la Taille A, Kuefer R, Tewari AK, Setlur SR,
Demichelis F, et al: SLC45A3-ELK4 is a novel and frequent
erythroblast transformation-specific fusion transcript in prostate
cancer. Cancer Res. 69:2734–2738. 2009. View Article : Google Scholar : PubMed/NCBI
|
|
26
|
Zhang Y, Gong M, Yuan H, Park HG, Frierson
HF and Li H: Chimeric transcript generated by cis-splicing of
adjacent genes regulates prostate cancer cell proliferation. Cancer
Discov. 2:598–607. 2012. View Article : Google Scholar : PubMed/NCBI
|
|
27
|
Prakash T, Sharma VK, Adati N, Ozawa R,
Kumar N, Nishida Y, Fujikake T, Takeda T and Taylor TD: Expression
of conjoined genes: Another mechanism for gene regulation in
eukaryotes. PLoS One. 5:e132842010. View Article : Google Scholar : PubMed/NCBI
|
|
28
|
Berger MF, Levin JZ, Vijayendran K,
Sivachenko A, Adiconis X, Maguire J, Johnson LA, Robinson J,
Verhaak RG, Sougnez C, et al: Integrative analysis of the melanoma
transcriptome. Genome Res. 20:413–427. 2010. View Article : Google Scholar : PubMed/NCBI
|
|
29
|
Wernersson R, Frogne T, Rescan C, Hansson
L, Bruun C, Grønborg M, Jensen JN and Madsen OD: Analysis artefacts
of the INS-IGF2 fusion transcript. BMC Mol Biol. 16:132015.
View Article : Google Scholar : PubMed/NCBI
|
|
30
|
Kanatsuna N, Taneera J, Vaziri-Sani F,
Wierup N, Larsson HE, Delli A, Skärstrand H, Balhuizen A, Bennet H,
Steiner DF, et al: Autoimmunity against INS-IGF2 protein expressed
in human pancreatic islets. J Biol Chem. 288:29013–29023. 2013.
View Article : Google Scholar : PubMed/NCBI
|
|
31
|
Kanatsuna N, Delli A, Andersson C, Nilsson
AL, Vaziri-Sani F, Larsson K, Carlsson A, Cedervall E, Jönsson B,
Neiderud J, et al: Doubly reactive INS-IGF2 autoantibodies in
children with newly diagnosed autoimmune (type 1) diabetes. Scand J
Immunol. 82:361–369. 2015. View Article : Google Scholar : PubMed/NCBI
|
|
32
|
Skyler JS: Immune intervention for type 1
diabetes mellitus. Int J Clin Pract Suppl. 65:61–70. 2011.
View Article : Google Scholar
|
|
33
|
Moser A, Hsu HT and van Endert P: Beta
cell antigens in type 1 diabetes: Triggers in pathogenesis and
therapeutic targets. F1000 Biol Rep. 2:752010.PubMed/NCBI
|
|
34
|
Nica AC, Ongen H, Irminger JC, Bosco D,
Berney T, Antonarakis SE, Halban PA and Dermitzakis ET: Cell-type,
allelic, and genetic signatures in the human pancreatic beta cell
transcriptome. Genome Res. 23:1554–1562. 2013. View Article : Google Scholar : PubMed/NCBI
|
|
35
|
Kim RN, Kim A, Choi SH, Kim DS, Nam SH,
Kim DW, Kim DW, Kang A, Kim MY, Park KH, et al: Novel mechanism of
conjoined gene formation in the human genome. Funct Integr
Genomics. 12:45–61. 2012. View Article : Google Scholar : PubMed/NCBI
|
|
36
|
Kralovicova J and Vorechovsky I:
Allele-specific recognition of the 3′ splice site of INS intron 1.
Hum Genet. 128:383–400. 2010. View Article : Google Scholar : PubMed/NCBI
|
|
37
|
Fradin D, Le Fur S, Mille C, Naoui N,
Groves C, Zelenika D, McCarthy MI, Lathrop M and Bougnères P:
Association of the CpG methylation pattern of the proximal insulin
gene promoter with type 1 diabetes. PLoS One. 7:e362782012.
View Article : Google Scholar : PubMed/NCBI
|
|
38
|
Lempainen J, Härkönen T, Laine A, Knip M
and Ilonen J: Finnish Pediatric Diabetes Register: Associations of
polymorphisms in non-HLA loci with autoantibodies at the diagnosis
of type 1 diabetes: INS and IKZF4 associate with insulin
autoantibodies. Pediatr Diabetes. 14:490–496. 2013. View Article : Google Scholar : PubMed/NCBI
|
|
39
|
Dejeux E, Olaso R, Dousset B, Audebourg A,
Gut IG, Terris B and Tost J: Hypermethylation of the IGF2
differentially methylated region 2 is a specific event in
insulinomas leading to loss-of-imprinting and overexpression.
Endocr Relat Cancer. 16:939–952. 2009. View Article : Google Scholar : PubMed/NCBI
|
|
40
|
Chung DC, Brown SB, Graeme-Cook F, Seto M,
Warshaw AL, Jensen RT and Arnold A: Overexpression of cyclin D1
occurs frequently in human pancreatic endocrine tumors. J Clin
Endocrinol Metab. 85:4373–4378. 2000.PubMed/NCBI
|