Introduction
Colorectal cancer (CRC) is the third most common
cancer worldwide, with more than 1.36 million new cases diagnosed
annually (1) and, in spite of the
existence of targeted therapies, such as those using monoclonal
antibodies against the receptor of the epidermal growth factor
(2), the long-term survival of
patients with advanced metastatic disease remains poor (3). Overexpression of the epidermal growth
factor receptor (EGFR) is an aetiological factor in CRC and thus,
many efforts have been carried out to counterbalance the effects of
EGFR activation. EGFR signalling mainly includes the RAS/MEK/ERK,
PI3K/AKT and PLCγ/PKC cascades, but the SRC tyrosine kinases and
STAT pathways also participate (4).
Members of the RAS family are encoded by three genes, KRAS,
NRAS and HRAS. These genes, particularly KRAS,
are mutated in many cases of cancer (5) and mutations render the proteins
constitutively active (6).
Therefore, patients carrying these mutations are not responsive to
anti-EGFR drugs. The most frequent KRAS mutations in CRC
patients occur in codons 12 and 13 (7), but other mutations also confer
sustained activity to the KRAS protein (8).
Clinical data have revealed that many KRAS
mutations are heterozygous and that the mutant allele may become
dominant when a mutant allele-specific imbalance (MASI) occurs
(9). In CRC, MASI is most
frequently associated with the G13D mutation (10,11).
Altogether, KRAS mutations and MASI contribute to the poor
prognosis of metastatic CRC; therefore, it is important to identify
a strategy by which to surmount the resistance due to KRAS
mutations.
To accomplish this, it is vital to identify novel
potential target genes whose expression depends on KRAS
mutations. The availability of human genome sequence data has
facilitated the identification of the causes of many monogenic
disorders, but the approaches to study complex diseases, such as
cancer, often rely on the analysis of transcriptome data, which can
be properly carried out by means of RNA-seq analysis (12). This method, which has often been
used to analyse the genetic profile of human tumours (see for
instance, refs. 13,14), offers the additional advantage of allowing
the detection of mRNA isoforms resulting from alternative splicing
(15), an event that affects most
of the human genes (16).
In a recent study, we showed that the global
acetylome of CRC cells depends on KRAS mutational status,
several members of the hnRNP family being differentially acetylated
in a mutation-dependent manner (8).
These ribonucleoproteins are involved in pre-mRNA splicing and
export to the cytoplasm (17).
Taking into account that aberrant alternative splicing often causes
several pathologies, cancer included (18), it is vital to identify the genes
whose splicing is altered in connection with KRAS mutation.
In this way, various novel therapeutic targets may be found.
We first addressed this question by means of an
in silico analysis of RNA-seq databases, and then the
presence of mutated KRAS-dependent splicing isoforms in the
candidate genes was experimentally validated. We report in the
present study that two genes, namely ZNF518B and
EPDR1, not only exhibit a pattern of isoform abundance
dependent on KRAS G13D and G12D mutations, but also that the
whole gene expression largely relies on oncogenic KRAS.
Materials and methods
In silico analysis of RNA-seq
data
RNA-seq data were downloaded from the database of
Sequence Read Archive (SRA). They corresponded to the human CRC
cell lines HCT116 (replicate PJ, SRX378081; replicate PF,
SRX378080; replicate, SRX841184), DLD1 (SRX388825), Caco2
(replicate a, SRX209063; replicate b, SRX209064), RKO (ERX183571)
and SW48 (ERX183572).
The RNA-seq files were filtered for quality using
FASTX-Toolkit (http://hannonlab.cshl.edu/fastxtoolkit/). Then, the
human genome (version hg19, ftp://ftp.ensembl.org/pub/release-62/) was indexed
using Bowtie2 (http://bowtie-bio.sourceforge.net/index.shtml) and the
filtered reads were mapped using TopHat v2.0.9 (http://ccb.jhu.edu/software/tophat/index.shtml). The
resulting BAM file was converted to SAM format using Samtools
v0.1.19 (19) and the Integrative
Genomics Viewer (http://www.broadinstitute.org/igv) was used to
visualize the variations in the sequences. Once the respective
mutations in the oncogenes were validated, the BAM file was
processed with the Cufflinks program v2.1.1 (20). The statistical analysis was
performed with the CummeRbund package (http://compbio.mit.edu/cummeRbund/), and for the
alternative splicing analysis the spliceR package (21) was used. The resulting lists of genes
and isoforms were filtered in function of the KRAS G13D
mutation.
Cell culture
The human CRC cell line HCT116 (ATCC CCL-247), DLD1
(ATCC CCL-221) and its isogenic derivative D-Mut1 (a gift from Dr
B. Vogelstein) were grown in McCoys 5A medium (Sigma, St. Louis,
MO, USA). The cell lines RKO (Horizon Discovery, Cambridge, UK) and
Caco-2 (ATCC HTB-37) were grown in Dulbeccos modified Eagles medium
(DMEM) and the cell line SW48 (Horizon), was grown in RPMI-1640
medium (Sigma). Cells further referred to as DWT7m were derived
from the DLD1 cell line. Following knockout of the G13D KRAS
allele, the cells acquired a spontaneous KRAS G12D mutation
in 20% of the cell population, as validated by sequencing in our
laboratory (see below); they were grown in the same medium as that
used for the parental DLD1 cells. All media were supplemented with
10% heat inactivated foetal bovine serum, 1%
penicillin-streptomycin and 1% L-glutamine (Sigma), and the
cultures were carried out at 37°C in a humidified atmosphere
containing 5% CO2. Table
I shows the relevant genotypes and sources of the cell
lines.
 | Table I.Commercial cell lines used in the
present study. |
Table I.
Commercial cell lines used in the
present study.
|
| Relevant
genotype |
|
|---|
|
|
|
|
|---|
| Cell line | KRAS | BRAF | PIK3CA | TP53 | Source |
|---|
| DLD1 | G13D | wt | E545K; D549N | S241F | ATCC CCL-221 |
| HCT116 | G13D | wt | H1047R | wt | ATCC CCL-247 |
| RKO | wt | V600E | H1047R | wt | Horizon
Discovery |
| SW48 | wt | wt | wt | wt | Horizon
Discovery |
| Caco2 | wt | wt | wt | E204X | ATCC HTB-37 |
RNA isolation and RT-qPCR
analysis
Total RNA was isolated using the TRIzol method
(22). RNA (1 µg) was treated with
DNase I [amplification grade (Invitrogen, Carlsbad, CA, USA)] for
20 min at 37°C in a final volume of 10 µl. The reaction was stopped
with 1 µl of 25 mM EDTA and incubation was carried out for 10 min
at 65°C and 1 min at 90°C. RNA was then retrotranscribed with M-MLV
reverse transcriptase (Invitrogen) following the manufacturer's
instructions.
The cDNA was amplified in a 7900HT Fast Real-Time
PCR System (Applied Biosystems, Foster City, CA, USA) using
SYBR-Green (Bio-Rad, Hercules, CA, USA) following the
manufacturer's instructions. Specific primers for each gene and
isoform were used (Table II).
Results were analysed by CFX Manager 2.1 software (Bio-Rad) and the
relative gene expression was calculated according to the ΔΔCq
comparative method (23).
| Table II.Primers used for PCR. |
Table II.
Primers used for PCR.
|
| Primers |
|
|---|
|
|
|
|
|---|
| Gene/isoform | Forward | Reverse | size |
|---|
| ENO1 |
|
|
|
| 2 |
GACTTAGCCGGAGCAGGATG |
GAGAGCATTTCAGGGGCCAT | 100 |
|
1+2 |
CTGTTGGCTACACAGACCCC |
GCGCTAACTAGCAGGGACC | 90 |
| HSP90B1 |
|
|
|
| 1 |
CGGGAAGTGGGGGTGAAAAG |
GGTTCGGATCCTCACACCTC | 83 |
| EPDR1 |
|
|
|
|
Whole |
TGAAACCTGGATTGGCATCTATAC |
TGTAGTTTATGGTAAAGGTTTCCTG | 71 |
| 1 |
GAGAGGAAGGCGCTGATCC |
TGGCTTGGTCAATCTGAAACA | 88 |
| 2a |
GAGGAGGGTCTCTTGGGGAT |
GCTGGGTGTTACTGAGTCCC | 96 |
| 2b |
CGAGGCGGTGGCAGATTATT |
TGCTTGGTGGCTTGGTCAAT | 80 |
| 3 |
GACATGTGGCCCATCTCTGTAG |
ACAATGTTGTCAGCTTCTGCCT | 70 |
| 4 |
TCTCCTACGACGGGCTCA |
AGGTTTCATCTCTTGCAGGG | 79 |
| ZNF518B |
|
|
|
|
1+4+5+6 |
GGGCCTGAGGTTGTGAAACT |
AAAACCGTGGCAAGTCCCAT | 91 |
| 1 |
GCTACAGGCAGGAATGTTACC |
CGCAGTAGGTGCATGATCCC | 75 |
| 2a |
CGGTGTAGACGCCCCTTC |
CAGGTAACACCGGCAGGC | 60 |
| 2b |
CTGCCGGTGTTACCTGGAAT |
GCGCAGCTACTTCTTGGGT | 118 |
| 4 |
AGTTTCGAGGTCATTATTCTCTACT |
CTGCAGGAGACAGCCTGATT | 83 |
|
5+6 |
GCACAGCAGTGTCAAGTCAA |
TAGTCGGCAGGAAGTGAGGG | 78 |
| 6 |
CTGGCGTCGTGGCAAGTG |
CGTGGACTGCCATGAGTTTC | 116 |
| ACTB |
GTGCTATCCCTGTACGCCTC |
GAGGGCATACCCCTCGTAGA | 99 |
Quantitative values are expressed as mean ± SD. Data
in the different qRT-PCR determinations were compared by two-tailed
t-test.
Results
In silico search for genes and
isoforms differentially expressed depending on KRAS G13D
mutation
SW48 cells, which harbour wild-type KRAS,
BRAF, PIK3CA and TP53 (Table I), were used as the control in the
RNA-seq comparisons with the other cell lines. It was verified at
this stage that the cDNA sequences actually contained the mutations
reported in Table I. The reads
showed a mutation coverage ranking between 40–60% for the mutated
allele. It was also validated that neither the control SW48 cells
nor the RKO and Caco2 cells harboured mutation in codon 13. The
presence of the other mutations reported in Table I for the different cell lines was
also verified.
The efficiency of overall mapping was 73.1% for the
data set of the SW48 cell line, 90.9% for RKO cells, 73.3% for
Caco2 (average of the two sets) and an average of 89% was obtained
for the three sets of the HCT116 cell line. The reads from DLD1
were poorly aligned, hovering around 70%. In summary, >70% of
the reads from the total series of data sets were effectively
aligned.
The RNA-seq analysis was carried out as described in
Materials and methods. To accomplish this, we first compared the
RNA-seq data from the HCT116 and DLD1 cell lines with that of SW48
cells to find the list of isoforms differentially present in the
cell lines harbouring the KRAS G13D mutation. Then, the
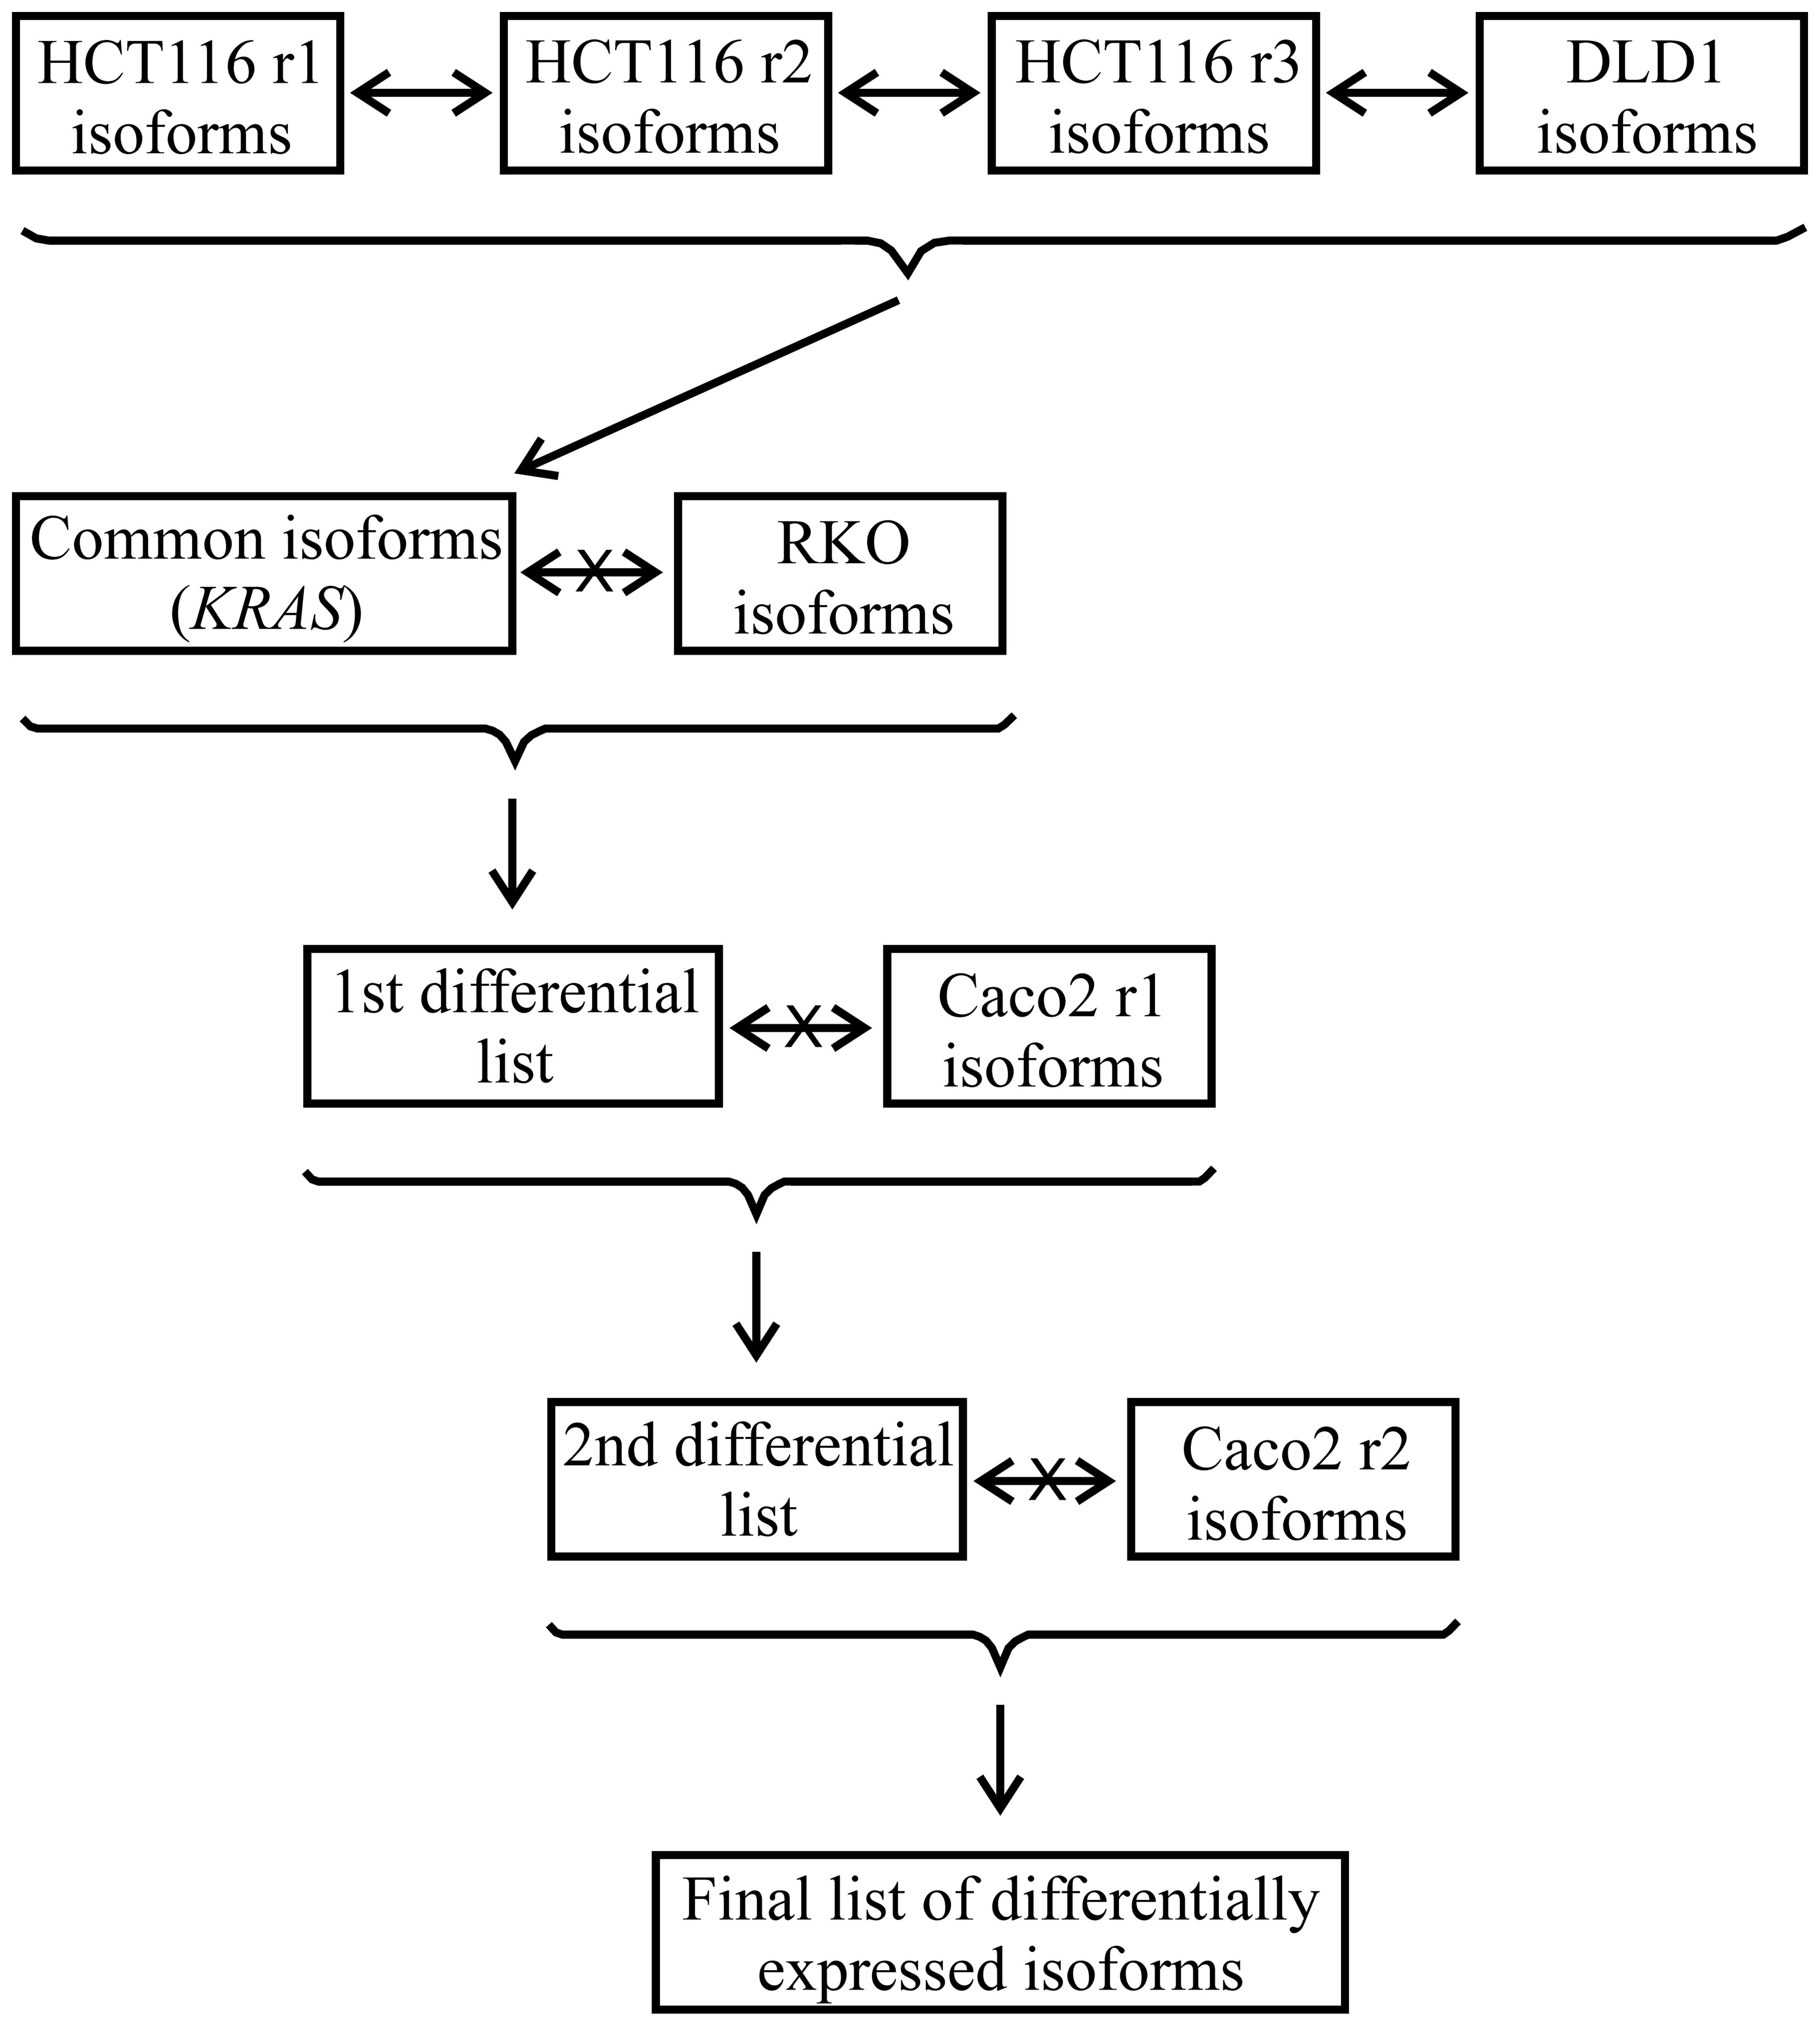
analysis pipeline depicted in the scheme of Fig. 1 was followed. First, the isoform
lists from the DLD1 cells and the three sets (r1, r2 and r3) for
the HCT116 cells were compared. With the isoforms coinciding in all
of the comparisons, a list of isoforms common to the cells with
mutated KRAS and absent from SW48 was constructed.
Comparisons were then sequentially made with the lists from the
other cell lines that are not mutated in KRAS codon 13,
namely RKO and the two duplicates of Caco2 to build lists 1 and 2,
and finally, to generate a final list of isoforms, which contained
those whose expression was found to be related to the KRAS
G13D mutation. These isoforms (Table
II) correspond to the ENO1, RPL13,
ZNF518B, EPDR1 and HSP90B1 genes. The in
silico-determined changes in the expression level of these
isoforms are also provided in Table
II in FPKM units. These results indicate a KRAS
mutation-related overexpression of the ZNF518B,
HSP90B1 and EPDR1 isoforms and a downregulation of
the isoforms of the remaining two genes.
Strategy for RT-qPCR analysis
To validate the results obtained in the in
silico analysis, we carried out an RT-qPCR experiment with
oligonucleotides amplifying every single isoform of the five genes.
First, their exon organization and the composition of the coded
transcripts were retrieved from the Ensembl database information
(release 84, March 2016, http://www.ensembl.org/index.html) and checked with
the manual annotations of the Vega Genome Browser (release 64,
February 2016, http://vega.sanger.ac.uk/index.html). To aid the
interpretation of the following results, a scheme of the exon
organization of the five genes is provided in Fig. 2.
RPL13 has a complex exon organization that
gives rise to 15 different isoforms, resulting from multiple exon
skipping, intron retention, alternative initiation and termination
events. In view of the structure of the gene and of its isoforms
(Fig. 2), it was not possible to
design primers to specifically amplify isoform 5, differentially
expressed in connection with KRAS mutation (Table II). Moreover, this transcript is
not translated to protein, and in view of these circumstances, the
experimental analysis of RPL13 was not carried out.
In the case of genes ENO1, ZNF518B and
EPDR1, both the global expression of the gene and the level
of some of their individual isoforms were experimentally analysed
by RT-qPCR. To do this, the following strategies were followed. The
ENO1 isoform 1, reported by spliceR analysis (Table II), cannot be directly amplified.
It can be amplified along with isoform 2, using primers from exon
14. Isoform 2 can be individually amplified with primers from the
region of the intron between exons 4 and 5, which is retained
exclusively in this isoform. The value for the level of isoform 1
was then obtained by subtracting the experimentally obtained value
for isoform 2 from the value obtained for both isoforms 1 and 2.
Primers from exon 3 can also be designed to amplify together all
the ENO1 isoforms, with the exception of isoform 2, and
therefore, the expression level for whole ENO1 was obtained
by adding the individual value of isoform 2 to that of the
remaining isoforms.
In the case of the EPDR1 gene, it was
possible to design primers to separately analyse the four isoforms.
Isoform 3 can be amplified using a forward primer from exon 1 and a
reverse one from exon 2. To amplify isoform 4, the forward primer
was taken from exon 3, and the reverse primer overlapped exons 3
and 6. To selectively amplify isoform 2, two alternative sets of
primers were used. One of the pairs was taken from exon 4, which is
unique to this isoform, while in the second pair the forward primer
overlapped exons 4 and 5, and the reverse primer came from exon 5.
Both sets of primers gave similar results. Isoform 1 was also able
to be individually amplified with primers from exons 3 and 5.
Finally, to amplify the whole set of transcripts a pair of primers
from the 5′ region of exon 6 was taken.
It was also possible to determine the expression of
all the isoforms of ZNF518B. The expression of isoform 1 was
individually analysed using a forward primer overlapping the
junction of exons 3 and 5 and a reverse primer from the 5′ region
of the latter exon. To analyse isoform 6, primers from exons 2 and
3 were selected. Primers within the intron between exons 3 and 4,
which is retained in isoforms 5 and 6, were used to experimentally
determine both isoforms. Then, by subtracting the value of the
latter from that of the sum of isoforms 5 and 6, the expression of
isoform 5 was obtained. The level of isoform 4 was determined using
a forward primer overlapping the junction of exons 3 and 4 and a
reverse primer from exon 4. The individual PCR analysis of isoform
2 was also carried out with a forward primer within exon 1 and a
reverse primer overlapping the 3′ end of this exon and the 5′ end
of exon 5. Alternatively, isoform 2 was measured with a forward
primer overlapping exons 1 and 5 and with a reverse primer from
exon 5. Both pairs of primers gave similar results in the PCR
experiments. Finally, using primers from the 5′ region of exon 3,
the sum of the expression of the isoforms 1, 4, 5 and 6 was
obtained, and thus the expression of the whole gene was easily
obtained by adding the value corresponding to the isoform 2 to that
of the other four isoforms.
Due to the organization of gene HSP90B1, it
was not possible to obtain a value for the expression of the whole
gene, neither was the analysis of every individual isoform.
Nevertheless, isoform 1, reported by spliceR analysis (Table II), was individually amplified
using a forward primer overlapping the junction of the 3′ end of
exon 12 and the 5′ end of exon 13 and a reverse primer from the
latter exon.
The primers designed as reported above, are listed
in Table III. Their quality was
routinely assessed for the presence of a single amplification
product.
| Table III.In silico detected isoforms
showing differential expression depending on KRAS G13D
mutation. |
Table III.
In silico detected isoforms
showing differential expression depending on KRAS G13D
mutation.
| Gene | Transcript
(TCONS) | ENST id 00000- | Diff. expr. | Splicing type | Protein | FPKM |
|---|
| ENO1 | 00015435 | 234590 | No | 1 ESI, 1 MESI, 1
A3 | 434 res | −160.8 |
| RPL13 | 00087260 | 491523 | No | 1 ISI, 1 A5SS, 1
ATSS, 1 ATTS | No | −818.7 |
| ZNF518B | 00173221 | 507515 | Yes | 1 MESI | 75 res | +6.8 |
| EPDR1 | 00208723 | 425345 | No | 1 ATSS | 163 res | +9.7 |
| HSP90B1 | 00063866 | 299767 | No | − | 803 res | +179.4 |
Experimental validation of the in
silico data
Once the appropriate primers were designed, we then
proceeded to validate the in silico results given in
Table II by RT-qPCR. The
experimental results for EPDR1 and ZNF518B were in
good agreement with those of the in silico analysis
(Fig. 3). A significant
experimental increase was observed in the expression of the
isoforms reported by the spliceR analysis when the cell lines
carrying the KRAS G13D mutation, for instance HCT116 and
DLD1, were compared with lines harbouring wild-type KRAS.
However, the experimental determination did not corroborate, in
general, the results of the in silico analysis in the case
of genes ENO1 and HSP90B1 and only the increase of
the isoform 1 of the latter gene in HCT116 was in accordance with
the previous analysis (Table II).
Therefore, only the genes EPDR1 and ZNF518B were
further experimentally analysed for their global expression and for
the expression of their individual isoforms.
To accomplish this, we used the HCT116, DLD1 and
D-Mut1 (−/G13D) cell lines, the latter derived from
DLD1. DWT7m cells, which spontaneously acquired a G12D mutation in
20% of their single KRAS allele, were also used. The Caco2,
RKO and SW48 cell lines, which harbour wild-type KRAS, were
used for comparative purposes. SW48 was the control cell line used
in the in silico analysis.
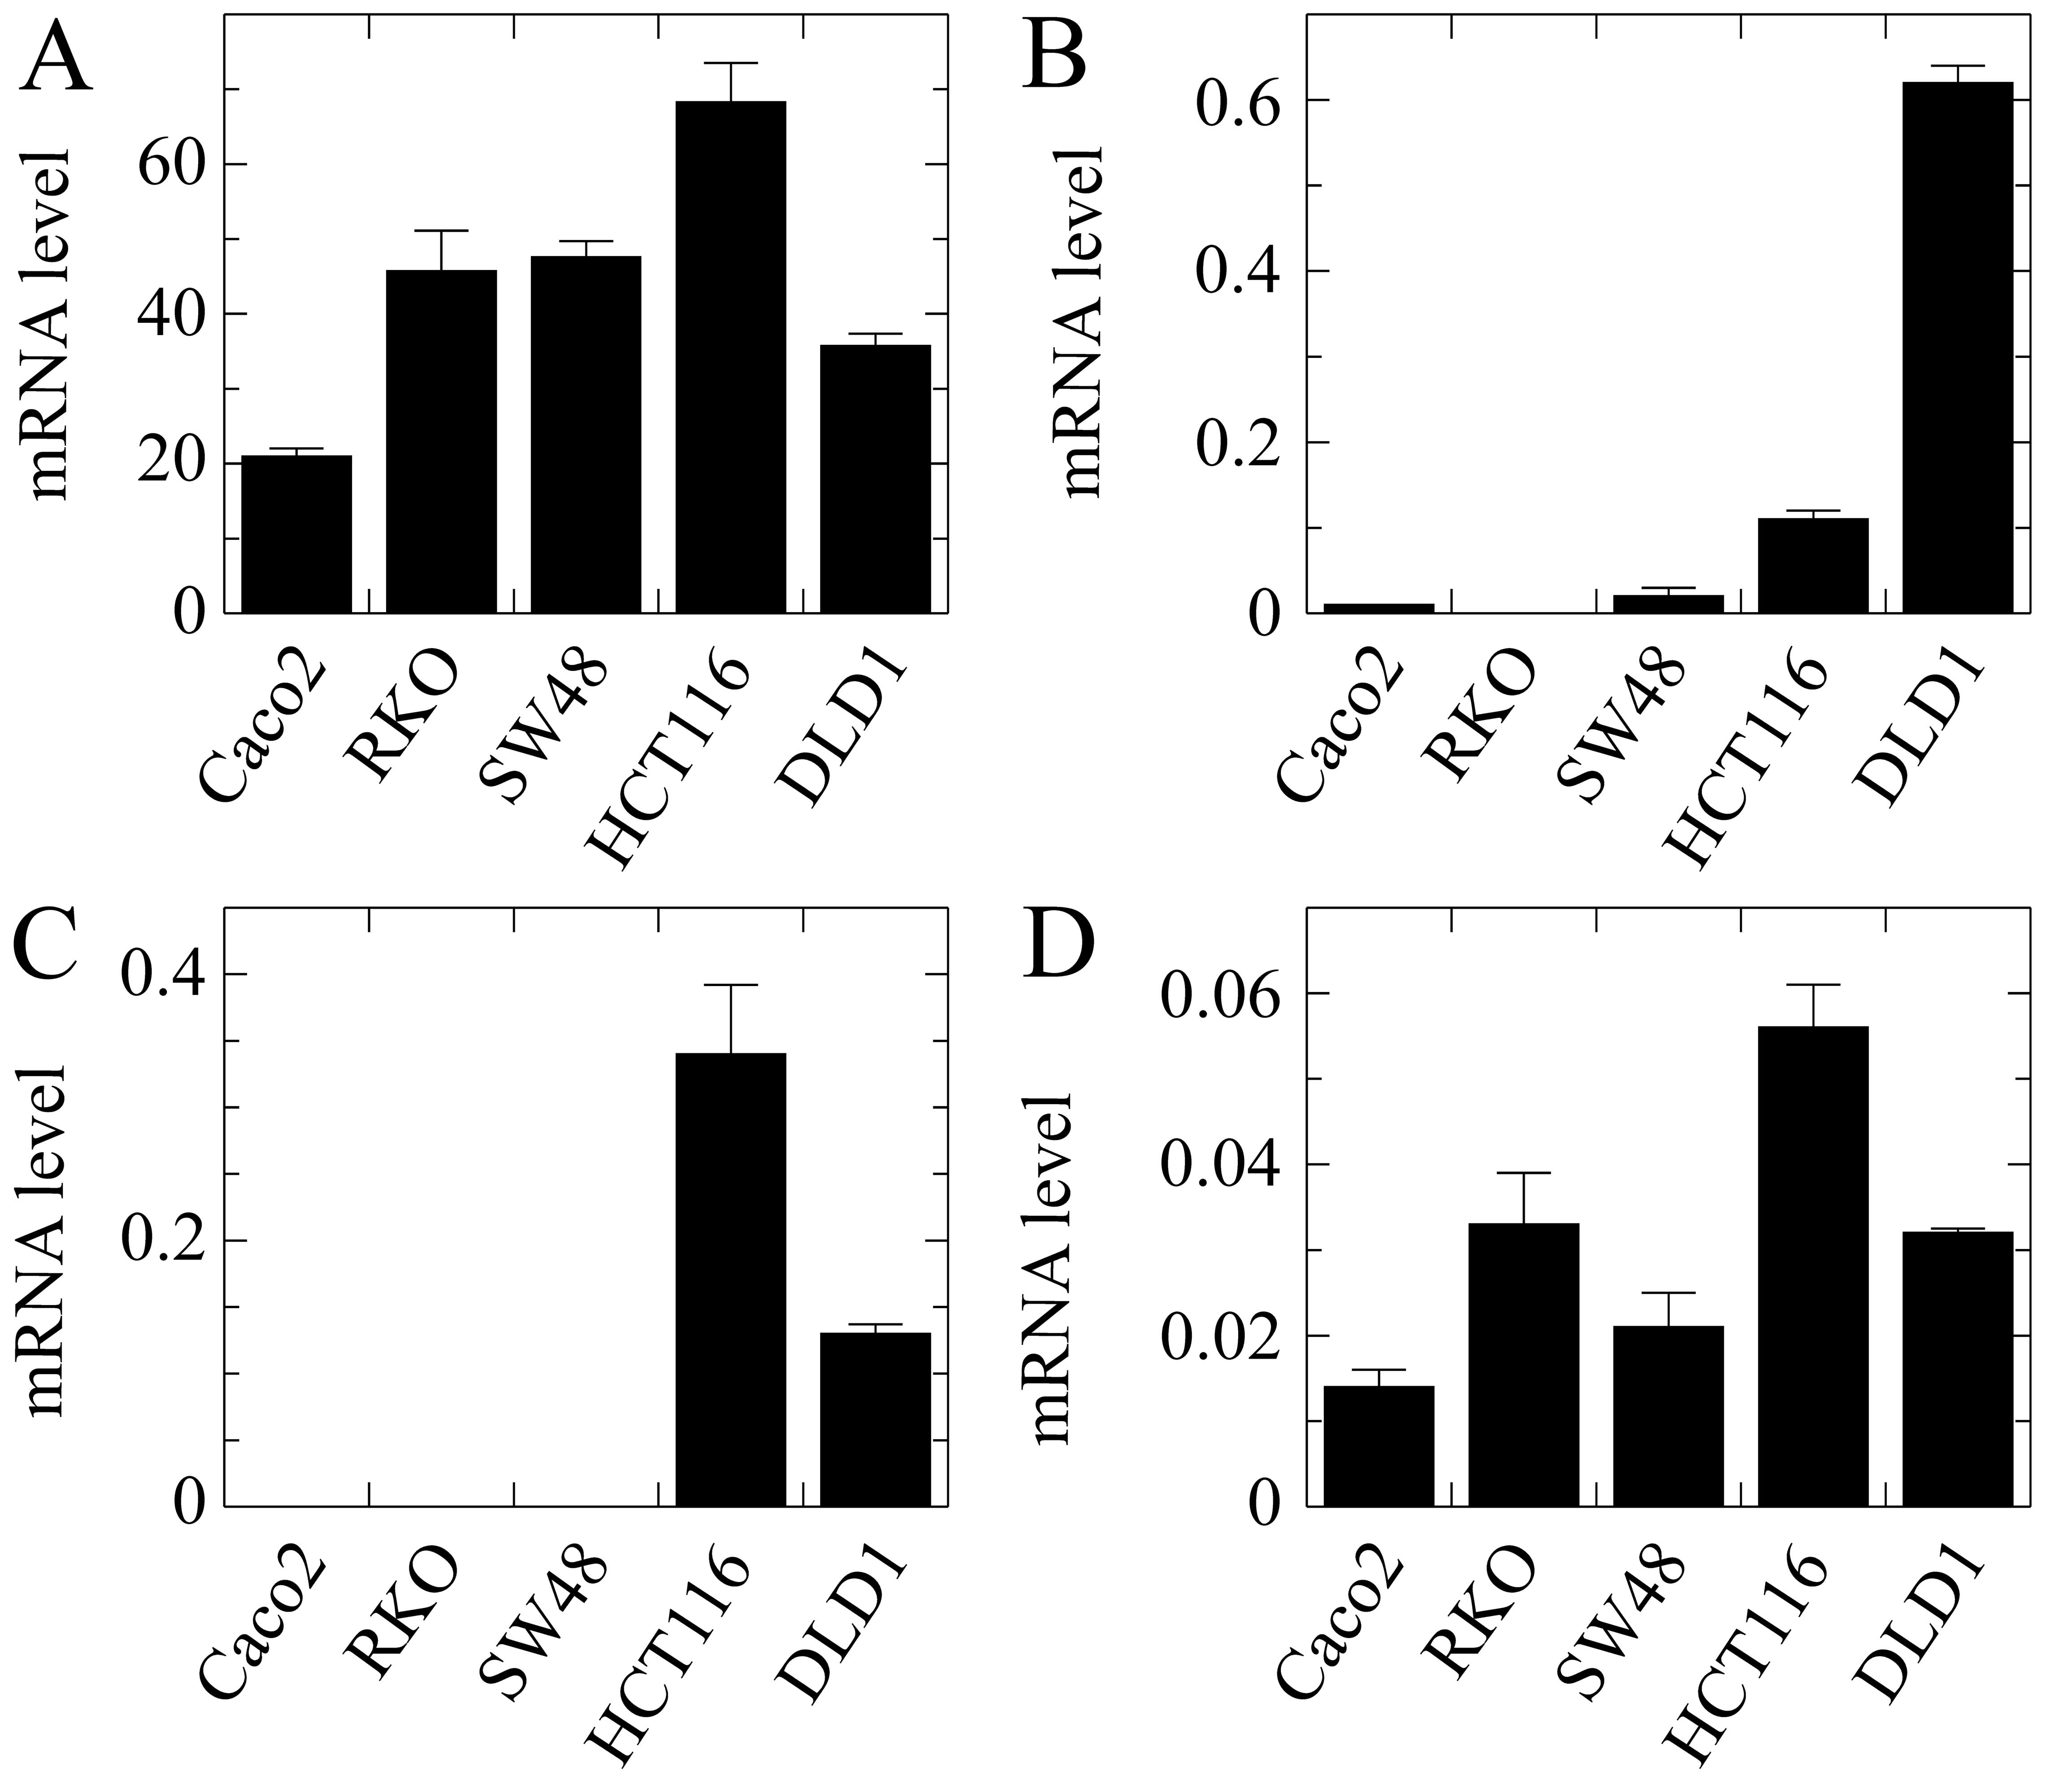
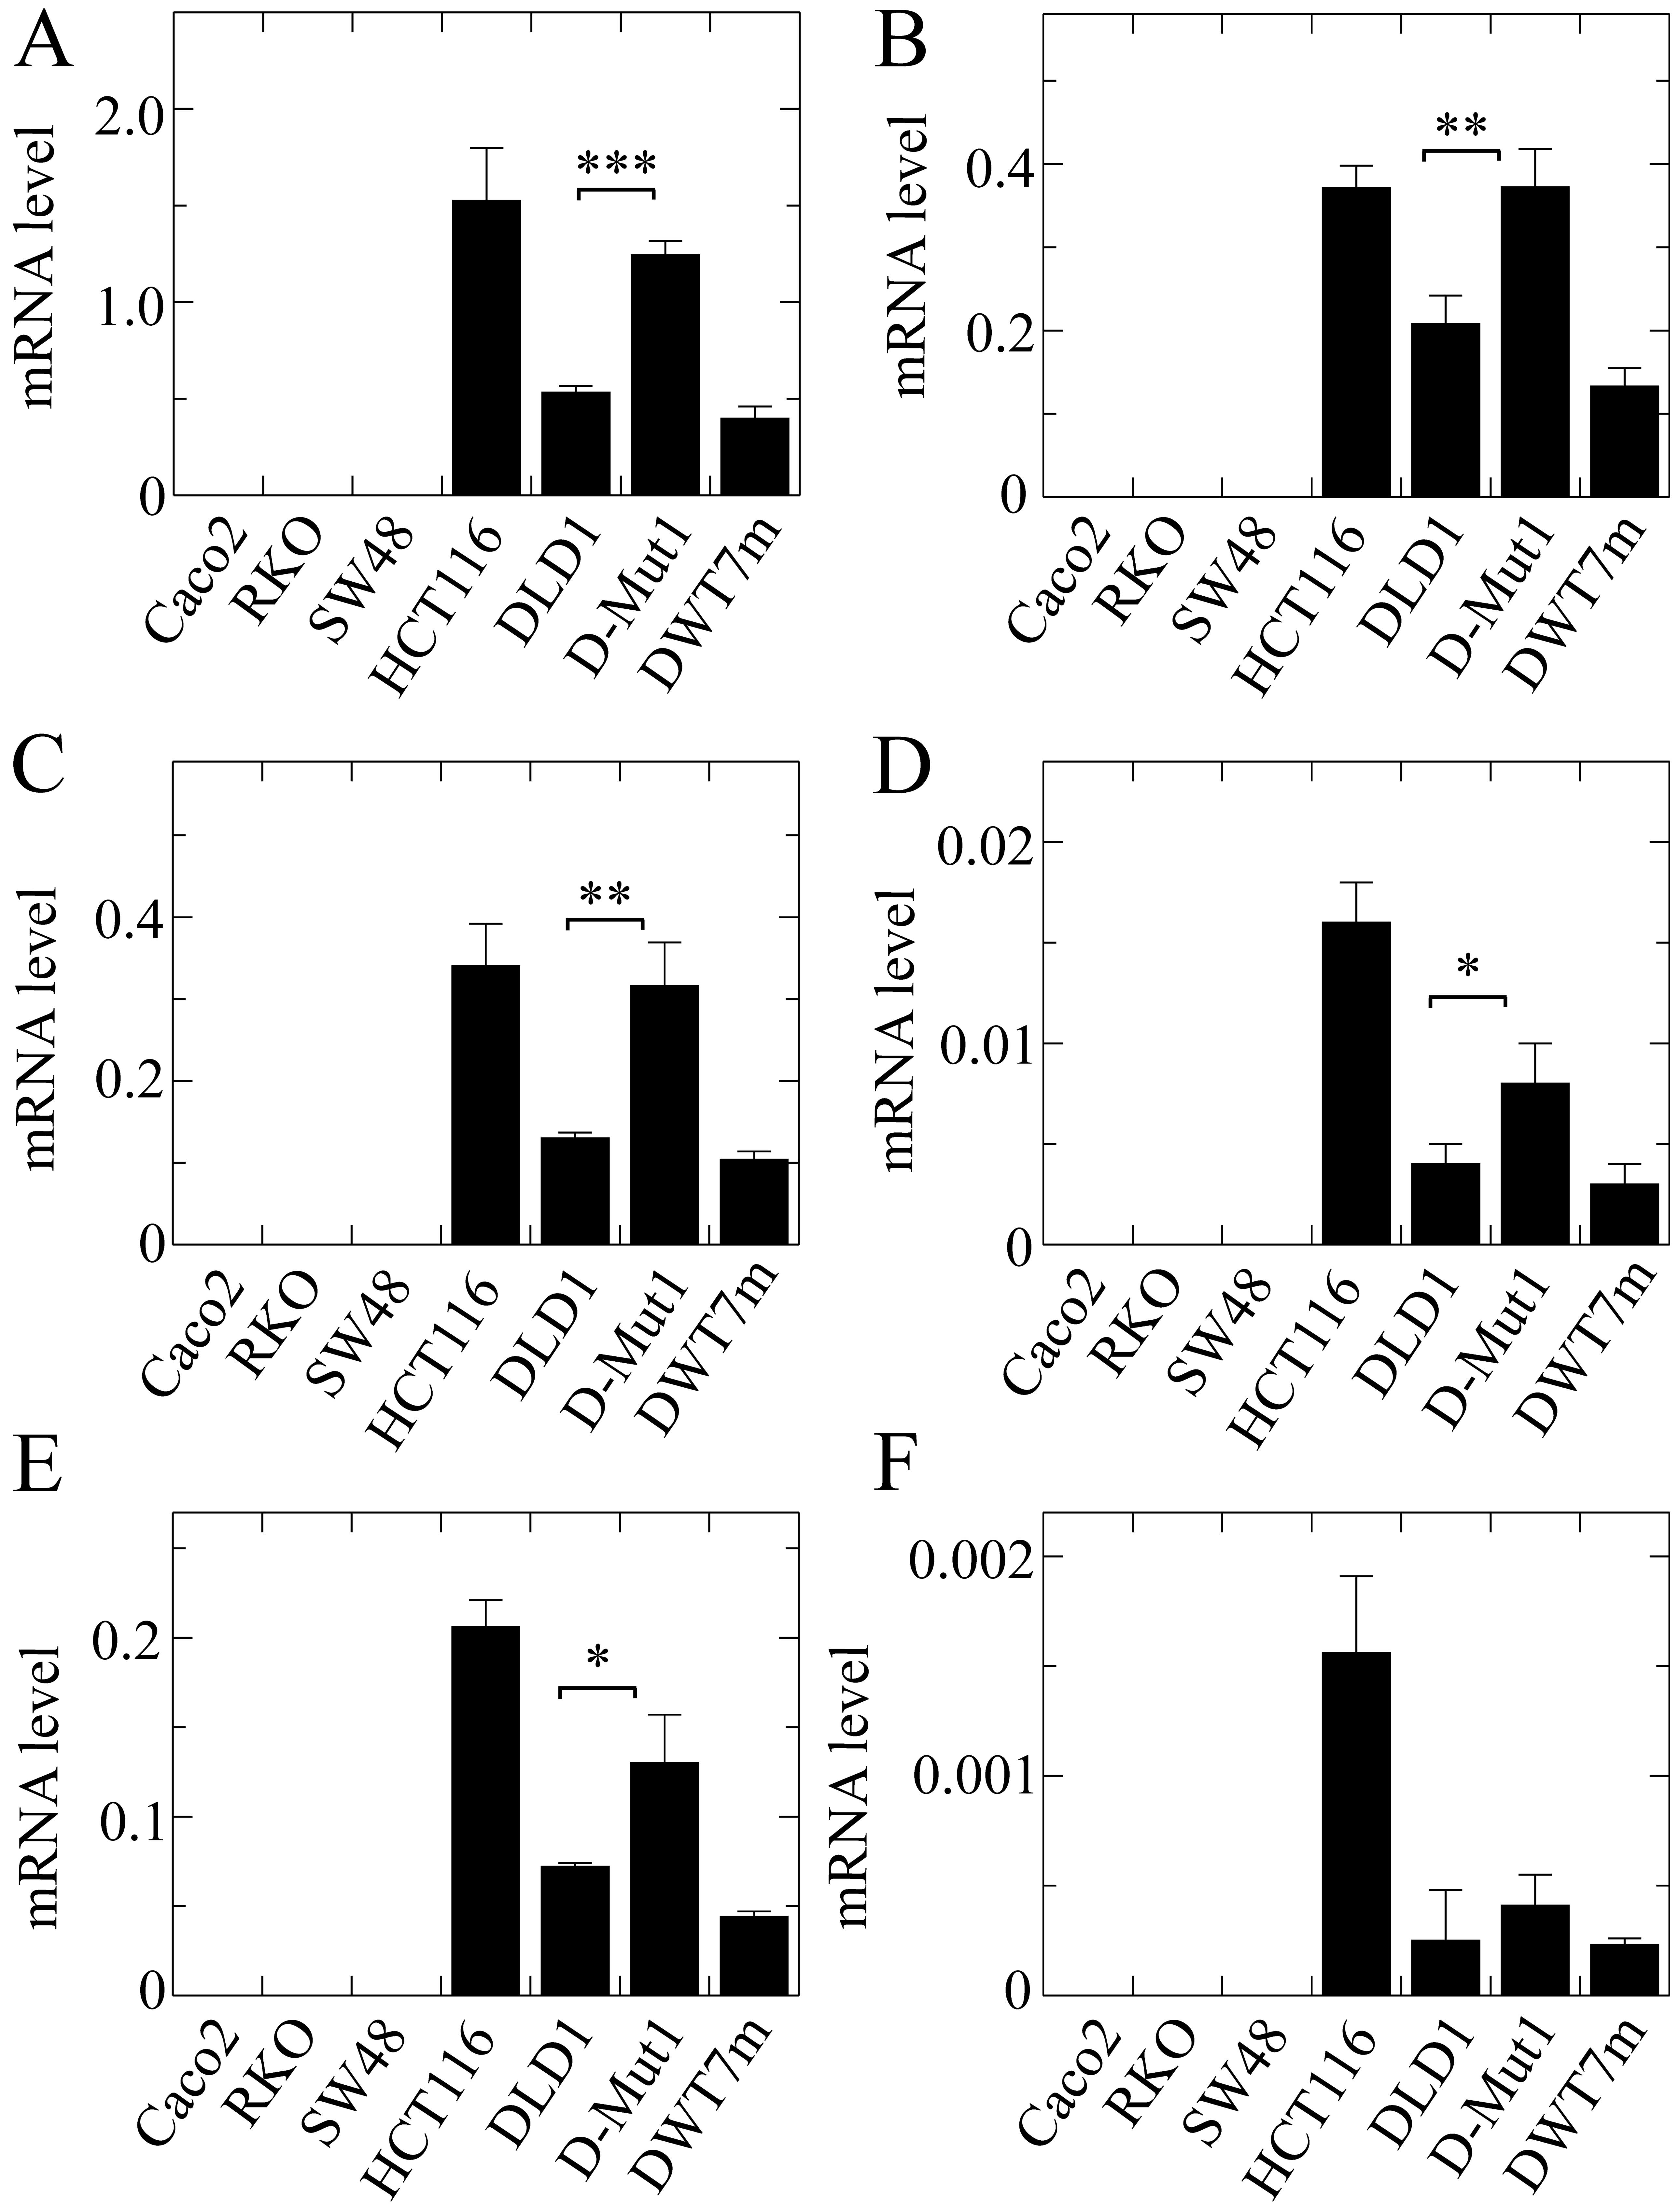
The results obtained with EPDR1 showed
obvious divergences in the expression of the whole gene among the
different cell lines (Fig. 4A). It
is noteworthy that the level of mRNA was negligible in the lines
harbouring wild-type KRAS, while it was significant in
HCT116, DLD1 and the cell lines derived from the latter. This
result was not anticipated by the in silico analysis.
Isoform 2, whose expression was reported by the in silico
analysis as being dependent on KRAS G13D mutation, actually
was significantly more highly expressed in the two cell lines
harbouring that mutation, HCT116 and DLD1. Moreover, its expression
level was significantly higher in the D-Mut1 cell line, in which
the wild-type KRAS allele was knocked out, than that noted
in the parental DLD1 cell line. At this stage of the research we
were surprised by the fact that a cell line, initially identified
as DWT7, i.e., a DLD1-derived line in which the mutated allele had
been knocked out, also expressed the gene and its isoforms. In view
of this apparent contradiction, we sequenced the KRAS gene
in that line, and found that 20% of the cells had spontaneously
acquired a G12D mutation. These cells were renamed as DWT7m, and
the images are lettered accordingly. The expression of isoform 3
was not detected in the cell lines under study.
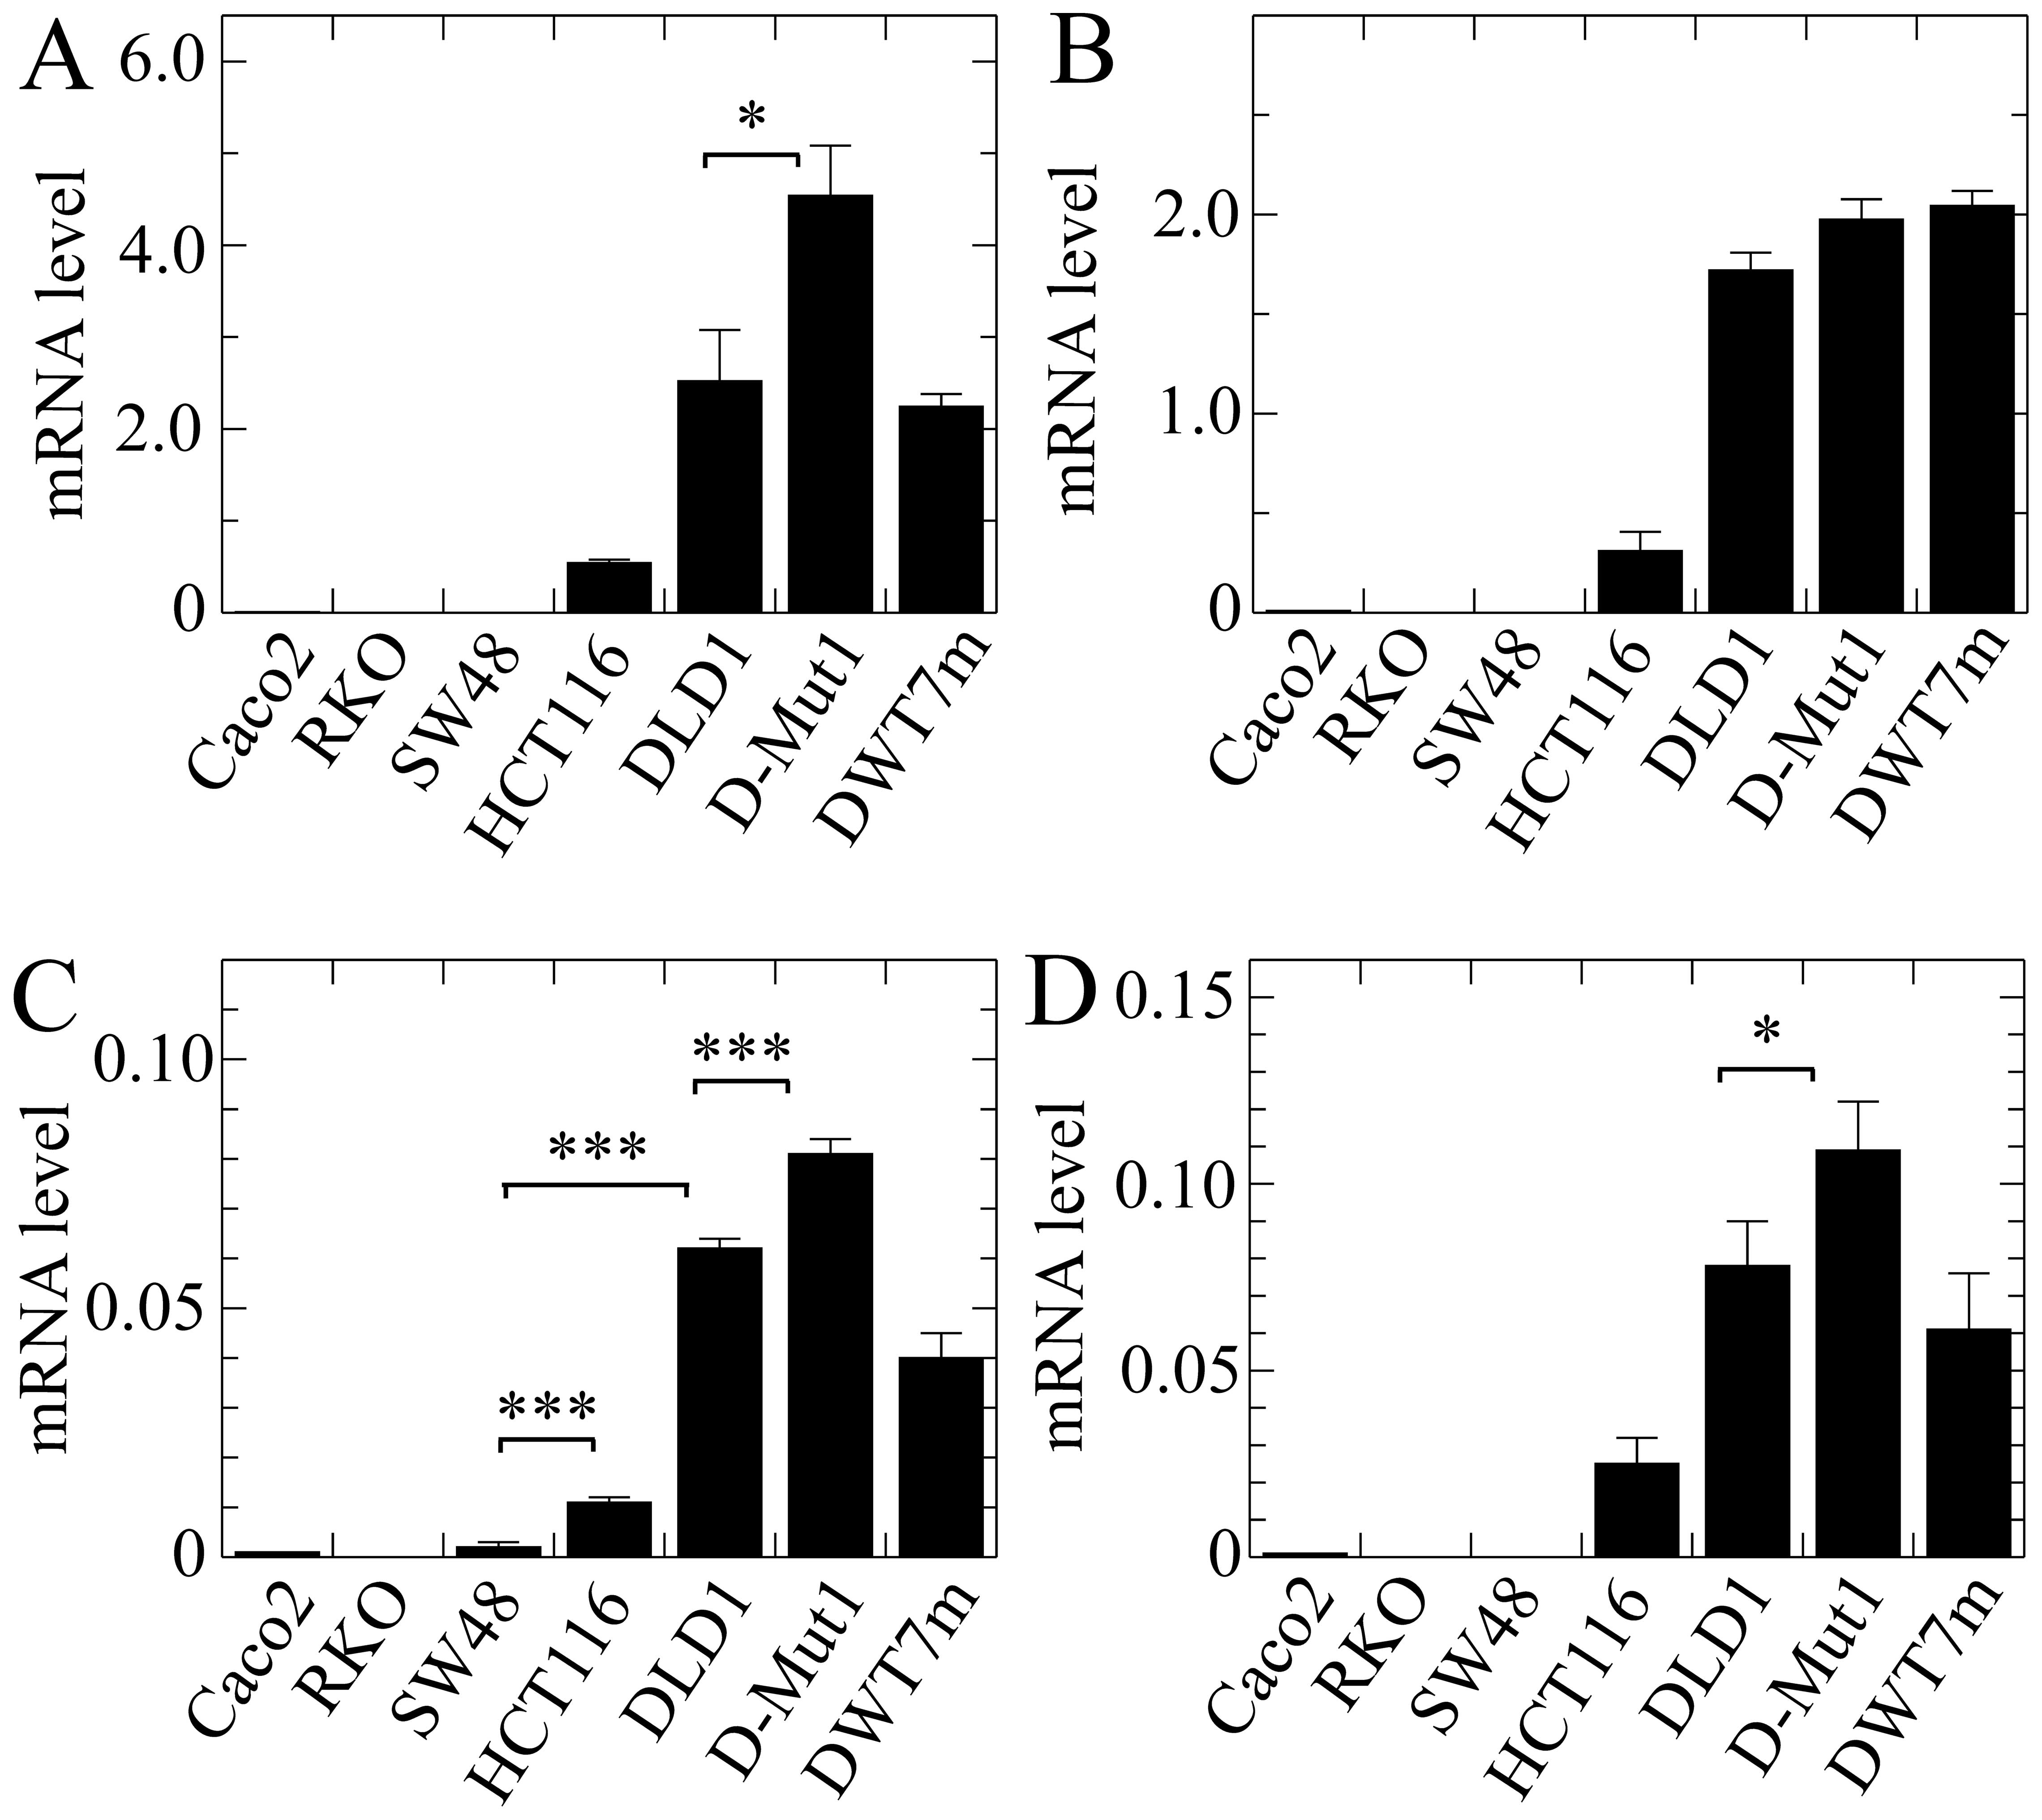
The global expression of the ZNF518B gene
also differed from line to line, being undetectable in the cells
with wild-type KRAS (Fig.
5A). In contrast with the results obtained for EPDR1
(Fig. 4), HCT116 cells exhibited a
higher expression level than that found in the DLD1 cells. Isoforms
1, 2 and 5 accounted for the majority of the transcripts, isoforms
4 and 6 representing only a small minority (Fig. 5). The expression level of the
ZNF518B isoforms was also significantly dependent on the
presence of either of both KRAS alleles in the DLD1 and
D-Mut1 cells, except in the case of isoform 6, whose extremely low
expression did not allow us to draw clear conclusions. The G12D
KRAS mutation in the DWT7m cells also resulted in expression
of the whole gene and of all its isoforms. Although further
discussion on these points is provided later, we wish to emphasize
here that the global expression of both genes ZNF518B and
EPDR1 depended on the mutational status of KRAS in
the DLD1-based cells.
Discussion
Since the implementation of high throughput
sequencing methods, a plethora of data on transcriptomes virtually
covering all of the commonly used cell lines is available. In
silico approaches offer the possibility of screening the
accessible databases in search of specific transcriptome
differences depending on any given variable, using current
bioinformatic tools (see for instance, ref. 13). We applied these methods to verify
whether the KRAS G13D mutation leads to changes in
expression of mRNA isoforms resulting from alternative splicing.
The RT-qPCR experiments found that in two out of the five genes
reported by the in silico analysis, EPDR1 and
ZNF518B, a differential isoform expression occurred when
four CRC cell lines carrying the KRAS mutations were
compared with three CRC cell lines with wild-type KRAS.
Notably, the global expression of both, EPDR1
and ZNF518B genes, and not only the expression of a single
isoform, was strongly related to the KRAS G13D mutation.
Changes in the expression of these two genes in CRC have been
recently reported in relation to the CpG island methylator
phenotype (24). Yet, to the best
of our knowledge, this is the first time in which the KRAS
G13D mutation-related expression of these genes is reported.
Strictly speaking, the differences in the expression of the whole
genes and of its isoforms found when comparing Caco2, RKO, SW48,
DLD1 and HCT116 cell lines would not allow drawing causal
relationships between the KRAS mutational state and the
expression of these genes. Nevertheless, in spite of the fact that
the above cell lines are not isogenic, the comparison of the
behaviour of D-Mut1 and the parental DLD1 does allow us to conclude
that the KRAS G13D mutation has an effect on the expression
of whole EPDR1 and ZNF518B as well as on the relative
abundance of their isoforms.
The global expression of both genes was
significantly higher in the D-Mut1 than that in the parental DLD1,
which behaves as DWT7m (Figs. 4A
and 5A). These three cell lines
only differ in the mutational status of KRAS, since, as
previously mentioned, DLD1 is heterozygous carrying a wild-type
allele and a G13D mutated one; the wild-type allele is knocked-out
in D-Mut1, while DWT7m partially carries allele G12D mutation. The
high expression of the genes in D-Mut1 relative to the parental
DLD1 cells may seem somewhat surprising, as both cell lines share
the same mutated allele. Nevertheless, allelic imbalance in D-Mut1
cells may account for the higher expression of the EPDR1 and
ZNF518B genes. It has been reported by Soh et al that
complete or relative MASI in cancer cells carrying the KRAS
mutation results in an enhanced GTPase Ras activity when compared
to cells harbouring balanced KRAS mutation. HCT116 cells
were included in that study within the balanced group and its
GTPase activity was much lower than those of the cells with
imbalanced mutations (9). D-Mut1
cells mimic MASI and, therefore, it is tempting to speculate that
an increased GTPase activity eventually causes the higher
expression of EPDR1 and ZNF518B genes.
As mentioned above, not only was the global
expression of these genes enhanced in the D-Mut1 cells, but also
the expression of their isoforms. The only exceptions were
EPDR1 isoform 1 and ZNF518B isoform 6, although the
latter result is less reliable due to the low values obtained in
the PCR analysis. Notably, the expression of the isoforms reported
by the in silico analysis as related to the G13D KRAS
mutation, namely EPDR1 isoform 2 and ZNF518B isoform
2, was significantly different between the DLD1 and D-Mut1 cells
(Figs. 4 and 5). Moreover, the ratio of ZNF518B
isoform 2 to isoform 1 was higher in D-Mut1 (0.85) than that noted
in the DLD1 cells (0.63). In addition, of note, the G12D mutation
appeared to result in the expression of EPDR1 and
ZNF518B, as did G13D. In some way, the oncogenic KRAS
is linked to the expression of both genes.
In view of the above comments, it would be worth
studying the possible implication of both genes, EPDR1 and
ZNF518B, in the oncogenic processes driven by KRAS
mutation. EPDR1 codes for ependymin, a glycoprotein
originally discovered in teleost fishes (for an early review, see
ref. 25). A human ependymin
homologue was first reported by Nimmrich et al (26), who found that EPDR1 was
highly expressed in CRC cell lines HCT116 and SW480, the latter
harbouring a G12V mutation in KRAS. This constitutes an
interesting result, since piscine ependymins are extracellular
matrix proteins involved in cell adhesion (27,28)
and a role in transcriptional control has also been postulated for
mammalian ependymin (29). Notably,
the sequence containing the topogenic signal for the extracellular
location is absent from isoform 2, and this may imply a functional
role for the encoded protein.
ZNF518B encodes a zinc-finger protein, which
has not yet been isolated. It has been reported that a polymorphism
of this gene is associated with gout (30,31).
More significant to our purpose is that ZNF518B physically
interacts with the histone methyltransferase G9a and regulates its
activity (32). The deregulation of
this enzyme is involved in cancer (33), and therefore, the possible
relationships between the KRAS mutation-dependent changes in
the expression of the different ZNF518B isoforms and the
onset of colorectal malignancies warrant further research. Isoform
2 does not possess the zinc fingers of ZNF518B, but, in view of the
results of Maier et al (32), it may be possible that this isoform
is still able to interact with G9a to play a role by competing with
the whole isoform 1. It is also worth noting that the aberrant
alternative splicing of other genes coding for a zinc-finger
protein, namely ZNF268, contributes to human malignancies (34). These issues, as well as the possible
implications of EPDR1 in CRC, are currently being studied in
our laboratory.
Acknowledgements
The present study was supported by grants from the
Spanish Ministerio de Economía y Competitividad (FIS PI12/02767 to
A.C., FIS PI12/02110 to G.L.-R. and DPI2013-47279-C2-1-R to G.A.),
and from Generalitat Valenciana (PROMETEO 2013–005 to A.C. and
PROMETEO 2015/006 to G.A.). ALR-C is a fellow of the Grisolia
(2012/034) program. We thank Dr B. Vogelstein for the gift of the
D-Mut1 cell line.
References
|
1
|
Stewart BW and Wild CP: World Cancer
Report 2014. IARC Publications; Lyon: 2014
|
|
2
|
Wong A and Ma BBY: Personalizing therapy
for colorectal cancer. Clin Gastroenterol Hepatol. 12:139–144.
2014. View Article : Google Scholar : PubMed/NCBI
|
|
3
|
Van Cutsem E, Cervantes A, Nordlinger B
and Arnold D: ESMO Guidelines Working Group: Metastatic colorectal
cancer: ESMO Clinical Practice Guidelines for diagnosis, treatment
and follow-up. Ann Oncol. 25:(Suppl 3). iii1–iii9. 2014. View Article : Google Scholar : PubMed/NCBI
|
|
4
|
Brand TM, Iida M and Wheeler DL: Molecular
mechanisms of resistance to the EGFR monoclonal antibody cetuximab.
Cancer Biol Ther. 11:777–792. 2011. View Article : Google Scholar : PubMed/NCBI
|
|
5
|
Prior IA, Lewis PD and Mattos C: A
comprehensive survey of Ras mutations in cancer. Cancer Res.
72:2457–2467. 2012. View Article : Google Scholar : PubMed/NCBI
|
|
6
|
Schubbert S, Shannon K and Bollag G:
Hyperactive Ras in developmental disorders and cancer. Nat Rev
Cancer. 7:295–308. 2007. View Article : Google Scholar : PubMed/NCBI
|
|
7
|
Dócs O, Fazakas F, Horváth NL, Tóth L,
András C, Horváth Z and Méhes G: Changes of KRAS exon 2 codon 12/13
mutation status in recurrent colorectal cancer. Pathol Oncol Res.
21:399–404. 2015. View Article : Google Scholar : PubMed/NCBI
|
|
8
|
Roda D, Castillo J, Telechea-Fernández M,
Gil A, López-Rodas G, Franco L, González-Rodríguez P, Roselló S,
Pérez-Fidalgo JA, García-Trevijano ER, et al: EGF-induced
acetylation of heterogeneous nuclear ribonucleoproteins is
dependent on KRAS mutational status in colorectal cancer cells.
PLoS One. 10:e01305432015. View Article : Google Scholar : PubMed/NCBI
|
|
9
|
Soh J, Okumura N, Lockwood WW, Yamamoto H,
Shigematsu H, Zhang W, Chari R, Shames DS, Tang X, MacAulay C, et
al: Oncogene mutations, copy number gains and mutant allele
specific imbalance (MASI) frequently occur together in tumor cells.
PLoS One. 4:e74642009. View Article : Google Scholar : PubMed/NCBI
|
|
10
|
Hartman DJ, Davison JM, Foxwell TJ,
Nikiforova MN and Chiosea SI: Mutant allele-specific imbalance
modulates prognostic impact of KRAS mutations in colorectal
adenocarcinoma and is associated with worse overall survival. Int J
Cancer. 131:1810–1817. 2012. View Article : Google Scholar : PubMed/NCBI
|
|
11
|
Malapelle U, Sgariglia R, De Stefano A,
Bellevicine C, Vigliar E, de Biase D, Sepe R, Pallante P,
Carlomagno C, Tallini G, et al: KRAS mutant allele-specific
imbalance (MASI) assessment in routine samples of patients with
metastatic colorectal cancer. J Clin Pathol. 68:265–269. 2015.
View Article : Google Scholar : PubMed/NCBI
|
|
12
|
Costa V, Aprile M, Esposito R and
Ciccodicola A: RNA-Seq and human complex diseases: Recent
accomplishments and future perspectives. Eur J Hum Genet.
21:134–142. 2013. View Article : Google Scholar : PubMed/NCBI
|
|
13
|
Du J and Zhang L: Integrated analysis of
DNA methylation and microRNA regulation of the lung adenocarcinoma
transcriptome. Oncol Rep. 34:585–594. 2015.PubMed/NCBI
|
|
14
|
Panagopoulos I, Gorunova L, Zeller B,
Tierens A and Heim S: Cryptic FUS-ERG fusion identified by
RNA-sequencing in childhood acute myeloid leukemia. Oncol Rep.
30:2587–2592. 2013.PubMed/NCBI
|
|
15
|
Wang W, Qin Z, Feng Z, Wang X and Zhang X:
Identifying differentially spliced genes from two groups of RNA-seq
samples. Gene. 518:164–170. 2013. View Article : Google Scholar : PubMed/NCBI
|
|
16
|
Wang ET, Sandberg R, Luo S, Khrebtukova I,
Zhang L, Mayr C, Kingsmore SF, Schroth GP and Burge CB: Alternative
isoform regulation in human tissue transcriptomes. Nature.
456:470–476. 2008. View Article : Google Scholar : PubMed/NCBI
|
|
17
|
Matera AG and Wang Z: A day in the life of
the spliceosome. Nat Rev Mol Cell Biol. 15:108–121. 2014.
View Article : Google Scholar : PubMed/NCBI
|
|
18
|
Ladomery M: Aberrant alternative splicing
is another hallmark of cancer. Int J Cell Biol. 2013:4637862013.
View Article : Google Scholar : PubMed/NCBI
|
|
19
|
Li H, Handsaker B, Wysoker A, Fennell T,
Ruan J, Homer N, Marth G, Abecasis G and Durbin R: 1000 Genome
Project Data Processing Subgroup: The Sequence Alignment/Map format
and SAMtools. Bioinformatics. 25:2078–2079. 2009. View Article : Google Scholar : PubMed/NCBI
|
|
20
|
Trapnell C, Williams BA, Pertea G,
Mortazavi A, Kwan G, van Baren MJ, Salzberg SL, Wold BJ and Pachter
L: Transcript assembly and quantification by RNA-Seq reveals
unannotated transcripts and isoform switching during cell
differentiation. Nat Biotechnol. 28:511–515. 2010. View Article : Google Scholar : PubMed/NCBI
|
|
21
|
Vitting-Seerup K, Porse BT, Sandelin A and
Waage J: spliceR: An R package for classification of alternative
splicing and prediction of coding potential from RNA-seq data. BMC
Bioinformatics. 15:812014. View Article : Google Scholar : PubMed/NCBI
|
|
22
|
Simms D, Cizdziel P and Chomczynski P:
TRIzol: A new reagent for optimal single-step isolation of RNA.
Focus. 15:99–102. 1993.
|
|
23
|
Livak KJ and Schmittgen TD: Analysis of
relative gene expression data using real-time quantitative PCR and
the 2ΔΔCT method. Methods. 25:402–408. 2001. View Article : Google Scholar : PubMed/NCBI
|
|
24
|
Slattery ML, Pellatt DF, Mullany LE, Wolff
RK and Herrick JS: Gene expression in colon cancer: A focus on
tumor site and molecular phenotype. Genes Chromosomes Cancer.
54:527–541. 2015. View Article : Google Scholar : PubMed/NCBI
|
|
25
|
Shashoua VE: The role of brain
extracellular proteins in neuroplasticity and learning. Cell Mol
Neurobiol. 5:183–207. 1985. View Article : Google Scholar : PubMed/NCBI
|
|
26
|
Nimmrich I, Erdmann S, Melchers U,
Chtarbova S, Finke U, Hentsch S, Hoffmann I, Oertel M, Hoffmann W
and Müller O: The novel ependymin related gene UCC1 is highly
expressed in colorectal tumor cells. Cancer Lett. 165:71–79. 2001.
View Article : Google Scholar : PubMed/NCBI
|
|
27
|
Pradel G, Schachner M and Schmidt R:
Inhibition of memory consolidation by antibodies against cell
adhesion molecules after active avoidance conditioning in
zebrafish. J Neurobiol. 39:197–206. 1999. View Article : Google Scholar : PubMed/NCBI
|
|
28
|
Hoffmann W and Schwarz H: Ependymins:
Meningeal-derived extracellular matrix proteins at the blood-brain
barrier. Int Rev Cytol. 165:121–158. 1996. View Article : Google Scholar : PubMed/NCBI
|
|
29
|
Shashoua VE, Adams D and Boyer-Boiteau A:
CMX-8933, a peptide fragment of the glycoprotein ependymin,
promotes activation of AP-1 transcription factor in mouse
neuroblastoma and rat cortical cell cultures. Neurosci Lett.
312:103–107. 2001. View Article : Google Scholar : PubMed/NCBI
|
|
30
|
Jin TB, Ren Y, Shi X, Jiri M, He N, Feng
T, Yuan D and Kang L: Genetic variations in the CLNK gene and
ZNF518B gene are associated with gout in case-control sample sets.
Rheumatol Int. 35:1141–1147. 2015. View Article : Google Scholar : PubMed/NCBI
|
|
31
|
Zhang XY, Geng TT, Liu LJ, Yuan DY, Feng
T, Kang LL, Jin TB and Chen C: SLC2A9 and ZNF518B polymorphisms
correlate with gout-related metabolic indices in Chinese Tibetan
populations. Genet Mol Res. 14:9915–9921. 2015. View Article : Google Scholar : PubMed/NCBI
|
|
32
|
Maier VK, Feeney CM, Taylor JE, Creech AL,
Qiao JW, Szanto A, Das PP, Chevrier N, Cifuentes-Rojas C, Orkin SH,
et al: Functional proteomic analysis of repressive histone
methyltransferase complexes PRC2 and G9A reveals ZNF518B as a G9A
regulator. Mol Cell Proteomics. 14:1435–1446. 2015. View Article : Google Scholar : PubMed/NCBI
|
|
33
|
Shankar SR, Bahirvani AG, Rao VK, Bharathy
N, Ow JR and Taneja R: G9a, a multipotent regulator of gene
expression. Epigenetics. 8:16–22. 2013. View Article : Google Scholar : PubMed/NCBI
|
|
34
|
Zhao Z, Wang D, Zhu C, Shao H, Sun C, Qiu
H, Xue L, Xu J, Guo M and Li W: Aberrant alternative splicing of
human zinc finger gene ZNF268 in human hematological malignancy.
Oncol Rep. 20:1243–1248. 2008.PubMed/NCBI
|