Introduction
Non-small cell lung cancer (NSCLC) is the most
common type of lung cancer, accounting for about 85% of all lung
cancers (1). NSCLC is the main
cause of lung cancer-related deaths. Most patients are diagnosed
with late-stage tumors and only 15% of patients are found in the
early stage (2). The survival rate
of patients with early-stage NSCLC after complete tumor resection
is more favourable. The current therapeutic strategies for NSCLC
cases mainly include surgery, chemotherapy and radiotherapy. The
combination of two or more treatments is often used for NSCLC
cases, which is usually influenced by NSCLC staging. It is reported
that the combinational treatment of adjuvant carboplatin plus
paclitaxel reduces the mortality rate of patients with stage IB
NSCLC (3). The overall survival for
stage IB-II NSCLC cases was found to improve after vinorelbine plus
cisplatin treatment (4).
Microarray technology is a novel tool to analyze the
global gene expression and decipher biological pathways (5). Advances in microarray technology have
facilitated the development of novel therapies and the
understanding of potential mechanisms of diseases. Based on gene
expression arrays, Lu et al found a group of genes related
with lung cancer metastasis such as APC, CDH8 and
IL8RB, which may be used for predicting the survival of
patients with stage I NSCLC and preparing a treatment plan
(6). Jiang et al employed
tissue lung microarray technology and suggested that aldehyde
dehydrogenase 1, a marker for lung tumor stem cells, may be a
therapeutic target for lung cancer (7).
The gene expression array of GSE21933 was developed
from Asian lung cancer patients. With the microarray data, Lo et
al have established that ARHGAP19, FRAT2g, PAFAH1B1 and
ZNF322A involved in Rho activity, Wnt signaling, motility
control and MAPK signaling are the candidate genes for lung cancer
(8). Currently, the integrity
analysis of altered gene expression patterns for lung cancer during
different stages is rare. In the present study, we further analyzed
the expression array data of lung tumor tissues to disclose the
difference and similarity in the gene expression profile of lung
cancer cases during different stages. We expect that our findings
are helpful in understanding the mechanism of lung cancer during
different stages and discovering novel candidate genes.
Materials and methods
Microarray data
The gene expression dataset of a previous human
NSCLC study was retrieved from the public National Center for
Biotechnology Information Gene Expression Omnibus (NCBI GEO) with
accession no. GSE21933. The gene expression data of tumors and
matched normal tissues from 21 NSCLC patients were contributed by a
previously public study (8). The
NSCLC patients included 10 early-stage cases (6 in stage IB, 3 in
stage IIB and 1 in stage IA) and 11 late-stage patients (5 in stage
IIIA, 5 in stage IV and 1 in stage IIIB). Due to the small number
of samples at stage IA and IIIB, we only analyzed the remaining 19
tumor samples compared with the corresponding controls. All the DNA
microarray data were analyzed by the platform Phalanx Human
OneArray.
Data preprocessing
The raw data (gpr format files) were downloaded and
assessed by limma software (9,10). The
preprocessing procedure involved a background correction, gene
expression normalization and microarray data condensing. Then, the
probe IDs were translated into gene symbols by eliminating the
probes with no gene symbols. When there were multiple probes for
the same gene symbol, the mean value of the probes was calculated
as the gene expression value.
DEG screening
The differentially expressed genes (DEGs) were
analyzed in NSCLC tumors during different stages. The differential
expression patterns were analyzed in stages IB, IIB, IIIA and IV of
lung tumors, compared with the normal controls. The significant
P-values for DEGs were calculated by a no-paired t-test with the
application of a limma package. P<0.05 and log2FC
(fold-change) ≥0.4 were defined as the cut-off values. Then the
significant DEGs screened were subjected to hierarchical clustering
analysis by a gplots package (11).
Function and pathway analysis
The significantly altered biological processes and
pathways were identified using Database for Annotation,
Visualization and Integrated Discovery (DAVID) (12). The statistical significances of the
overrepresented Gene Ontology (GO) terms and Kyoto Encyclopedia of
Genes and Genomes (KEGG) pathways were calculated based on
hypergeometric distribution. A P-value <0.05 and a count ≥2 were
used as the cut-off values.
PPI network
The protein interaction pairs corresponding to DEGs
were predicted by integrating the information deposited in STRING
[protein-protein interaction (PPI) networks, with increased
coverage and integration] (13).
The DEG lists in tumors in stages IB, IIB, IIIA and IV were
analyzed, respectively. The PPI network was constructed of the
protein pairs with a PPI score (medium confidence) ≥0.4 using
Cytoscape software (14).
Key nodes in the PPI network
The role of nodes in large complex networks is
commonly assessed based on network centralities such as degree
centrality (15), betweenness
centrality (16) and subgraph
centrality (17). The network
centralities of nodes were calculated by cytoscape plugin CytoNCA
(18). The key nodes were first
selected according to a high degree, subgraph and betweenness
value. Then the DEGs corresponding to key nodes underwent cluster
analysis to evaluate the effect on sample clustering. Finally, DEGs
that could distinguish tumor and normal samples were defined as key
nodes.
Venn diagram of DEGs in tumors of
different stages
VennPlex (19)
(https://www.irp.nia.nih.gov/bioinformatics/vennplex.html)
has been widely used to separate common DEGs and uniquely altered
genes between different gene lists. The Venn diagram of DEGs in the
NSCLC tumors of different stages was constructed by VennPlex
software. The four DEG lists and log2FC values were
uploaded to identify the difference of differential expression
patterns among stages IB, IIB, IIIA and IV of lung tumors.
Gene coexpression analysis
The DEGs identified in the four different tumor
stages were pooled together. The coexpression coefficient was
calculated by Pearson's correlation coefficient. P-values were
obtained based on Z-scores and corrected by Benjamini-Hochberg (BH)
method to control the false discovery rate (20). A |coexpression coefficient| >0.8
and an adjusted P-value <0.05 were set as the cut-off values for
gene coexpression pairs.
Analysis of cancer-related genes
The Comparative Toxicogenomics Database (CTD)
(21) is a collection of
disease-related genes documented in previously published
literature. The genes related with NSCLC were selected among DEGs
of tumors in 4 tumor stages based on the information from the
CTD.
Cell culture
Human lung epithelial cells (BEAS-2B), NSCLC cell
lines such as A549 (adenocarcinoma), NCI-H1299 (large cell
carcinoma) and NCI-H1650 (adenocarcinoma) were purchased from the
Cell Bank of the Chinese Academy of Sciences (Shanghai, China).
BEAS-2B and A549 cells were maintained in Dulbecco's modified
Eagle's medium (DMEM) supplemented with 10% fetal bovine serum
(FBS), 1% 100 U/ml penicillin and 0.1 mg/ml streptomycin. NCI-H1299
and NCI-H1650 cells were cultured in RPMI-1640 medium supplemented
with 10% FBS and 1% 100 U/ml penicillin, and 0.1 mg/ml
streptomycin. All the cells were incubated in an atmosphere of 95%
air and 5% CO2 at 37°C.
Reverse transcription real-time
quantitative polymerase chain reaction (RT-qPCR)
The total RNA of the BEAS-2B, A549, NCI-H1299 and
NCI-H1650 cells was extracted using the RNAiso Plus reagent (Takara
Bio) according to the manufacturer's instructions. cDNA was
reversely transcribed by PrimeScript (according to Takara Bio) at
37°C for 15 min, followed by 5 sec at 85°C. In order to determine
the DNA copy number variations of the candidate natural
killer-tumor recognition sequence (NKTR) gene, PCR
amplifications were performed with 10 µl SYBR Premix Ex Taq (2X), 1
µl of 10 µM forward primers, 1 µl of 10 µM reverse primers and 8 µl
cDNA, in a final volume of 20 µl. The relative quantities of
NKTR expression were analyzed using the comparative Ct
method and were normalized to glyceraldehyde-3-phosphate
dehydrogenase (GAPDH) expression. The primer sequences for
NKTR and GAPDH are listed in Table I.
 | Table I.The primer sequences for NKTR
and GAPDH. |
Table I.
The primer sequences for NKTR
and GAPDH.
| Gene | Primer sequence
(5′-3′) |
|---|
| GAPDH | F:
TGACAACTTTGGTATCGTGGAAGG |
|
| R:
AGGCAGGGATGATGTTCTGGAGAG |
| NKTR | F:
ACAGTTACCACCGAGGCAGA |
|
| R:
TCGGTCACTTTCACTGTCAGAGC |
Results
DEG identification
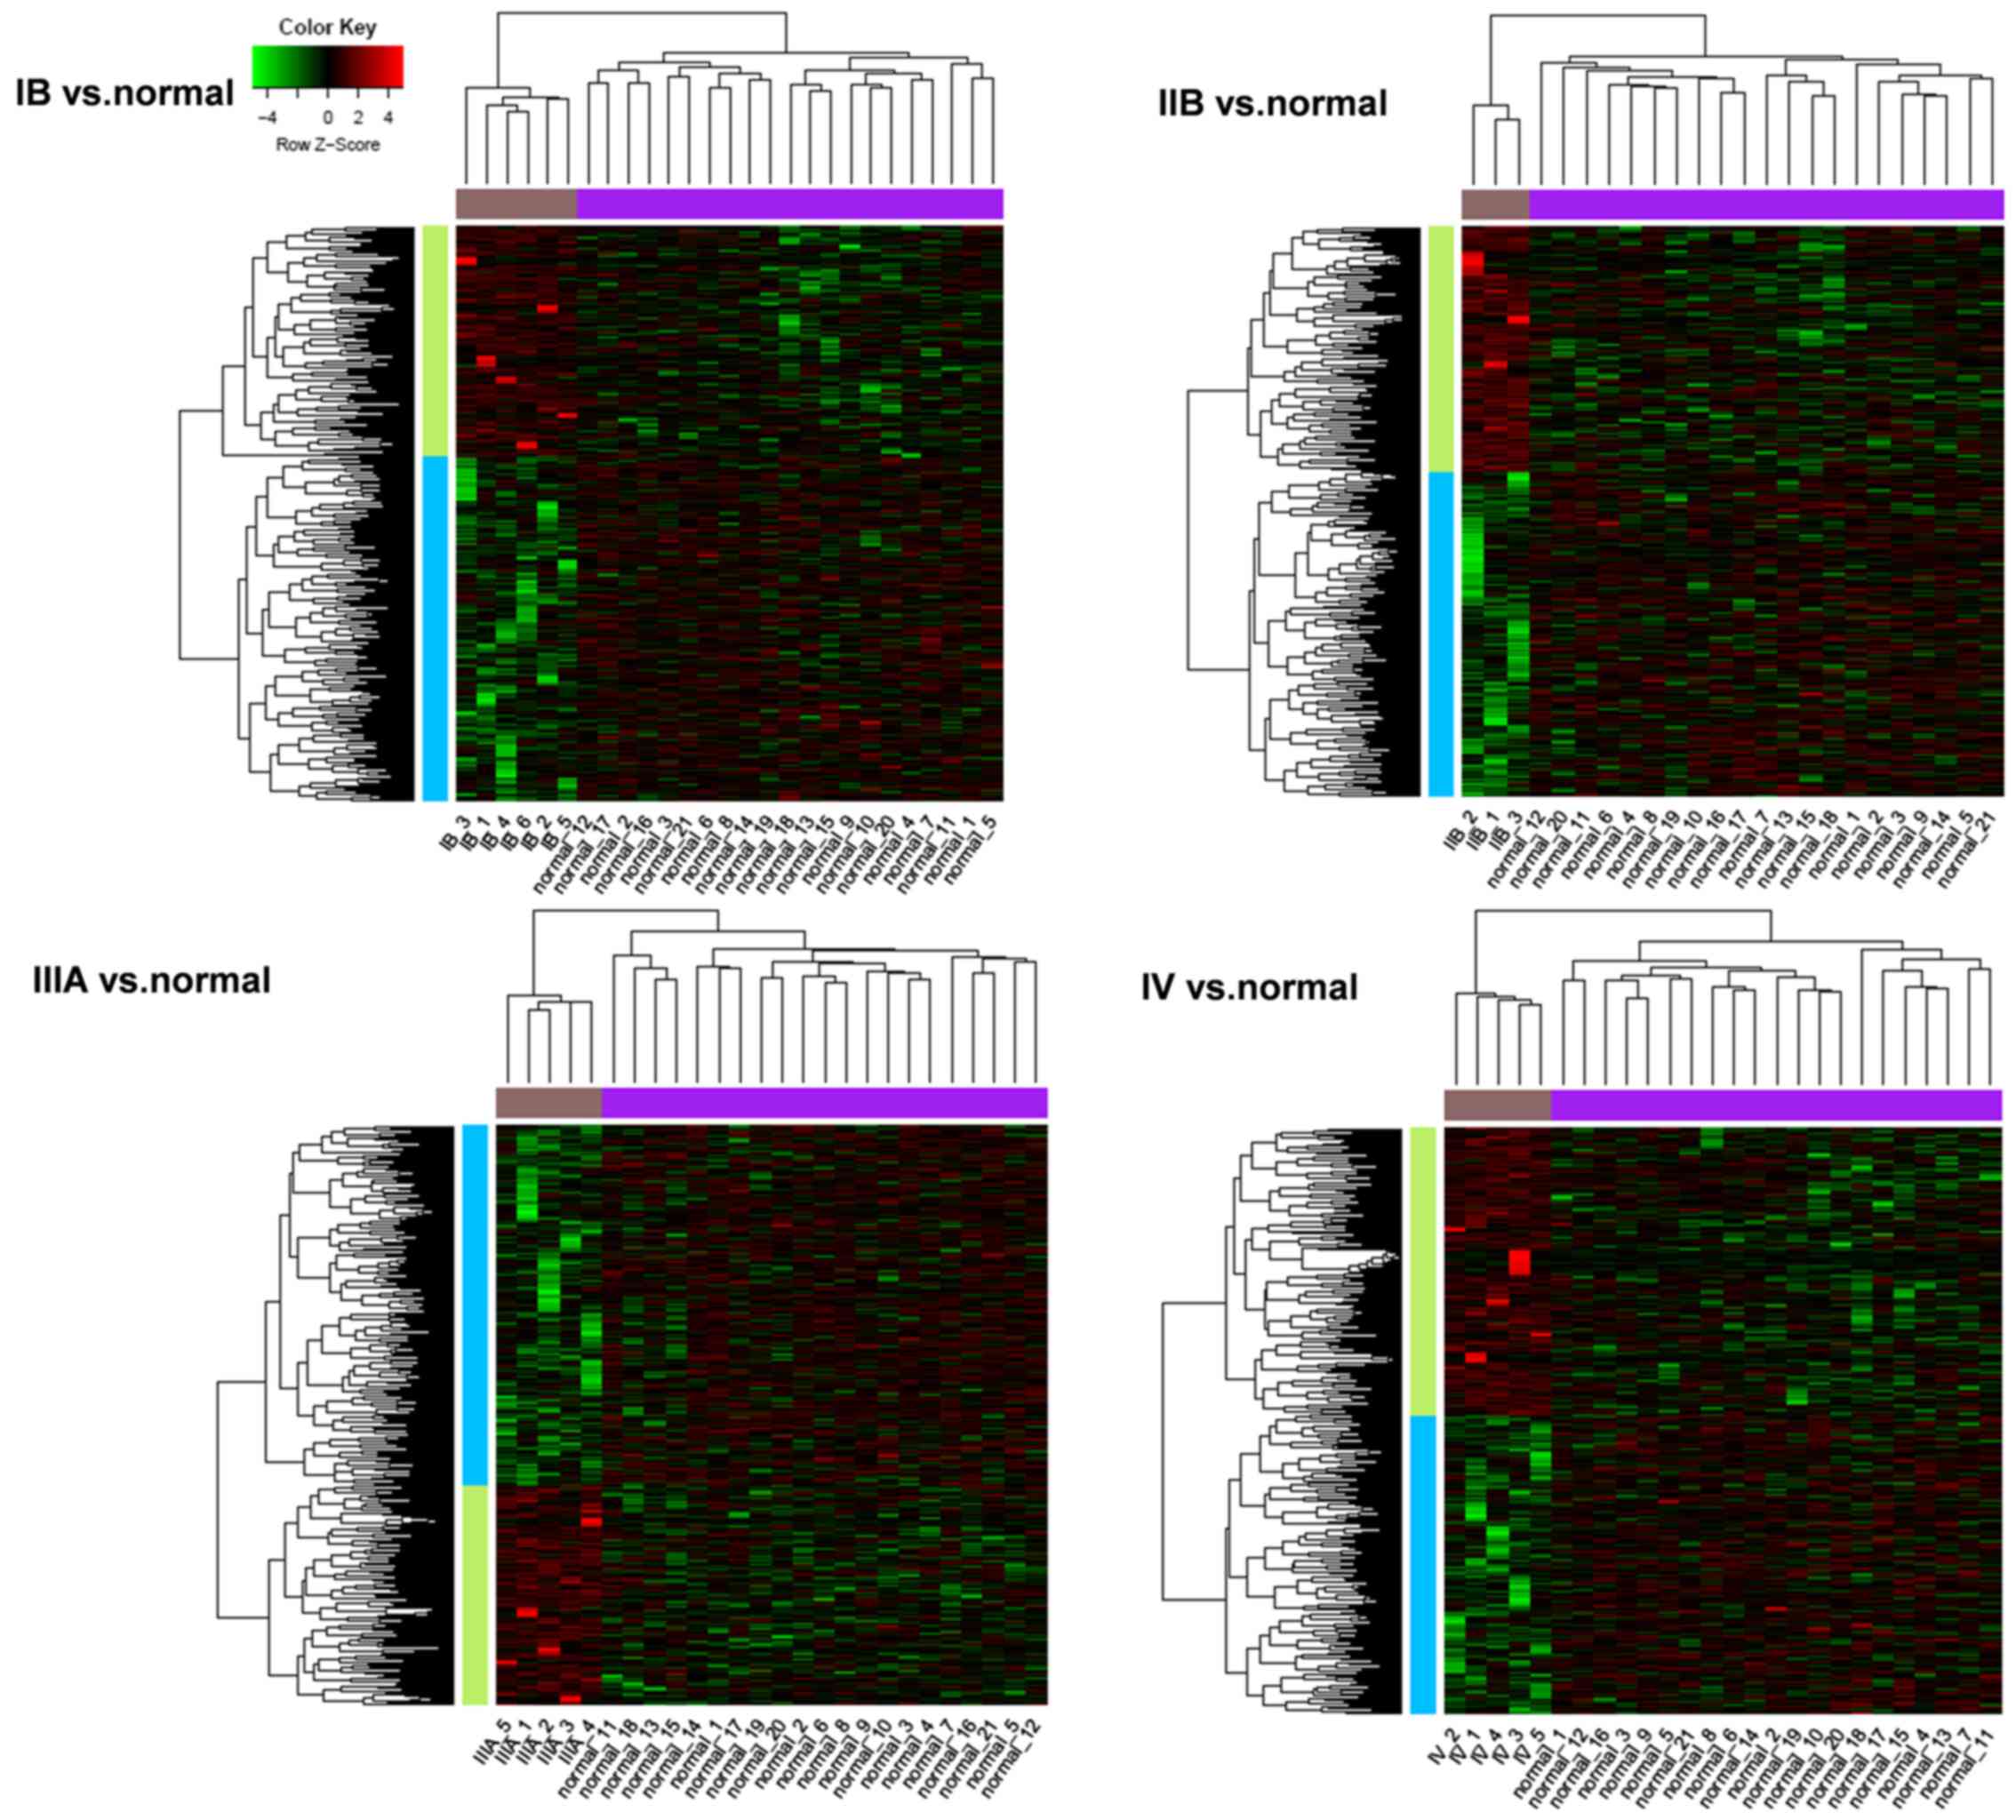
Compared with normal tissues, the genes with altered
expression in NSCLC tumors were identified (Table II). The total number of DEGs in
tumor tissues of stage IB, IIB, IIIA and IV were 499, 602, 592 and
457, respectively. Then, the DEGs for different tumor stages were
subjected to hierarchical clustering analysis based on the gene
expression patterns. The heat maps illustrated that all the DEGs
were able to distinguish tumor and normal tissues clearly, which
suggested that the DEGs identified in the present study were
significant (Fig. 1).
| Table II.The top 10 DEGs identified in tumor
tissues of different stages. |
Table II.
The top 10 DEGs identified in tumor
tissues of different stages.
| IB vs. normal
(n=499) | IIB vs. normal
(n=602) | IIIA vs. normal
(n=592) | IV vs. normal
(n=457) |
|---|
|
|
|
|
|---|
| Genes | logFC | P-value | Genes | logFC | P-value | Genes | logFC | P-value | Genes | logFC | P-value |
|---|
| AMDHD1 | −0.980253 | 2.03E-07 | EVI5L | 2.7955747 | 6.31E-06 | LANCL1 | −1.315286 | 4.62E-08 | LAPTM4B | −0.755981 | 5.68E-05 |
| OR5L2 | −1.526492 | 4.07E-06 | DPPA2 | 2.2309604 | 3.24E-05 | RNF121 | −3.629547 | 8.91E-08 | CEP135 | −1.06584 | 3.22E-05 |
| POLR2D | −0.808397 | 5.45E-05 | FXYD6 | 2.1874347 | 5.23E-05 | MKKS | −0.939145 | 7.80E-06 |
C19orf56 | 1.1128544 | 0.0006198 |
| LRIT3 | −0.815737 | 3.93E-05 | EIF2B3 | 1.5135333 | 4.10E-05 | GPR177 | −0.706376 | 3.25E-05 | COX11 | −0.582135 | 0.0006956 |
| SLCO3A1 | −0.949987 | 6.49E-05 | PERLD1 | −0.989765 | 4.45E-05 | CISH | −0.749059 | 3.32E-05 | DOK4 | −0.5833 | 0.0002439 |
| C3orf1 | −1.037834 | 5.75E-05 | CCDC65 | −1.024191 | 4.69E-05 | VGF | −0.993612 | 7.68E-05 | CDX4 | −0.598101 | 0.00057 |
| PKM2 | −0.785317 | 0.000128 | NUP155 | −1.545052 | 6.07E-05 | ENO1 | −2.226183 | 8.59E-05 | ANK2 | −0.67669 | 0.0004388 |
| RAB23 | −0.674876 | 0.0001587 |
ATP6V0A1 | −1.035911 | 0.0001129 | PSME1 | −0.758268 | 0.000161 | GEMIN7 | −0.686458 | 0.0006848 |
| LANCL2 | −0.624205 | 0.0003193 | PCDH18 | −1.309749 | 0.0001096 | JMJD2D | −0.797516 | 0.0001714 | CNTN6 | −0.784264 | 0.0005795 |
| CHRNA10 | −1.224662 | 0.0003353 | BST2 | 2.3663933 | 0.000138 | RAMP1 | −0.802102 | 0.0001188 | EIF5 | −0.895799 | 0.0007118 |
Significant GO function and
pathways
The overrepresented GO terms and pathways for DEGs
varied according to tumor stage. The DEGs in tumors of IB tumor
stage were closely related with negative regulation of signal
transduction and cellular di- and trivalent inorganic cation
homeostasis biological process and the apoptosis pathway. The genes
altered in stage IIB were significantly enriched in genitalia
development, the monosaccharide metabolic process and the p53
signaling pathway. The upregulated DEGs in tumors of stages IIIA
and IV were mainly related with transcription and synapse
regulation-related biological process (Table III).
| Table III.The overrepresented GO terms and
pathways for the DEGs. |
Table III.
The overrepresented GO terms and
pathways for the DEGs.
| Stages | Regulated | Category | Term | Count | P-value |
|---|
| IB | Upregulated | BP | GO:0009968~negative
regulation of signal transduction | 9 | 1.25E-03 |
|
|
|
| GO:0010648~negative
regulation of cell communication | 9 | 2.58E-03 |
|
|
|
| GO:0007128~meiotic
prophase I | 3 | 4.69E-03 |
|
|
| Pathway |
hsa04210:Apoptosis | 4 | 4.57E-02 |
|
| Downregulated | BP | GO:0030005~cellular
di- and trivalent inorganic cation homeostasis | 12 | 6.93E-04 |
|
|
|
| GO:0055066~di- and
trivalent inorganic cation homeostasis | 12 | 1.05E-03 |
|
|
|
|
GO:0007204~elevation of cytosolic calcium
ion concentration | 8 | 1.41E-03 |
| IIB | Upregulated | BP |
GO:0048806~genitalia development | 3 | 3.52E-02 |
|
|
|
| GO:0051054~positive
regulation of the DNA metabolic process | 4 | 3.58E-02 |
|
|
| Pathway | hsa04115:p53
signaling pathway | 4 | 4.75E-02 |
|
| Downregulated | BP |
GO:0005996~monosaccharide metabolic
process | 11 | 7.91E-03 |
|
|
|
| GO:0019318~hexose
metabolic process | 10 | 8.99E-03 |
|
|
|
| GO:0006006~glucose
metabolic process | 8 | 2.27E-02 |
| IIIA | Upregulated | BP | GO:0010552~positive
regulation of specific transcription from RNA polymerase II
promoter | 5 | 4.89E-03 |
|
|
|
|
GO:0006350~transcription | 39 | 5.68E-03 |
|
|
|
| GO:0016477~cell
migration | 10 | 6.27E-03 |
|
| Downregulated | BP | GO:0019320~hexose
catabolic process | 8 | 3.74E-04 |
|
|
|
| GO:0010033~response
to organic substances | 29 | 3.78E-04 |
|
|
|
|
GO:0006091~generation of precursor
metabolites and energy | 17 | 4.20E-04 |
| IV | Upregulated | BP |
GO:0050807~regulation of synapse
organization | 4 | 1.81E-03 |
|
|
|
|
GO:0050803~regulation of synapse structure
and activity | 4 | 2.69E-03 |
|
|
|
| GO:0010033~response
to organic substances | 18 | 4.82E-03 |
|
| Downregulated | BP |
GO:0050892~intestinal absorption | 3 | 1.41E-02 |
|
|
|
|
GO:0035036~sperm-egg recognition | 3 | 1.58E-02 |
|
|
|
| GO:0007339~binding
of sperm to zona pellucida | 3 | 1.58E-02 |
PPI network construction
The PPI network for DEGs in tumors of different
stages was constructed respectively. The PPI network for stage IB
was composed of 276 nodes and 454 pairs. The network for stage IIB
included 349 nodes and 615 protein pairs. In addition, there were
366 nodes and 944 pairs for stage IIIA tumors and 252 nodes and 392
pairs for stage IV (Fig. 2).
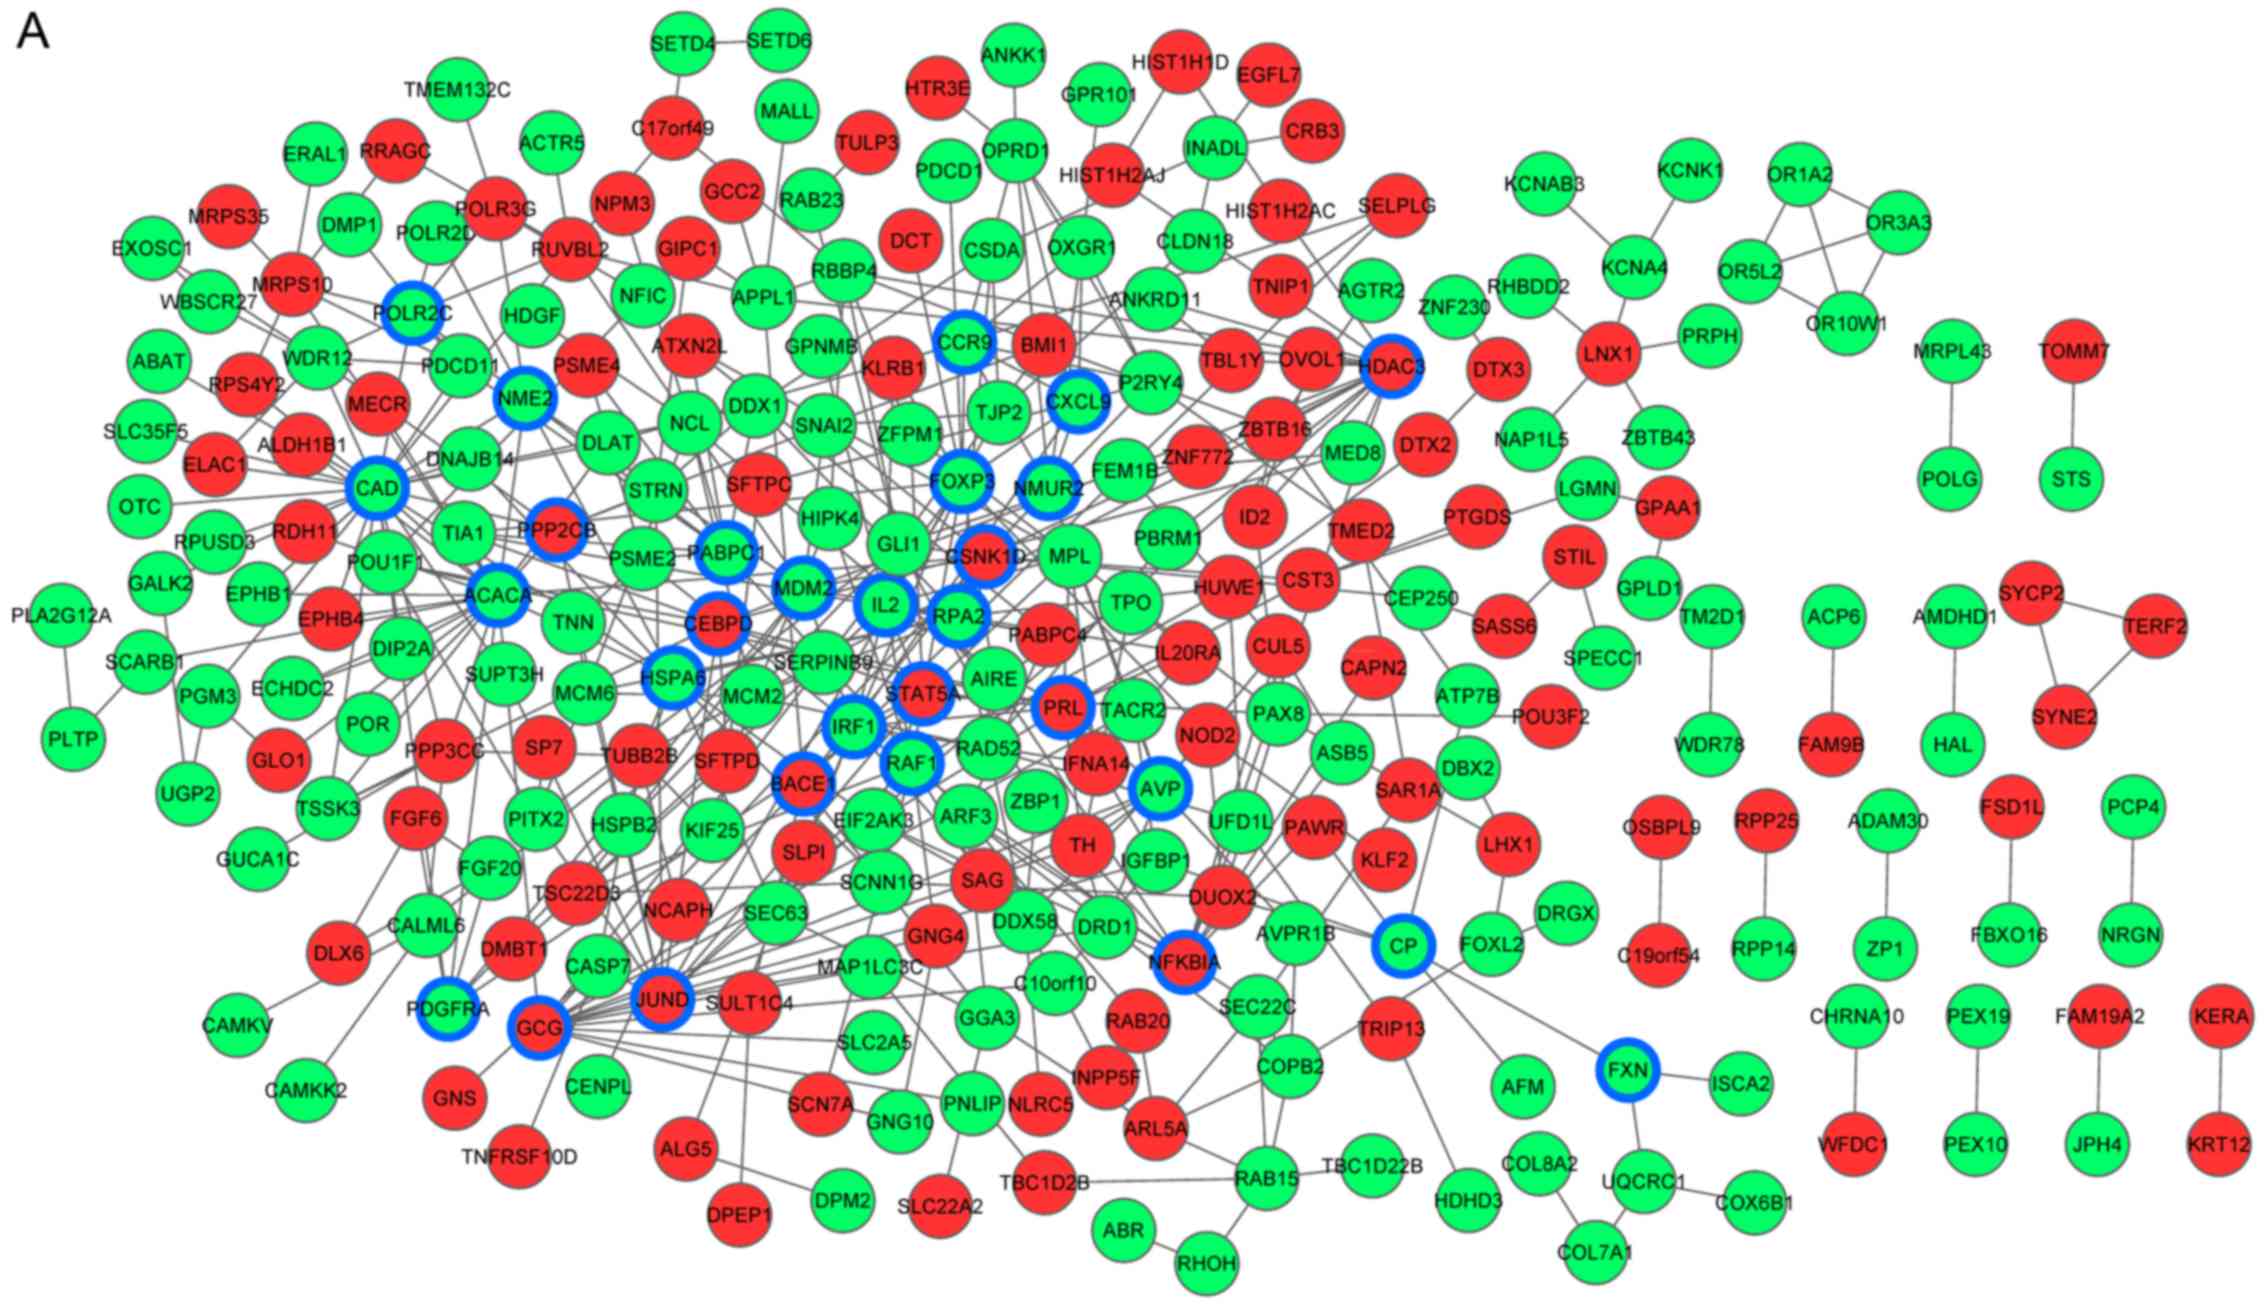 | Figure 2.PPI network for DEGs in tumors of
different stages. (A) PPI network for DEGs in tumors of stage IB.
(B) PPI network for DEGs in tumors of stage IIB. Red, upregulated
genes; green, downregulated genes; blue, key nodes. PPI,
protein-protein interaction; DEGs, differentially expressed genes.
PPI network for DEGs in tumors of different stages. (C) PPI network
for DEGs in tumors of stage IIIA. (D) PPI network for DEGs in
tumors of stage IV. Red, upregulated genes; green, downregulated
genes; blue, key nodes. PPI, protein-protein interaction; DEGs,
differentially expressed genes. |
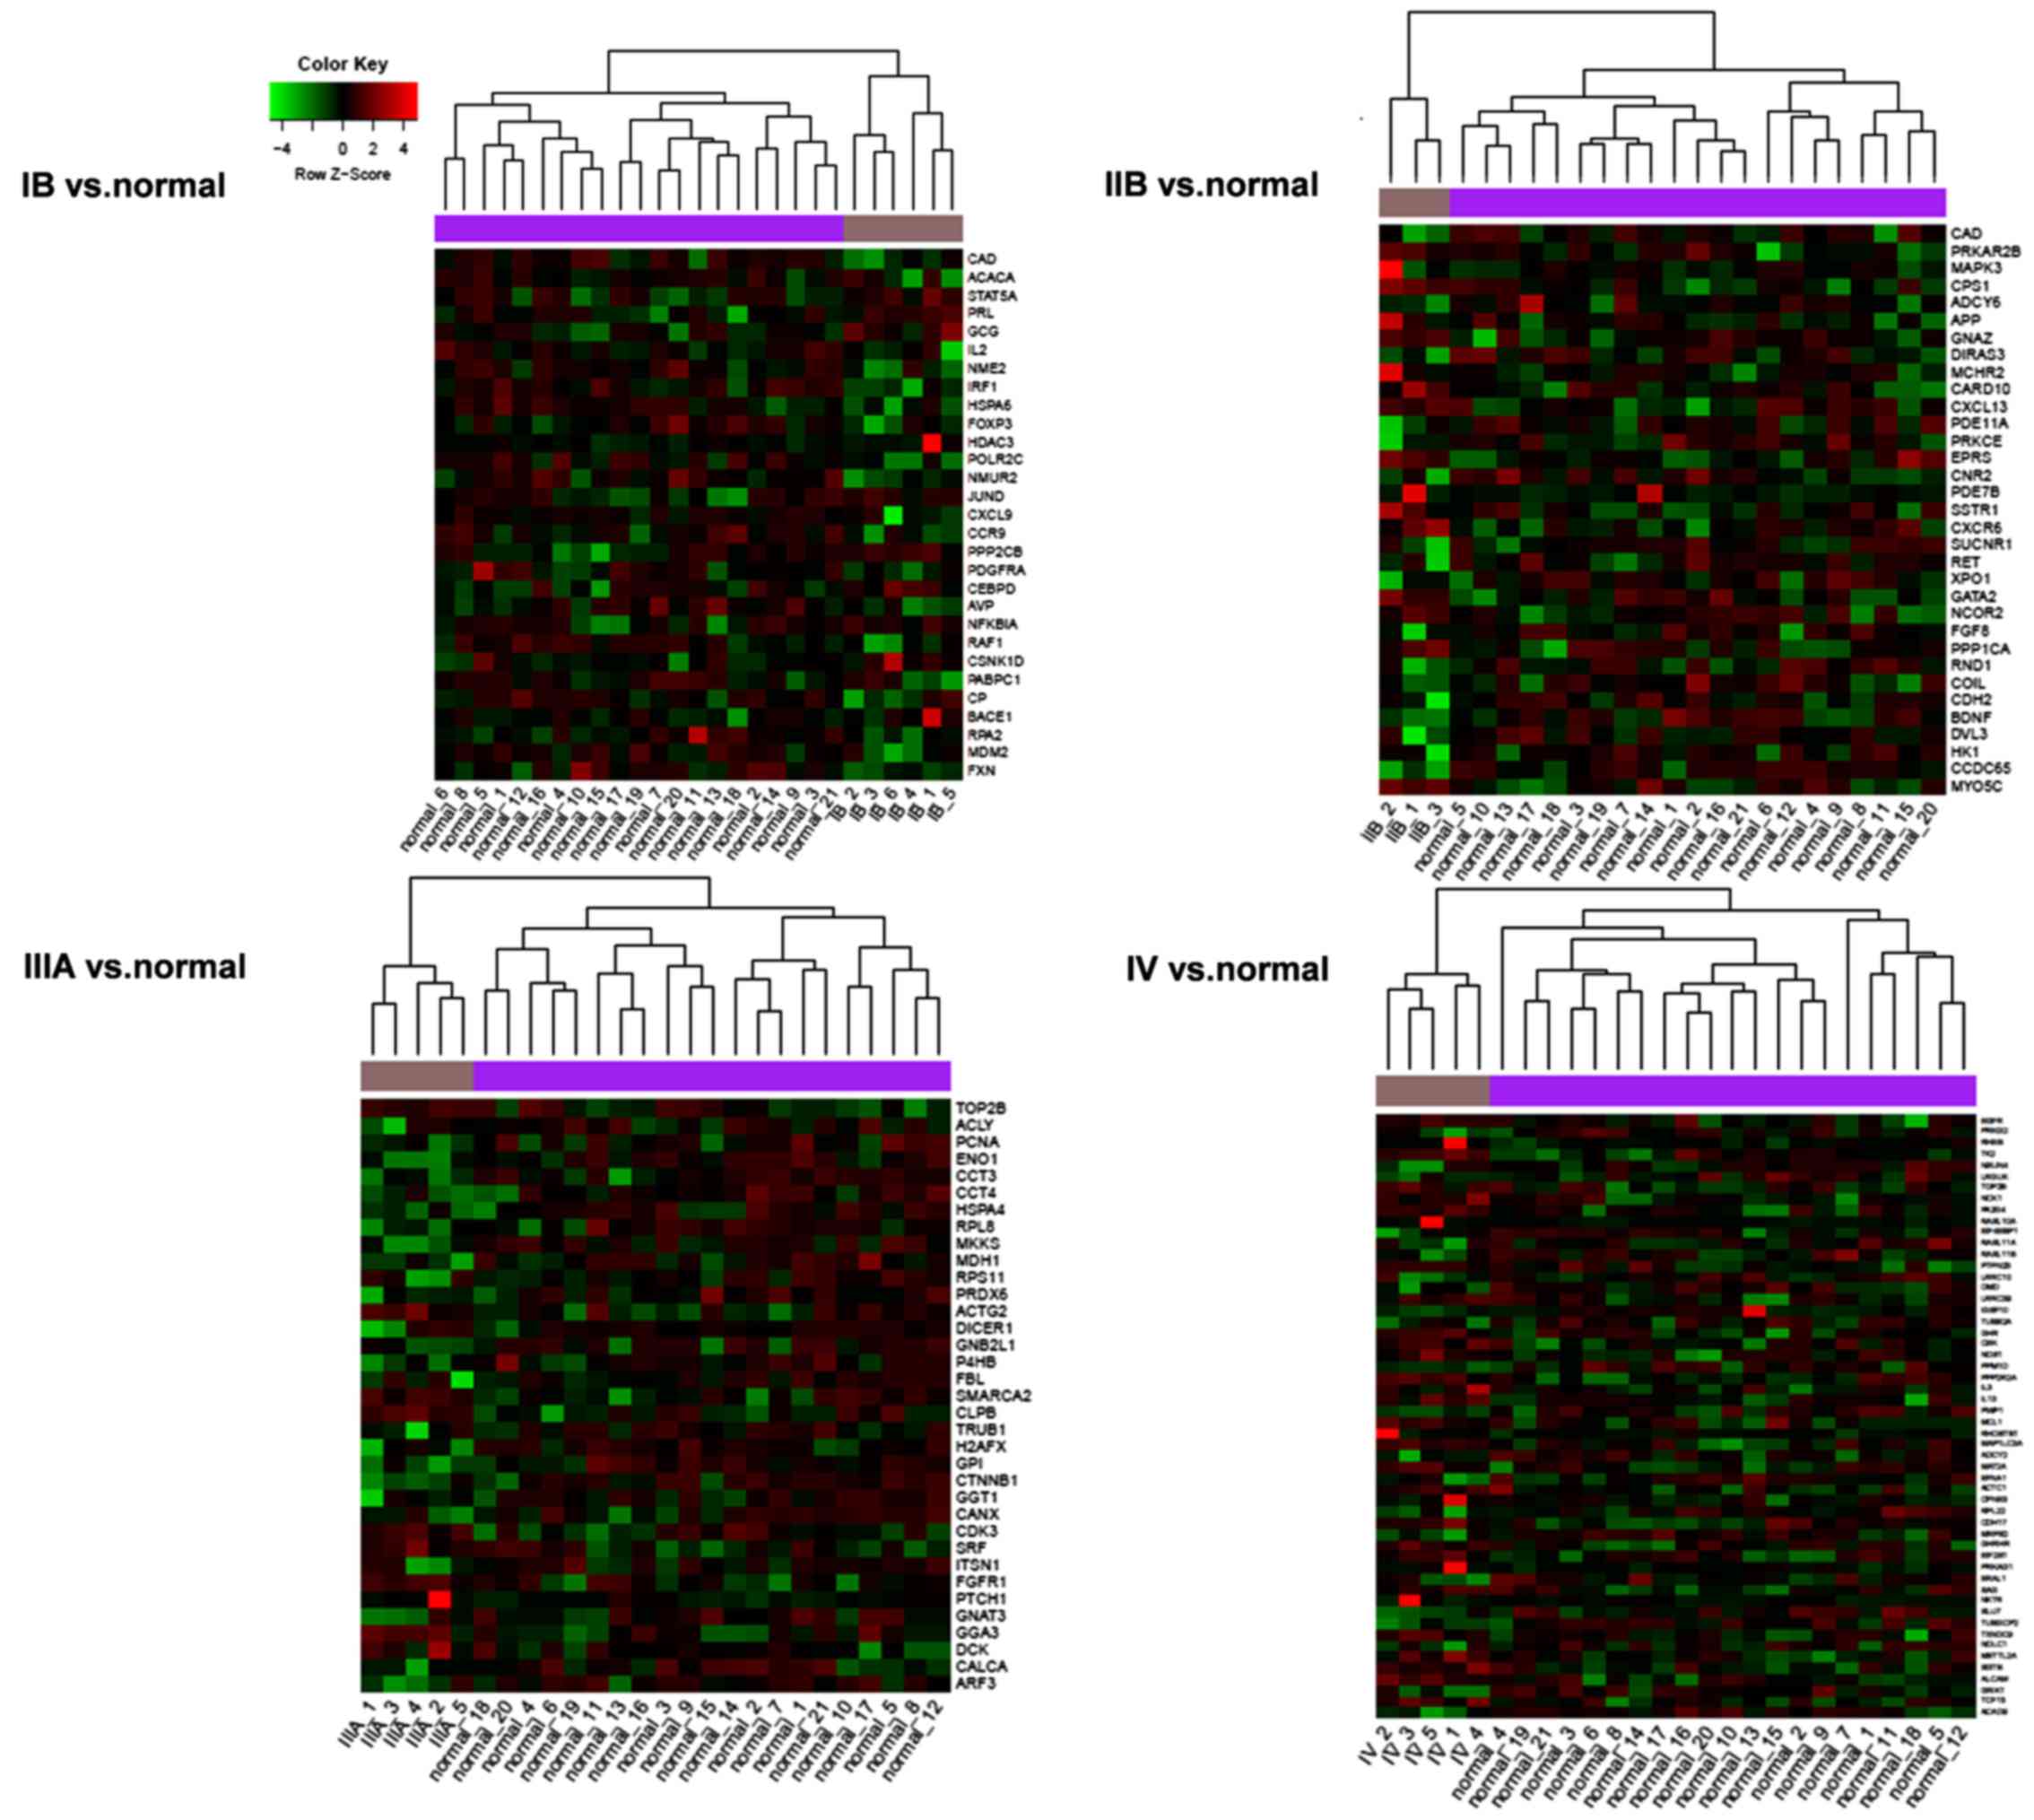
Identification of the key nodes in the
PPI network
Key nodes in the PPI network were identified by
integration analysis of the scores calculated based on network
centrality and the results of the clustering analysis. There were
29 key nodes in the stage IB group, 33 in the IIB group, 35 in the
IIIA group and 54 in the IV group (Fig.
2). All the key nodes identified in the present study were
differentially expressed and through their expression patterns we
were able to distinguish normal and tumor tissues (Fig. 3). The key nodes were significantly
enriched in cancer-related pathways, chronic myeloid leukemia, the
chemokine signaling pathway, gap junctions and the insulin
signaling pathway (Table IV).
| Table IV.The significant pathways for key
nodes in the PPI network. |
Table IV.
The significant pathways for key
nodes in the PPI network.
| Stages | Term | P-value | Genes |
|---|
| IB | hsa05220:Chronic
myeloid leukemia | 2.93E-03 | STAT5A, NFKBIA,
RAF1, MDM2 |
|
| hsa05215:Prostate
cancer | 4.76E-03 | PDGFRA, NFKBIA,
RAF1, MDM2 |
|
|
hsa04060:Cytokine-cytokine receptor
interaction | 1.74E-02 | CCR9, PDGFRA,
CXCL9, PRL, IL2 |
|
|
hsa05214:Glioma | 2.49E-02 | PDGFRA, RAF1,
MDM2 |
|
|
hsa05218:Melanoma | 3.11E-02 | PDGFRA, RAF1,
MDM2 |
|
| hsa04062:Chemokine
signaling pathway | 3.52E-02 | CCR9, CXCL9,
NFKBIA, RAF1 |
|
| hsa05200:Pathways
in cancer | 3.62E-02 | STAT5A, PDGFRA,
NFKBIA, RAF1, MDM2 |
|
| hsa04540:Gap
junction | 4.69E-02 | CSNK1D, PDGFRA,
RAF1 |
| IIB | hsa04270:Vascular
smooth muscle contraction | 1.50E-02 | PPP1CA, MAPK3,
ADCY6, PRKCE |
|
| hsa04930:Type II
diabetes mellitus | 2.03E-02 | MAPK3, HK1,
PRKCE |
|
| hsa04910:Insulin
signaling pathway | 2.46E-02 | PRKAR2B, PPP1CA,
MAPK3, HK1 |
| IV | hsa04540:Gap
junction | 7.13E-03 | EGFR, ADCY2,
TUBB2A, PRKG2 |
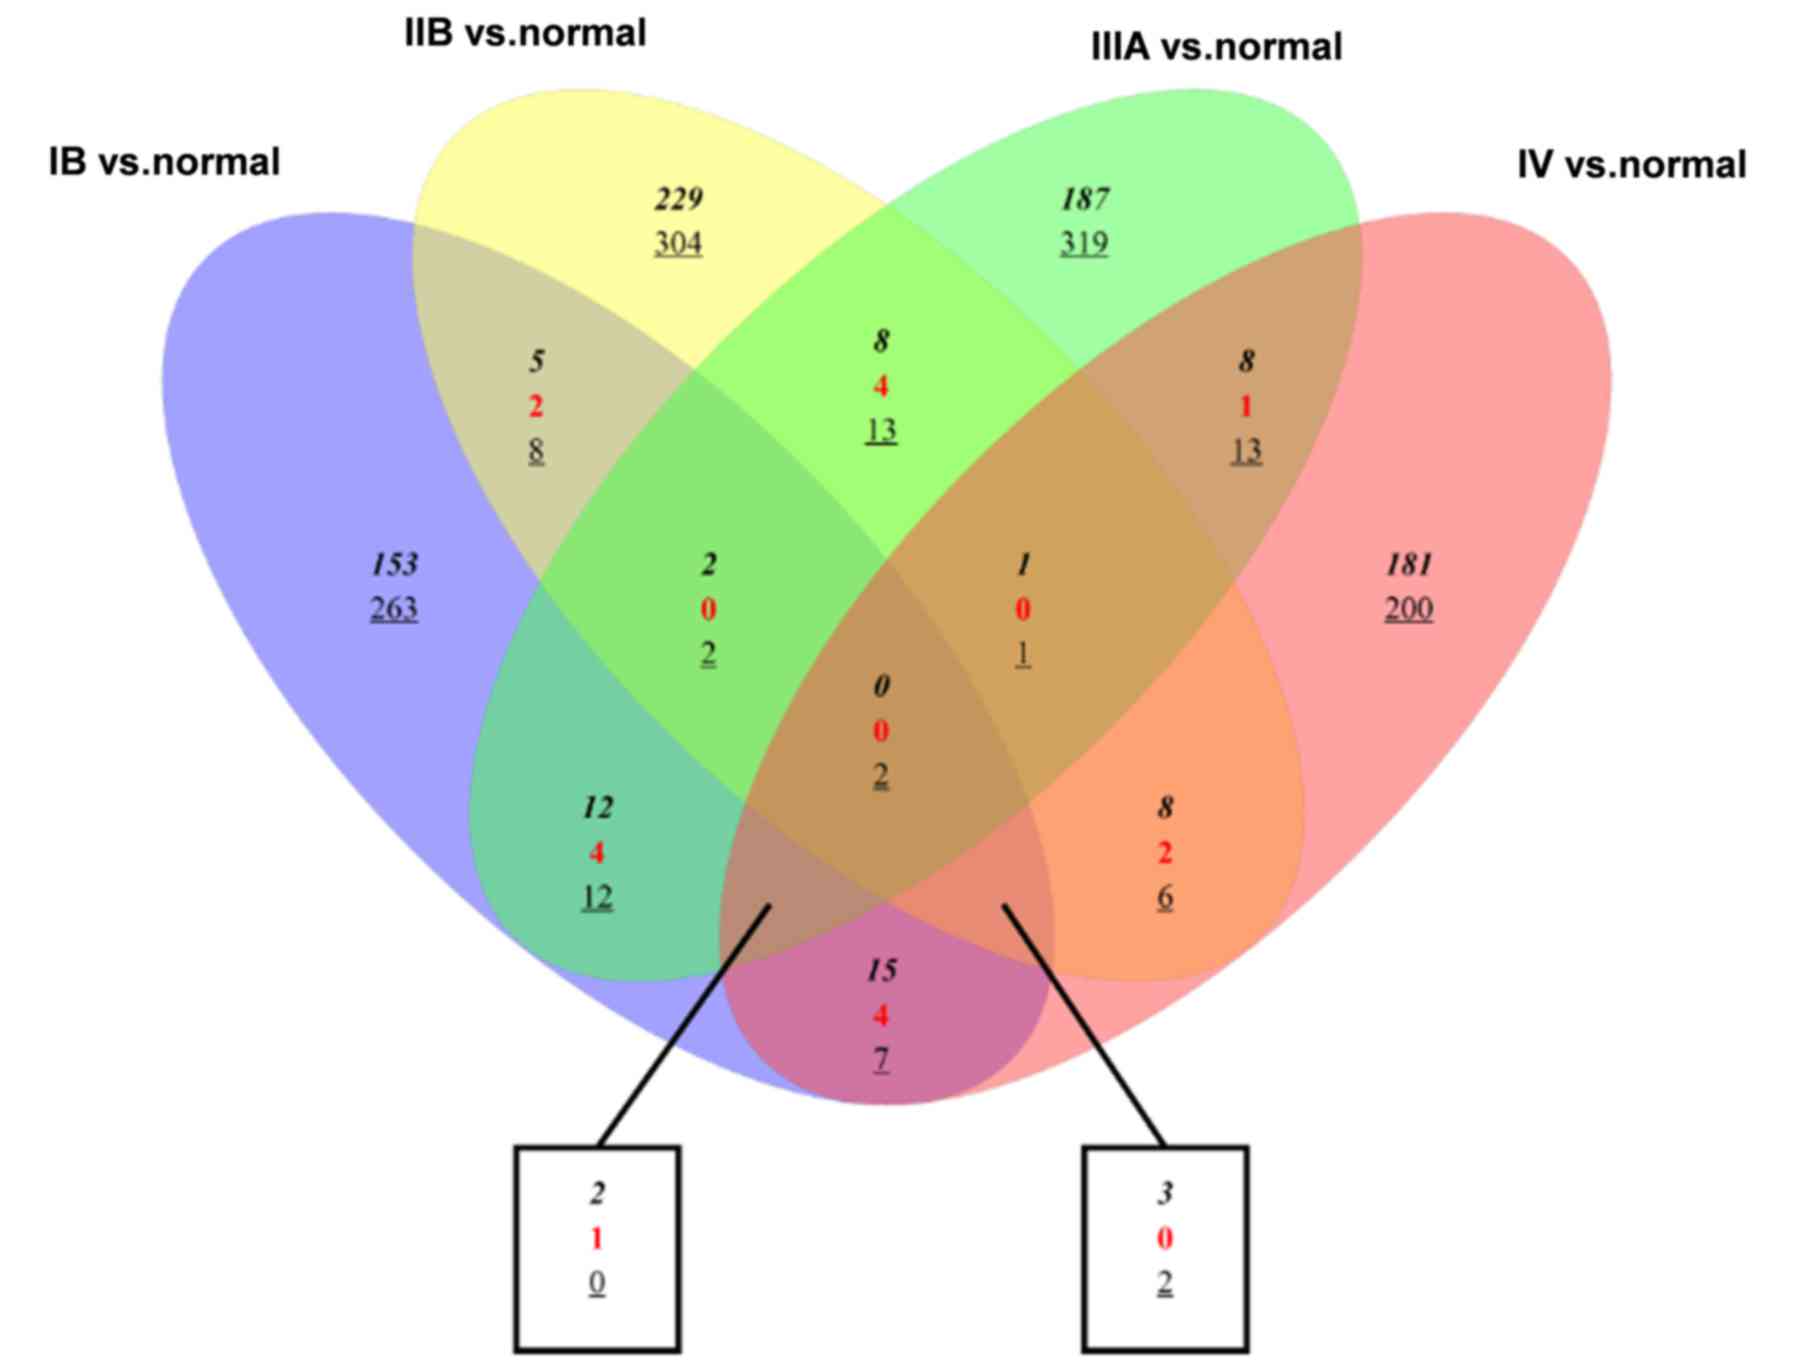
Venn diagram of DEGs
As shown in Fig. 4,
the number of genes that were differentially expressed at each
tumor stage was assessed and the diagrams also indicated the common
DEGs in tumors of stages IB, IIB, IIIA and IV. Most DEGs were
uniquely identified in a single tumor stage and a few genes were
commonly differentially expressed in the 4 tumor stages, such as
downregulated CNTN6 and LBX2.
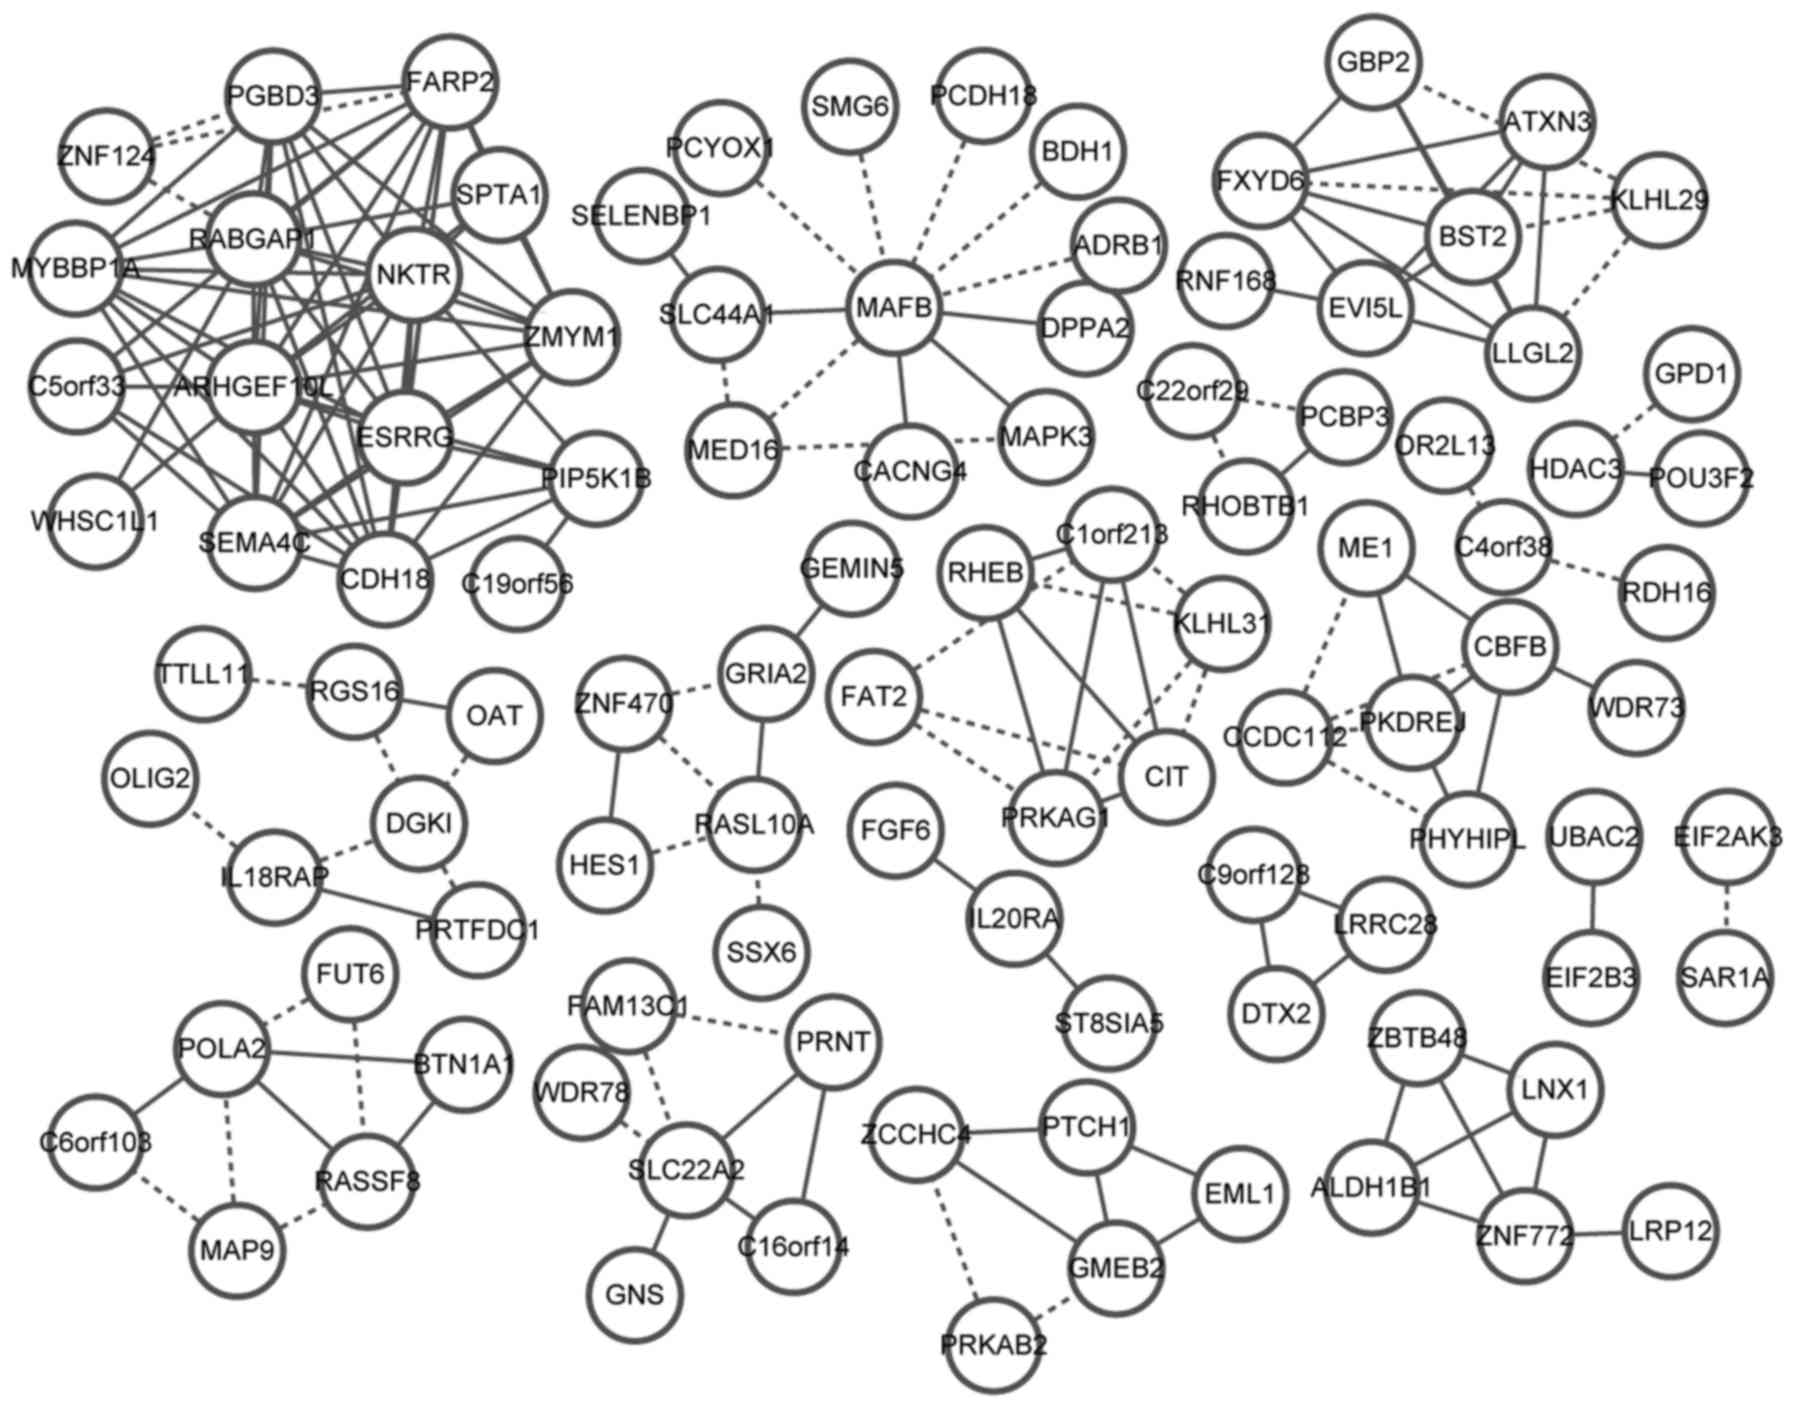
Identification of the coexpression
gene pairs
A total of 1,984 genes were obtained by pooling the
DEGs from different tumor stages, among which the coexpression gene
pairs were analyzed. The coexpression network was constructed with
102 nodes and 179 gene interaction pairs (Fig. 5). Among the 102 nodes, 16 genes were
involved in 65 gene pairs, such as SEMA4C, C19orf56,
MYBBP1A, SPTA1, NKTR, WHSC1L1,
FARP2, CDH18, C5orf33, ZNF124,
ESRRG, ARHGEF10L, RABGAP1, ZMYM1,
PIP5K1B and PGBD3.
NSCLC-related gene identification
According to the CTD database, most of the genes
were related with NSCLC during different stages. There were 372
genes (74.55%) among all the DEGs in the IB stage group, 465
(77.24%) for the IIB group, 466 (78.72%) in the IIIA group and 353
(77.24%) for the IV group (Table
V).
| Table V.NSCLC-related genes in tumors of
different stages. |
Table V.
NSCLC-related genes in tumors of
different stages.
| Groups | Total DEG
count | Disease related
gene count | Percentage |
|---|
| IB | 499 | 372 | 74.55 |
| IIB | 602 | 465 | 77.24 |
| IIIA | 592 | 466 | 78.72 |
| IV | 457 | 353 | 77.24 |
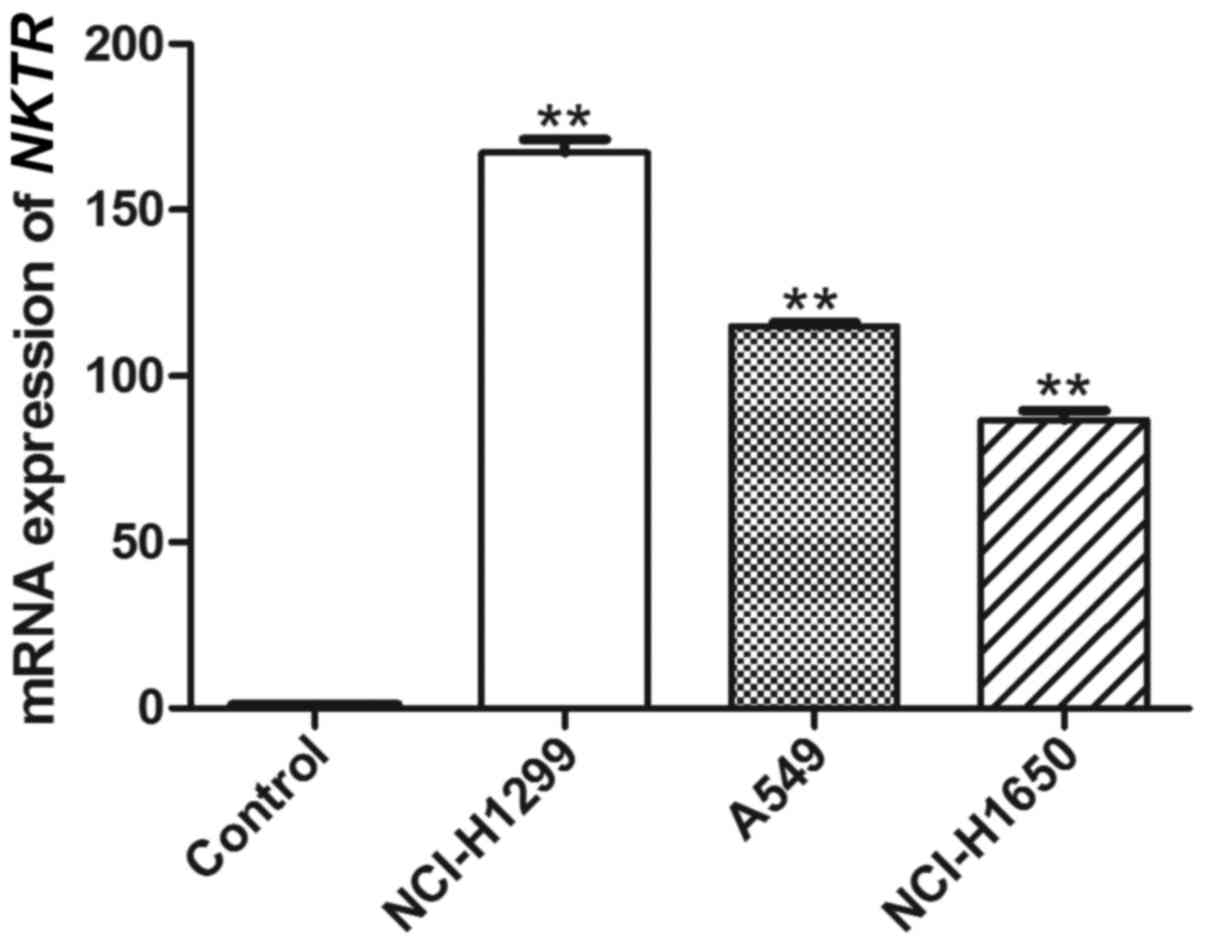
mRNA expression of NKTR
RT-PCR analysis of NKTR in A549, NCI-H1299
and NCI-H1650 cells was conducted to establish the differential
expression in NSCLC, compared with the BEAS-2B cells. As shown in
Fig. 6, the mean mRNA expression
levels of NKTR in A549, NCI-H1299 and NCI-H1650 cells were
significantly higher than those in the BEAS-2B cells (P<0.01),
which corresponded to the DEG analysis and further confirmed its
significance in NSCLC.
Discussion
In the present study, the gene expression profile
analysis of NSCLC tissues of different stages revealed the
significantly altered biological functions and pathways and
proposed some candidate genes for lung cancer treatment.
The data (GSE21933) analyzed in the study were the
cDNA microarray data. Both DNA and RNA microarray data can be used
to analyze the expression levels of genes by limma software
(1,2). The DEG analysis showed that there were
499, 602, 592 and 457 genes differentially expressed in tumors of
stages IB, IIB, IIIA and IV, respectively. Clustering analysis
revealed that based on the expression level of DEGs, the tumor and
normal samples were clearly distinguished. In addition, literature
research analysis confirmed that most of the DEGs identified in our
study were NSCLC-related genes. These findings suggested that the
DEGs established in our study were significant.
Function analysis showed that the significantly
altered biological process in the early lung cancer stage mainly
included negative regulation of signal transduction, apoptosis,
cellular di- and trivalent inorganic cation homeostasis (stage IB)
and positive regulation of the DNA metabolic process and the p53
signaling pathway (stage IIB). Previous evidence has shown that
lung cancer-related candidate genes are mainly related with
apoptosis, signal transduction and DNA repair. The ion transport is
a significantly altered biological process for both the Asian and
Caucasian population, which may play a key role in tumorigenesis
(8). p53 gene is a tumor-suppressor
gene and is reported to be frequently mutated in lung cancer
patients (22). Non-disruptive p53
mutations may decrease the survival rate in patients with advanced
NSCLC (23). Signal transduction
induced by focal adhesion kinase is found to inhibit the
p53-mediated apoptosis in malignant cells (24).
In the late-stage NSCLC tumors, the DEGs were
closely related with cell migration, response to organic substances
(stage IIIA) and regulation of synapse organization, structure and
activity (stage IV). Cell migration has been reported to be one of
the significantly altered biological processes in NSCLC cancer
patients (8), which is consistent
with our findings. The biological process of response to organic
substances was significantly altered in stage IIIA and IV NSCLC
tumors, indicating that this biological process may play a dominant
role in the late stages of lung cancer. The role of the synapse
regulation-related biological process has not been clarified in
lung cancer progression. Thus, the altered biological processes
warrant further study. Above all, the biological processes and
pathways in NSCLC progression may be altered in a stage-dependent
manner. The DEG enriched biological processes and pathways were
different in early-stage and late-stage NSCLC, which was determined
by Venn diagram analysis. The Venn diagram illustrated that a few
genes had similar expression patterns in NSCLC at different stages,
which revealed that NSCLC at different stages induced differential
gene expression patterns leading to the dysfunction of various
biological processes.
Additionally, after removing the overlapped genes, a
total of 1,984 DEGs were obtained in tumors of stages IB, IIB, IIIA
and IV. The coexpression network composed of 16 genes and 65
coexpression pairs was the most significant. The protein
interaction pairs corresponding to DEGs can be predicted by
integrating the information deposited in STRING (13). Cytoscape is a free software package
and widely used in analyzing the results of mRNA expression
profiling, functional genomic and proteomic experiments in the
context of an interaction network obtained for genes of interest
(14). Thus, protein interactions
were able to be obtained based on the microarray data in the study.
NKTR was one of the genes among the 16 genes that showed
multiple coexpression interactions with others. Simultaneously, PPI
analysis showed that NKTR was a key node in stage IV tumor tissues
according to degree, betweenness and subgraph centrality. In
addition, according to expression patterns of NKTR, tumor
and normal tissues could be clearly distinguished. RT-PCR of gene
validation analysis showed that NKTR was significantly
upregulated in NSCLC cells, compared with normal epithelial
cells.
All these findings indicated that NKTR is a
significant DEG that plays a critical role in NSCLC progression.
NKTR has been found to be differentially expressed in human
lung squamous cell carcinoma and is located in chromosome 3p23-p21
according to the cDNA library (25). NKTR as a component of a spliceosome,
has functions in protein folding. NKTR-102 is considered as a novel
PEGylated-irinotecan conjugate, which functions in the inhibition
of the growth of human colorectal and lung tumors (26). Although the role of NKTR in
NSCLC has not been clarified, NKTR and its coexpressed genes
may play a key role in NSCLC progression.
In this study, the microarray data of GSE21933 were
developed from NSCLC patients including 10 early-stage patients (6
stage IB, 3 stage IIB and 1 stage IA) and 11 late-stage patients (5
stage IIIA, 5 stage IV and 1 stage IIIB). Due to the small number
of samples at stage IA and IIIB, we only analyzed the remaining 19
tumor samples compared with the corresponding controls. In the
original study, the microarray data of GSE21276 were produced from
tumor and normal tissues of 40 Asian and 20 Caucasian NSLCL
patients and was aimed to characterize the gene expression profiles
in different racial groups. However, in the present study, we
attempted to analyze the changes in gene expression profiles during
the different tumor stages. The detailed information of the 19
patients was not provided in the original study, thus we cannot
provide information on the type of tumors. In our present study, we
performed gene validation experiments in A549 (adenocarcinoma),
NCI-H1299 (large-cell carcinoma) and NCI-H1650 (adenocarcinoma)
cells, and determined that NKTR was a candidate gene in
NSLCL prevention and treatment.
Despite some previous microarray data that were also
developed from a small number of samples (27,28),
the small sample size used may be a limitation in our study.
Further studies with a larger size of samples are warranted in the
near future.
In conclusion, the gene expression patterns are
different at various stages of NSCLC tumors, from early-stage to
late-stage, which lead to the dysfunction of different biological
processes. Different mechanisms may be involved in the progression
of NSCLC tumors from early-stage to late-stage. An adequate
understanding of the pathogenesis underlying different tumor stages
may be helpful in new therapy development. NKTR is commonly
differentially expressed in stage IB, IIB, IIIA and IV tumors.
NKTR and its coexpressed gene pairs may be candidate genes
for the prevention and treatment of NSCLC.
Glossary
Abbreviations
Abbreviations:
|
NSCLC
|
non-small cell lung cancer
|
|
PPI
|
protein-protein interaction
|
|
NCBI GEO
|
National Center for Biotechnology
Information Gene Expression Omnibus
|
|
DAVID
|
Database for Annotation, Visualization
and Integrated Discovery
|
|
GO
|
Gene Ontology
|
|
KEGG
|
Kyoto Encyclopedia of Genes and
Genomes
|
|
CTD
|
Comparative Toxicogenomics
Database
|
References
|
1
|
Paez JG, Jänne PA, Lee JC, Tracy S,
Greulich H, Gabriel S, Herman P, Kaye FJ, Lindeman N, Boggon TJ, et
al: EGFR mutations in lung cancer: Correlation with clinical
response to gefitinib therapy. Science. 304:1497–1500. 2004.
View Article : Google Scholar : PubMed/NCBI
|
|
2
|
Edwards BK, Noone AM, Mariotto AB, Simard
EP, Boscoe FP, Henley SJ, Jemal A, Cho H, Anderson RN, Kohler BA,
et al: Annual Report to the Nation on the status of cancer,
1975–2010, featuring prevalence of comorbidity and impact on
survival among persons with lung, colorectal, breast, or prostate
cancer. Cancer. 120:1290–1314. 2014. View Article : Google Scholar : PubMed/NCBI
|
|
3
|
Strauss GMHJ, Maddaus MA, Johnstone DW,
Johnson EA, Watson DM, Sugarbaker DJ, Schilsky RA, Vokes EE and
Green MR: Adjuvant chemotherapy in stage IB non-small cell lung
cancer (NSCLC): Update of Cancer and Leukemia Group B (CALGB)
protocol 9633. In: ASCO Annual Meeting Abstract. 24:Suppl
20072006.
|
|
4
|
Winton T, Livingston R, Johnson D, Rigas
J, Johnston M, Butts C, Cormier Y, Goss G, Inculet R, Vallieres E,
et al: National Cancer Institute of Canada Clinical Trials Group;
National Cancer Institute of the United States Intergroup JBR.10
Trial Investigators: Vinorelbine plus cisplatin vs. observation in
resected non-small-cell lung cancer. N Engl J Med. 352:2589–2597.
2005. View Article : Google Scholar : PubMed/NCBI
|
|
5
|
Huang Q, RT II Dunn, Jayadev S, DiSorbo O,
Pack FD, Farr SB, Stoll RE and Blanchard KT: Assessment of
cisplatin-induced nephrotoxicity by microarray technology. Toxicol
Sci. 63:196–207. 2001. View Article : Google Scholar : PubMed/NCBI
|
|
6
|
Lu Y, Lemon W, Liu P-Y, Yi Y, Morrison C,
Yang P, Sun Z, Szoke J, Gerald WL, Watson M, et al: A gene
expression signature predicts survival of patients with stage I
non-small cell lung cancer. PLoS Med. 3:e4672006. View Article : Google Scholar : PubMed/NCBI
|
|
7
|
Jiang F, Qiu Q, Khanna A, Todd NW, Deepak
J, Xing L, Wang H, Liu Z, Su Y, Stass SA, et al: Aldehyde
dehydrogenase 1 is a tumor stem cell-associated marker in lung
cancer. Mol Cancer Res. 7:330–338. 2009. View Article : Google Scholar : PubMed/NCBI
|
|
8
|
Lo FY, Chang JW, Chang IS, Chen YJ, Hsu
HS, Huang SF, Tsai FY, Jiang SS, Kanteti R, Nandi S, et al: The
database of chromosome imbalance regions and genes resided in lung
cancer from Asian and Caucasian identified by array-comparative
genomic hybridization. BMC Cancer. 12:2352012. View Article : Google Scholar : PubMed/NCBI
|
|
9
|
Ritchie ME, Phipson B, Wu D, Hu Y, Law CW,
Shi W and Smyth GK: limma powers differential expression analyses
for RNA-sequencing and microarray studies. Nucleic Acids Res.
43:e472015. View Article : Google Scholar : PubMed/NCBI
|
|
10
|
Smyth GK: limma: linear models for
microarray dataBioinformatics and Computational Biology Solutions
Using R and Bioconductor. Gentleman R, Carey VJ, Huber W, Irizarry
RA and Dudoit S: Springer; NY, New York: pp. 397–420. 2005,
View Article : Google Scholar
|
|
11
|
Warnes GR, Bolker B, Bonebakker L,
Gentleman R, Liaw WHA, Lumley T, Maechler M, Magnusson A, Moeller
S, Schwartz M, et al: gplots: Various R programming tools for
plotting data. R package version. 2:2009.https://cran.r-project.org/web/packages/gplots
|
|
12
|
Huang W, Sherman BT and Lempicki RA:
Systematic and integrative analysis of large gene lists using DAVID
bioinformatics resources. Nat Protoc. 4:44–57. 2009. View Article : Google Scholar : PubMed/NCBI
|
|
13
|
Szklarczyk D, Franceschini A, Wyder S,
Forslund K, Heller D, Huerta-Cepas J, Simonovic M, Roth A, Santos
A, Tsafou KP, et al: STRING v10: protein-protein interaction
networks, integrated over the tree of life. Nucleic Acids Res.
43:D447–D452. 2015. View Article : Google Scholar : PubMed/NCBI
|
|
14
|
Shannon P, Markiel A, Ozier O, Baliga NS,
Wang JT, Ramage D, Amin N, Schwikowski B and Ideker T: Cytoscape: A
software environment for integrated models of biomolecular
interaction networks. Genome Res. 13:2498–2504. 2003. View Article : Google Scholar : PubMed/NCBI
|
|
15
|
Opsahl T, Agneessens F and Skvoretz J:
Node centrality in weighted networks: Generalizing degree and
shortest paths. Soc Networks. 32:245–251. 2010. View Article : Google Scholar
|
|
16
|
Goh KI, Oh E, Kahng B and Kim D:
Betweenness centrality correlation in social networks. Phys Rev E
Stat Nonlin Soft Matter Phys. 67:0171012003. View Article : Google Scholar : PubMed/NCBI
|
|
17
|
Estrada E and Rodríguez-Velázquez JA:
Subgraph centrality in complex networks. Phys Rev E Stat Nonlin
Soft Matter Phys. 71:0561032005. View Article : Google Scholar : PubMed/NCBI
|
|
18
|
Tang Y, Li M, Wang J, Pan Y and Wu FX:
CytoNCA: A cytoscape plugin for centrality analysis and evaluation
of protein interaction networks. Biosystems. 127:67–72. 2015.
View Article : Google Scholar : PubMed/NCBI
|
|
19
|
Cai H, Chen H, Yi T, Daimon CM, Boyle JP,
Peers C, Maudsley S and Martin B: VennPlex - a novel Venn diagram
program for comparing and visualizing datasets with differentially
regulated datapoints. PLoS One. 8:e533882013. View Article : Google Scholar : PubMed/NCBI
|
|
20
|
Liang M, Zhang F, Jin G and Zhu J:
FastGCN: A GPU accelerated tool for fast gene co-expression
networks. PLoS One. 10:e01167762015. View Article : Google Scholar : PubMed/NCBI
|
|
21
|
Davis AP, Grondin CJ, Lennon-Hopkins K,
Saraceni-Richards C, Sciaky D, King BL, Wiegers TC and Mattingly
CJ: The Comparative Toxicogenomics Database's 10th year
anniversary: Update 2015. Nucleic Acids Res. 43:D914–D920. 2015.
View Article : Google Scholar : PubMed/NCBI
|
|
22
|
Gibbons DL, Byers LA and Kurie JM:
Smoking, p53 mutation, and lung cancer. Mol Cancer Res. 12:3–13.
2014. View Article : Google Scholar : PubMed/NCBI
|
|
23
|
Molina-Vila MA, Bertran-Alamillo J, Gascó
A, Mayo-de-las-Casas C, Sánchez-Ronco M, Pujantell-Pastor L,
Bonanno L, Favaretto AG, Cardona AF, Vergnenègre A, et al:
Nondisruptive p53 mutations are associated with shorter survival in
patients with advanced non-small cell lung cancer. Clin Cancer Res.
20:4647–4659. 2014. View Article : Google Scholar : PubMed/NCBI
|
|
24
|
Ilić D, Almeida EA, Schlaepfer DD, Dazin
P, Aizawa S and Damsky CH: Extracellular matrix survival signals
transduced by focal adhesion kinase suppress p53-mediated
apoptosis. J Cell Biol. 143:547–560. 1998. View Article : Google Scholar : PubMed/NCBI
|
|
25
|
Sun W, Zhang K, Zhang X, Lei W, Xiao T, Ma
J, Guo S, Shao S, Zhang H, Liu Y, et al: Identification of
differentially expressed genes in human lung squamous cell
carcinoma using suppression subtractive hybridization. Cancer Lett.
212:83–93. 2004. View Article : Google Scholar : PubMed/NCBI
|
|
26
|
Eldon MA, Staschen CM, Viegas T and
Bentley M: NKTR-102, a novel PEGylated-irinotecan conjugate,
results in sustained tumor growth inhibition in mouse models of
human colorectal and lung tumors that is associated with increased
and sustained tumor SN38 exposureAacr-Nci-Eortc International
Conference on Molecular Targets and Cancer Therapeutics. San
Franciso: 2007
|
|
27
|
Ramadori G, Konstantinidou G,
Venkateswaran N, Biscotti T, Morlock L, Galié M, Williams NS,
Luchetti M, Santinelli A, Scaglioni PP and Coppari R: Diet-induced
unresolved ER stress hinders KRAS-driven lung tumorigenesis. Cell
Metab. 21:117–125. 2015. View Article : Google Scholar : PubMed/NCBI
|
|
28
|
Stueckle TA, Lu Y, Davis ME, Wang L, Jiang
BH, Holaskova I, Schafer R, Barnett JB and Rojanasakul Y: Chronic
occupational exposure to arsenic induces carcinogenic gene
signaling networks and neoplastic transformation in human lung
epithelial cells. Toxicol Appl Pharmacol. 261:204–216. 2012.
View Article : Google Scholar : PubMed/NCBI
|