Introduction
Clear cell renal cell carcinoma (ccRCC) is the most
frequent RCC subtype and is characterized by a high mortality rate
of 40% within 5 years, due to late diagnosis and distant metastases
found in 30 (1) to 80% (2) of RCC patients at the time of
examination or within the course of the disease. Among patients who
undergo radical resection of the tumor, future metastatic disease
develops in 20–40% of the ccRCC cases (3). The search for new molecular targets is
continuing due to the high mortality rate of advanced RCC patients
(4).
The Hippo pathway is an important regulator of cell
proliferation, apoptosis, stem cell functions (5,6) as
well as tissue growth and regeneration. Its deregulation is
commonly observed in many human cancers, suggesting that
alterations of Hippo signaling may be associated with tumor
initiation and/or progression (7–9). The
Hippo core cassette is formed by MST2 (serine/threonine kinase 3,
STK3) and large tumor suppressor kinase 1 (LATS1) kinases (10). The phosphorylation of LATS1 by MST2
(with SAV1 and MOB1A/B co-activators) inhibits its transcriptional
co-activator and downstream effector - Yes-associated protein 1
(YAP1) (11) via its
phosphorylation, sequestration to the cytoplasm followed by YAP1
degradation (4,12). When YAP1 is located in the nucleus,
it interacts with several transcriptional factors including TEA
domain transcription factor 1–4 (TEAD1-4), OCT4, TP73 and ZEB1
(13). Increased expression of the
YAP1 protein is associated with tissue regeneration or
carcinogenesis (11,14,15).
Moreover, the deregulation of the Hippo pathway components and/or
YAP1 expression is frequently associated with the progression of
various malignancies. Decreased expression of LATS1 gene and
protein was observed in breast (16), colorectal (17) and non-small cell lung cancers
(18), whereas lower MST2 mRNA and
protein levels were reported in hepatocellular carcinoma (19) and malignant mesothelioma (20). Furthermore, the overexpression of
YAP1 protein was observed in many cancer types, including lung
(21), prostate (22), breast (23), and gallbladder cancers (24) and glioma (25). Since to date no quantitative
analyses of the expression of the Hippo pathway effector, YAP1, and
its key components, MST2 and LATS1 kinases, have been assessed in
ccRCC, we decided to compare their mRNA and protein levels in tumor
and normal kidney tissues, and in metastases of ccRCC. We also
analyzed the methylation status of LATS1 and MST2
gene promoters by methylation-specific high-resolution-melting
quantitative PCR (MS-HRM-qPCR), a novel quantitative technique.
Materials and methods
Patients and samples
Tissue samples were collected from 86 ccRCC patients
who underwent radical nephrectomy at the Department of Urology,
Medical University of Gdansk, Poland, between January 2011 and
September 2013. The clinical data of patients are presented in
Table I. The study was approved by
the local Ethics Committee; written consent was obtained before
surgery from each patient.
 | Table I.Clinicopathological features of the
ccRCC patients and the association between YAP1,
LATS1 and MST2 mRNA levels and clinical data. |
Table I.
Clinicopathological features of the
ccRCC patients and the association between YAP1,
LATS1 and MST2 mRNA levels and clinical data.
|
| YAP1 qPCR results,
n (%) | LATS1 qPCR results,
n (%) | MST2 qPCR results
n, (%) |
|---|
|
|
|
|
|
|---|
| Patient
characteristics (n=86) | Low (≤0.382) | High
(>0.382) | P-value (low vs.
high)a | Low (≤1.982) | High
(>1.982) | P-value (low vs.
high)a | Low (≤0.539) | High
(>0.539) | P-value (low vs.
high)a |
|---|
| Age (years) |
| Mean:
62.16±11.24 |
| Range:
33–83 |
|
≤62 | 15 (17) | 30 (35) | 0.64 | 39 (45) | 6 (7) | 1.00 | 24 (28) | 21 (24) | 0.66 |
|
>62 | 11 (13) | 30 (35) |
| 36 (42) | 5 (6) |
| 19 (22) | 22 (26) |
|
| Sex |
| Female
(n=38) | 10 (12) | 28 (32) | 0.64 | 29 (31) | 9 (10) | 0.43 | 16 (19) | 22 (26) | 0.28 |
| Male
(n=48) | 16 (19) | 32 (37) |
| 46 (49) | 2 (10) |
| 27 (31) | 21 (24) |
|
| Tumor size
(cm) |
| ≤7
(n=50 | 12 (14) | 24 (28) | 0.64 | 39 (45) | 6 (7) | 1.00 | 23 (27) | 13 (15) | 0.048 |
| >7
(n=36) | 14 (16) | 36 (42) |
| 36 (52) | 5 (6) |
| 20 (23) | 30 (35) |
|
| Fuhrmans
histological grade |
| 1+2
(n=35) | 14 (16) | 21 (24) | 0.08 | 27 (32) | 8 (9) | 0.04 | 17 (20) | 18 (21) | 1.00 |
| 3+4
(n=51) | 12 (14) | 39 (45) |
| 48 (56) | 3 (3) |
| 26 (30) | 25 (29) |
|
| TNM stage |
|
Non-metastatic |
|
T1-2N0M0 | 21 (24) | 16 (19) |
<0.0001 | 29 (34) | 8 (9) | 0.04 | 18 (21) | 19 (22) | 1.00 |
|
Metastatic |
|
T1-2N1M0 | 5 (6) | 44 (51) |
| 46 (53) | 3 (3) |
| 25 (29) | 24 (28) |
|
|
T3N0-1M0 |
|
T4N0-2M0 |
|
T1-4N2M0 |
|
T1-4N0-2M1 |
Sample acquisition
Samples were obtained according to our previous
reports (26,27). In short, dissected tissue samples of
primary ccRCC tumors (n=86, named T), normal kidney (n=86, named C
as control) and adrenal gland or the whole lymph node (n=12, named
M), were collected in the operating theatre (by J.K.) and placed
immediately in approximately five volumes of RNAlater (Ambion Inc.,
Austin, TX, USA).
Assessment of MST2, LATS1 and YAP1
mRNA expression
RNA isolation and cDNA synthesis were performed as
previously described (26,27). Briefly, ExtractMe RNA kit
(DNAGdansk, Gdansk, Poland) was used for RNA extraction. Two
micrograms of total RNA was reverse transcribed with the use of
RevertAid Reverse Transcriptase (Fermentas-Thermo Fischer
Scientific, Fitchburg, WI, USA). qPCR details are presented in
Table II. All reactions were run
in duplicate. Based on the results of our previous study on the
choice of suitable qPCR reference gene in ccRCC (27), we chose the assessment of
GUSB gene expression to normalize the mRNA levels in the
samples with the use of Schmittgen and Livaks ΔΔCt equation
(28).
| Table II.Details of qPCR assays. |
Table II.
Details of qPCR assays.
| Assay | Primer
sequences | Amplicon size/CpGs
in product | qPCR
efficiency | qPCR reaction
conditions | qPCR reaction
content |
|---|
| LATS1 |
5′-AAGTATTTTTGGTGGGGTAGAG | 96 bp/9 nt | 93% | 95°C, 5 min; 42x
(95°C, 5 sec; 56°C, 10 sec; | 5 µl SensiFast
HRM |
| promoter
methylation |
5′-AAAAAAAACCAAATCCTCAC |
|
| 72°C, 10 sec; 73
°C, 10 sec - sample reading). | (with Eva-Green
fluorophone) |
| MST2 |
5′-TTTGGAAAAAGATAAGGTTTTTAT | 118 bp/7 nt | 91% | Melting curve:
95°C, 15 sec; 60°C, 1 min; | (BioLine, London,
UK), |
| promoter
methylation |
5′-CCTAAAATTAACTCTCAACCTCTC |
|
| 60°C → 95°C reading
every 0.1°C | 300 nM each primer,
∑ 10 µl |
| LATS1 mRNA
level |
5′-TGCACTGGCTTCAGATGGACAC | 177 bp | 93.4% | 95°C, 3 min; 37x
(95°C, 5 sec; 58°C, 10 sec; | 5 µl SensiFast
NoRox |
| measurment |
5′-ATGTGCTAGACATCGCTGGTGC |
|
| 72°C, 10 sec; 75
°C, 10 sec - sample reading). | SYBR-Green |
| MST2 mRNA
level |
5′-CTATAACTGTGTGGCCGACATCTGG | 223 bp | 90.3% | Melting curve:
95°C, 15 sec; 60°C, 1 min; |
|
| measurment |
5′-TTGTGTTGCAGTAGCTCTCTGCTC |
|
| 60°C → 95°C reading
every 0.3°C | (BioLine, London,
UK), |
| YAP1 mRNA
level |
5′-TCAGACAACAACATGGCAGGACC | 235 bp | 101.3% |
| 200 nM each primer,
Σ 10 µl |
| measurment |
5′-TCTCTGGTTCATGGCAAAACGAGG |
|
|
|
|
| GUSB mRNA
level |
5′-ATGCAGGTGATGGAAGAAGTGGTG | 177 bp | 99.6% | 95°C, 3 min; 35x
(95°C, 5 sec; 57°C, 10 sec; |
|
| measurment for qPCR
normalization |
5′-AGAGTTGCTCACAAAGGTCACAGG |
|
| 72°C, 10 sec; 75
°C, 10 sec - sample reading) Melting curve: 95°C, 15 sec; 60°C, 1
min; 60°C → 95°C reading every 0.3°C. Melting curve: 95°C, 15 sec;
60°C, 1 min; 60°C → 95°C reading every 0.3° |
|
DNA extraction, bisulfite
modification, acquisition of control DNA and MS-HRM-qPCR
The methodology has been previously described
(26). In short, DNA was isolated
to a total volume of 20 µl followed by bisulfide modification (DNA
Methylation-Direct™ kit; Zymo Research, Irvine, CA, USA). For the
generation of a dilution series of control DNA standards, fully
methylated (named MD) and unmethylated (UMD) human genomic DNAs
(Zymo) were used.
Methylation was assessed in the samples with the use
of the MS-HRM-qPCR method (29).
Reactions were set on the Step-One Plus apparatus, then post-PCR
products were analyzed with the use of HRM software ver. 3.1 (both
from Life Technologies, Grand Island, NY, USA). For each run,
matched DNA from T, C and M samples were set; standard dilutions of
control MD and UMD were made to 100, 50, 25, 10 and 0 of MD in UMD
and used in the same PCR plate as well as the no template
control.
Western blot analysis
Protein lysates were prepared with Mammalian Cell
Extraction kit (BioVision, Milpitas, CA, USA). The lysates (10 µg)
were loaded onto a 10% Mini-Protean TGX gel (Bio-Rad, Hercules, CA,
USA), resolved by SDS-PAGE, and transferred to a PVDF membrane
using the Trans-Blot Turbo system (Bio-Rad). Membranes were stained
with 0.1% Ponceau S to ensure equal loading after transfer, and
subsequently blocked with 5% albumin fraction V in TBS buffer with
0.1% Tween-20 (TBST) for 1 h at room temperature (RT). After
washing with TBST, the membranes were incubated (overnight, 4°C)
with specific primary antibodies in 2% albumin/TBS: rabbit
anti-LATS1 (1:2,000, Bioss, Woburn, MA, USA), rabbit polyclonal
anti-YAP1 (1:1,000), and rabbit monoclonal anti-MST2(STK3)
(1:2,000) (both from Abcam, Cambridge, UK) and anti-GAPDH
peroxidase-conjugated IgM (1:50,000; Sigma-Aldrich, St. Louis, MO,
USA). After triple washing with TBST, the blots were incubated for
2 h at RT with horseradish peroxidase-conjugated secondary
antibodies: anti-rabbit IgG or anti-mouse IgG (1:15,000;
Sigma-Aldrich). Following triple washing with TBST, immunoreactive
bands were detected on medical X-ray film (Agfa HealthCare,
Mortsel, Belgium) using chemiluminescent peroxidase substrate
(Sigma-Aldrich). Densitometric analysis of immunoreactive protein
bands was performed with Quantity One software (Bio-Rad) and
calculated as units = intensity/mm2. After normalization
to GAPDH protein units for each sample, the semi-quantitative
results for either tumor or metastasized samples were obtained as a
ratio: mean unitsT/M/mean unitsC for MST2,
LATS1 or YAP1 proteins.
Statistical analysis
Statistical analysis was performed with the use of
the GraphPad Prism ver. 6.05 software (GraphPad Software, San
Diego, CA, USA). The following statistical tests were used:
non-parametric Mann-Whitney U, Kruskal-Wallis ANOVA, Fisher's 2×2
exact test, multivariate regression, and Cox-Mantel proportional
hazard regression model. Survival relationships were presented as
hazard ratios (HR) with their 95 confidence interval (CI) and
p-values (30) using Cox and
Kaplan-Meier estimations. Rates of overall survival (OS) and
progression-free survival (PFS) were calculated separately. In all
analyses, a two-sided p<0.05 was considered as statistically
significant with a 95% CI.
Results
Clinicopathological characteristics of
the patients
Of the 86 ccRCC patients (62.1±11.2 years, mean age
± SD) (Table I), 37 were diagnosed
as stage I (T1-2N0M0), 8 as stage II (T2N0M0), 12 as stage III
(T1-2N1M0 or T3N0-1M0) and 29 as stage IV (T4N0-2M0 or T1-4N2M0 or
T1-4N0-2M1). TNM stages of the kidney cancer are as follows: stage
I, tumor ≤7 cm and limited to the kidney; stage II, tumor 7–10 cm,
limited to the kidney; stage III, tumor extends into major veins or
perinephric tissues but not into the ipsilateral adrenal gland and
not beyond Gerota fascia or T1-T3 with metastasis in a single
regional lymph node; stage IV, metastasis in more than one regional
lymph node or distant metastasis (31). At the time of surgery, 47.7% of the
ccRCC patients were diagnosed with local or distant metastases.
Histological nuclear staging in renal cancer is based on the
Fuhrman grading; grade 1: small, round, uniform nuclei (10
microns), inconspicuous nucleoli; grade 2: slightly irregular
nuclei, nuclear diameter 15 microns, open chromatin; grade 3:
visible nucleoli, nuclei very irregular, diameter 20 microns, open
chromatin (32). According to
Fuhrman's division 4 patients were grade 1, 32 grade 2, 23 grade 3
and 26 were grade 4. None of the patients underwent chemotherapy or
radiotherapy before surgery. The mean follow-up period was 21
months (range, 3–48). To date, 45 patients were alive (52%); all
deaths (except for one patient) were related to ccRCC progression.
Median OS rate was 12 months. During follow-up, metastases occurred
in 38 (44%) patients while the median PFS rate was 6 months.
Expression of the YAP1, LATS1 and MST2
genes at the mRNA level
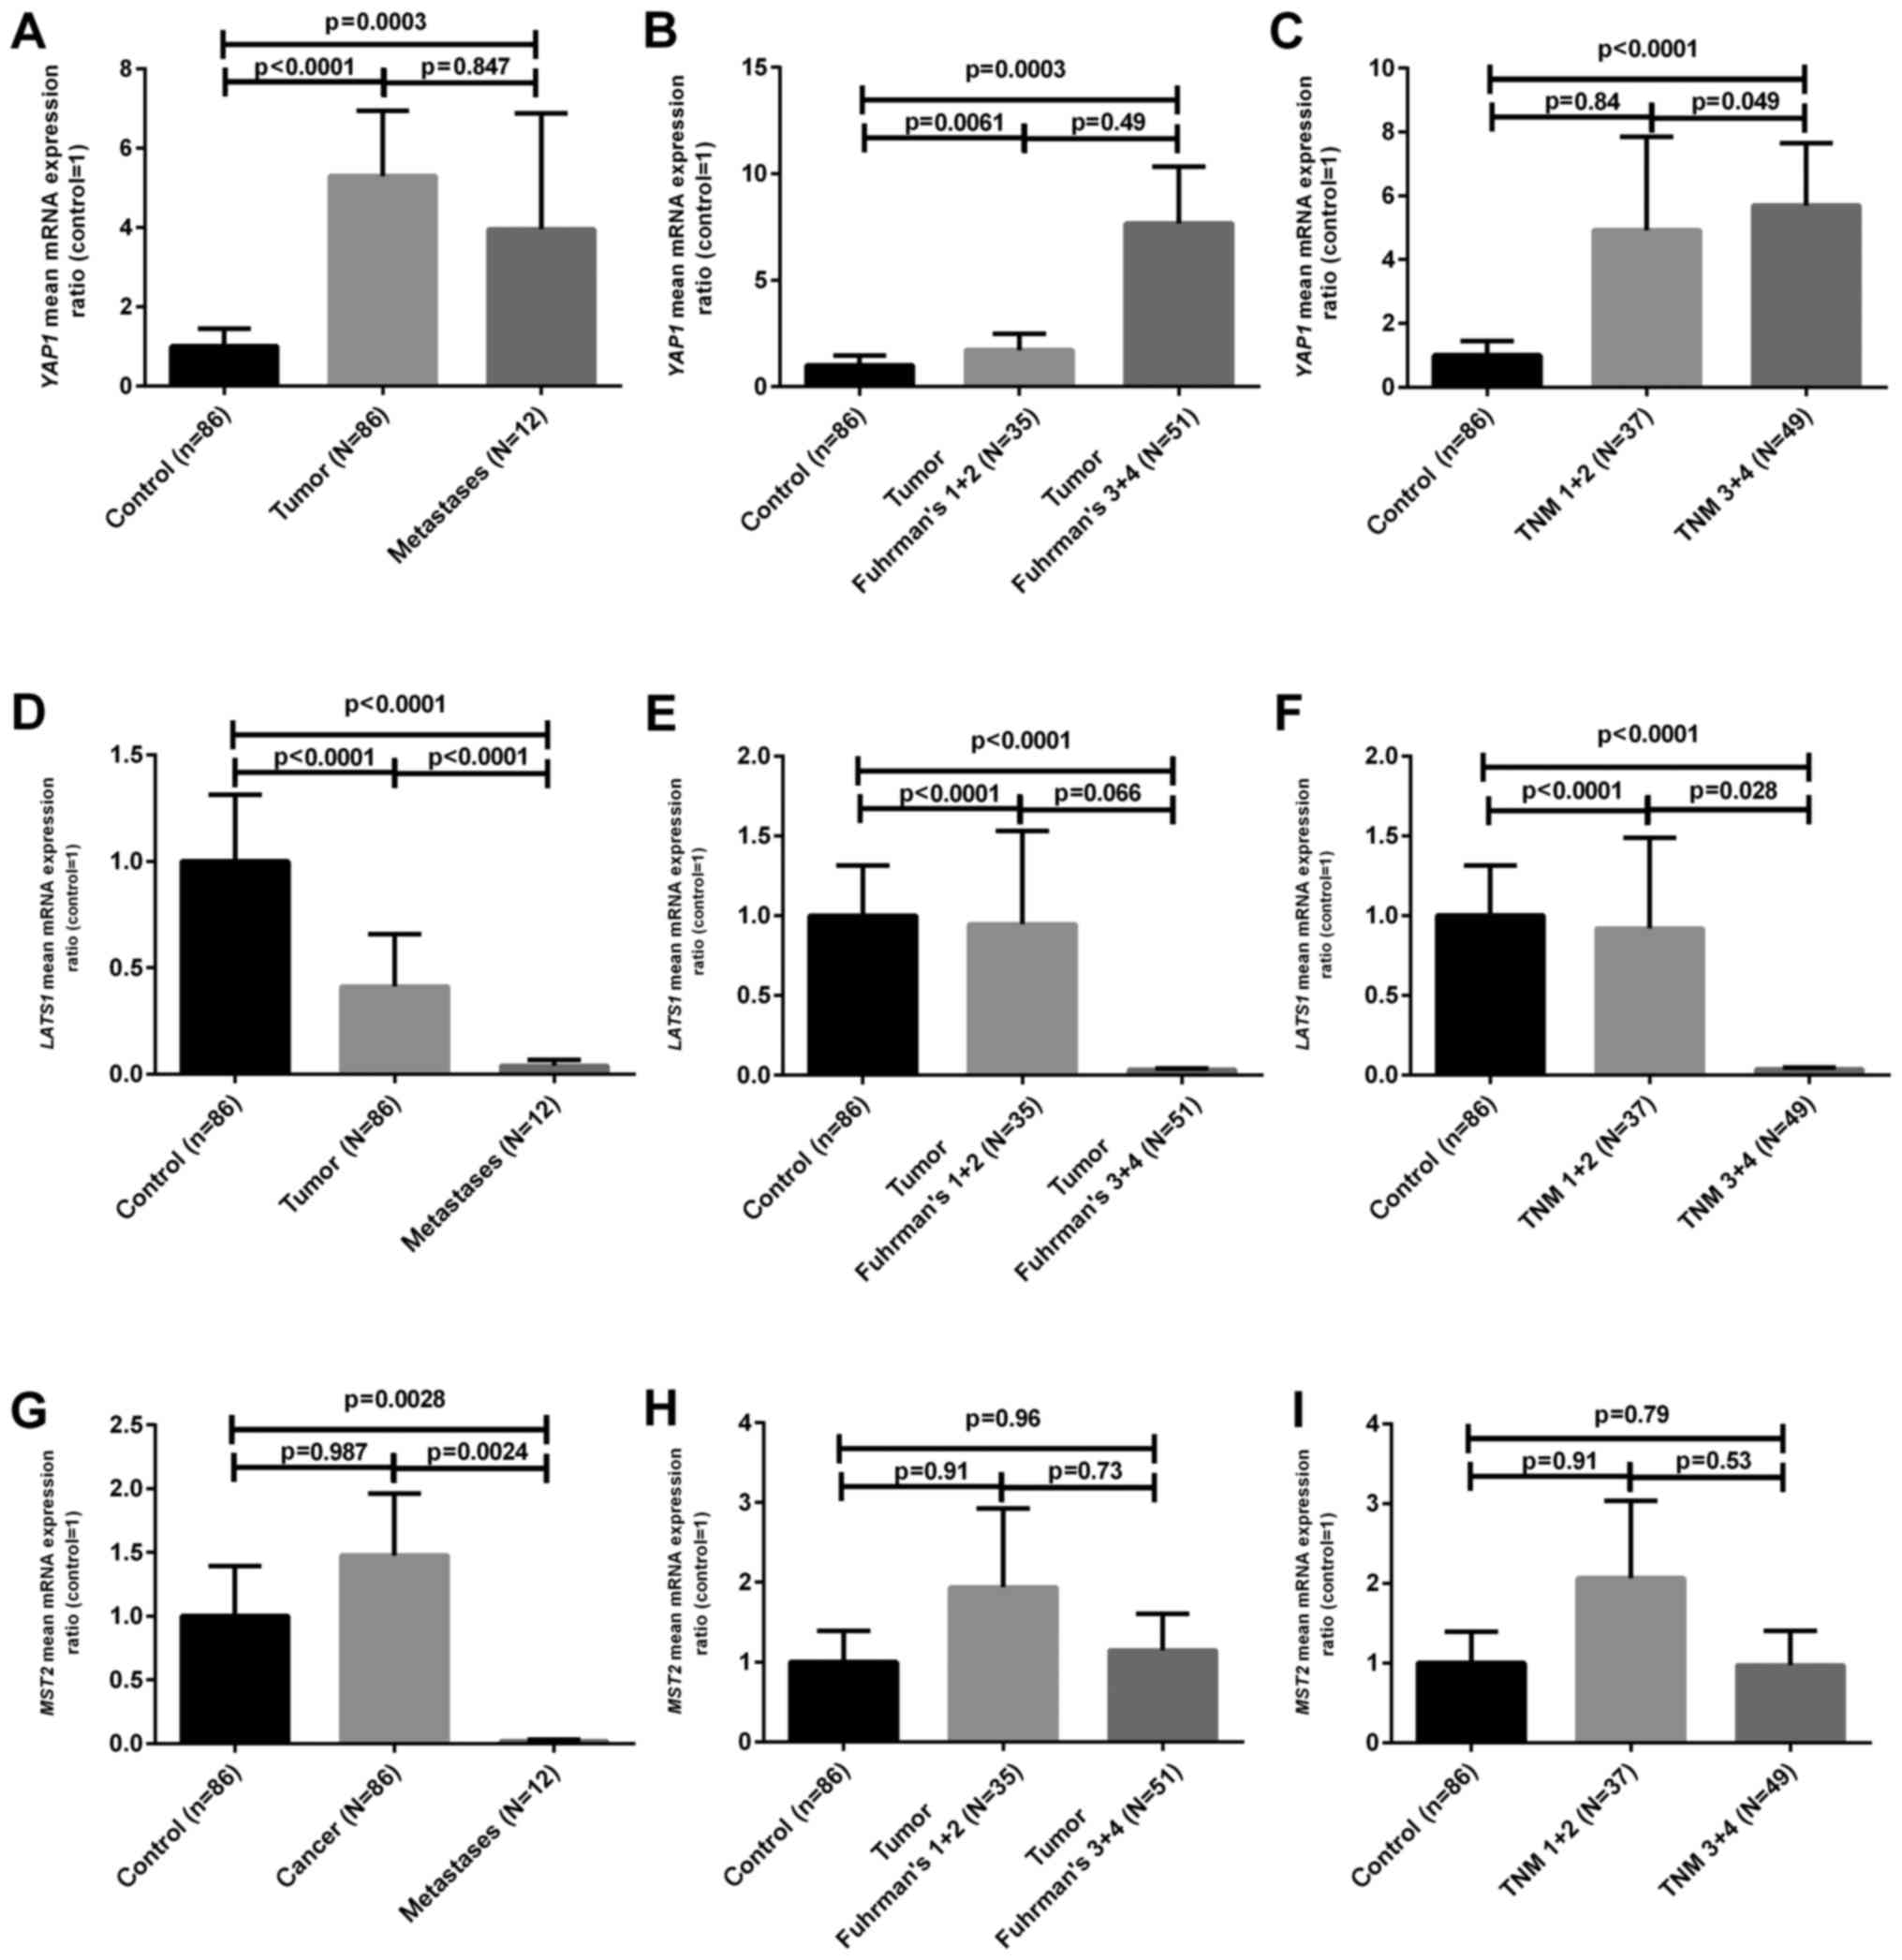
As shown in Fig. 1A,
YAP1 mRNA levels in T (tumor) and M (metastatic) samples
were ~5 and 4 times higher when compared to the C (control tissue)
samples, respectively (p<0.01). When the samples were divided
according to median mRNA values in the C samples, we found that 60
(70%) out of 86 tumor samples contained an increased YAP1
mRNA level (Table I). The mRNA
levels of LATS1 were ~3 and 25 times lower in the T and M
samples (p<0.05) (Fig. 1D) and
lower LATS1 mRNA content was observed in 75/86 (87%) tumor
samples (Table I). On the contrary,
the expression of MST2 at the mRNA level was decreased only
in M samples, showing a statistically not significantly increased
ratio in 43/86 (50%) T samples as compared to the level in the
control tissue (Fig. 1G and
Table I). The comparison of the
clinicopathological data with mRNA levels revealed that poorly
developed ccRCC tumors (Fuhrman's grades 3 and 4) were
characterized by decreased LATS1 and increased YAP1
mRNA levels (Table I and Fig. 1B and E) as compared to the control
samples. In addition, we found either lower LATS1 mRNA level
or higher YAP1 mRNA ratio in tumor ccRCC cases which were
diagnosed with local (N1-2) or distant metastasis (M1) as shown in
Table I and Fig. 1C and F. No statistically significant
relationships between MST2 mRNA ratios and clinical data
were observed except for the higher content of MST2
transcript in samples obtained from larger tumors (Table I).
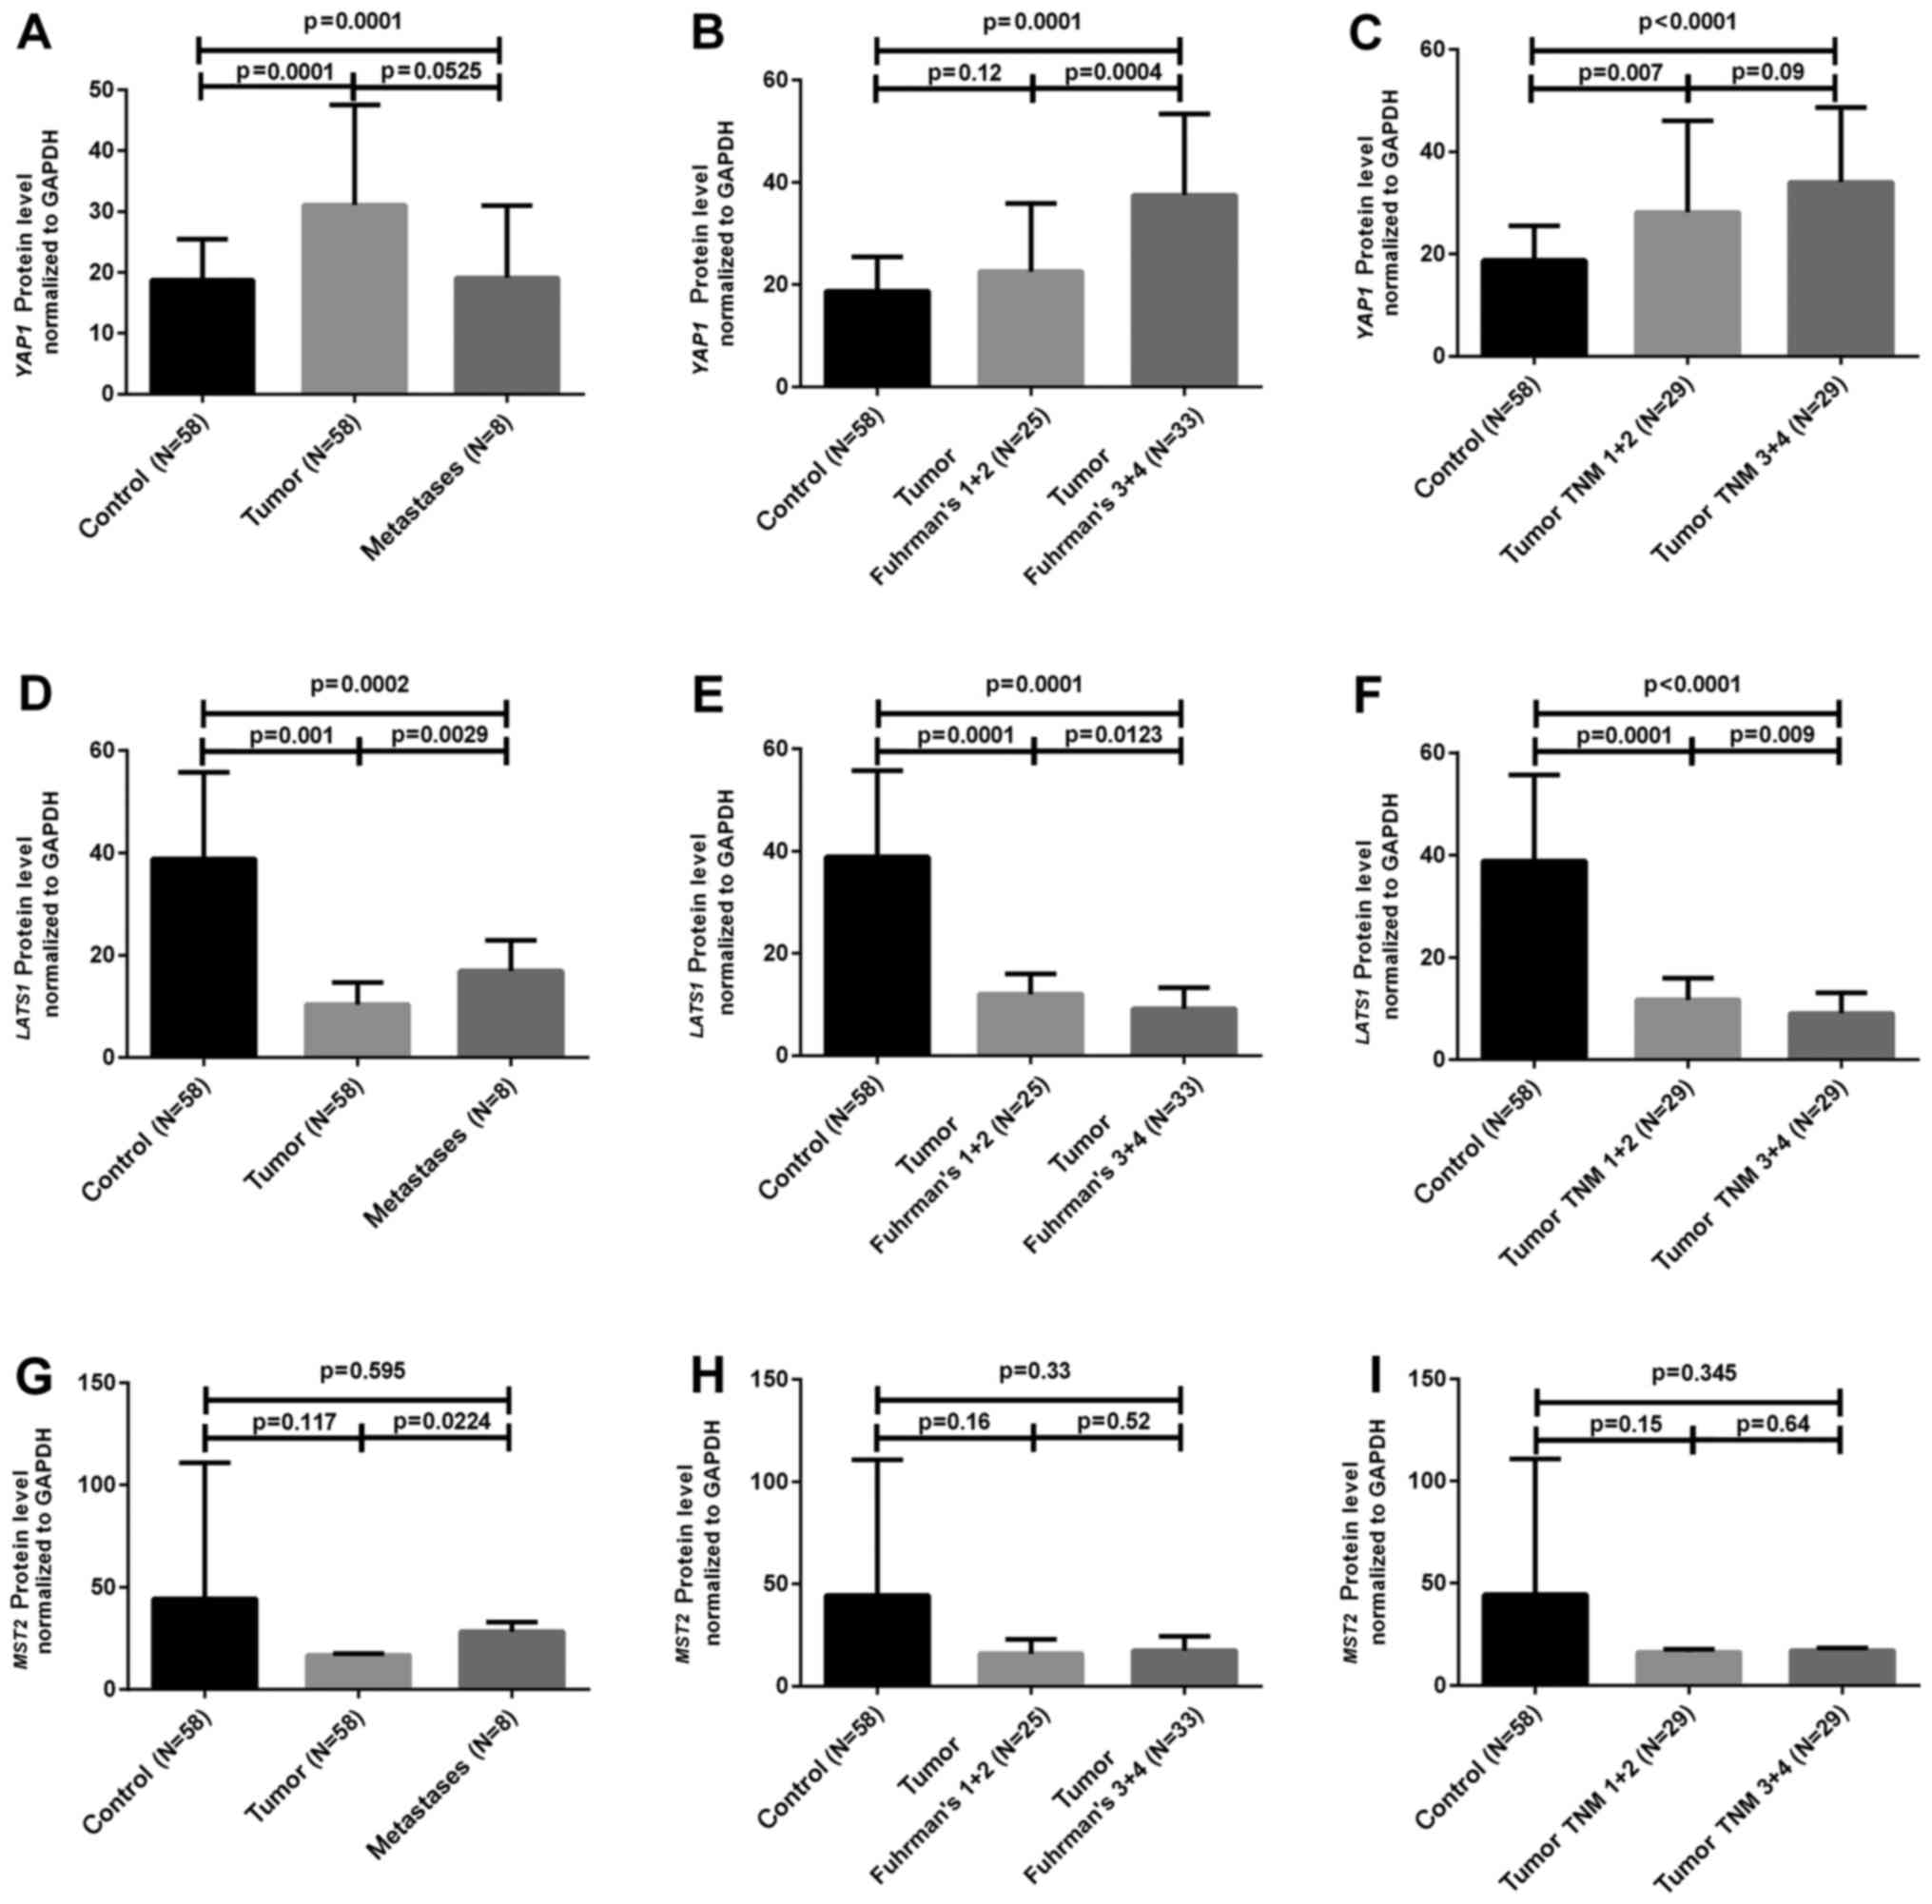
Expression of YAP1, LATS1 and MST2
proteins
The semi-quantification of the studied proteins
normalized to GAPDH protein was performed in paired samples of 58
ccRCC cases as well as in 8 M cases. As presented in Fig. 2A and Table III, the YAP1 protein level was ~2
times higher in 47 (81%) of the 58 analyzed T samples, whereas
LATS1 protein ratio was ~4 times lower in 42 (72%) T samples when
compared to the C samples (Fig.
2D). The relationship between clinicopathological data and
LATS1 and YAP1 protein expression was noted. Poorly developed (high
Fuhrman's grades) T cases were characterized by increased YAP1 and
decreased LATS1 protein ratios (Table
III and Fig. 2B and E). The
difference in protein expression of either LATS1 or YAP1 between
non-metastatic vs. metastatic tumor ccRCC cases was observed
(Table III and Fig. 2C and F). Semi-quantification of MST2
protein did not show any differences either between tumor and
normal kidney samples or between cancer samples classified
according to clinicopathological status (Table III and Fig. 2G H and I).
| Table III.Comparison between YAP1, LATS1 and
MST2 protein levels, LATS1 and MST2 methylation
status and clinical data of the 58 ccRCC patients. |
Table III.
Comparison between YAP1, LATS1 and
MST2 protein levels, LATS1 and MST2 methylation
status and clinical data of the 58 ccRCC patients.
|
| YAP1 protein
assessment (AU) (%) | LATS1
methylation | LATS1 protein
assessment (AU) (%) | MST2
methylation | MST2 protein
assessment (AU) (%) |
|---|
|
|
|
|
|
|
|
|---|
|
|---|
| Patients
(n=86) | Low (≤17.636) | High
(>17.636) | P-value (low vs.
high)a | <25% | 25–100% | P-value (low vs.
high)a | Low (≤12.667) | High
(>12.669) | P-value (low vs.
high)a | <25% | 25–100% | P-value (low vs.
high)a | Low (≤19.31) | High
(>19.31) | P-value (low vs.
high)a |
|---|
| Age (years) |
| Median:
62.5 |
| Mean:
62.82±11.94 |
| Range:
33–83 |
|
≤62 | 7 (12) | 22 (38) | 0.50 | 14 (24) | 15 (25) | 0.79 | 19 (33) | 10 (17) | 0.38 | 19 (33) | 10 (17) | 0.59 | 19 (33) | 10 (17) | 0.78 |
|
>62 | 4 (7) | 25 (43) |
| 16 (28) | 13 (22) |
| 23 (40) | 6 (10) |
| 16 (28) | 13 (22) |
| 17 (29) | 12 (21) |
|
| Sex |
| Female
(n=28) | 4 (7) | 24 (41) | 0.51 | 18 (31) | 10 (16) | 0.07 | 21 (36) | 7 (12) | 0.77 | 14 (24) | 14 (24) | 0.18 | 14 (24) | 14 (24) | 0.06 |
| Male
(n=30) | 7 (12) | 23 (40) |
| 12 (21) | 18 (31) |
| 21 (36) | 9 (16) |
| 21 (36) | 9 (16) |
| 23 (40) | 7 (12) |
|
| Tumor size
(cm) |
| ≤7
(n=24) | 5 (9) | 19 (33) | 0.75 | 12 (21) | 12 (21) | 1.00 | 18 (31) | 6 (10) | 0.47 | 14 (24) | 10 (17) | 1.00 | 13 (22) | 11 (19) | 0.41 |
| >7
(n=34) | 6 (10) | 28 (48) |
| 18 (31) | 16 (27) |
| 24 (41) | 10 (17) |
| 21 (36) | 13 (22) |
| 23 (40) | 11 (19) |
|
| Fuhrmans
histological grade |
| 1+2
(n=25) | 8 (14) | 17 (29) | 0.04 | 21 (36) | 4 (7) |
<0.0001 | 15 (26) | 10 (17) | 0.03 | 13 (22) | 12 (21) | 0.29 | 16 (28) | 9 (16) | 1.00 |
| 3+4
(n=33) | 3 (5) | 30 (52) |
| 9 (15) | 24 (41) |
| 28 (48) | 5 (9) |
| 22 (38) | 11 (19) |
| 20 (34) | 13 (22) |
|
| TNM stage |
|
Non-metastatic | 8 (11) | 16 (22) | 0.02 | 22 (38) | 7 (12) | 0.0005 | 18 (31) | 11 (19) | 0.14 | 17 (29) | 12 (21) | 1.00 | 19 (33) | 10 (17) | 0.78 |
|
T1-2N0M0 |
|
Metastatic |
|
T1-2N1M0 | 5 (7) | 44 (60) |
| 8 (14) | 21 (36) |
| 24 (41) | 5 (9) |
| 18 (31) | 11 (19) |
| 17 (29) | 12 (21) |
|
|
T3N0-1M0 |
|
T4N0-2M0 |
|
T1-4N2M0 |
|
T1-4N0-2M1 |
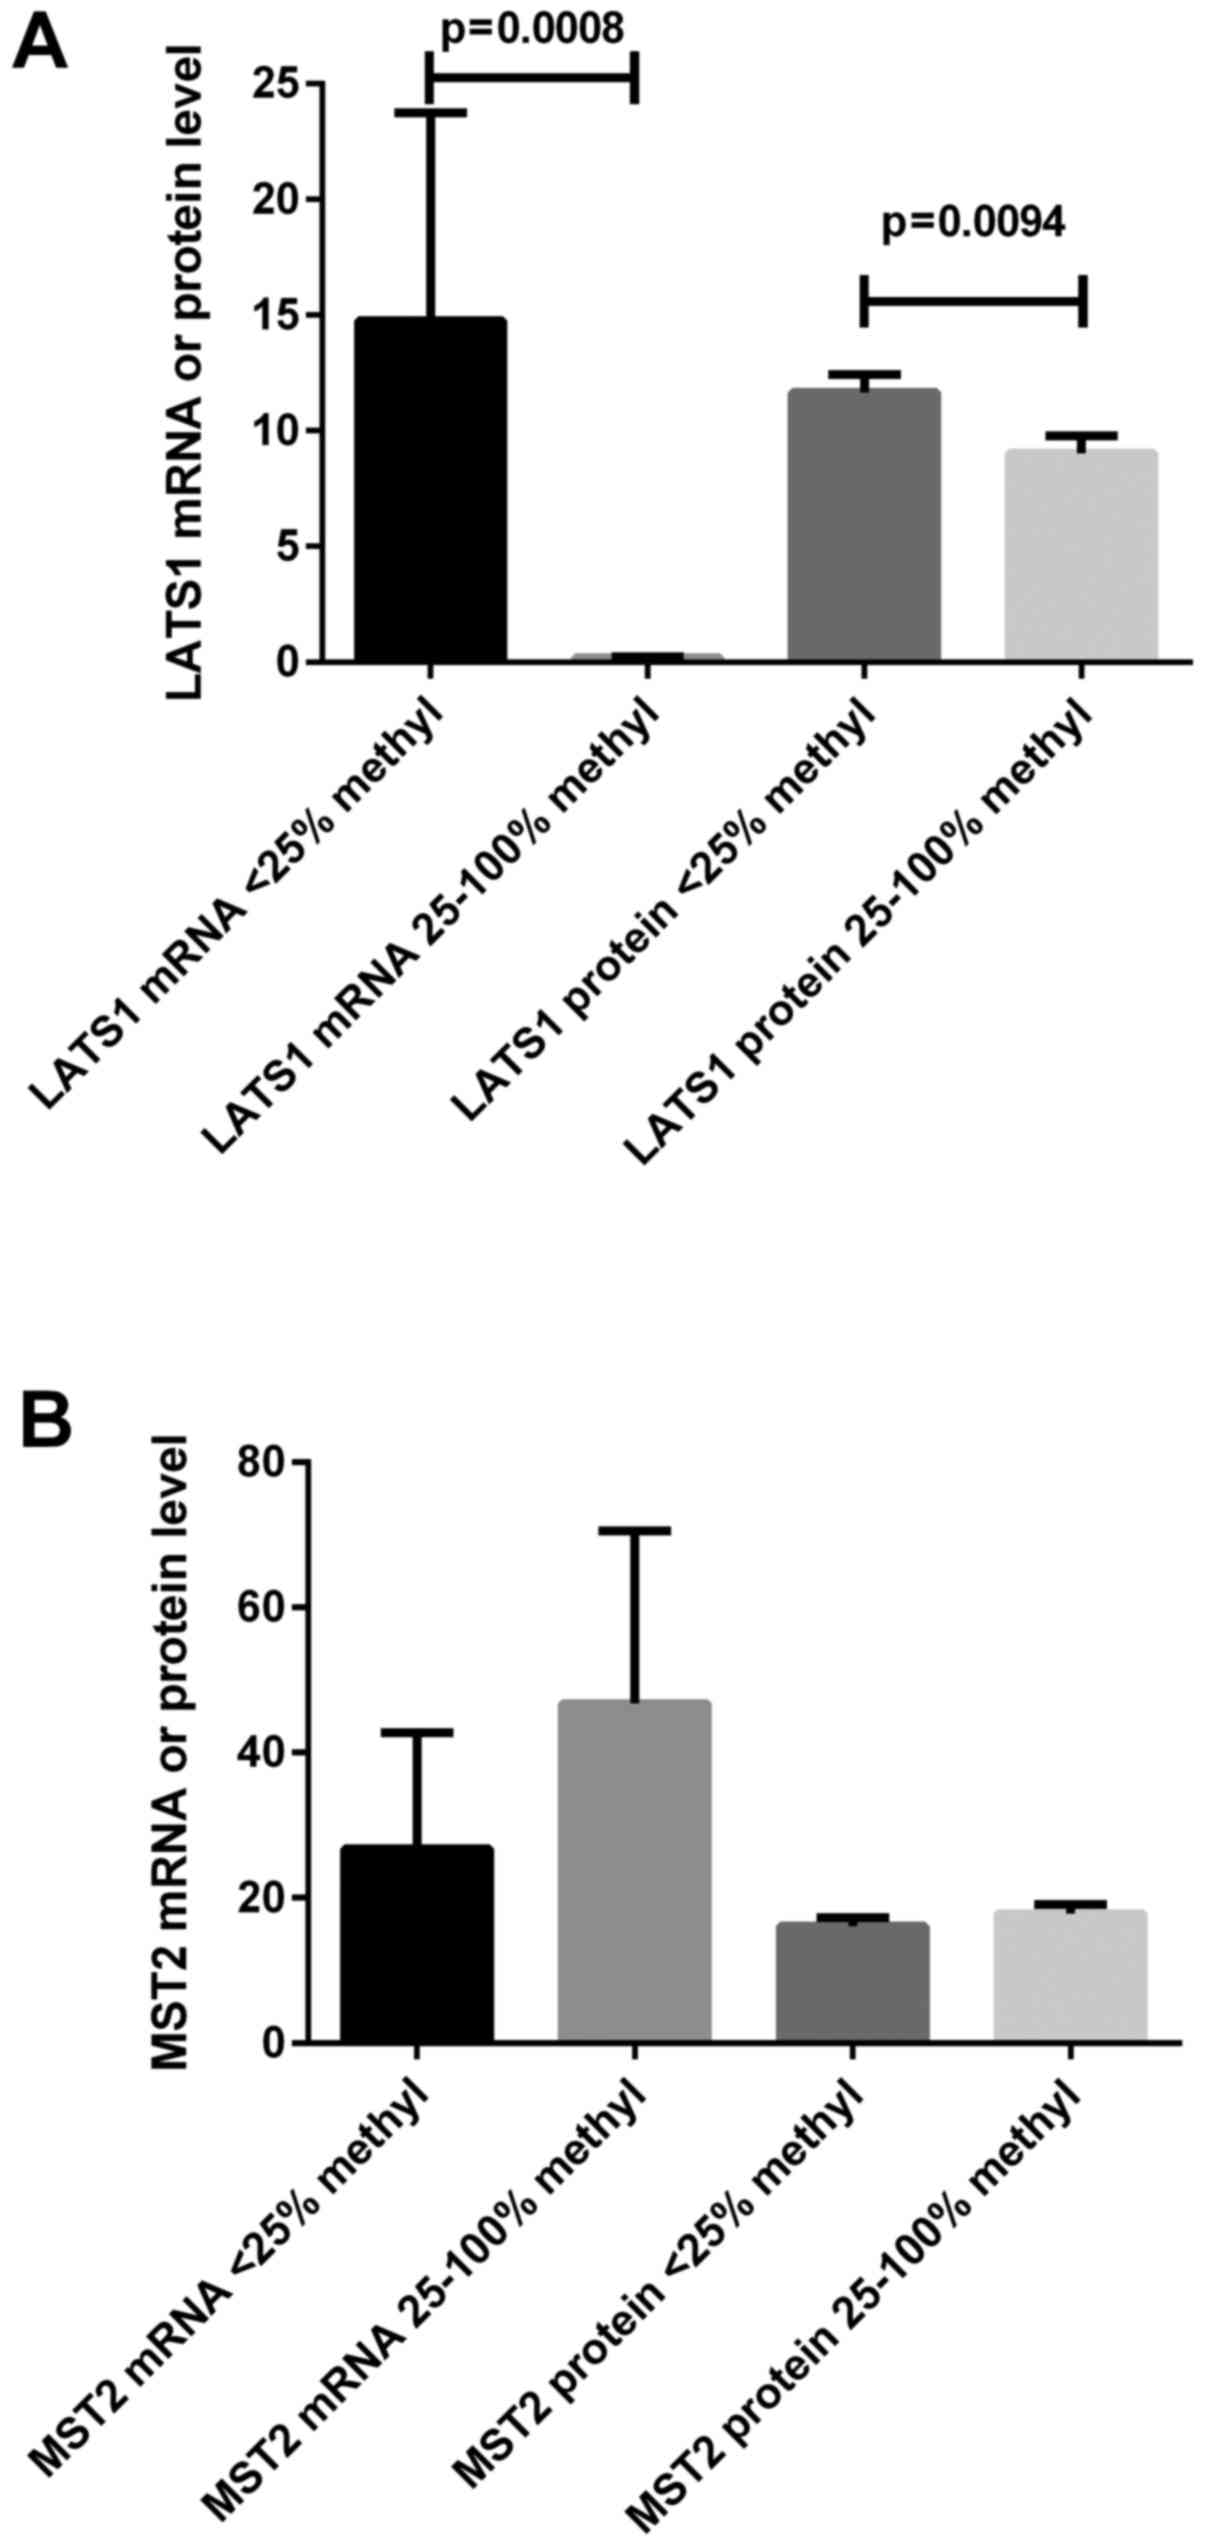
LATS1 and MST2 promoter methylation
status
Methylation analysis was carried out in 58 tumor and
10 control samples. According to the analysis of MD/UMD standards,
the results of MS-HRM-qPCR were qualified into four grades: 1,
0–10% methylation; 2, 10–25%; 3, 25–50%; 4, 50–100%. Based on the
results of 10 control samples and our previous results (26), we set the value >25% methylation
as the hypermethylation status for either LATS1 or MST2 promoters.
We found that LATS1 or MST2 hypermethylation was
observed in 28 (48%) or 22 (38%) of 58 tumor ccRCC samples,
respectively (Table III). The
hypermethylation of LATS1 promoter was associated with
higher Fuhrman's grades (3 and 4 vs. 1 and 2) as well as the
presence of local and/or distant metastasis (Table III). Since the same T samples were
analyzed for either LATS1 or MST2 methylation and
mRNA and protein content, we ascertained whether the
hypermethylation of the gene promoter region was associated with
its mRNA/protein content. As shown in Fig. 3, the mRNA and protein expression of
LATS1 gene was related to the hypermethylation status of
this gene; such observation was not proven for the MST2
gene.
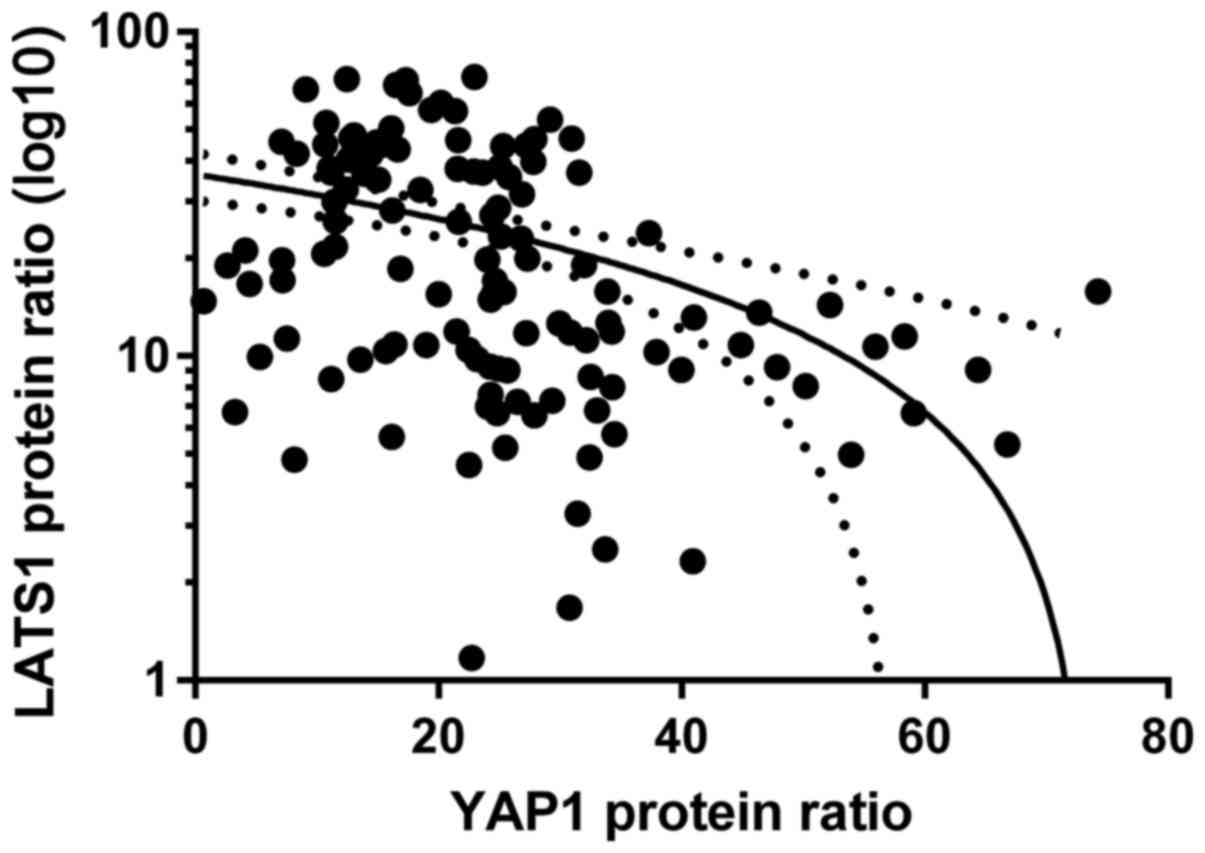
Relationships between LATS1, MST2 and
YAP1 proteins
We checked possible correlations between mRNA-mRNA,
mRNA-protein, protein-mRNA and protein-protein levels of
LATS1-YAP1, LATS1-MST2 and MST2-YAP1. We found a negative
correlation between LATS1 protein and YAP1 protein levels when all
paired samples of 58 patients were taken into consideration
(rs=−0.51; p<0.05, Spearman's test; Fig. 4).
Association between molecular findings
and clinicopathological parameters and patient outcome
As presented in Figs. 5A
and B and 6A and B, OS as well
as PFS were strongly associated with a higher TNM and Fuhrman's
grading in the patients. The molecular data revealed that increased
YAP1 expression levels either at the mRNA or protein levels as well
as the hypermethylation of LATS1 promoter were related to
both PFS and OS (Figs. 5C-E and
6C-E). The increased level of
MST2 mRNA was associated with shorter OS (Fig. 5F).
Cox proportional hazard model with multivariate
analyses revealed that the YAP1 mRNA level was an
independent predictor of OS in ccRCC patients when assessed by
Fuhrman's histological grade (Table
IV). There was no association between molecular data and hazard
ratio when the PFS rate was checked (Table V).
| Table IV.Univariable and multivariable Cox
regression analysis of the overall survival rate of the ccRCC
patients. |
Table IV.
Univariable and multivariable Cox
regression analysis of the overall survival rate of the ccRCC
patients.
|
| Univariable
analysis | Multivariable
analysis |
|---|
|
|
|
|
|---|
| Parameters | P-value | HR (95% CI) | P-value | HR (95% CI) |
|---|
| Sex |
| Female
vs. Male | 0.064 | 2.28
(0.95–5.46) |
|
|
| Age (years) |
| >62
vs. ≤62 | 0.56 | 0.78
(0.34–1.786) |
|
|
| Tumor size
(cm) |
| >7
vs. ≤7 | 0.29 | 0.64
(0.285–1.47) |
|
|
| Tumor grade |
| T3+4
vs. T1+2 | 0.001 | 4.72
(1.85–12.06) | 0.91 | 0.93
(0.28–3.15) |
| Histological
grade |
| F3+4
vs. F1+2 | 0.0005 | 8.61
(2.54–29.18) | 0.019 | 6.04
(1.34–27.26) |
| LATS1 mRNA
levels |
| ↓
(≤1.982) vs. ↑ (>1.982) | 0.58 | 1.35
(0.46–3.99) |
|
|
| LATS1
methylation |
| ↑
(>25%) vs. ↓ (≤25%) | 0.01 | 3.06
(1.29–7.29) | 0.52 | 1.35
(0.52–3.51) |
| LATS1 protein
levels |
| ↓
(≤12.669) vs. ↑ (>12.669) | 0.33 | 0.58
(0.19–1.72) |
|
|
| YAP1 mRNA
levels |
| ↑
(>0.328) vs. ↓ (≤0.328) | 0.01 | 4.87 (1.43-
16.52) | 0.036 | 4.03
(0.96–16.79) |
| YAP1 protein
levels |
| ↑
(>17.363) vs. ↓ (≤17.363) | 0.047 | 6.11
(0.82–45.48) | 0.67 | 1.60
(0.17–14.43) |
| MST2 mRNA
levels |
| ↓
(≤0.539) vs. ↑ (>0.539) | 0.72 | 1.16
(0.49–2.71) |
|
|
| MST2
methylation |
| ↑
(>25%) vs. ↓ (≤25%) | 0.52 | 0.75
(0.32–1.78) |
|
|
| MST2 protein
levels |
| ↓
(≤10.09) vs. ↑ (>10.09) | 0.82 | 0.91
(0.39–2.11) |
|
|
| Table V.Univariable and multivariable Cox
regression analysis of progression-free survival rate of ccRCC
patients. |
Table V.
Univariable and multivariable Cox
regression analysis of progression-free survival rate of ccRCC
patients.
|
| Univariable
analysis | Multivariable
analysis |
|---|
|
|
|
|
|---|
| Parameters | P-value | HR (95% CI) | P-value | HR (95% CI) |
|---|
| Sex |
| Female
vs. Male | 0.11 | 3.12
(1.29–7.59) |
|
|
| Age (years) |
| >62
vs. ≤62 | 0.44 | 0.78
(0.34–1.786) |
|
|
| Tumor size
(cm) |
| >7
vs. ≤7 | 0.43 | 0.72
(0.32–1.62) |
|
|
| Tumor grade |
| T3+4
vs. T1+2 | 0.002 | 3.84
(1.58–9.31) | 0.77 | 0.84
(0.26–2.66) |
| Histological
grade |
| F3+4
vs. F1+2 | 0.0002 | 15.01
(3.51–64.19) | 0.001 | 13.68
(2.73–68.34) |
| LATS1 mRNA
levels |
| ↓(≤
1.982) vs. ↑ (>1.982) | 0.54 | 0.61
(0.12–2.95) |
|
|
| LATS1
methylation |
| ↑(>
25%) vs. ↓ (≤25%) | 0.65 | 1.27
(0.43–3.77) |
|
|
| LATS1 protein
levels |
| ↓(≤
12.669) vs. ↑ (>12.669) | 0.49 | 0.70
(0.26–1.89) |
|
|
| YAP1 mRNA
levels |
| ↑ (>
0.328) vs. ↓ (≤0.328) | 0.008 | 2.39 (0.88-
6.45) | 0.09 | 1.84
(0.45–6.23) |
| YAP1 protein
levels |
| ↑
(>17.363)vs. ↓ (≤17.363) | 0.007 | 6.21
(0.83–46.07) | 0.12 | 1.72
(0.19–14.91) |
| MST2 mRNA
levels |
| ↓ (≤
0.539) vs. ↑ (>0.539) | 0.61 | 1.23
(0.54–2.79) |
|
|
| MST2
methylation |
| ↑ (>
25%) vs. ↓ (≤25%) | 0.18 | 0.55
(0.22–1.32) |
|
|
| MST2 protein
levels |
| ↓ (≤
10.09) vs. ↑ (>10.09) | 0.52 | 0.76
(0.34–1.72) |
|
|
Discussion
The Hippo pathway is an important regulator of cell
proliferation, tissue homeostasis, organ size and stem cell
functions (6). Its deregulation is
frequently observed in many types of malignancies, suggesting that
alterations of this signaling are connected with cancer progression
and patient survival (7–9,21,33,34).
The core components of this pathway include MST1/2, SAV1, LATS1/2
and MOB1 proteins (10,12,15).
When the Hippo signaling is active, LATS1/2 kinases phosphorylate
two major downstream effectors, YAP1 or its paralog, TAZ, resulting
in their ubiquitination and proteolytic degradation (35,36).
In contrast, deregulation of the pathway components, the consequent
Hippo silencing, increases the YAP1 protein level in the cell as
well as augments the nuclear localization of YAP1 (37). In turn, YAP1 nuclear accumulation
triggers the upregulation of target genes (e.g., CTFG and
CYR61), which are associated with processes such as cell
migration, proliferation and angiogenesis (37).
The recent results of in vitro studies show
that the inhibition of LATS1 kinase is strongly connected with the
upregulation of YAP1 resulting in the increased metastatic
potential of cancer cells (35,38).
Mei et al showed that direct interaction between small
ubiquitin-like modifier (SUMO) and LATS1 protein in L02 (normal
human hepatic) and HepG2 (hepatocellular carcinoma) cells resulted
in the attenuation of LATS1 kinase activity and inhibition of the
Hippo pathway. As a consequence, the levels of YAP1, CTFG and CYR61
proteins were increased in SUMOtylated-LATS1 cells (35). Our results based on clinical samples
of ccRCC showed a direct association between the presence of LATS1
and YAP1 in kidney tissues; a decreased LATS1 protein level was
correlated with increased ratio of YAP1 protein in both tumor and
matched normal kidney tissue samples. Another recent study on
LATS1-YAP1 interaction in cancer (38) was performed in MDA-MB-231 and MCF7
breast cancer cell lines. Nokin et al found that
methylglyoxal, a glycolysis side-product, indirectly targets
inactivation of LATS1 in cells. As a result, increased levels of
YAP1 protein and its co-effectors were observed which corresponded
with the increased metastatic potential of cancer cells in a mouse
xenograft model (38). The results
of our study indicate that the decreased expression of LATS1 and
increased YAP1 either at the mRNA or protein levels are highly
associated with renal cancer progression.
Our data corroborate the findings of Chen et
al (39) in an RCC cell line
(786-O) as well as in tissue samples. In paired tumor and normal
kidney samples of 30 ccRCC patients they observed decreased LATS1
mRNA and protein levels in tumor samples; ccRCC progression was
associated with lower LATS1 content (39). Our data obtained on a much larger
group of ccRCC patients extend these observations suggestive of the
roles of LATS1 and YAP1 in ccRCC development since we found that
the patients with deregulated LATS1 or YAP1 mRNA and protein levels
share poorer clinical outcome. Thus, our and Chen et al
(39) findings suggest that
measurements of YAP1 mRNA content in ccRCC tumor samples
could serve as a potential survival marker together with high
Fuhrman's grades. In contrast to a previous study (37) we used quantitative techniques (qPCR
vs. RT-PCR and MS-HRM-qPCR vs. bisulfide sequencing PCR) to assess
a much larger group of ccRCC patients (86 vs. 30). Although we did
not focus on the expression of Hippo pathway components in renal
cancer cell lines, Chen et al showed in 786-O and HEK293
kidney cell lines that the decreased expression of LATS1 was
associated with promoter hypermethylation (39) which was found by us in ccRCC
clinical samples. Moreover, we observed that LATS1
hypermethylation in tumor samples was characteristic of ccRCC
patients with earlier occurrence of either metastasis or death.
Chen et al also found that the controlled decrease in LATS1
protein level resulted in an increased YAP1 protein level.
Furthermore, they observed that overexpression of LATS1
downregulated the YAP1 protein level, inhibited cell proliferation,
induced cell apoptosis and cell cycle arrest in 786-O cells
(39). LATS1 downregulation and its
contribution to cancer progression has been observed in other
malignances such as glioma (40),
nosopharyngeal carcinoma (41),
astrocytoma (42), non-small cell
lung cancer (18), breast cancer
(16), colorectal cancer (17) and renal carcinoma (39). Additionally, association between
LATS1 hypermethylation and tumor progression has been noted
in lung cancer (43), schwannomas
(44), oral squamous cell carcinoma
(45), colorectal cancer (17) and astrocytoma (42), however, the authors did not observe
the influence of LATS1 methylation status on patient
outcome. Therefore, we believe that our observations may promote
studies of LATS1 gene/protein expression to assess the impact on
ccRCC progression and prognosis.
Our results suggest that the second core part of
Hippo signaling, MST2 protein, is neither involved in ccRCC
progression nor in YAP1 regulation. Although MST1/2 kinases have
been acknowledged as tumor-suppressor proteins since loss of
function of MST1/2 was observed in prostate (46) and breast cancer (47), and a decreased MST1 mRNA
level was associated with node metastasis in colorectal cancer
(48), however, in hepatocellular
carcinoma HepG2 cells increased MST1/2 levels were reported
(49). Decreased MST1
expression was associated with promoter methylation of this gene in
soft tissue sarcomas (50). Since
we did not find an association between MST1 promoter
methylation and gene expression, we suggest that such a regulation
of MST1 gene expression does not occur in ccRCC. MST1
protein is the upstream regulator of YAP1 protein (10,12,13,15,48,51,52),
therefore the lack of an MST1/YAP1 association as observed by us in
ccRCC should be discussed. The relationship between MST1/2 protein
and YAP1 level in intestinal epithelium was observed by Zhou et
al during an in vivo study (53). Their study using an Mst1/2-deficient
mouse model showed that MST1 and MST2 proteins are crucial in the
regulation of the Yap1 protein level in normal colonic epithelium
(53). On the contrary, they found
that the antiproliferative role of MST1 or MST2 was overcome in
colon cancer by the abundance of Yap1 protein (53). Such an observation is in line with
our results, since we did not find alterations in the expression of
MST1 mRNA or protein levels in the studied samples of ccRCC.
Another in vivo study using mouse models showed different
results in regards to the Mst2/Yap1 association in cancer
development (19). Zhou et
al found that tumorigenesis of hepatocellular carcinoma was
associated with loss of Mst2 and a decreased level of
phosphorylated Yap1 protein (19).
Such an observation could be contrary to our results, however, they
observed that the deregulation of Mst1/2 protein did not change the
level of Lats1/2 proteins. Based on that, we suppose that such
independent regulation of MST2 and LATS1 may occur in ccRCC.
However, such a conclusion should be supported by further studies.
Moreover, since our study is the first to use complex MST2
quantification in ccRCC, we propose that lack of contribution of
this gene in renal cancer progression must be confirmed by
independent studies.
The most significant observation revealed in our
study was, in our opinion, the possibility of YAP1 mRNA
measurement as a potential prognostic factor in ccRCC. Our previous
study showed a similar correlation between Hippo upstream
regulator, RASSF1A gene, and patient outcome (26). Therefore, in this study we aimed to
assess the possible role of YAP1 in ccRCC. Although our
report is not the first study of YAP1 expression in ccRCC since Cao
et al published a similar study in 2014 (54), there are some significant
differences: a larger group of patients (86 vs. 30 persons), study
on metastasized samples, modern quantitative techniques (qPCR vs.
classical PCR) and survival data. Despite the mentioned
differences, Cao et al obtained comparable results since the
increased YAP1 protein level was associated with higher Fuhrman's
and clinical stages (54). They
also performed in vitro studies on 786-O and HEK293 kidney
cells and found that knockdown of YAP1 inhibited expression
of the TEAD1 gene as well as suppressed cell proliferation
(54). Most studies on the role of
YAP1 in other cancer types such as RCC (39), oral squamous cell carcinoma
(55), ovarian cancer (56), head and neck cancer (57), colorectal cancer (58), melanoma (59), lung (18) and breast cancer (23), revealed an association between YAP1
overexpression (mostly at the protein level) and tumor progression.
Furthermore, we found that increased YAP1 levels of either mRNA or
protein in tumor samples were associated with poorer patient
outcome (survival and occurrence of metastasis). Other authors
found a similar correlation between higher YAP1 levels and patient
outcome in esophageal cancer (60),
gastric adenocarcinoma (61) and
papillary thyroid cancer (62).
Another important aspect is the mechanism of
YAP1 mRNA regulation. Notably, we observed that only ccRCC
patients with increased YAP1 mRNA levels in tumor samples
were characterized by a higher risk of death (Cox test). Recent
data indicate that some microRNA molecules directly regulate the
YAP1 mRNA level. Pan et al found that miR-509-3p
targeted YAP1 mRNA in a large group (293 cases from TCGA cohort) of
ovarian cancer (63). Moreover,
miR-138 was found to be a strong suppressor of YAP1 mRNA in oral
squamous cell carcinoma (64) and
in non-small cell lung cancer (65). The reported associations between
decreased levels of either miR-509-3p or miR-138 in the studied
types of cancer and poorer patient outcome (63–65),
consolidating the influence of YAP1 in tumor progression. In fact,
the contribution of YAP1 protein in tumor progression is so
important that it was acknowledged as a pivotal molecular target in
modern cancer treatment (5,34,38,51,52,66,67).
Some authors found an association between YAP1 overexpression and
chemoresistance of cancer cells, e.g., in head and neck cancer
cases resistant to cetuximab (57),
resistance to RAF- and MEK-targeted therapy (33), 5-FU chemotherapy-resistant colon
cancer (68) and osteosarcoma
resistance (69).
In conclusion, we suggest that dysregulation of
LATS1 and YAP1 levels, but not MST2, is
associated with ccRCC progression and patient survival. We propose
that the assessment of YAP1 mRNA levels in paired
tumor-normal kidney tissue samples could serve as a new prognostic
factor in ccRCC.
Acknowledgements
The authors wish to thank Dr Marcin Stanislawowski
and Dr Tomasz Slebioda from the Department of Histology for the
laboratory support. The study was supported by National Science
Centre (Poland) grant 2012/05/B/NZ4/02735 and ST-12 internal funds
of the Medical University of Gdansk, Poland.
References
|
1
|
Novara G, Martignoni G, Artibani W and
Ficarra V: Grading systems in renal cell carcinoma. J Urol.
177:430–436. 2007. View Article : Google Scholar : PubMed/NCBI
|
|
2
|
Massari F, Bria E, Maines F, Milella M,
Giannarelli D, Cognetti F, Pappagallo G, Tortora G and Porta C:
Adjuvant treatment for resected renal cell carcinoma: Are all
strategies equally negative? Potential implications for trial
design with targeted agents. Clin Genitourin Cancer. 11:471–476.
2013. View Article : Google Scholar : PubMed/NCBI
|
|
3
|
Keizman D, Rouvinov K, Sella A, Gottfried
M, Maimon N, Kim JJ, Eisenberger MA, Sinibaldi V, Peer A, Carducci
MA, et al: Is there a ‘Trial Effect’ on outcome of patients with
metastatic renal cell carcinoma treated with sunitinib? Cancer Res
Treat. 48:281–287. 2016. View Article : Google Scholar : PubMed/NCBI
|
|
4
|
van der Mijn JC, Mier JW, Broxterman HJ
and Verheul HM: Predictive biomarkers in renal cell cancer:
Insights in drug resistance mechanisms. Drug Resist Updat.
17:77–88. 2014. View Article : Google Scholar : PubMed/NCBI
|
|
5
|
Zhao B, Lei QY and Guan KL: The Hippo-YAP
pathway: New connections between regulation of organ size and
cancer. Curr Opin Cell Biol. 20:638–646. 2008. View Article : Google Scholar : PubMed/NCBI
|
|
6
|
Zhao B, Li L, Lei Q and Guan KL: The
Hippo-YAP pathway in organ size control and tumorigenesis: An
updated version. Genes Dev. 24:862–874. 2010. View Article : Google Scholar : PubMed/NCBI
|
|
7
|
Liu H, Jiang D, Chi F and Zhao B: The
Hippo pathway regulates stem cell proliferation, self-renewal, and
differentiation. Protein Cell. 3:291–304. 2012. View Article : Google Scholar : PubMed/NCBI
|
|
8
|
Harvey KF, Zhang X and Thomas DM: The
Hippo pathway and human cancer. Nat Rev Cancer. 13:246–257. 2013.
View Article : Google Scholar : PubMed/NCBI
|
|
9
|
Zhao B, Tumaneng K and Guan KL: The Hippo
pathway in organ size control, tissue regeneration and stem cell
self-renewal. Nat Cell Biol. 13:877–883. 2011. View Article : Google Scholar : PubMed/NCBI
|
|
10
|
Halder G and Johnson RL: Hippo signaling:
Growth control and beyond. Development. 138:9–22. 2011. View Article : Google Scholar : PubMed/NCBI
|
|
11
|
Moya IM and Halder G: The Hippo pathway in
cellular reprogramming and regeneration of different organs. Curr
Opin Cell Biol. 43:62–68. 2016. View Article : Google Scholar : PubMed/NCBI
|
|
12
|
Wierzbicki PM and Rybarczyk A: The Hippo
pathway in colorectal cancer. Folia Histochem Cytobiol. 53:105–119.
2015. View Article : Google Scholar : PubMed/NCBI
|
|
13
|
Janse van Rensburg HJ and Yang X: The
roles of the Hippo pathway in cancer metastasis. Cell Signal.
28:1761–1772. 2016. View Article : Google Scholar : PubMed/NCBI
|
|
14
|
Johnson R and Halder G: The two faces of
Hippo: Targeting the Hippo pathway for regenerative medicine and
cancer treatment. Nat Rev Drug Discov. 13:63–79. 2014. View Article : Google Scholar : PubMed/NCBI
|
|
15
|
Cai J, Zhang N, Zheng Y, De Wilde RF,
Maitra A and Pan D: The Hippo signaling pathway restricts the
oncogenic potential of an intestinal regeneration program. Genes
Dev. 24:2383–2388. 2010. View Article : Google Scholar : PubMed/NCBI
|
|
16
|
Morinaga N, Shitara Y, Yanagita Y, Koida
T, Kimura M, Asao T, Kimijima I, Takenoshita S, Hirota T, Saya H,
et al: Molecular analysis of the h-warts/LATS1 gene in human breast
cancer. Int J Oncol. 17:1125–1129. 2000.PubMed/NCBI
|
|
17
|
Wierzbicki PM, Adrych K, Kartanowicz D,
Stanislawowski M, Kowalczyk A, Godlewski J, Skwierz-Bogdanska I,
Celinski K, Gach T, Kulig J, et al: Underexpression of LATS1 TSG in
colorectal cancer is associated with promoter hypermethylation.
World J Gastroenterol. 19:4363–4373. 2013. View Article : Google Scholar : PubMed/NCBI
|
|
18
|
Lin XY, Zhang XP, Wu JH, Qiu XS and Wang
EH: Expression of LATS1 contributes to good prognosis and can
negatively regulate YAP oncoprotein in non-small-cell lung cancer.
Tumour Biol. 35:6435–6443. 2014. View Article : Google Scholar : PubMed/NCBI
|
|
19
|
Zhou D, Conrad C, Xia F, Park JS, Payer B,
Yin Y, Lauwers GY, Thasler W, Lee JT, Avruch J, et al: Mst1 and
Mst2 maintain hepatocyte quiescence and suppress hepatocellular
carcinoma development through inactivation of the Yap1 oncogene.
Cancer Cell. 16:425–438. 2009. View Article : Google Scholar : PubMed/NCBI
|
|
20
|
Miyanaga A, Masuda M, Tsuta K, Kawasaki K,
Nakamura Y, Sakuma T, Asamura H, Gemma A and Yamada T: Hippo
pathway gene mutations in malignant mesothelioma: Revealed by RNA
and targeted exon sequencing. J Thorac Oncol. 10:844–851. 2015.
View Article : Google Scholar : PubMed/NCBI
|
|
21
|
Bora-Singhal N, Nguyen J, Schaal C,
Perumal D, Singh S, Coppola D and Chellappan S: YAP1 regulates OCT4
activity and SOX2 expression to facilitate self-renewal and
vascular mimicry of stem-like cells. Stem Cells. 33:1705–1718.
2015. View Article : Google Scholar : PubMed/NCBI
|
|
22
|
Machado-Neto JA, Lazarini M, Favaro P,
Franchi GC Jr, Nowill AE, Saad ST and Traina F: ANKHD1, a novel
component of the Hippo signaling pathway, promotes YAP1 activation
and cell cycle progression in prostate cancer cells. Exp Cell Res.
324:137–145. 2014. View Article : Google Scholar : PubMed/NCBI
|
|
23
|
Vlug EJ, van de Ven RA, Vermeulen JF, Bult
P, van Diest PJ and Derksen PW: Nuclear localization of the
transcriptional coactivator YAP is associated with invasive lobular
breast cancer. Cell Oncol (Dordr). 36:375–384. 2013. View Article : Google Scholar : PubMed/NCBI
|
|
24
|
Li M, Lu J, Zhang F, Li H, Zhang B, Wu X,
Tan Z, Zhang L, Gao G, Mu J, et al: Yes-associated protein 1 (YAP1)
promotes human gallbladder tumor growth via activation of the
AXL/MAPK pathway. Cancer Lett. 355:201–209. 2014. View Article : Google Scholar : PubMed/NCBI
|
|
25
|
Liu YC and Wang YZ: Role of Yes-associated
protein 1 in gliomas: Pathologic and therapeutic aspects. Tumour
Biol. 36:2223–2227. 2015. View Article : Google Scholar : PubMed/NCBI
|
|
26
|
Klacz J, Wierzbicki PM, Wronska A,
Rybarczyk A, Stanislawowski M, Slebioda T, Olejniczak A,
Matuszewski M and Kmiec Z: Decreased expression of RASSF1A tumor
suppressor gene is associated with worse prognosis in clear cell
renal cell carcinoma. Int J Oncol. 48:55–66. 2016.PubMed/NCBI
|
|
27
|
Wierzbicki PM, Klacz J, Rybarczyk A,
Slebioda T, Stanislawowski M, Wronska A, Kowalczyk A, Matuszewski M
and Kmiec Z: Identification of a suitable qPCR reference gene in
metastatic clear cell renal cell carcinoma. Tumour Biol.
35:12473–12487. 2014. View Article : Google Scholar : PubMed/NCBI
|
|
28
|
Schmittgen TD and Livak KJ: Analyzing
real-time PCR data by the comparative C(T) method. Nat Protoc.
3:1101–1108. 2008. View Article : Google Scholar : PubMed/NCBI
|
|
29
|
Wojdacz TK and Dobrovic A:
Methylation-sensitive high resolution melting (MS-HRM): A new
approach for sensitive and high-throughput assessment of
methylation. Nucleic Acids Res. 35:e412007. View Article : Google Scholar : PubMed/NCBI
|
|
30
|
Avădănei ER, Wierzbicki PM, Giuşcă SE,
Grigoraş A, Amălinei C and Căruntu ID: Macrophage profile in
primary versus secondary liver tumors. Folia Histochem Cytobiol.
52:112–123. 2014. View Article : Google Scholar : PubMed/NCBI
|
|
31
|
Sobin LH, Gospodarowicz MK and Wittekind
C: International Union against Cancer: TNM classification of
malignant tumours. Wiley-Blackwell; Chichester, West Sussex, UK;
Hoboken, NJ: 2010
|
|
32
|
Delahunt B, Sika-Paotonu D, Bethwaite PB,
Jordan T William, Magi-Galluzzi C, Zhou M, Samaratunga H and
Srigley JR: Grading of clear cell renal cell carcinoma should be
based on nucleolar prominence. Am J Surg Pathol. 35:1134–1139.
2011. View Article : Google Scholar : PubMed/NCBI
|
|
33
|
Lin L, Sabnis AJ, Chan E, Olivas V, Cade
L, Pazarentzos E, Asthana S, Neel D, Yan JJ, Lu X, et al: The Hippo
effector YAP promotes resistance to RAF- and MEK-targeted cancer
therapies. Nat Genet. 47:250–256. 2015. View Article : Google Scholar : PubMed/NCBI
|
|
34
|
Zhang L, Yang S, Chen X, Stauffer S, Yu F,
Lele SM, Fu K, Datta K, Palermo N, Chen Y, et al: The hippo pathway
effector YAP regulates motility, invasion, and castration-resistant
growth of prostate cancer cells. Mol Cell Biol. 35:1350–1362. 2015.
View Article : Google Scholar : PubMed/NCBI
|
|
35
|
Mei L, Yuan L, Shi W, Fan S, Tang C, Fan
X, Yang W, Qian Y, Hussain M and Wu X: SUMOylation of large tumor
suppressor 1 at Lys751 attenuates its kinase activity and
tumor-suppressor functions. Cancer Lett. 386:1–11. 2017. View Article : Google Scholar : PubMed/NCBI
|
|
36
|
Saucedo LJ and Edgar BA: Filling out the
Hippo pathway. Nat Rev Mol Cell Biol. 8:613–621. 2007. View Article : Google Scholar : PubMed/NCBI
|
|
37
|
Yu FX, Zhao B and Guan KL: Hippo pathway
in organ size control, tissue homeostasis, and cancer. Cell.
163:811–828. 2015. View Article : Google Scholar : PubMed/NCBI
|
|
38
|
Nokin MJ, Durieux F, Peixoto P, Chiavarina
B, Peulen O, Blomme A, Turtoi A, Costanza B, Smargiasso N, Baiwir
D, et al: Methylglyoxal, a glycolysis side-product, induces Hsp90
glycation and YAP-mediated tumor growth and metastasis. eLife.
5:52016. View Article : Google Scholar
|
|
39
|
Chen KH, He J, Wang DL, Cao JJ, Li MC,
Zhao XM, Sheng X, Li WB and Liu WJ: Methylation associated
inactivation of LATS1 and its effect on demethylation or
overexpression on YAP and cell biological function in human renal
cell carcinoma. Int J Oncol. 45:2511–2521. 2014.PubMed/NCBI
|
|
40
|
Zhang H, Geng D, Gao J, Qi Y, Shi Y, Wang
Y, Jiang Y, Zhang Y, Fu J, Dong Y, et al: Expression and
significance of Hippo/YAP signaling in glioma progression. Tumour
Biol. 37:15665–15676. 2016. View Article : Google Scholar
|
|
41
|
He J, Tang F, Liu L, Chen L, Li J, Ou D,
Zhang L, Li Z, Feng D, Li W, et al: Positive regulation of TAZ
expression by EBV-LMP1 contributes to cell proliferation and
epithelial-mesenchymal transition in nasopharyngeal carcinoma.
Oncotarget. Dec 2–2016.(Epub ahead of print).
doi.org/10.18632/oncotarget.13775. View Article : Google Scholar
|
|
42
|
Jiang Z, Li X, Hu J, Zhou W, Jiang Y, Li G
and Lu D: Promoter hypermethylation-mediated down-regulation of
LATS1 and LATS2 in human astrocytoma. Neurosci Res. 56:450–458.
2006. View Article : Google Scholar : PubMed/NCBI
|
|
43
|
Sasaki H, Hikosaka Y, Kawano O, Yano M and
Fujii Y: Hypermethylation of the large tumor suppressor genes in
Japanese lung cancer. Oncol Lett. 1:303–307. 2010. View Article : Google Scholar : PubMed/NCBI
|
|
44
|
Oh JE, Ohta T, Satomi K, Foll M, Durand G,
McKay J, Le Calvez-Kelm F, Mittelbronn M, Brokinkel B, Paulus W, et
al: Alterations in the NF2/LATS1/LATS2/YAP pathway in schwannomas.
J Neuropathol Exp Neurol. 74:952–959. 2015. View Article : Google Scholar : PubMed/NCBI
|
|
45
|
Reddy VR, Annamalai T, Narayanan V and
Ramanathan A: Hypermethylation of promoter region of LATS1 - a CDK
interacting protein in oral squamous cell carcinomas - a pilot
study in India. Asian Pac J Cancer Prev. 16:1599–1603. 2015.
View Article : Google Scholar : PubMed/NCBI
|
|
46
|
Karamitopoulou E, Zlobec I, Patsouris E,
Peros G and Lugli A: Loss of E-cadherin independently predicts the
lymph node status in colorectal cancer. Pathology. 43:133–137.
2011. View Article : Google Scholar : PubMed/NCBI
|
|
47
|
Li L, Fang R, Liu B, Shi H, Wang Y, Zhang
W, Zhang X and Ye L: Deacetylation of tumor-suppressor MST1 in
Hippo pathway induces its degradation through HBXIP-elevated HDAC6
in promotion of breast cancer growth. Oncogene. 35:4048–4057. 2016.
View Article : Google Scholar : PubMed/NCBI
|
|
48
|
Rawat SJ and Chernoff J: Regulation of
mammalian Ste20 (Mst) kinases. Trends Biochem Sci. 40:149–156.
2015. View Article : Google Scholar : PubMed/NCBI
|
|
49
|
Liang K, Zhou G, Zhang Q, Li J and Zhang
C: Expression of hippo pathway in colorectal cancer. Saudi J
Gastroenterol. 20:188–194. 2014. View Article : Google Scholar : PubMed/NCBI
|
|
50
|
Seidel C, Schagdarsurengin U, Blümke K,
Würl P, Pfeifer GP, Hauptmann S, Taubert H and Dammann R: Frequent
hypermethylation of MST1 and MST2 in soft tissue sarcoma. Mol
Carcinog. 46:865–871. 2007. View Article : Google Scholar : PubMed/NCBI
|
|
51
|
Piccolo S, Dupont S and Cordenonsi M: The
biology of YAP/TAZ: Hippo signaling and beyond. Physiol Rev.
94:1287–1312. 2014. View Article : Google Scholar : PubMed/NCBI
|
|
52
|
Plouffe SW, Hong AW and Guan KL: Disease
implications of the Hippo/YAP pathway. Trends Mol Med. 21:212–222.
2015. View Article : Google Scholar : PubMed/NCBI
|
|
53
|
Zhou D, Zhang Y, Wu H, Barry E, Yin Y,
Lawrence E, Dawson D, Willis JE, Markowitz SD, Camargo FD, et al:
Mst1 and Mst2 protein kinases restrain intestinal stem cell
proliferation and colonic tumorigenesis by inhibition of
Yes-associated protein (Yap) overabundance. Proc Natl Acad Sci USA.
108:E1312–E1320. 2011. View Article : Google Scholar : PubMed/NCBI
|
|
54
|
Cao JJ, Zhao XM, Wang DL, Chen KH, Sheng
X, Li WB, Li MC, Liu WJ and He J: YAP is overexpressed in clear
cell renal cell carcinoma and its knockdown reduces cell
proliferation and induces cell cycle arrest and apoptosis. Oncol
Rep. 32:1594–1600. 2014.PubMed/NCBI
|
|
55
|
Dong C, Wei KJ, Zhang WB, Sun H, Pan HY
and Zhang L: LATS2 induced by TNF-alpha and inhibited cell
proliferation and invasion by phosphorylating YAP in oral squamous
cell carcinoma. J Oral Pathol Med. 44:475–481. 2015. View Article : Google Scholar : PubMed/NCBI
|
|
56
|
He C, Lv X, Hua G, Lele SM, Remmenga S,
Dong J, Davis JS and Wang C: YAP forms autocrine loops with the
ERBB pathway to regulate ovarian cancer initiation and progression.
Oncogene. 34:6040–6054. 2015. View Article : Google Scholar : PubMed/NCBI
|
|
57
|
Jerhammar F, Johansson AC, Ceder R,
Welander J, Jansson A, Grafström RC, Söderkvist P and Roberg K:
YAP1 is a potential biomarker for cetuximab resistance in head and
neck cancer. Oral Oncol. 50:832–839. 2014. View Article : Google Scholar : PubMed/NCBI
|
|
58
|
Konsavage WM Jr, Kyler SL, Rennoll SA, Jin
G and Yochum GS: Wnt/β-catenin signaling regulates Yes-associated
protein (YAP) gene expression in colorectal carcinoma cells. J Biol
Chem. 287:11730–11739. 2012. View Article : Google Scholar : PubMed/NCBI
|
|
59
|
Yuan H, Liu H, Liu Z, Zhu D, Amos CI, Fang
S, Lee JE and Wei Q: Genetic variants in Hippo pathway genes
YAP1TEAD1TEAD4 are associated with melanoma-specific survival. Int
J Cancer. 137:638–645. 2015. View Article : Google Scholar : PubMed/NCBI
|
|
60
|
Zhao J, Li X, Yang Y, Zhu D, Zhang C, Liu
D, Wu K and Zhao S: Effect of YAP1 silencing on esophageal cancer.
Onco Targets Ther. 9:3137–3146. 2016. View Article : Google Scholar : PubMed/NCBI
|
|
61
|
Li P, Sun D, Li X, He Y, Li W, Zhao J,
Wang Y, Wang H and Xin Y: Elevated expression of Nodal and YAP1 is
associated with poor prognosis of gastric adenocarcinoma. J Cancer
Res Clin Oncol. 142:1765–1773. 2016. View Article : Google Scholar : PubMed/NCBI
|
|
62
|
Liao T, Wen D, Ma B, Hu JQ, Qu N, Shi RL,
Liu L, Guan Q, Li DS and Ji QH: Yes-associated protein 1 promotes
papillary thyroid cancer cell proliferation by activating the
ERK/MAPK signaling pathway. Oncotarget. Feb 14–2017.(Epub ahead of
print). doi.org/10.18632/oncotarget.14319.
|
|
63
|
Pan Y, Robertson G, Pedersen L, Lim E,
Hernandez-Herrera A, Rowat AC, Patil SL, Chan CK, Wen Y, Zhang X,
et al: miR-509-3p is clinically significant and strongly attenuates
cellular migration and multi-cellular spheroids in ovarian cancer.
Oncotarget. 7:25930–25948. 2016.PubMed/NCBI
|
|
64
|
Xu R, Zeng G, Gao J, Ren Y, Zhang Z, Zhang
Q, Zhao J, Tao H and Li D: miR-138 suppresses the proliferation of
oral squamous cell carcinoma cells by targeting Yes-associated
protein 1. Oncol Rep. 34:2171–2178. 2015.PubMed/NCBI
|
|
65
|
Xiao L, Zhou H, Li XP, Chen J, Fang C, Mao
CX, Cui JJ, Zhang W, Zhou HH, Yin JY, et al: MicroRNA-138 acts as a
tumor suppressor in non small cell lung cancer via targeting YAP1.
Oncotarget. 7:40038–40046. 2016.PubMed/NCBI
|
|
66
|
Lee KW, Lee SS, Kim SB, Sohn BH, Lee HS,
Jang HJ, Park YY, Kopetz S, Kim SS, Oh SC, et al: Significant
association of oncogene YAP1 with poor prognosis and cetuximab
resistance in colorectal cancer patients. Clin Cancer Res.
21:357–364. 2015. View Article : Google Scholar : PubMed/NCBI
|
|
67
|
Song S, Honjo S, Jin J, Chang SS, Scott
AW, Chen Q, Kalhor N, Correa AM, Hofstetter WL, Albarracin CT, et
al: The Hippo coactivator YAP1 mediates EGFR overexpression and
confers chemoresistance in esophageal cancer. Clin Cancer Res.
21:2580–2590. 2015. View Article : Google Scholar : PubMed/NCBI
|
|
68
|
Touil Y, Igoudjil W, Corvaisier M, Dessein
AF, Vandomme J, Monté D, Stechly L, Skrypek N, Langlois C, Grard G,
et al: Colon cancer cells escape 5FU chemotherapy-induced cell
death by entering stemness and quiescence associated with the
c-Yes/YAP axis. Clin Cancer Res. 20:837–846. 2014. View Article : Google Scholar : PubMed/NCBI
|
|
69
|
Wang DY, Wu YN, Huang JQ, Wang W, Xu M,
Jia JP, Han G, Mao BB and Bi WZ: Hippo/YAP signaling pathway is
involved in osteosarcoma chemoresistance. Chin J Cancer. 35:472016.
View Article : Google Scholar : PubMed/NCBI
|