Introduction
Gastric cancer (GC) is the fourth most common cancer
and the second leading cause of cancer death worldwide and its
incidence is the highest in some Asian countries such as China and
Japan (1,2). New molecular biomarkers and
therapeutic target need to be found to improve the survival rate of
GC patients.
Triosephosphate isomerase (TPI) is a housekeeping
gene located in 12p13, encoding the enzyme triosephosphate
iso-merase. TPI main function is to catalyze the interconversion of
dihydroxyacetone phosphate and glyceraldehyde-3-phosphate in the
glycolysis pathway and other metabolic pathways (3). TPI is upregulated in many types of
cancer, such as esophageal (4),
lung (5) and prostate cancer
(6). Linge et al (7) found that TPI expression in uveal
melanoma tissue of patients who have subsequently developed
metastasis was higher than those who have not, while its silencing
was associated with a decreased invasion and metastasis. Therefore,
the study by Linge et al (7)
indicated that TPI may play an important role in the development of
tumor associated with migration and invasion. However, TPI
involvement in GC needs to be confirmed to establish if it has a
crucial role in its development. In the present study, we focused
on TPI function in GC cells and on the identification of its
downstream functional genes, to provide experimental evidence
clarifying its role in this tumor type, with the aim of identifying
a new potential target in GC treatment.
Materials and methods
Patients and tissue samples
Paraffin-embedded tissue samples were obtained from
patients with histological diagnosed GC at Handan Central Hospital
during the period between July 2014 and December 2014. Forty-two
male and eight female patients, the mean age was 63 years (range,
38–76 years). Patients were classified in TNM stages from I to IV
based on the Seven Edition of American Joint Committee on Cancer
(AJCC). Informed consent was obtained from the involving
participants to allow the collection and use of the samples. All
procedures performed in studies were approved by the ethics
committee of the Affiliated Hospital of Guangdong Medical
University.
Immunohistochemistry
Fifty gastric cancer tissues and forty-nine samples
of para-carcinoma tissue were examined TPI expression by
streptavidin -perosidase immunohistochemical staining method.
Immunohistochemical staining was performed by using a standard
immunoperoxidase staining procedure. TPI protein level was
evaluated by two pathologists. According to the cancer cell
staining intensity, the TPI staining results were classified as
follows: 0, no staining; 1, weak staining; 2, moderate staining;
and 3, strong staining. The positive cancer cells were classified
as score 0, <10%; score 1, 11–50% positive cells; score 2,
>50% positive cells. The percentage of positive cells and the
staining intensity was added as the final score. Score 0–1 was
considered negative expression; score 2–3 was considered positive
expression. Score >4 was considered strong positive expression
(8,9).
Cell lines
Human gastric cancer cell lines BGC-823, SGC-7901,
NCI-N87 and MGC-803 were purchased from the Cell Bank of Institute
of Life Science, Chinese Academy of Science (Shanghai, China). All
cell lines were cultured with RPMI-1640 medium (Gibco-BRL, Grand
Island, NY, USA) medium with 10% fetal calf serum (FCS), in
humidified 5% CO2 at 37°C.
Plasmids and small interfering
RNAs
The pcDNA-encoding TPI and CDCA5 reporter plasmids
were purchased fromShanghai GeneChem, Co., Ltd. (Shanghai, China).
The mock vector was used as a negative control. Plasmids were
extracted by TIANScript cDNA (Tiangen Biotech, Co., Ltd., Beijing,
China). The specific siRNAs for TPI and CDCA5 siRNA and were
designed respectively and obtained from Shanghai GeneChem. Scramble
siRNA was used as a negative control. Cells were seeded in 6-well
plates and transfected with siRNAs or DNA plasmids using
Lipofectamine 2000 (Invitrogen, Carlsbad, CA, USA). siRNA sequences
of TPI and CDCA5 are shown in Table
I.
 | Table I.siRNA sequences of TPI and CDCA5. |
Table I.
siRNA sequences of TPI and CDCA5.
| siRNA identifer | SenseSeq | AntiSeq |
|---|
| TPI |
CACCCAUGUGAGGGAAUAATT |
UUAUUCCCUCACAUGGGUGTT |
| TPI |
AGAGCACCCGUAUCAUUUATT |
UAAAUGAUACGGGUGCUCUTT |
| TPI |
AGGUCGUCCUGGCCUAUGATT |
UCAUAGGCCAGGACGACCUTT |
| TPI |
CUAUAAUGGUUGGAACUAATT |
UUAGUUCCAACCAUUAUAGTT |
| CDCA5 |
CGGAAAGUUUCCUCGCGUATT |
UACGCGAGGAAACUUUCCGTT |
| CDCA5 |
GGAACUAAAUUUAAGGAAATT |
UUUCCUUAAAUUUAGUUCCTT |
| CDCA5 |
GAAAGCCCAUCGUCUUAAATT |
UUUAAGACGAUGGGCUUUCTT |
| CDCA5 |
CCGAGAAACAGAAACGUAATT |
UUACGUUUCUGUUUCUCGGTT |
RNA extraction and real-time PCR
Cells were harvested after 24-h transfection and
total RNA was extracted by using TRIzol reagent. Then reverse
transcription was performed with First Strand cDNA Synthesis kit
(Roche Diagnostics, Indianapolis, IN, USA) following its
instructions. Real-time quantitative PCR (RT-qPCR) was performed
with FastStart Universal SYBR-Green Master (Roche Diagnostics) by
PikoReal™ Real-Time PCR system (Thermo Fisher Scientific, Waltham,
MA, USA). Amplification primers are shown in Table II.
| Table II.Primers for cloning promoters. |
Table II.
Primers for cloning promoters.
| Genes | Forward primers | Reverse primer |
|---|
| TPI |
GGACTCGGAGTAATCGCCTG |
TGTTGGGGTGTTGCAGTCTT |
| BMPR2 |
GCCTTGTTATTTCATTTCCA |
TGTTTCTCCTGTCCATTCA |
| CAV2 |
GCTCAACTCGCATCTCAA |
AGGAACACCGTCAGGAAC |
| CDCA5 |
CGTAAGAAGAAGAAAATGCC |
ACAGGACAGGAGGGAGAG |
| CD109 |
ATTGTCATCAGTGGGGAGT |
TGCCAGGAGTCAGAAAGT |
| PRKACA |
TAAGGGCAAATGAACGAA |
GGAGTAGAGGAAGGAGGGA |
| ROCK2 |
GTGGGTTAGTCGGTTGGT |
TGGTTTTGCTGTATCTTCATT |
| SETD7 |
TCCTCCTCCTCCAAACTC |
GTAATCCGTCATCGTCCA |
| TFAM |
GAAAGATGCTGAAGAAATGAA |
TAAAATAAATACACAACCCTCCT |
| β-actin |
GGGAAATCGTGCGTGACATTAAGG |
CAGGAAGGAAGGCTGGAAGAGTG |
Western blot analysis
Total protein was extracted by using RIPA reagent
(Beijing Solarbio Science and Technology, Co., Ltd., Beijing,
China). Protein samples were fractionated by SDS-PAGE gel (CWBIO,
Beijing, China) with concentration of 12%. Then the protein was
transferred to PVDF membranes (Immobilon; Millipore, Bedford, MA,
USA) and membranes were blocked by skim milk of 5% concentration
for 1.5 h at room temperature. The membranes were incubated
overnight at 4°C with primary TPI antibodies (1:2,000; Abcam,
Cambridge, MA, USA), CDCA5 antibodies (1:2,000; Abcam), GAPDH
antibodies (1:2,000; Abcam), β-actin (1:2,000; Cell Signaling
Technology, Danvers, MA, USA), respectively. Next day, membranes
were incubated with secondary antibodies (1:2,000; Abcam) for 1 h
at room temperature. Finally, protein bands were visualized by
infrared imaging system (LI-COR Biosciences, Lincoln, NE, USA).
Gray values were analysed by the Quantity One software.
Cell proliferation assay
Cells were collected after 24 h of transfection and
cultured in 96-well plates (BGC-823, 30,00/well; MGC-803,
1,000/well). Each group was set to 5-wells. Add 100 µl of Cell
Counting kit-8 (CCK-8) diluent (10 µl CCK-8 + 90 µl RPMI-1640;
Dojindo Laboratories, Kumamoto, Japan) and incubated at 37°C for 3
h, then optical density (OD) value at 450 nm was measured by
microplate reader (Thermo Fisher Scientific) every 24 h for 3 days.
The experiment was repeated three times.
Colony formation assay
Cells were collected after 24 h of transfection and
cultured in 6- or 12-well plates. Approximately 1–2 weeks later,
cells were fixed by precooling methanol for 20 min and stained with
0.2% crystal at room temperature for 30 min. Colonies containing
>50 cells were including when counted. This experiment was
repeated three times.
Transwell migration assay
Cells were collected after 24-h transfection and
suspension was made with RPMI-1640 medium without fetal bovine
serum (FBS) (concentration of BGC-823 and MGC-803 cells were
0.5×10⁶ and 0.2×10⁶) added into upper
chambers of Transwell (8 µm for 24-well plate; BD Biosciences),
each well added 200 µl suspension. The lower chambers were filled
with 600 µl RPMI-1640 containing 10% FBS. Then, the cells were
cultured in incubator with 5% CO2 at 37°C. After 48 h,
cells were fixed, stained and photographed in 5 random fields and
counted. The experiment was repeated three times.
Transwell invasion assay
The Matrigel (Corning, Inc., Corning, NY, USA)
matrix was diluted with RPMI-1640 medium without FBS (1:5), and
filled into upper chambers of Transwell (60 µl/well). Then the
plates were placed at 37°C for 4 h. After that, 200 µl cells
suspension was added to upper chambers of Transwell (BGC-823,
0.5×10⁶; MGC-803, 0.1×10⁶). The lower chamber
was added with 600 µl RPMI-1640 medium supplemented with 10% FBS in
5% CO2 at 37°C. After 48 h of incubation, the remaining
steps were the same as the migration assay.
Flow cytometric cell cycle
distribution and apoptosis assay
Cells were harvested after 48-h transfection, then
fixed with pre-cooling 70% ethanol at 4°C for 2 h or overnight.
Then cells were stained with 50 mg/ml propidium iodide (PI) for 30
min at room temperature in the dark. Cell cycle analyses were
performed by a FACSCalibur flow cytometer (BD Immunocytometry
Systems; BD Biosciences, San Jose, CA, USA). The percentage of
cells in G1, S and G2 phase was analyzed by the ModFit
software.
To detect cell apoptosis, cells were harvested 48 h
after transfection and were measurement with the Annexin V-FITC/PI
apoptosis detection kit (Dojindo, Shanghai, China) according to
manufacturers instructions. Cells were incubated with Annexin
V-FITC and PI solution in the dark for 15 min. After that, cells
were analyzed for apoptosis rates using a FACScan flow cytometer.
Each sample analyzed had at least 10,000 cells.
Microarray analysis
TPI downstream genes were detected by microarray
analysis, Affymetrix GeneChip Human Genome (Affymetrix, Inc., Santa
Clara, CA, USA). Total RNA was extracted from MGC-803 cells with
siTPI or siNC transfection. The RNA quality was determined by
NanoDrop 2000 (Thermo Fisher Scientific) and Agilent Bioanalyzer
2100 (Agilent Technologies, Santa Clara, CA, USA). Each group was
set to three repetitions. Gene Ontology (GO) analysis and KEGG
pathway analysis was carried out as previously described (10).
Results
TPI expression in GC tissues and
para-carcinoma tissues
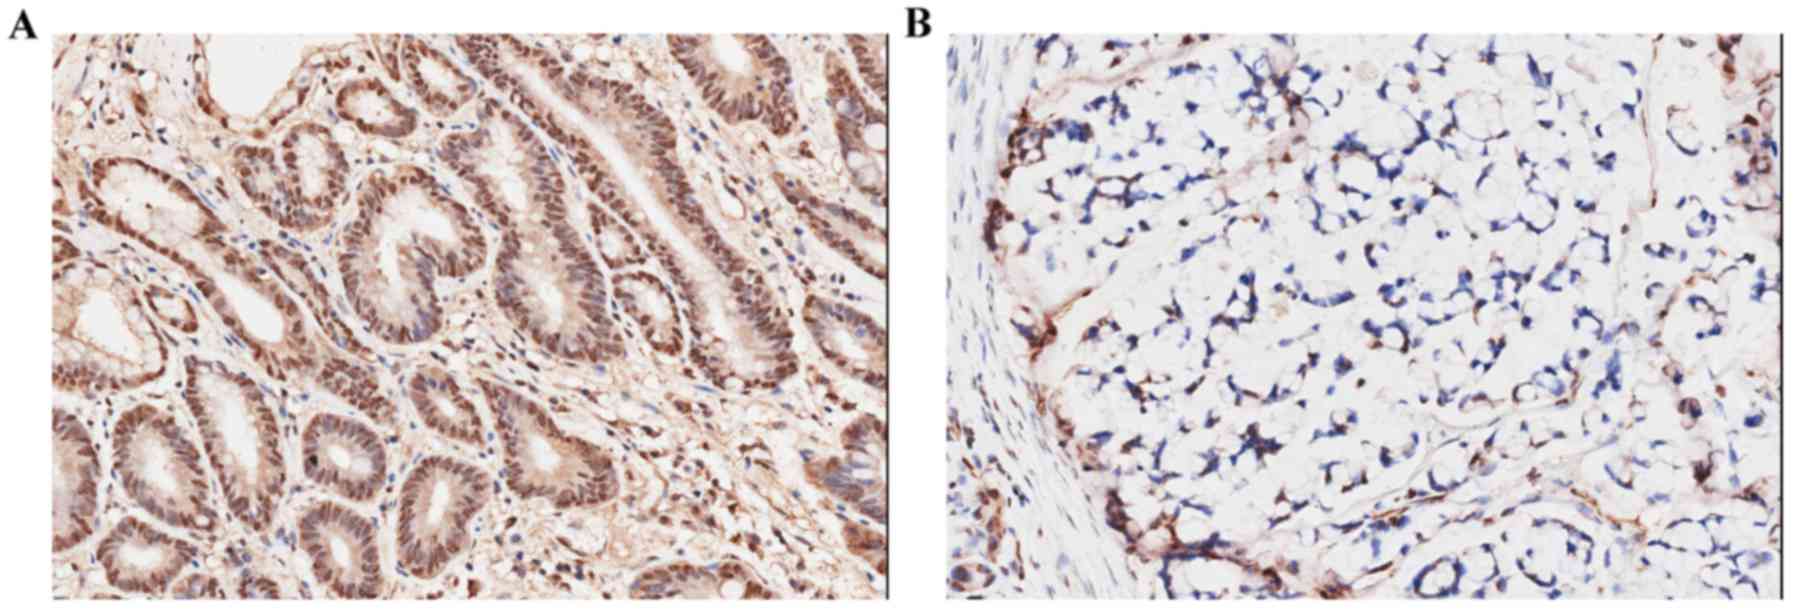
In total, 50 GC samples were analyzed by
immunohistochemistry. TPI staining was observed in GC cell
cytoplasm and membrane. TPI staining was positive in the cytoplasm.
The results showed that TPI expression in GC tissues was markedly
higher than in para-carcinoma tissues (P<0.001) (Table III): 41/50 specimens (82%) showed
a highly intensity staining (score ≥2) (Fig. 1A), and 9/50 specimens (18%) showed
negative staining (score 0–1) (Fig.
1B). We also examined the relationship between TPI expression
and patients characteristics or clinicopathological
characteristics. However, no statistical differences were found
between TPI expression and age, sex and tumor grade (Table IV).
| Table III.Expression of triosephosphate
isomerase in gastric cancer tissue and para-carcinoma tissue by
immunohistochemistry, n (%). |
Table III.
Expression of triosephosphate
isomerase in gastric cancer tissue and para-carcinoma tissue by
immunohistochemistry, n (%).
|
|
| TPI cases |
|
|
|---|
|
|
|
|
|
|
|---|
| Tissue type | n | Low expression | High
expression | χ2 | P-value |
|---|
| Cancer tissue | 50 | 9 (18%) | 41 (82%) | 45.3 |
<0.001a |
| Para-carcinoma
tissue | 49 | 42 (85.7%) |
7 (14.3%) |
|
|
| Table IV.Relationship between TPI and
clinicopathological characteristics in GC. |
Table IV.
Relationship between TPI and
clinicopathological characteristics in GC.
| Variables
P-value | n | Negative | Positive |
|
|---|
| Age (years) |
|
|
| >0.05 |
|
<60 | 14 | 3 | 11 |
|
|
≥60 | 36 | 6 | 30 |
|
| Sex |
|
|
| >0.05 |
|
Male | 42 | 8 | 34 |
|
|
Female | 8 | 1 | 7 |
|
| T stage |
|
|
| >0.05 |
|
T1–2 | 3 | 1 | 2 |
|
|
T3–4 | 47 | 8 | 39 |
|
| N stage |
|
|
| >0.05 |
| N0 | 11 | 1 | 10 |
|
|
N1–3 | 39 | 8 | 31 |
|
| M stage |
|
|
| >0.05 |
| M0 | 46 | 8 | 38 |
|
| M1 | 4 | 1 | 3 |
|
| TNM stage |
|
|
| >0.05 |
|
I-II | 3 | 1 | 2 |
|
|
III-IV | 47 | 8 | 29 |
|
TPI mRNA expressions in human gastric
cancer cell lines
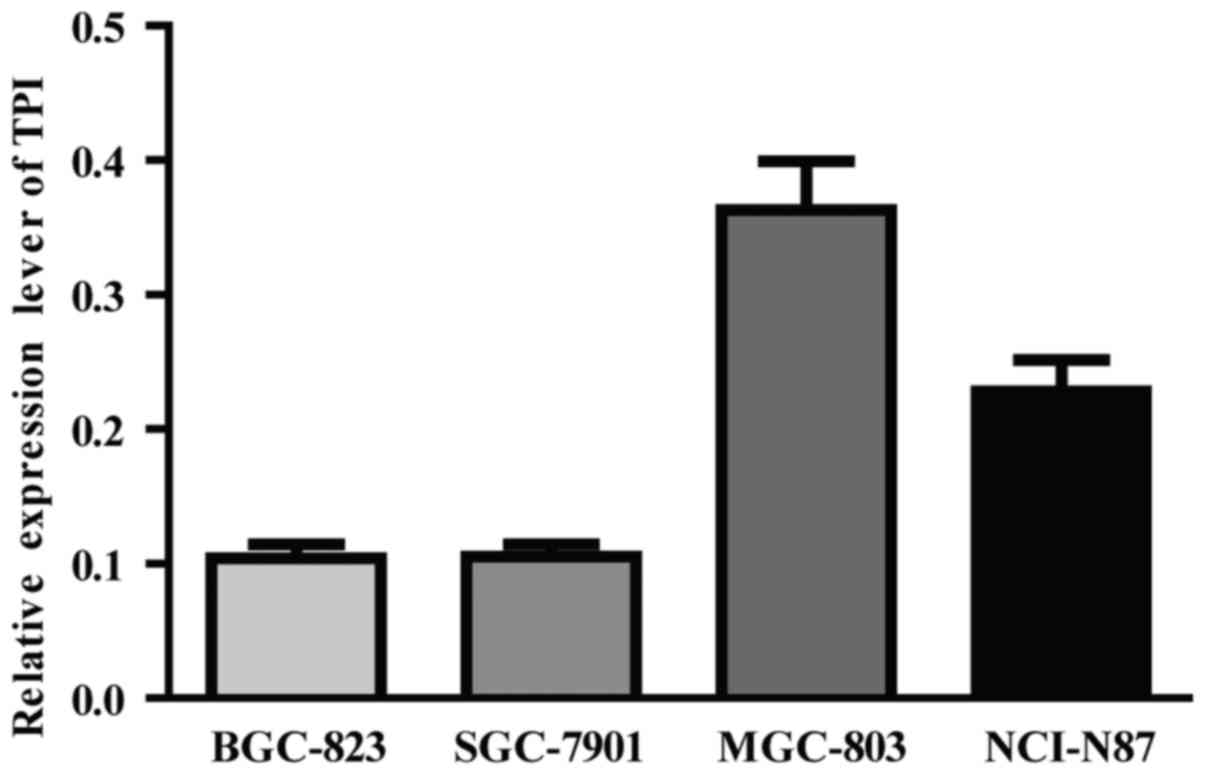
TPI expression was detected in four GC cell lines by
RT-qPCR. TPI highest mRNA expression was observed in MGC-803 cell
line and relatively low TPI mRNA expression was found in BGC-823
and SGC-7901 cell lines (Fig. 2).
Therefore, BGC-823 cell line was chosen to perform TPI
overexpression by plasmid transfection and MGC-803 to perform TPI
knockdown by siRNA.
TPI upregulation effect on
proliferation, colony formation, migration and invasion and cell
cycle distribution in BGC-823 cells
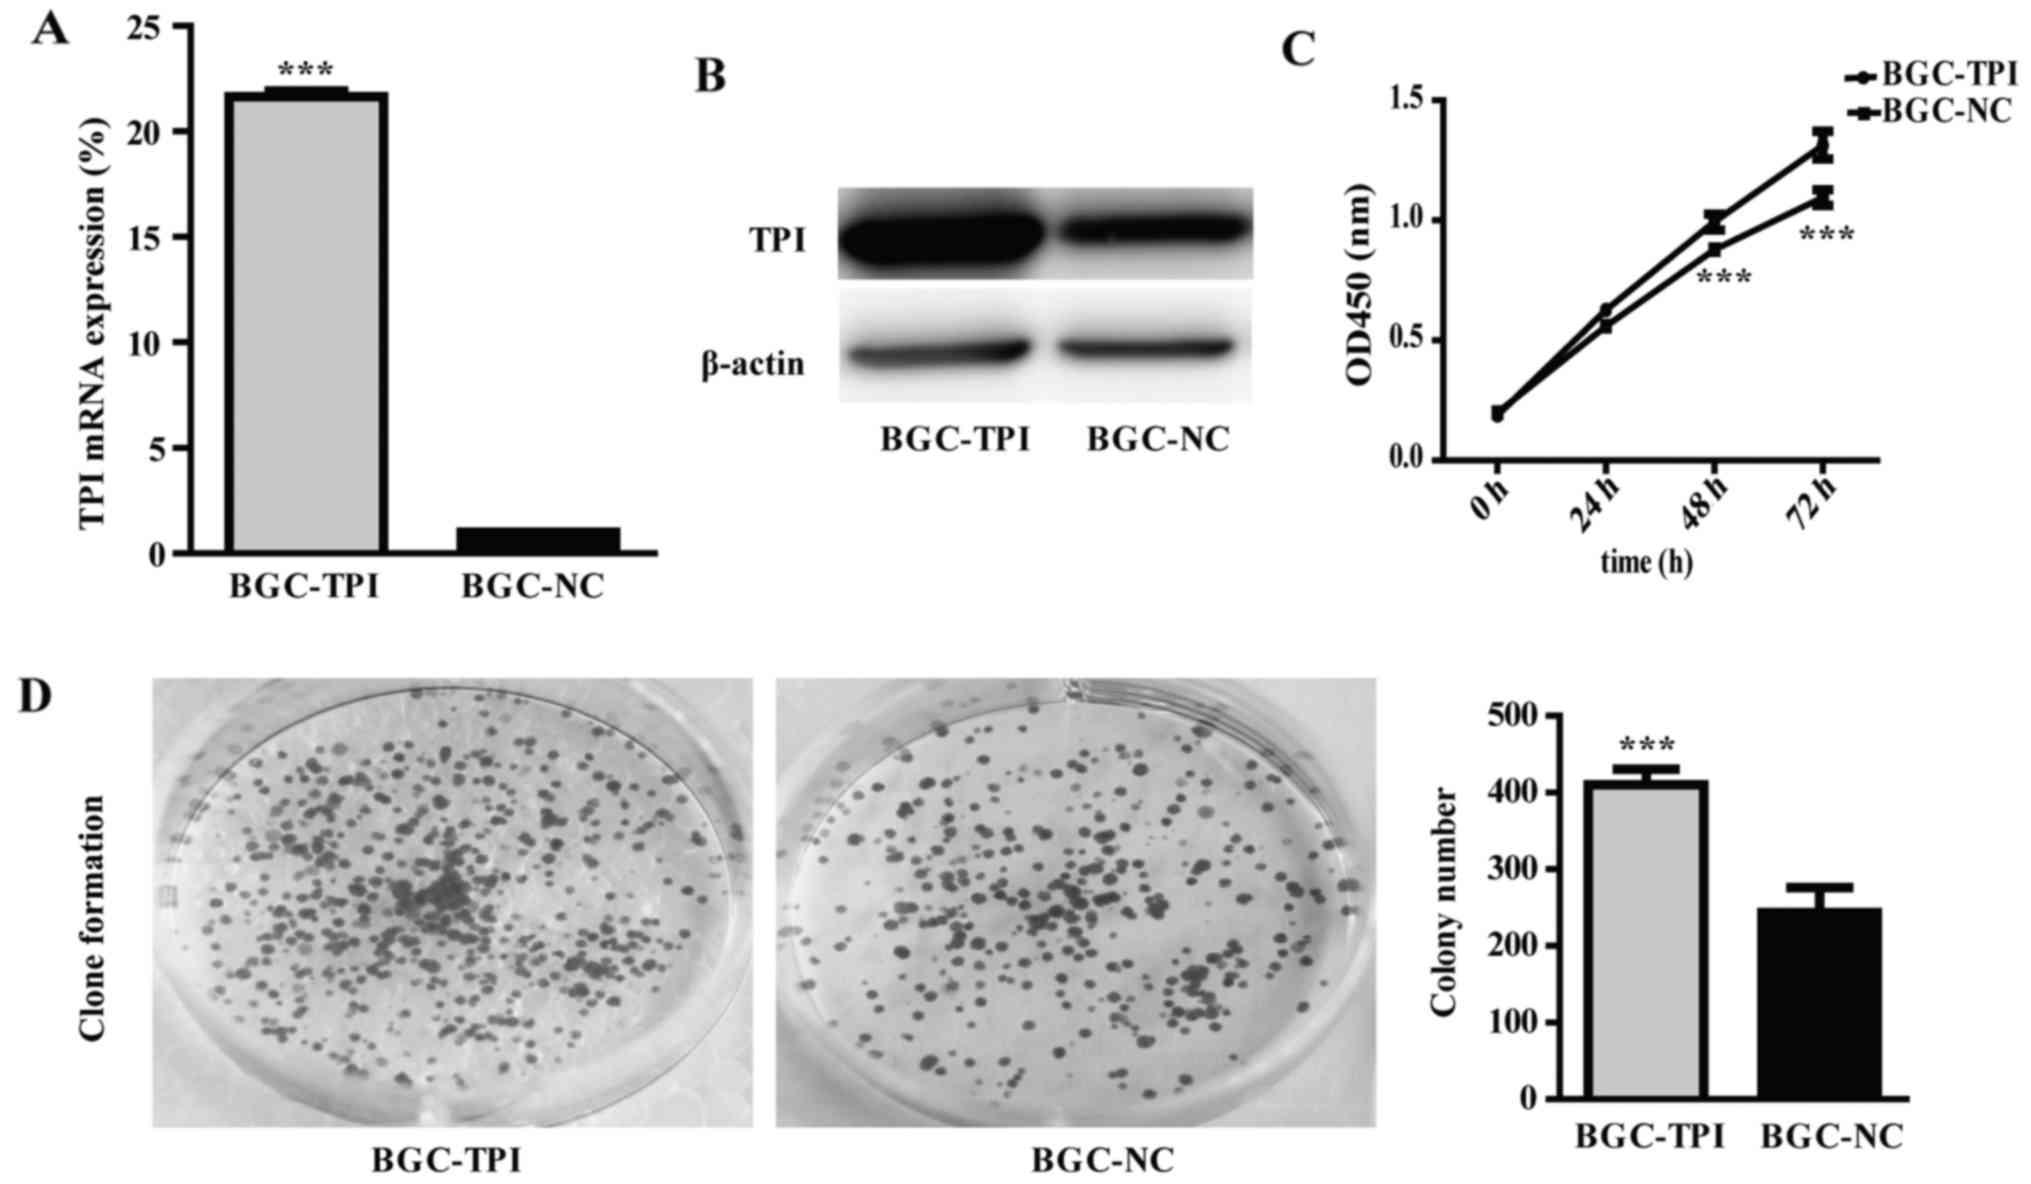
Since TPI is upregulated in many carcinomas, we
investigated the role of TPI in gastric cancer cell line behavior.
Since TPI expression was low in BGC-823, we chose this cell line to
explore the effect of TPI overexpression by pcDNA3.1 (+)/TPI
transfection. RT-qPCR and western blot results demonstrated that
TPI mRNA and protein expression were significantly higher in cells
transfected with pcDNA3.1 (+)/TPI than in cells transfected with
empty vector pcDNA3.1 (Fig. 3A and
B; P<0.001). The upregulated TPI group was named BGC-TPI and
the control group was named BGC-NC.
In order to evaluate the role of TPI in GC
progression, we used CCK-8 test and colony formation assay to
detect cell proliferative ability, Transwell assay to detect
migration and invasion abilities, and flow cytometry to detect cell
cycle distribution in BGC-823 cells. The results showed that
proliferation and colony formation abilities were significantly
increased in the TPI upregulated group than in the control group
(Fig. 3C and D; P<0.001).
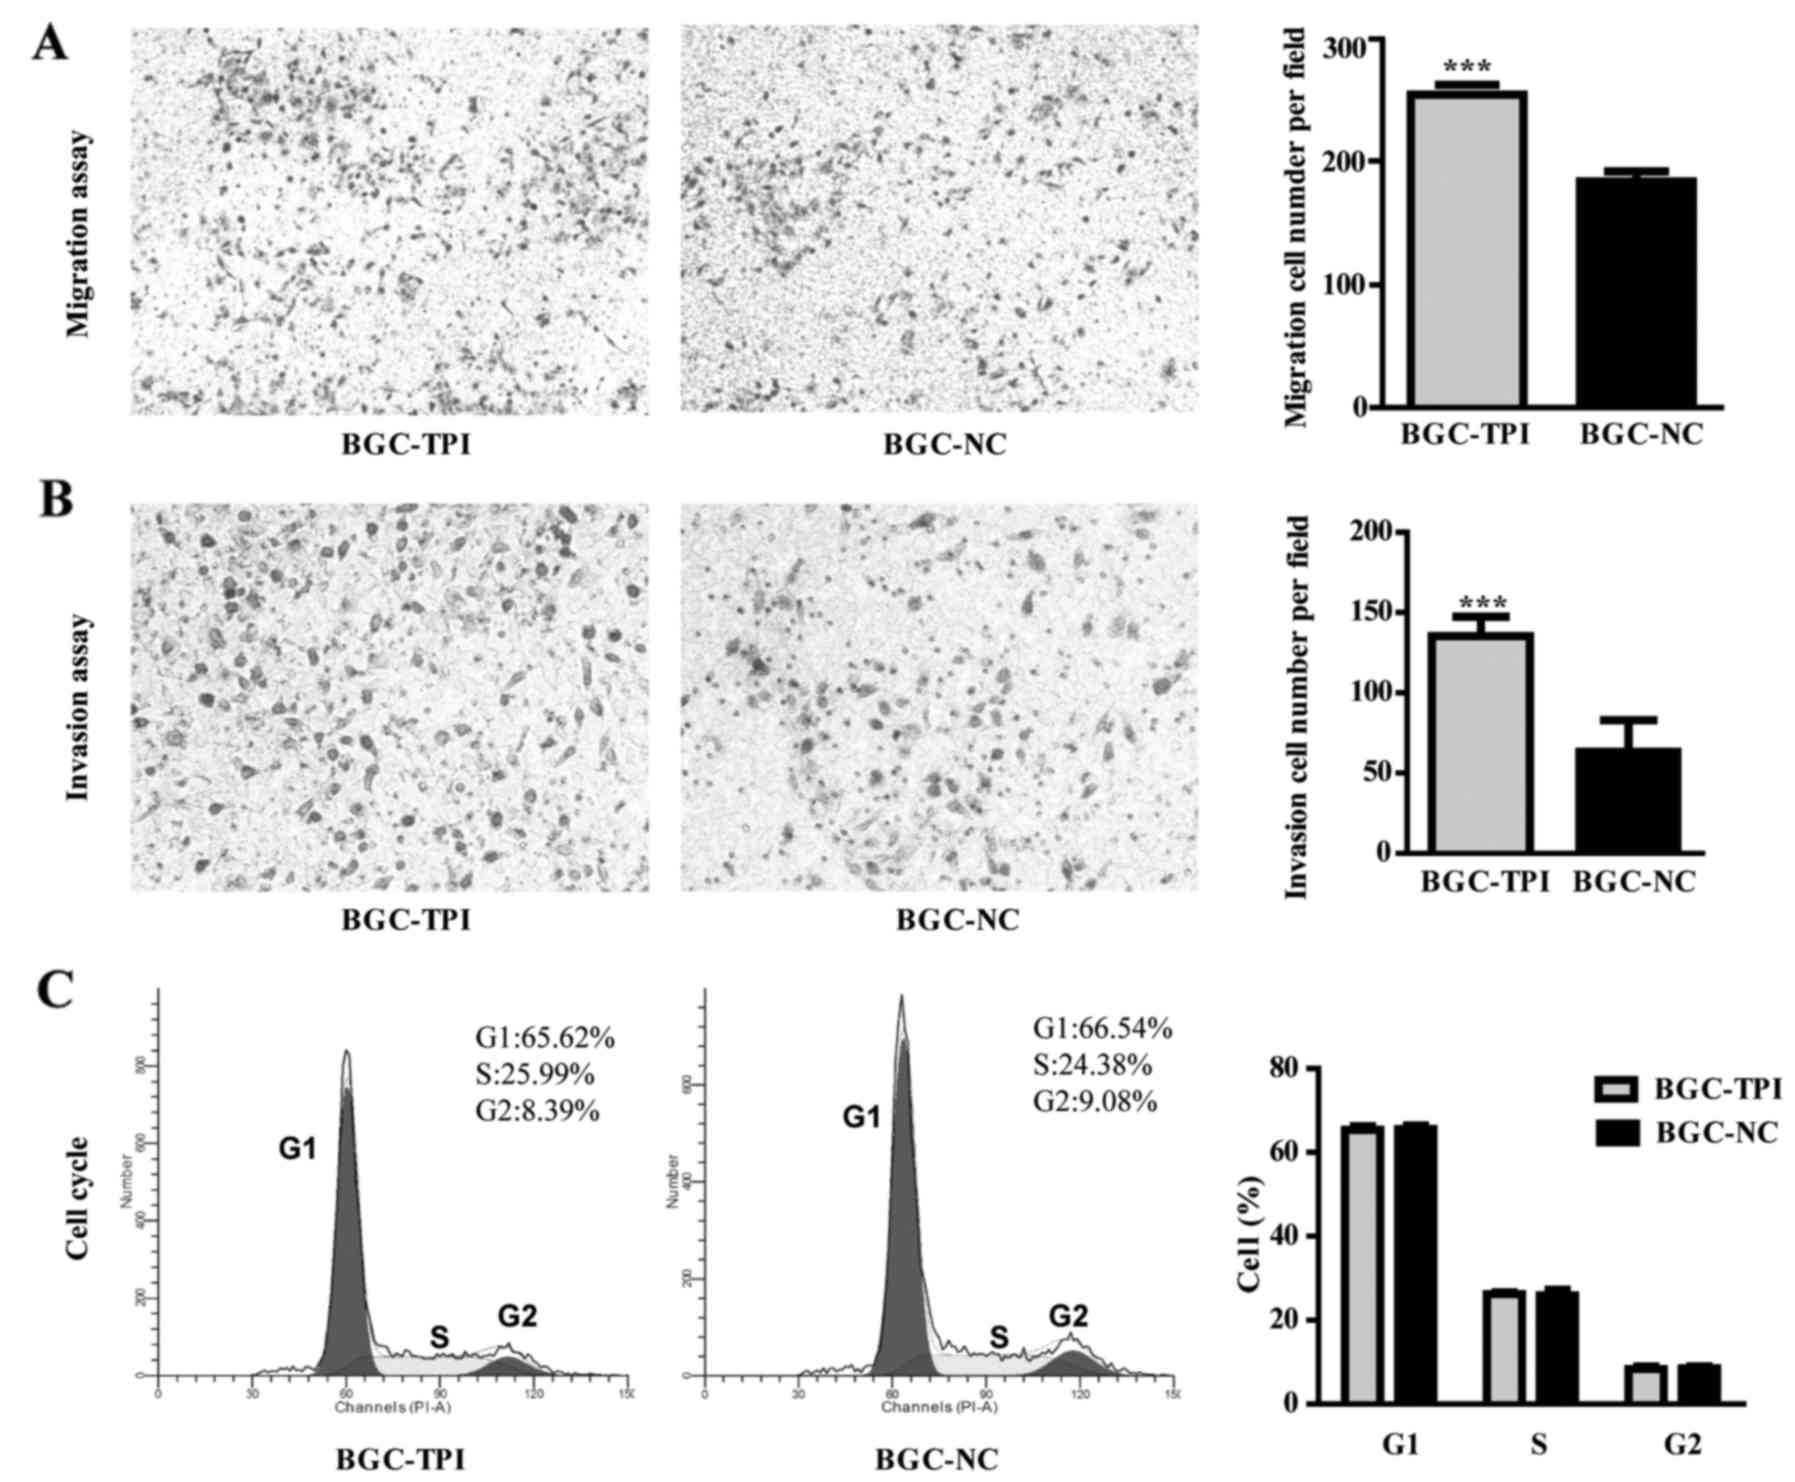
Transwell assay results indicated that BGC-823 migration rate was
higher in the TPI upregulated group than in the control group
(Fig. 4A; P<0.001). The
transwell invasion assay results indicated that TPI increased
expression caused a significant increase in BGC-823 invasive
ability compared to control group (Fig.
4B; P<0.001). Cell cycle distribution results showed no
significant difference between BGC-823 upregulated group and
control group (Fig. 4C).
TPI knockdown effect on proliferation,
colony formation, migration and invasion, cell cycle distribution
and apoptotic abilities in MGC-803 cells
Since we demonstrated that TPI overexpression has a
role in increasing proliferation, migration and invasion, TPI was
silenced in MGC-803 cells by siRNA to evaluate the TPI role in GC
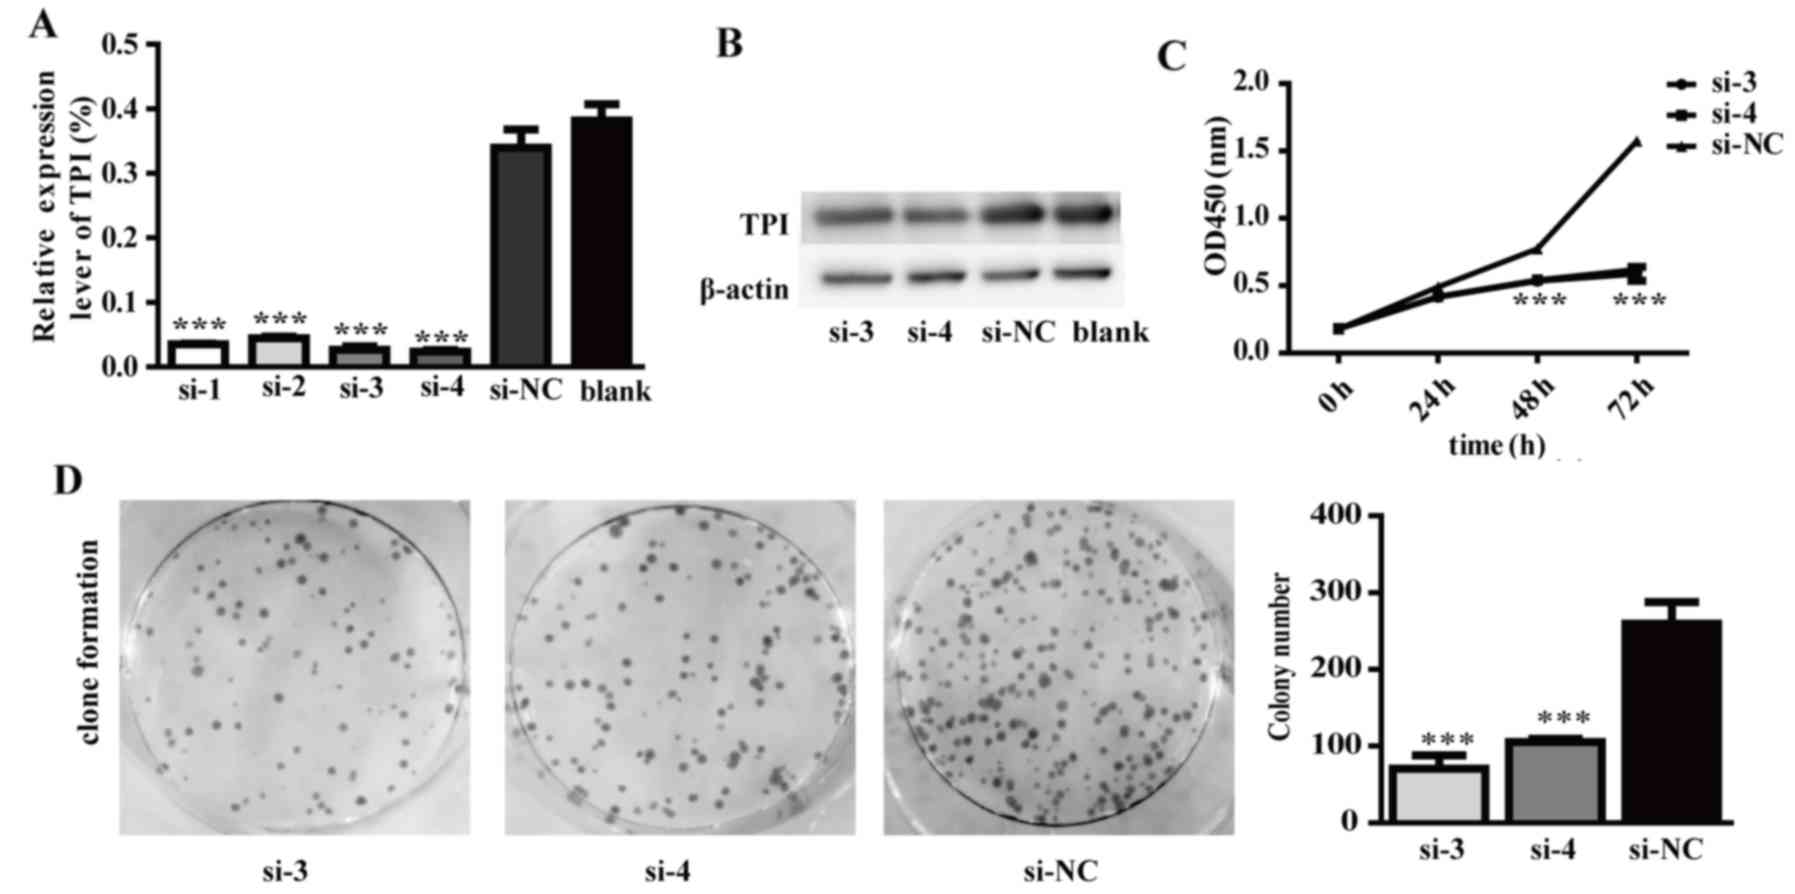
development and progression. The results demonstrated that TPI mRNA
and protein expression were significantly lower in cells
transfected with TPI siRNA than in cells transfected with negative
siRNA (Fig. 5A and B). TPI mRNA
level was significantly reduced by 90% in comparison to the si-NC
group (Fig. 5A; P<0.001). TPI
protein level was also significantly reduced by 55.3% in comparison
to the si-NC group (Fig. 5B). In
order to obtain more reliable results, TPI siRNA-3 and TPI siRNA-4
were chosen for our further experiments.
The results indicated that TPI silencing could
decrease proliferation and colony formation abilities in the si-3
and si-4 knockdown groups (Fig. 5C and
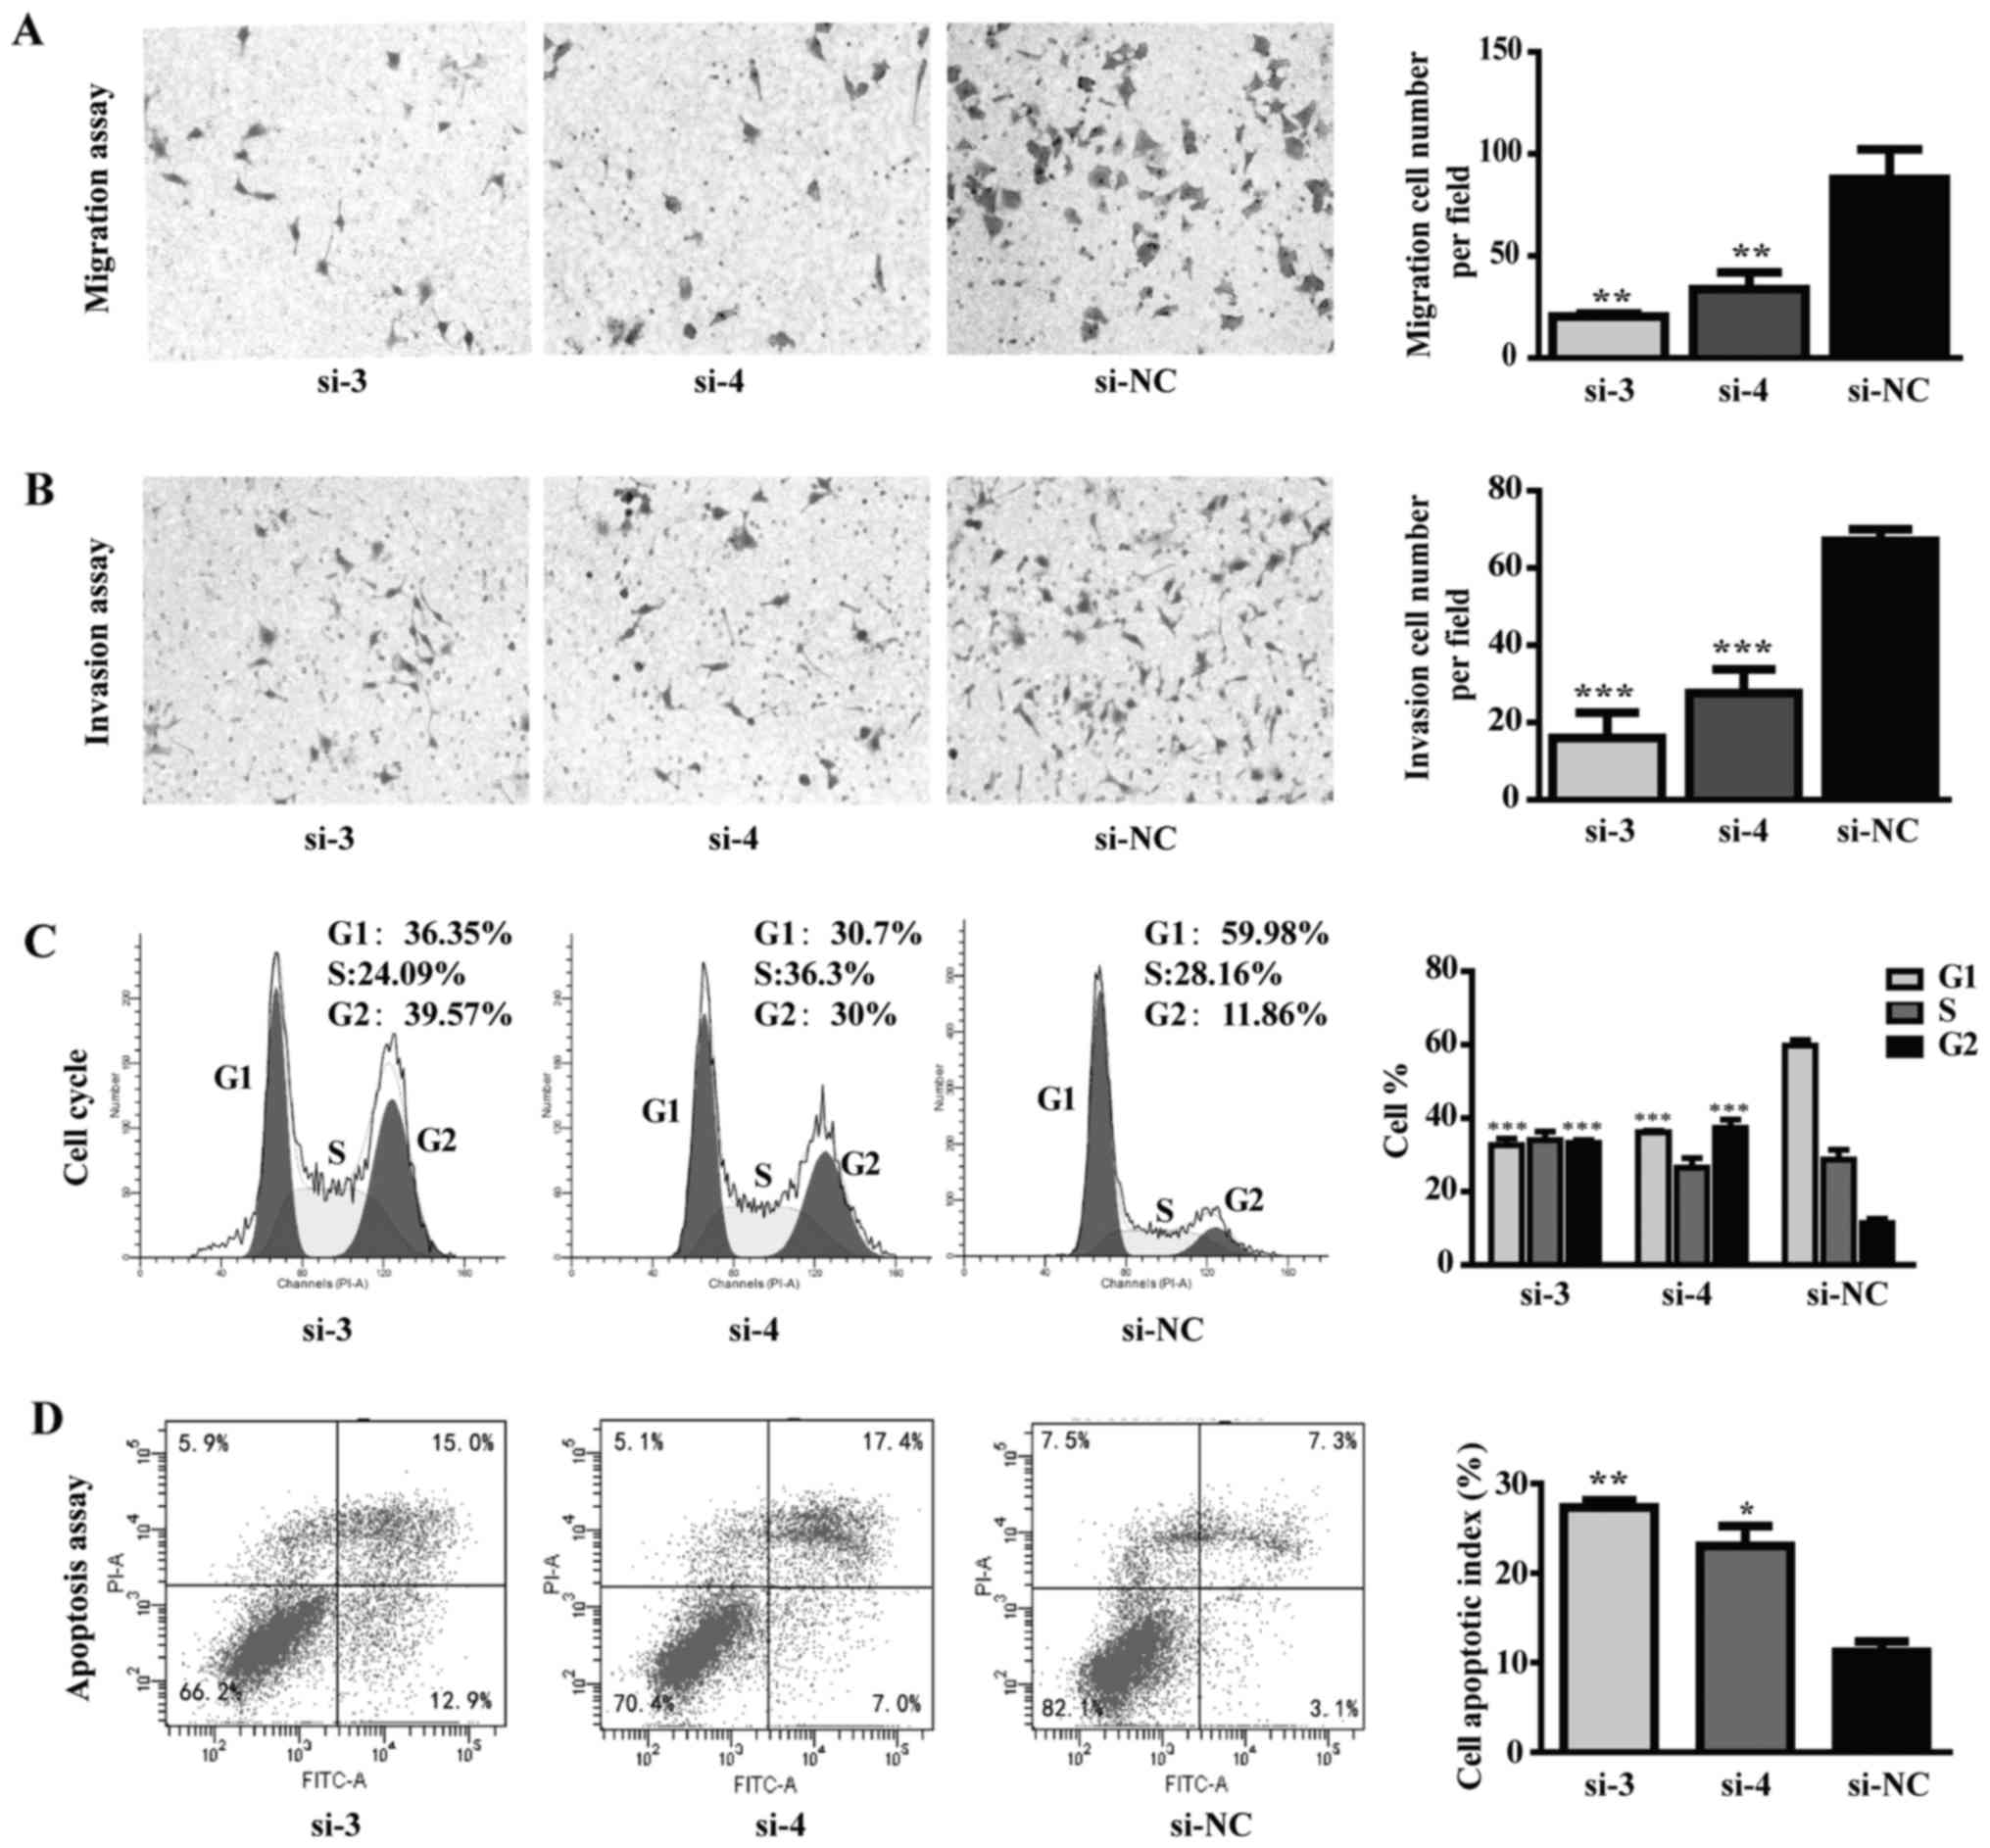
D). In addition, TPI silencing inhibited tumor cell migration
and invasion abilities in MGC-803 cells (Fig. 6A and B). Cell cycle distribution
results showed a dramatic increase in the G2-M fraction, from
<10% in control group to >30% in TPI si-3 and TPI si-4
groups, while a significant decrease in the G1 fraction was
observed (Fig. 6C; P<0.001).
Flow cytometric results showed that apoptotic cells in the
knockdown group measured by Annexin V-FITC were significantly
increased compared to control group (Fig. 6D; P<0.05). These results
indicated that the anti-proliferative effect of siTPI was due to
cell cycle arrest in G2 phase and consequent apoptosis
promotion.
TPI downstream genes by GeneChip
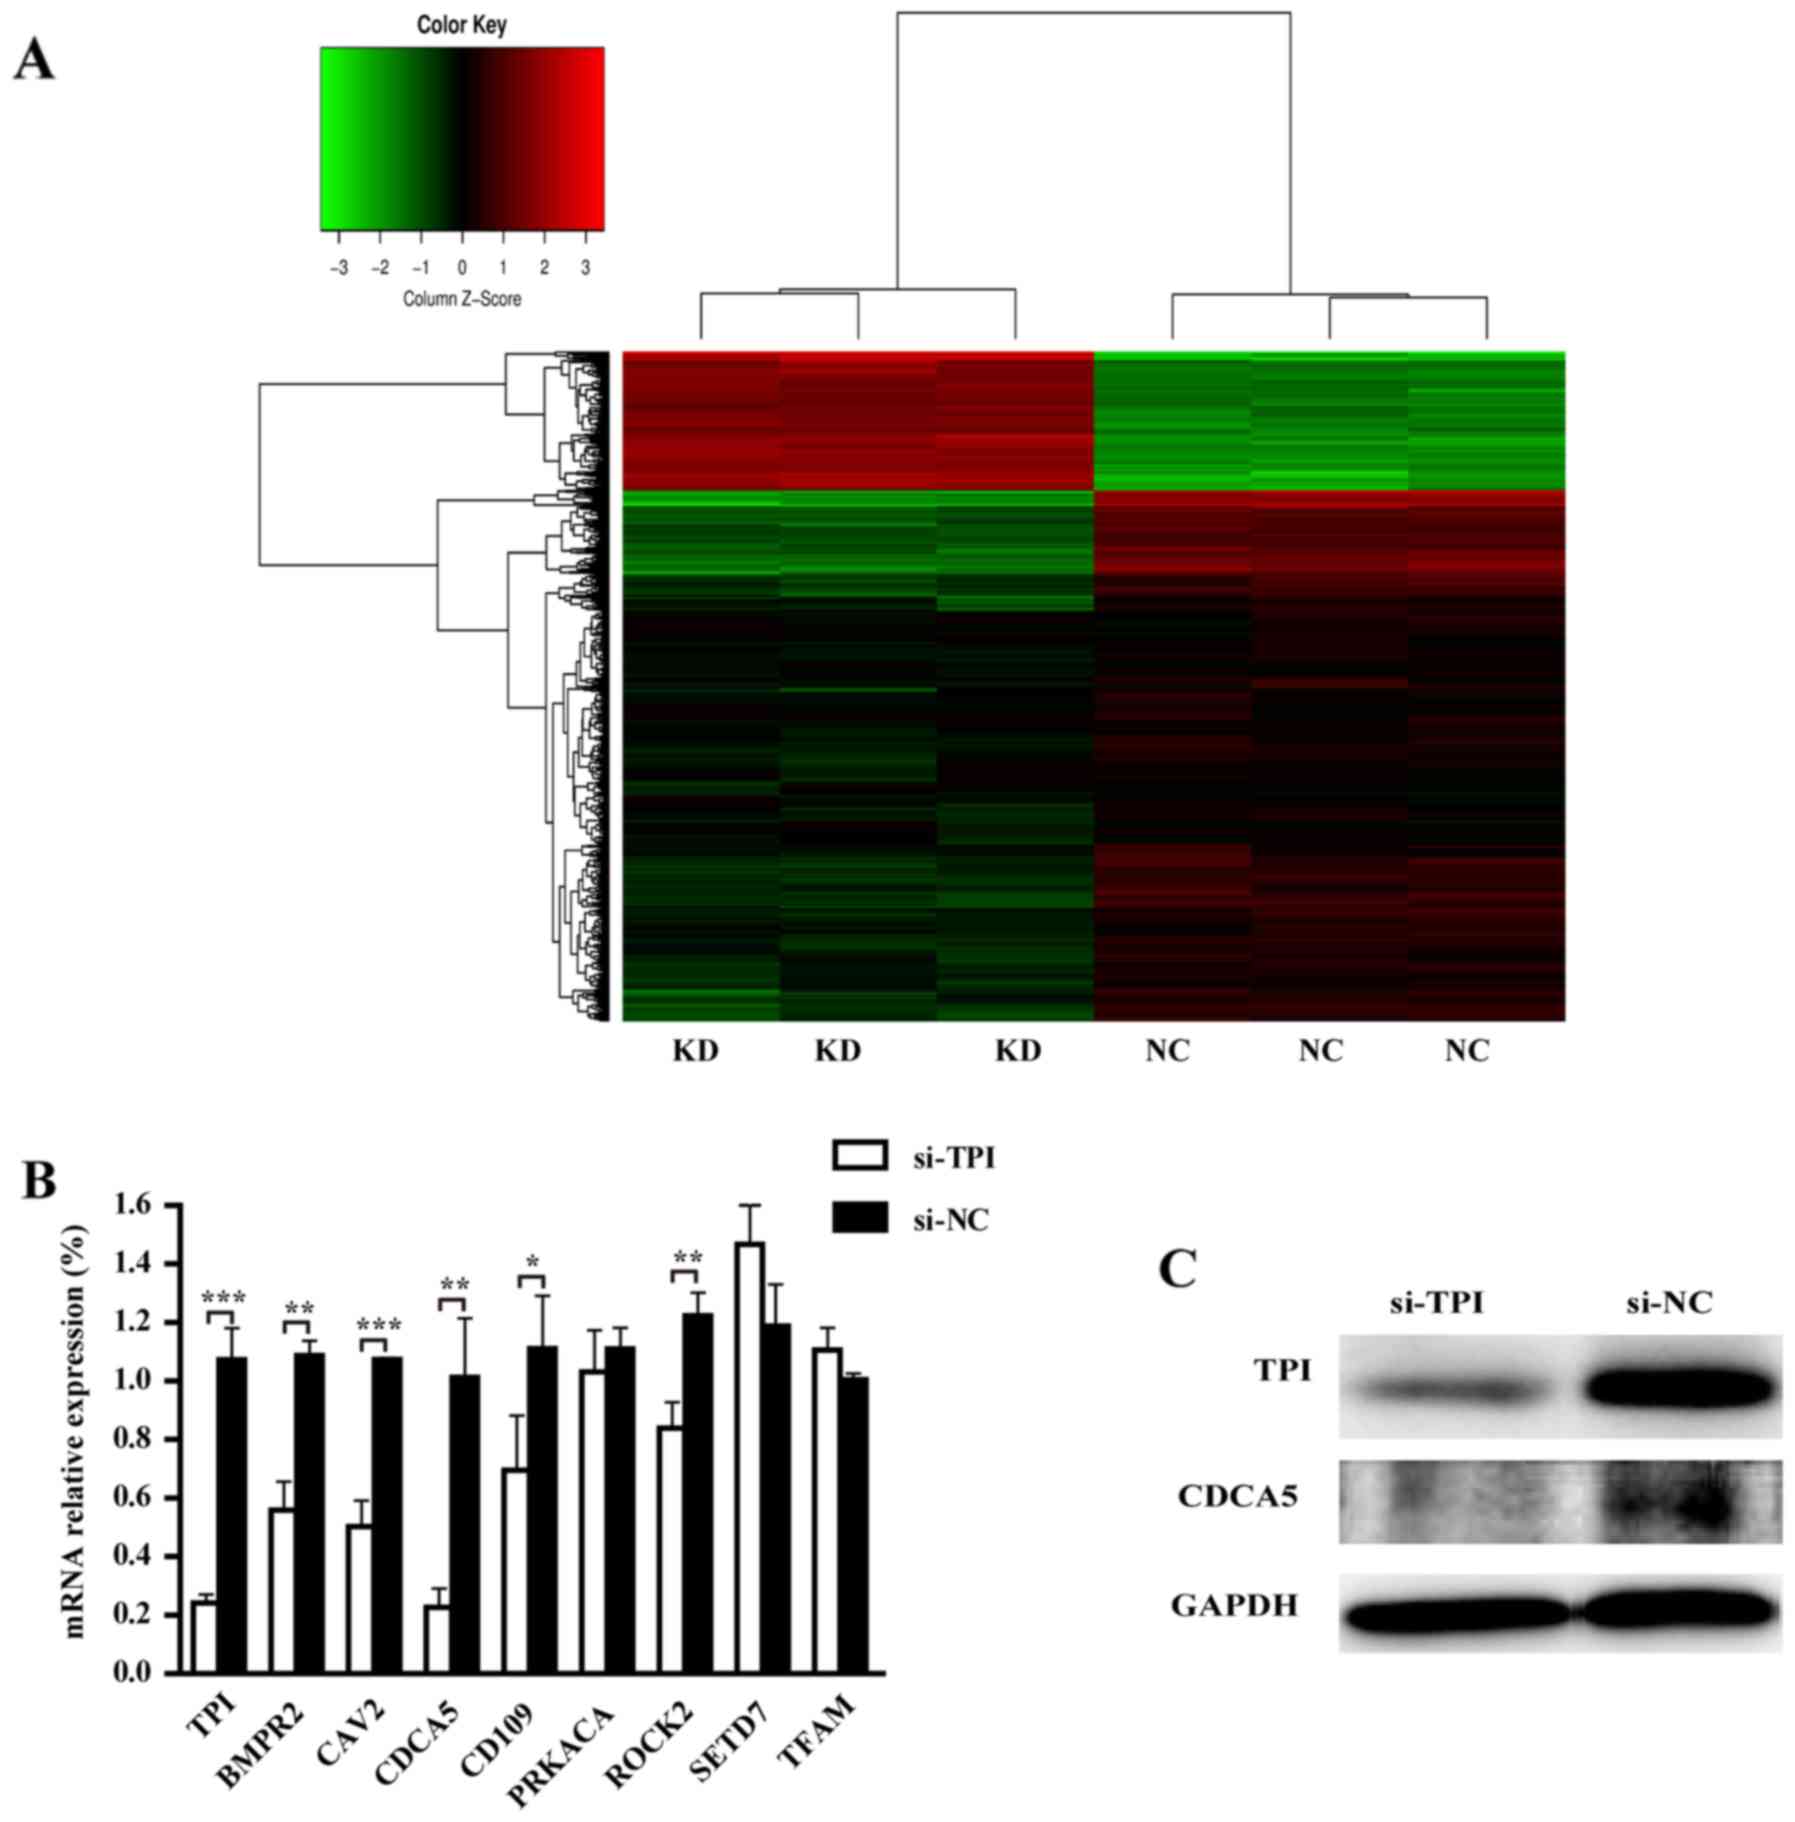
According to the P<0.05 cut-off criteria and
|log2 fold change| ≥1, a total of 948 differentially expressed
genes (DEGs) were obtained, including 746 downregulated and 202
upregulated DEGs. The heat map of hierarchical clustering analysis
showed a clear DEGs different expression between TPI knockdown and
negative controls and the majority of DEGs were downregulated
(Fig. 7A).
TPI downstream genes screening and
verification
GO analysis showed that TPI knockdown could decrease
autophagy, viability, proliferation, cell migration, and increase
cell death, necrosis, organismal death and morbidity or mortality
(Table V). Most of our experiment
results were consistent with these function predictions. Our
experiment showed that TPI silencing could inhibit proliferation,
migration and invasion of MGC-803 cells. Downstream genes were
analyzed according to the function predicted by GO analysis. Within
the functional categories, downregulated genes were selected by
literature search in the database. Among the downregulated genes,
several genes were related with proliferation, migration and
invasion such as CDCA5, BMPR2, CAV2, CD109, PRKACA, ROCK2, TFAM and
PRKACA. Thus, these genes were selected to validate their
expression by RT-qPCR. TPI knockdown resulted in CDCA5, BMPR2,
CAV2, CD109 and ROCK2 mRNA downregulation (Fig. 7B; P<0.05). Since CDCA5 mRNA
showed the most remarkable decrease, we verified whether it was
regulated by TPI at protein level. The result of western blot
analysis indicated that CDCA5 protein was decreased when TPI was
silenced (Fig. 7C). Thus, CDCA5 was
chosen for our next experiment.
| Table V.Differentially expressed genes in
Gene Ontology (GO) categories. |
Table V.
Differentially expressed genes in
Gene Ontology (GO) categories.
| Diseases or
function annotation | P-value | Predicted
activation state | Activation
z-score | Molecules | DEGs |
|---|
| Autophagy | 0.000175 | Decreased | −3.933 | 41 | ROCK2 |
| Proliferation of
cells | 1.08E-13 | Decreased | −3.568 | 319 | CDCA5, BMPR2, CAV2,
CD109, PRKACA, ROCK2, TFAM |
| Cell viability of
cell lines | 0.0000909 | Decreased | −3.165 | 25 |
|
| Migration of
cells | 3.76E-09 | Decreased | −2.585 | 174 | CDCA5, BMPR2,
PRKACA, ROCK2 |
| Cell movement | 6.04E-09 | Decreased | −2.429 | 189 | BMPR2, PRKACA,
ROCK2 |
| Cell proliferation
of tumor cell lines | 2.18E-13 | Decreased | −2.414 | 163 | BMPR2, PRKACA |
| Cell death of
cancer cells | 0.000458 | Increased | 2.434 | 37 |
|
| Necrosis | 2.13E-11 | Increased | 2.541 | 235 | PRKACA, ROCK2,
TFAM |
| Cell death | 3.77E-12 | Increased | 2.812 | 291 | PRKACA, ROCK2,
TFAM |
| Organismal
death | 2.12E-08 | Increased | 5.064 | 204 | BMPR2, PRKACA,
TFAM |
| Morbidity or
mortality | 2.42E-08 | Increased | 5.21 | 206 | BMPR2, PRKACA,
TFAM |
Effect of CDCA5 knockdown on MGC-803
cell proliferation, colony formation, migration and cell cycle
distribution
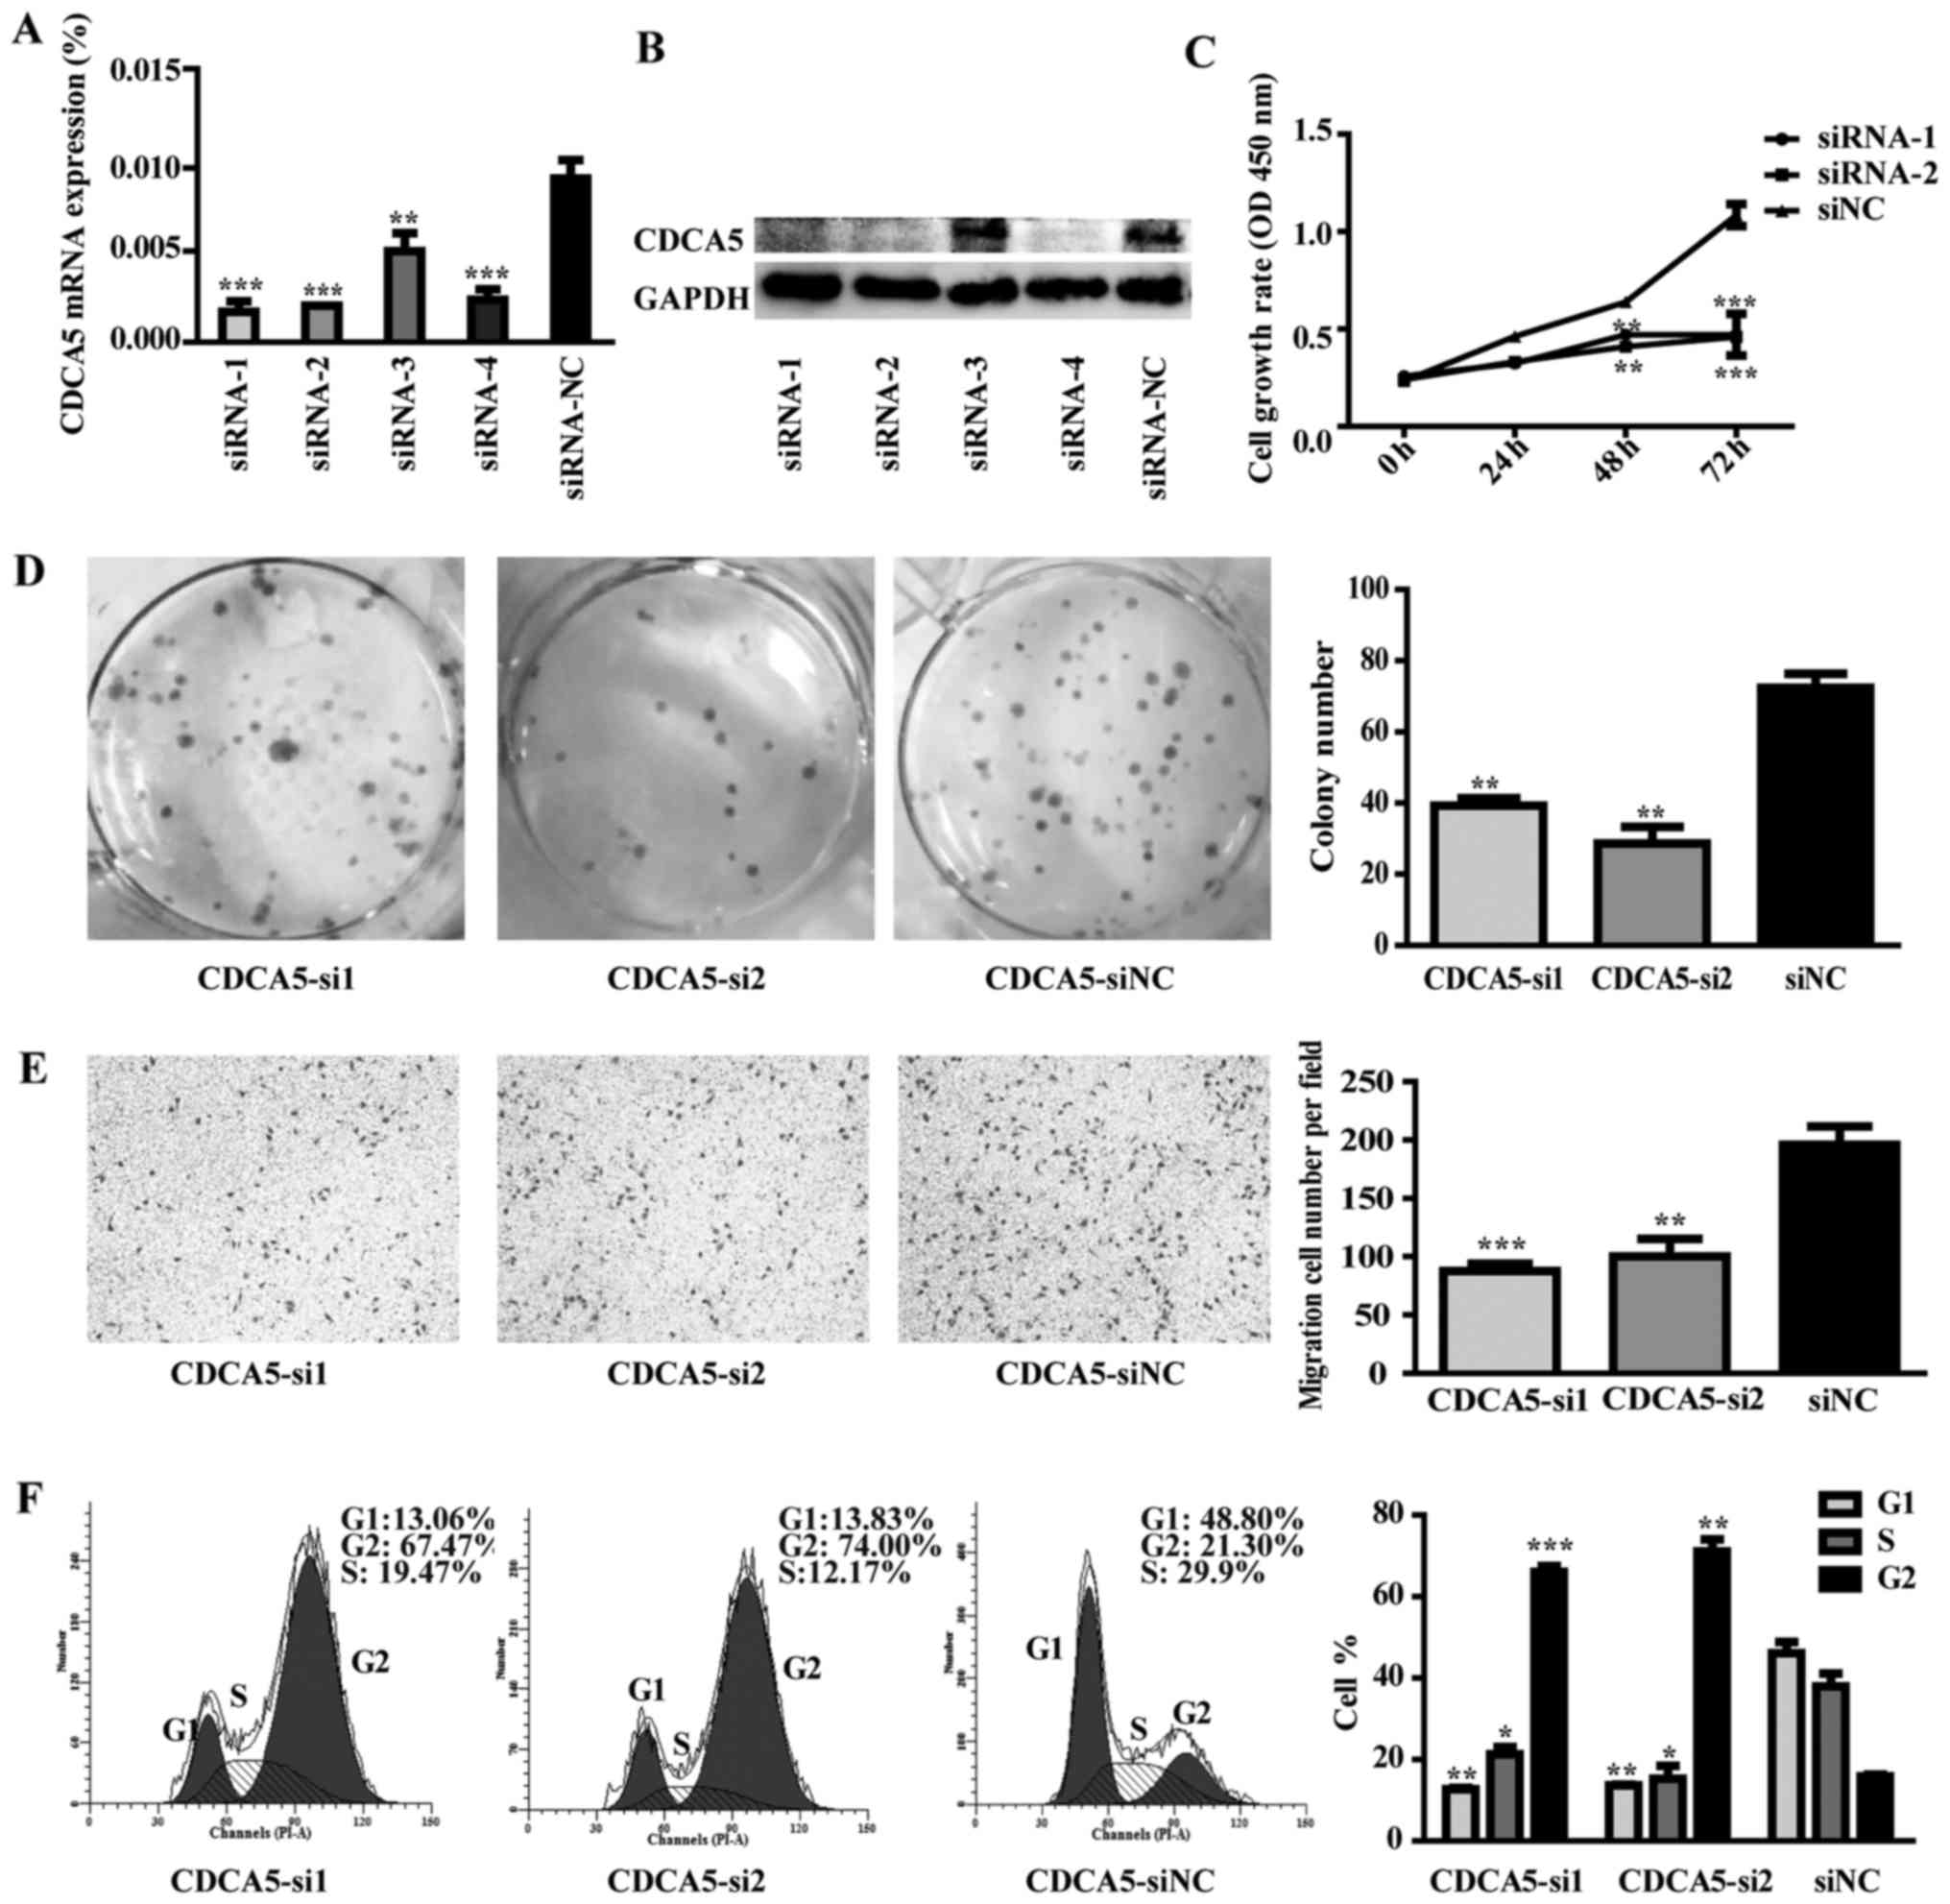
Four CDCA5-specific siRNAs (siRNA-1, siRNA-2,
siRNA-3 and siRNA-4) were transfected into MGC-803 cells. The
control group was transfected with scrambled siRNA and named si-NC.
RT-qPCR and western blot analysis were used to detect the
efficiency of CDCA5 knockdown. CDCA5 mRNA and protein were reduced
after siRNA transfection (Fig. 8A and
B). Functional results indicated that CDCA5 knockdown could
inhibit MGC-803 cells proliferation, colony formation and migration
compared to control group (Fig.
8C-E; P<0.01). Moreover, CDCA5 knockdown could arrest cell
cycle in G2/M phase (Fig. 8F;
P<0.01).
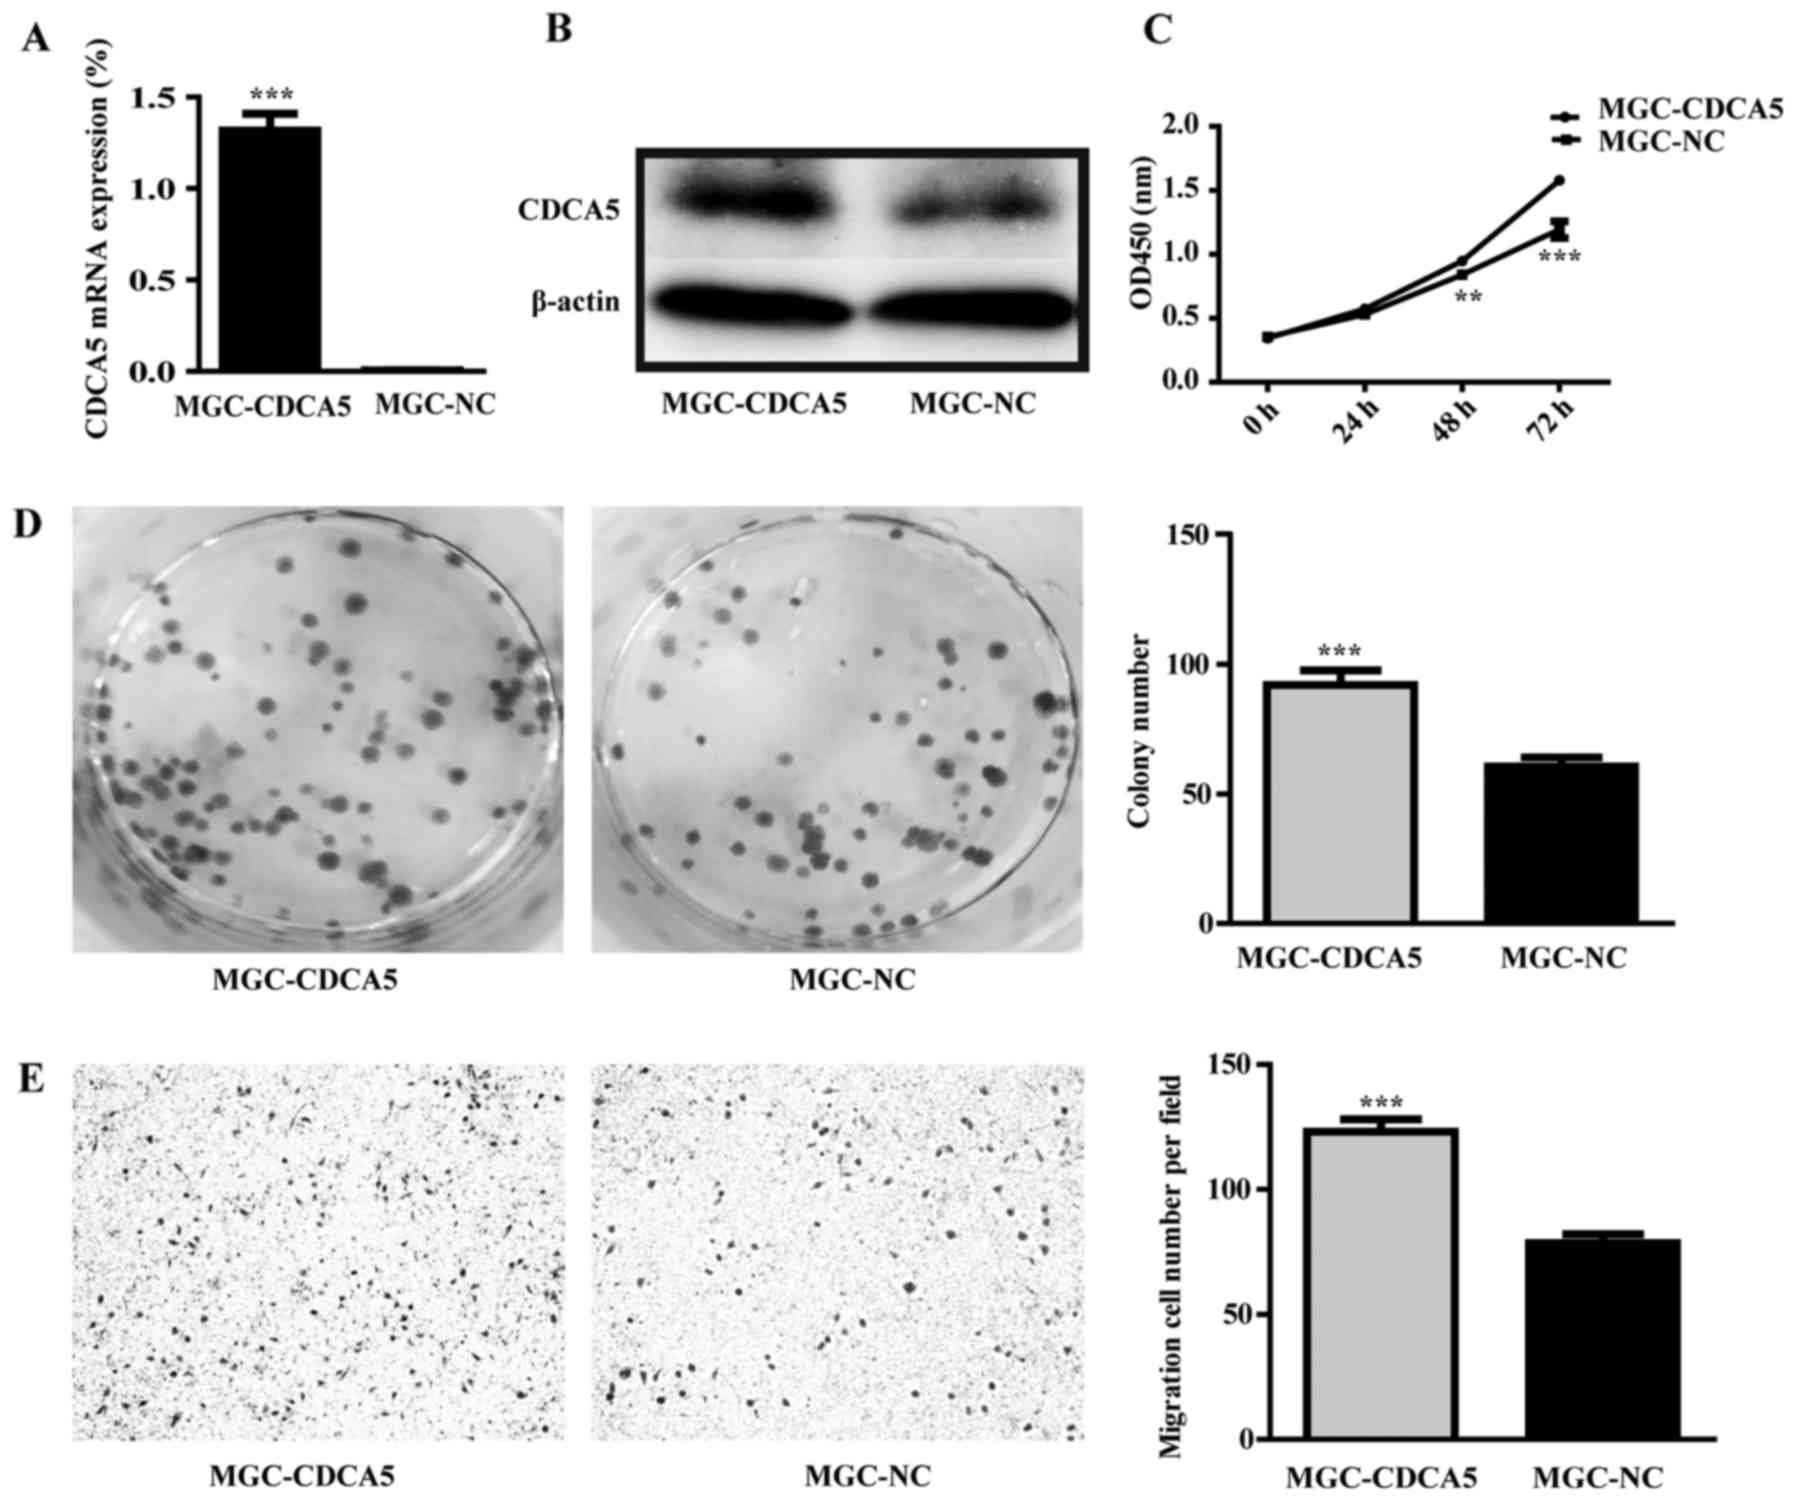
Effect of CDCA5 overexpression on
MGC-803 cell proliferation, colony formation and migration
abilities
The eukaryotic expression vector of CDCA5 was
constructed and was transfected to MGC-803 cells. The empty vector
was as control group. The result of RT-qPCR and western blot
analysis showed that the mRNA and protein level of CDCA5 were
increased in CDCA5 overexpression group (Fig. 9A and B). CDCA5 overexpression could
enhance growth and promote colony formation of MGC-803 cells
(Fig. 9C and D; P<0.01).
Furthermore, CDCA5 overexpression could also enhance MGC-803 cell
migration (Fig. 9E;
P<0.001).
Discussion
In the present study, we found that TPI expression
was upregulated in GC tissues compared to matched para-carcinoma
tissue. These results suggested that TPI might have oncogenic
functions in GC. In recent years, TPI was reported overexpressed in
several tumors, including pancreatic (11), esophageal (4), colorectal cancer (12) and lung squamous cell carcinoma
(5). However, none of these
previous studies reported the relationship between TPI expression
and patients characteristics or clinicopathological characteristics
although we did not find any statistical difference between them,
probably due to the small sample size in this study. The results of
the present study showed that TPI was overexpressed in GC tissues,
which was consistent with the previous reports.
TPI upregulation could significantly increase the
proliferation and colony formation in BGC-823 cells, while
silencing inhibited these abilities in MGC-803 cells. Similar
results have been reported by the study of Ritterson Lew and Tolan
(13) who showed that TPI knockdown
by siRNA in Ras-transformed NIH-3T3 cells could decrease cancer
cell proliferation by 25% because glycolysis pathway was affected
in some ways. Tumor cells proliferating more quickly could
accelerate the tumor growth and the development. The ability of
colony formation in cancer cells reflected the proliferation of
tumor cells and ability of tumor formation to a certain extent,
suggesting that the enhanced ability of colony formation could
increase the formation of metastatic tumors. The present study
indicated that TPI promoted tumor growth.
In addition, invasion and metastasis were analyzed
to further explore the function of TPI in GC cells. Our results
indicated that invasion and metastatic abilities were increased
when TPI was overexpressed in BGC-823, while they were reduced when
it was silenced in MGC-803. Thongwatchara et al (14) reported that TPI expression is
elevated in patients with positive lymphatic metastasis compared to
patients without lymphatic metastasis. Moreover, two studies showed
that TPI expression is also higher in cells with highly metastatic
ability than in cells with poor metastatic ability (15,16).
Thus, our result suggested that TPI might play a crucial role in
cell invasion and metastatic abilities in GC cells. TPI is an
enzyme required in glycolysis. In order to meet the need of local
hypoxia in rapid growth of tumor cells, most of them obtain energy
through aerobic glycolysis and this phenomenon is called the
Warburg effect (17). This means
that TPI is indispensable in Warburg effect. The Warburg effect
plays an important role in tumor metastasis and may be the reason
for the invasion and metastasis of tumor (18). Notably, one of the reasons inducing
cancer cell movement to other region is because the end-product of
glycolysis, lactic acid, makes the microenvironment acid, leading
to an uncomfortable tumor cells life (19). The above studies give some evidence
explaining the TPI ability of promoting invasion and metastasis in
cancer cells.
The present study showed that TPI overexpression or
knockdown could affect the malignant biological behavior of GC cell
lines, but little is known about its molecular mechanism. For
example, it is not known which downstream genes are directly or
indirectly regulated by TPI and which downstream genes have a
biological function similar with TPI. In order to evaluate these
unknown aspects, TPI downstream genes after TPI knockdown were
analyzed. The function predicted by GO analysis showed that TPI
knockdown could decrease cell proliferation and migration, which
were consistent with our experimental results. Furthermore, the
expression of several genes was decreased when TPI was silenced,
including CDCA5, CAV2, BMPR2, CD109 and ROCK2, suggesting that they
might be regulated by TPI. Among these genes, CDCA5 showed the most
decreased expression.
The main function of CDCA5 is to ensure that the
sister chromatids are accurately separated at the later stage of
mitosis (20). In recent years,
CDCA5 was reported overexpressed in a number of cancer tissues such
as lung cancer tissue, squamous cell carcinoma (OSCC) tissue,
urothelial carcinoma tissue and was related with the prognosis in
patients. Indeed, high CDCA5 expression was associated with a poor
prognosis (21–23). These results suggested that CDCA5
may have oncogenic functions like TPI. On the one hand, our present
study showed that CDCA5 overexpression could accelerate the growth
of MGC-803 cells, and promote cell migration ability. These results
demonstrated for the first time that CDCA5 overexpression could
increase the malignant behavior of GC cells. Moreover, the present
results might give some evidence explaining CDCA5 overexpression in
cancer cells and why high CDCA5 expression was associated with a
poor prognosis. On the other hand, this study showed that CDCA5
knockdown could suppress proliferation, migration and invasion
abilities of MGC-803 cell and could arrest the cell cycle in G2/M
phase. Thus, the present study indicated that siCDCA5
anti-proliferative effect was exerted via arresting the cell cycle
in G2 phase that was similar to the results obtained after TPI
knockdown. This result was similar to previous results showing that
CDCA5 knockdown could inhibit the proliferation of lung cancer
cells and human oral squamous cell carcinoma (OSCC) cell lines
(22,23). Besides, CDCA5 knockdown could
suppress the invasion ability of OSCC cell lines and arrest cells
in G2 phase as well (23). The
reason why CDCA5 knockdown could arrest cells in G2 phase may be
associated with CDCA5 main function, which is to ensure the
chromosome partitioning accurately (20). Our results indicated that TPI
knockdown affected the malignant behavior of GC cell lines that
might be related, at least in part, to CDCA5 silencing.
To the best of our knowledge, this is the first
report exploring TPI and CDCA5 expression and function in gastric
cancer, as well as their linking. Our results revealed some TPI
oncogenic roles and the potential role of its downstream gene CDCA5
in GC cells. Hence, TPI and CDCA5 might be important potential
tumor-markers related with GC development and might be considered
as novel targets for the treatment of gastric cancer.
Acknowledgements
The present study was supported by the Natural
Science Fund Project of Guangdong province, China (no.
2016A030313683), the Scientific and Technological plans of
Guangdong province, China (no. 2013B021800065) and the Social
Science and Technology Development Project of Dongguan, Guangdong
Province, China (no. 2014108101051 and no. 2016108101039).
References
|
1
|
Yan S, Li B, Bai ZZ, Wu JQ, Xie DW, Ma YC,
Ma XX, Zhao JH and Guo XJ: Clinical epidemiology of gastric cancer
in Hehuang valley of China: A 10-year epidemiological study of
gastric cancer. World J Gastroenterol. 20:10486–10494. 2014.
View Article : Google Scholar : PubMed/NCBI
|
|
2
|
Meng X, Wang X and Ding C: Advances in
lymph node metastasis of gastric cancer. Imaging J Integr Tradit
West Med. 13:90–92. 2015.
|
|
3
|
Maquat LE, Chilcote R and Ryan PM: Human
triosephosphate isomerase cDNA and protein structure. Studies of
triosephosphate isomerase deficiency in man. J Biol Chem.
260:3748–3753. 1985.PubMed/NCBI
|
|
4
|
Qi YJ, He QY, Ma YF, Du YW, Liu GC, Li YJ,
Tsao GS, Ngai SM and Chiu JF: Proteomic identification of malignant
transformation-related proteins in esophageal squamous cell
carcinoma. J Cell Biochem. 104:1625–1635. 2008. View Article : Google Scholar : PubMed/NCBI
|
|
5
|
Kim JE, Koo KH, Kim YH, Sohn J and Park
YG: Identification of potential lung cancer biomarkers using an in
vitro carcinogenesis model. Exp Mol Med. 40:709–720. 2008.
View Article : Google Scholar : PubMed/NCBI
|
|
6
|
Chen WZ, Pang B, Yang B, Zhou JG and Sun
YH: Differential proteome analysis of conditioned medium of BPH-1
and LNCaP cells. Chin Med J (Engl). 124:3806–3809. 2011.PubMed/NCBI
|
|
7
|
Linge A, Kennedy S, OFlynn D, Beatty S,
Moriarty P, Henry M, Clynes M, Larkin A and Meleady P: Differential
expression of fourteen proteins between uveal melanoma from
patients who subsequently developed distant metastases versus those
who did Not. Invest Ophthalmol Vis Sci. 53:4634–4643. 2012.
View Article : Google Scholar : PubMed/NCBI
|
|
8
|
Zhang ZQ, Li XJ, Liu GT, Xia Y, Zhang XY
and Wen H: Identification of Annexin A1 protein expression in human
gastric adenocarcinoma using proteomics and tissue microarray.
World J Gastroenterol. 19:7795–7803. 2013. View Article : Google Scholar : PubMed/NCBI
|
|
9
|
Lin Z, Zhang X, Liu Z, Liu Q, Wang L, Lu
Y, Liu Y, Wang M, Yang M, Jin X, et al: The distinct expression
patterns of claudin-2, −6, and −11 between human gastric neoplasms
and adjacent non-neoplastic tissues. Diagn Pathol. 8:1332013.
View Article : Google Scholar : PubMed/NCBI
|
|
10
|
Wang DG, Chen G, Wen XY, Wang D, Cheng ZH
and Sun SQ: Identification of biomarkers for diagnosis of gastric
cancer by bioinformatics. Asian Pac J Cancer Prev. 16:1361–1365.
2015. View Article : Google Scholar : PubMed/NCBI
|
|
11
|
Mikuriya K, Kuramitsu Y, Ryozawa S,
Fujimoto M, Mori S, Oka M, Hamano K, Okita K, Sakaida I and
Nakamura K: Expression of glycolytic enzymes is increased in
pancreatic cancerous tissues as evidenced by proteomic profiling by
two-dimensional electrophoresis and liquid chromatography-mass
spectrometry/mass spectrometry. Int J Oncol. 30:849–855.
2007.PubMed/NCBI
|
|
12
|
Roth U, Razawi H, Hommer J, Engelmann K,
Schwientek T, Müller S, Baldus SE, Patsos G, Corfield AP, Paraskeva
C, et al: Differential expression proteomics of human colorectal
cancer based on a syngeneic cellular model for the progression of
adenoma to carcinoma. Proteomics. 10:194–202. 2010. View Article : Google Scholar : PubMed/NCBI
|
|
13
|
Lew C Ritterson and Tolan DR: Targeting of
several glycolytic enzymes using RNA interference reveals aldolase
affects cancer cell proliferation through a non-glycolytic
mechanism. J Biol Chem. 287:42554–42563. 2012. View Article : Google Scholar : PubMed/NCBI
|
|
14
|
Thongwatchara P, Promwikorn W, Srisomsap
C, Chokchaichamnankit D, Boonyaphiphat P and Thongsuksai P:
Differential protein expression in primary breast cancer and
matched axillary node metastasis. Oncol Rep. 26:185–191.
2011.PubMed/NCBI
|
|
15
|
Wang JW, Peng SY, Li JT, Wang Y, Zhang ZP,
Cheng Y, Cheng DQ, Weng WH, Wu XS, Fei XZ, et al: Identification of
metastasis-associated proteins involved in gallbladder carcinoma
metastasis by proteomic analysis and functional exploration of
chloride intracellular channel 1. Cancer Lett. 281:71–81. 2009.
View Article : Google Scholar : PubMed/NCBI
|
|
16
|
Katayama M, Nakano H, Ishiuchi A, Wu W,
Oshima R, Sakurai J, Nishikawa H, Yamaguchi S and Otsubo T: Protein
pattern difference in the colon cancer cell lines examined by
two-dimensional differential in-gel electrophoresis and mass
spectrometry. Surg Today. 36:1085–1093. 2006. View Article : Google Scholar : PubMed/NCBI
|
|
17
|
Vander Heiden MG, Cantley LC and Thompson
CB: Understanding the Warburg effect: The metabolic requirements of
cell proliferation. Science. 324:1029–1033. 2009. View Article : Google Scholar : PubMed/NCBI
|
|
18
|
Shi JG: WRA: Whether the Warburg effect is
the reason, result and the treatment of opportunity for cancer?
Moden Oncol. 6:1459–1461. 2014.
|
|
19
|
Wei H, Guo L, Li L, Zhou Q and Wu Z:
Mechanism of Warburg effect and its effect on tumor metastasis.
Zhongguo Fei Ai Za Zhi. 18:179–183. 2015.(In Chinese). PubMed/NCBI
|
|
20
|
Zhang N and Pati D: Sororin is a master
regulator of sister chromatid cohesion and separation. Cell Cycle.
11:2073–2083. 2012. View
Article : Google Scholar : PubMed/NCBI
|
|
21
|
Chang IW, Lin VC, He HL, Hsu CT, Li CC, Wu
WJ, Huang CN, Wu TF and Li CF: CDCA5 overexpression is an indicator
of poor prognosis in patients with urothelial carcinomas of the
upper urinary tract and urinary bladder. Am J Transl Res.
7:710–722. 2015.PubMed/NCBI
|
|
22
|
Nguyen MH, Koinuma J, Ueda K, Ito T,
Tsuchiya E, Nakamura Y and Daigo Y: Phosphorylation and activation
of cell division cycle associated 5 by mitogen-activated protein
kinase play a crucial role in human lung carcinogenesis. Cancer
Res. 70:5337–5347. 2010. View Article : Google Scholar : PubMed/NCBI
|
|
23
|
Tokuzen N, Nakashiro K, Tanaka H, Iwamoto
K and Hamakawa H: Therapeutic potential of targeting cell division
cycle associated 5 for oral squamous cell carcinoma. Oncotarget.
7:2343–2353. 2016. View Article : Google Scholar : PubMed/NCBI
|