Introduction
Colorectal cancer (CRC) is one of the leading causes
of cancer-related deaths in Taiwan and worldwide (Health Promotion
Administration, the Ministry of Health and Welfare, Taiwan:
http://www.hpa.gov.tw/English/Index.aspx; Center for
Disease Control and Prevention, USA: http://www.cdc.gov/cancer/colorectal/). Due to the
invasive property, CRC may cause direct tissue invasion, regional
lymph node involvement or distant organ metastasis, which
culminates in incurable or life-threatening disease (1). With regard to the regulation of CRC
invasiveness, most studies have focused on oncogenes or
tumor-suppressor genes. However, the role of mitochondria in CRC
remains unclear (2,3).
In the early 20th century, Dr Warburg described that
human cancers display an avid glucose uptake with profound lactate
production even under a sufficient oxygen supply (4). He proposed that respiratory enzymes
are impaired or suppressed in human cancers. Such a phenomenon was
termed the Warburg effect, and the enhanced glycolysis was supposed
to compensate for the ‘defective or suppressed mitochondria’ to
produce a sufficient amount of ATP (5,6).
Mitochondria are the major organelles responsible
for ATP production through the Krebs cycle and electron transport
chain (ETC) that consists of respiratory enzyme complexes I, II,
III, IV and V (7). Mitochondria
have their own mtDNA copies packed in the nucleoid. In contrast to
one set of nuclear DNA (nDNA) in the nucleus, there are several
nucleoids distributed in the cytoplasmic mitochondria. The nucleoid
is an efficient and constitutional unit of the mitochondrial
network (8,9). Except that 4 polypeptides of complex
II are all encoded by nDNA, ~90 polypeptides constituting the
respiratory enzyme complexes I, III, IV and V are encoded by the
nDNA and mtDNA cooperatively (10).
As a result, delicate regulation of mtDNA plays a pivotal role in
the maintenance of mitochondrial biogenesis. Mitochondrial
biogenesis or mitochondrial function is correlated positively with
the amount of mtDNA, and a higher mtDNA copy number indicates
higher mitochondrial function (11). Several DNA-binding proteins are
involved in the replication or transcription of mtDNA, and the
mitochondrial transcriptional factor A (TFAM) is the unique one
that regulates mtDNA replication and transcription in the nucleoid
(12,13).
During the past 20 years, alterations in mtDNA and
mitochondrial function have been evaluated in many human cancers
(2,14,15).
Various studies have demonstrated an increase in mitochondrial
function or mtDNA copy number during carcinogenesis or progression
of human cancers, including skin (16,17),
head and neck (18), breast
(19,20) and esophageal cancer (21,22).
On the contrary, other studies have shown suppressed or impaired
mitochondrial function with amplified glycolysis or a decrease in
mtDNA copy number during carcinogenesis or progression of cancers
(23), which include lung (24,25),
renal (26,27), gastric (28) and hepatic cancer (29,30).
Since TFAM plays a key role in the regulation of mitochondrial
biogenesis, its involvement in human cancers has been appraised in
endometrial, prostate and bladder cancer (31–33).
By means of TFAM knockdown to suppress mitochondrial function, we
demonstrated a decrease in the invasive activity in an esophageal
squamous cell carcinoma cell line, but an increase in invasive
activity in a renal cell carcinoma cell line (22,27).
In light of these findings, the role of mitochondria in human
cancers deserves further study.
Likewise, the role of mitochondrial function in
human CRCs has remained speculative and an appraisal of the role of
mitochondrial function in human CRCs is clinically relevant. In the
present study, we investigated the effects of the suppression of
mitochondrial function, either induced by oligomycin A (OA)
treatment or by TFAM knockdown, on the invasiveness of CRC cell
lines (34). The alterations in
mtDNA copy number, metabolic profiles, intracellular ROS levels and
expression of EMT markers were also examined. However, we analyzed
the mtDNA copy numbers in 33 pairs of specimens from CRC patients.
We believe that the findings of the present study may help us to
better understand the pathophysiology of human CRC from the
viewpoint of mitochondrial biology.
Materials and methods
CRC cell lines, cell viability and
caspase 3 activity
Paired CRC cell lines, the primary SW480 (Amerian
Type Culture Collection, ATCC, Manassas, VA, USA; CCL-228) and
metastatic SW620 (ATCC, CCL-227), were used in the present study.
They were established from the same CRC patient at different
disease stages, i.e., SW480 from the primary adenocarcinoma at age
of 50, Dukes' type B; and SW620 from the metastatic lymph node at
age of 51 during recurrence, Dukes' type C (34,35).
According to the gene analysis, their alterations were mainly those
involved in the regulation of transcription, cell cycle control and
division, cell signaling and cell adhesion as well as cell
metabolism (36). As a result, they
are suitable for evaluation of the role of mitochondrial function
in CRC invasion.
The culture medium was composed of Roswell Park
Memorial Institute-1640 (RPMI-1640) with 10% fetal bovine serum
(FBS), 2 g/l NaHCO3 and antibiotics including 100 U/ml
penicillin G, 100 µg/ml streptomycin sulfate and 0.25 µg/ml
amphotericin B (37).
OA, an inhibitor of respiratory enzyme complex V,
was purchased from Merck Inc. (Darmstadt, Germany) to suppress
mitochondrial function in the present study. The optimal
concentration and duration of OA treatment (10 and 20 µg/ml for 24
or 48 h) were titrated and modified according to the assays for
cell viability and caspase 3 activity as previously reported
(38–40).
A total of 5,000 SW620 cells suspended in 100 µl of
growth medium were seeded on a 96-well plastic reader plate
(Corning Glass Works, Corning, NY, USA) for 24 h to achieve the
steady state. The culture medium was then changed to new ones with
and without addition of OA (10 and 20 µg/ml) for 24 and 48 h,
respectively. After incubation for 24 or 48 h at 37°C, an
additional 200 µl of 1X AlamarBlue™ reagent (Invitrogen) was added
to the cells and further incubated for 1.5 h. The fluorescence
intensity was measured by the Victor2™ 1420 Multilabel Counter
(Perkin-Elmer Life Sciences, Waltham, MA, USA) on a reader plate
set at the excitation wavelength of 538 nm and emission wavelength
of 590 nm (22). The cell viability
was calculated by the ratio between the fluorescence intensity of
cells treated with OA to those without OA. Each experiment was
repeated using 3 batches of culture cells (n=3). The data are
presented as mean ± SD.
Caspase 3 activity was assayed by the EnzChek
Caspase-3 Assay kit #2 (Molecular Probes, Eugene, OR, USA)
(41). An aliquot of 50 µl cellular
protein lysate or lysis buffer (as blank control) was mixed with 50
µl of substrate working buffer (20 mM PIPES, 4 mM EDTA, 0.2% CHAPS,
10 mM dithiothreitol and 50 µM Z-DEVD-R110 substrate, pH 7.4) at
room temperature for 30 min. Due to the recognition of the specific
amino acid sequence Asp-Glu-Val-Asp (DEVD) by caspase 3, the
linkage between DEVD and fluorescent Rhodamine 110 (R110) was
broken to emit fluorescence. The excitation wavelength was set at
485 nm, and the intensity of the emitted fluorescence at 510 nm was
recorded by the Victor2™ 1420 Multilabel Counter on a reader plate.
In this experiment, 100 nM staurosporinex (STS) was added to the
cells and incubated for 6 h prior to protein purification to induce
apoptosis as the positive control. The fluorescence intensity was
normalized by the protein concentration in each group to assess the
relative caspase 3 activity. The relative caspase 3 activity of
SW620 cell without treatment with OA was defined as 100%. Each
experiment was repeated using 3 batches of culture cells (n=3).
Data are presented as mean ± SD.
Transfection for TFAM knockdown
Two small hairpin RNA (shRNA) oligonucleotides,
constructed into pLKO.1 DNA backbone, respectively, were supplied
by the National RNAi Core Facility of Academia Sinica in Taiwan
(http://rnai.genmed.sinica.edu.tw/index.asp). They were
named as vector-#4 and -#5, and were used to knock down TFAM
expression (22,27). The oligonucleotide sequences against
TFAM mRNA of vector-#4 and -#5 were: 5′-CGTTTATGTAGCTGAAAGATT-3′
and 5′-GCAGATTTAAAGAACAGCTAA-3′, respectively; the oligonucleotide
5′-CAAATCACAGAATCGTCGTAT-3′, specific to the gene coding for
luciferase (Luc), was constructed as the control vector. With the
facilitation of Lipofectamine 2000, 4 µg of vector DNA was
transfected into the SW620 cells (106 cells in a 6-well
plate) (42). The culture medium
containing 1 µg/ml puromycin (lethal dose for SW620) was used for
clone selection. The SW620 cells harboring the control vector,
knockdown vector-#4 and -#5 were named SW620-Control, SW620-KD#4
and SW620-KD#5, respectively.
Oxygen consumption rate and
respiratory control ratio
The cellular oxygen consumption rate (OCR,
nmol/min/106 cells) was measured by a 782 Oxygen Meter
(Strathkelvin Instruments, Scotland, UK) at 37°C under a
circulating water system (22,43).
During the steady state (106 cells in the assay
mixture), digitonin was added at a final concentration of 0.0006%
to pierce the plasma membrane and enable direct exposure of the
respiratory enzyme complexes to the substrates and inhibitors.
Succinate and ADP were added sequentially to final concentrations
of 10 and 1 mM, to measure the OCR-Succinate and OCR-ADP values,
respectively. The respiratory control ratio (RCR) was defined and
calculated as the ratio between OCR-ADP to OCR-Succinate to assess
the integrity of the structure and function of mitochondria
(44,45). Each experiment was repeated using
three batches of cultured cells (n=3).
Total intracellular ATP content
The intracellular ATP content (fmol/cell) was
measured using the ATP Bioluminescent Somatic Cell Assay kit
(Sigma-Aldrich) (22). Under steady
state, cells were trypsinized, re-suspended and mixed with Somatic
Cell Releasing Reagent, and then transferred to a black
OptiPlate-96F 96-well reader plate (Packard Biosciences,
Perkin-Elmer) containing the ATP assay mixture. The luminescence
intensity was measured using the Victor2™ 1420 Multilabel Counter
and was normalized by the cell number. Each experiment was repeated
using three batches of cultured cells (n=3).
Lactate production rate
Under steady state, cells were washed with
phosphate-buffered saline (PBS) and added to fresh growth medium in
an incubator at 37°C for 4 h. An aliquot of 10 µl medium was then
transferred to a 96-well plate and mixed with the Lactate Reagent
(Trinity Biotech Plc., Bray, Ireland). The absorbance at 540 nm was
measured on an ELISA reader (BioTek PowerWaveX 340; Boston
Laboratory Equipment, Boston, MA, USA) and was normalized by the
cell number to calculate the lactate production rate
(ng/h/104 cells) (22,43).
Each experiment was repeated using three batches of cultured cells
(n=3).
Transwell migration and invasion
assays
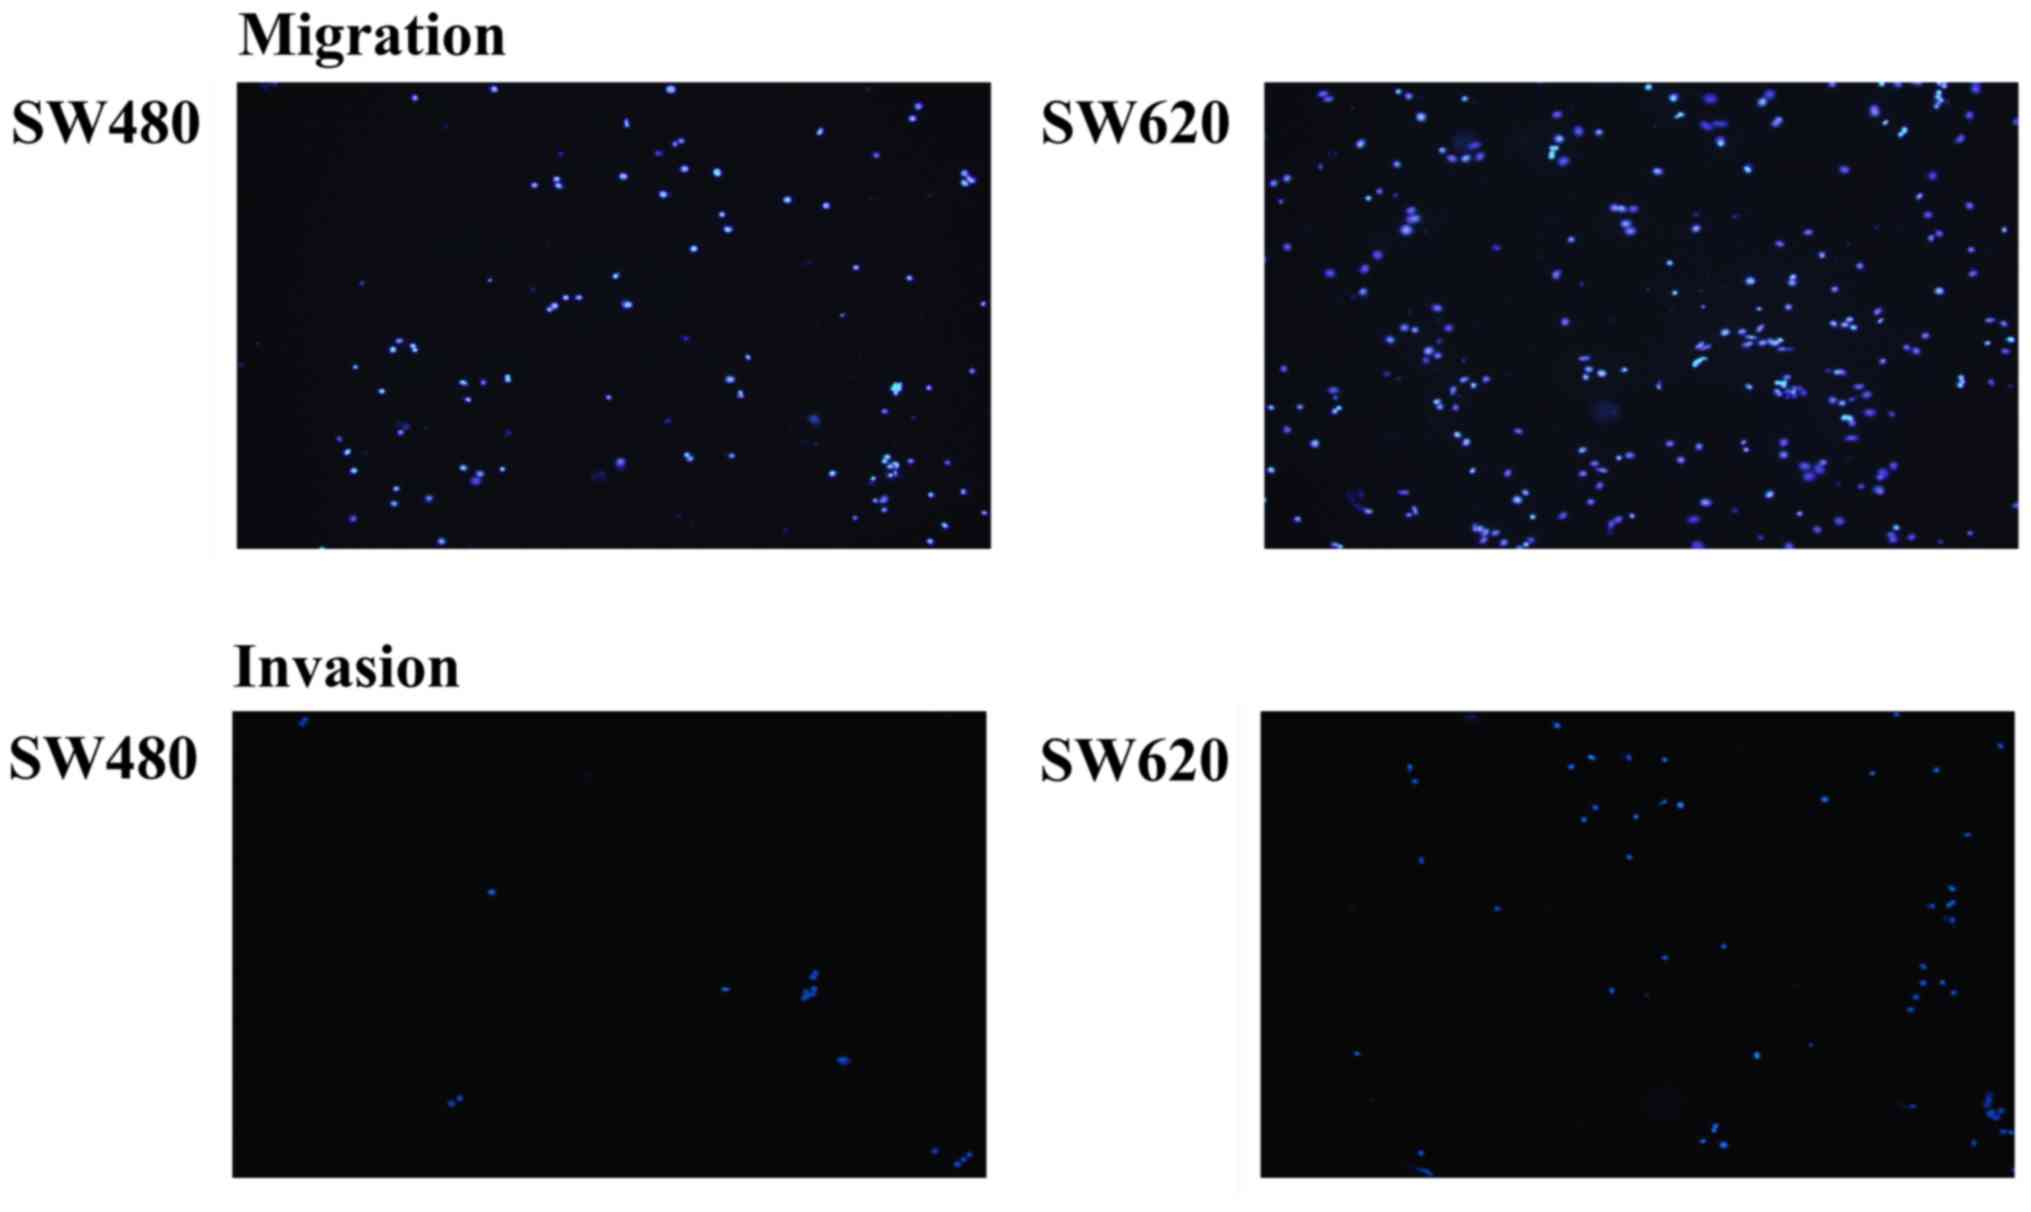
Transwell migration or invasion activity was assayed
using Millicell hanging cell culture inserts harboring 8-µm pores
(Millipore, Bedford, MA, USA) coated with or without Matrigel
placed into a 24-well plate (22,27).
Growth medium (400 µl) containing RPMI-1640 plus 10% FBS was added
to the 24-well plate, and 5×10⁴ cells suspended in 150
µl of growth medium containing RPMI-1640 plus 1% FBS were seeded in
the insert. After incubation for 24 h, cells were removed from the
upper surface of the membranes of the insert with a cotton swab.
Cells that migrated or invaded to the lower surface were fixed with
methanol for 20 min and stained with Hoechst 33342 (1 µg/ml;
Sigma-Aldrich). Three random areas under a light microscope
(magnification, ×40) were selected to count the migrated/invaded
cells and to obtain the average cell number (cells/field) (22,27).
Each experiment was repeated using three batches of cultured cells
(n=3).
Intracellular ROS levels
The intracellular level of
H2O2 was determined as previously described
(46). Approximately
3×10⁶ cells were seeded in a 6-cm dish, and 2 ml of
medium containing 2′-7′-dichlorofluorescin diacetate (DCFH-DA; 40
µM) was added and incubated at 37°C for 20 min. After
trypsinization, cells were subjected to analysis on a flow
cytometer (Model EPICS XL-MCL, Beckman-Coulter, Miami, FL, USA).
The excitation wavelength was set at 488 nm, and the intensity of
emitted fluorescence of 10,000 cells at 525 nm was recorded. The
data were analyzed by EXPO32 software (Beckman-Coulter). Each
experiment was repeated using three batches of cultured cells
(n=3).
The intracellular levels of O2-• were
also determined as previously described (46). Approximately 3×10⁶ cells
were seeded in a 6-cm dish, and 2 ml of medium containing
hydroethidine (HE; 5 µM) was added and incubated at 37°C for 20
min. After trypsinization, cells were subjected to analysis on a
flow cytometer (Model EPICS XL-MCL). The excitation wavelength was
set at 488 nm and the intensity of emitted fluorescence of 10,000
cells at 580 nm was recorded. The data were analyzed using EXPO32
software. Each experiment was repeated using three batches of
cultured cells (n=3).
Preparation of cellular DNA, RNA and
proteins
Extraction of cellular DNA and RNA and its
reverse-transcription to cDNA as well as protein purification were
performed as previously described (27,47,48).
Collection of clinical samples and DNA
extraction
A total of 33 CRC patients who had received surgical
resection at Taipei Hospital, Ministry of Health and Welfare (New
Taipei City, Taiwan) were retrospectively collected and their
pathological slides were reviewed by an experienced pathologist.
Representative tumor foci without tumor necrosis and without
lymphocyte infiltration were identified, and thin slices ~5-µm in
thickness from paraffin-embedded tissue blocks were prepared for
DNA extraction. Simultaneously, the paired non-cancerous regions
were also collected as control. After de-waxing and re-hydration
processes, tissue samples were mixed with 500 µl of the DNA
extraction solution (QuickExtract; Epicenter, Madison, WI, USA) to
extract total cellular DNA at 65°C for 3 h as previously described
(20,21). The DNA samples were kept at −20°C
until use.
Determination of relative mtDNA copy
number and mRNA expression levels
Quantitative polymerase chain reaction (qPCR) using
SYBR-Green I (Roche Applied Science, Penzberg, Germany) was
employed to determine the threshold cycle (Ct) for the calculation
of relative mtDNA copy number and relative mRNA expression levels
of specific genes by the 2−ΔΔCt method (47–49).
The mtDNA copy number is defined as the total copies of
tRNALeu (UUR) (mtDNA) relative to the total copies of
18S rRNA (nDNA). The mRNA expression level was defined as the total
cDNA copies of the gene of interest relative to the total cDNA
copies of 18S rRNA.
For analysis of the cellular mtDNA copy number or
target gene mRNA expression level in the SW620 and SW480 cells, the
value of SW480 was taken as 1.00. Each experiment was repeated
using three batches of cultured cells (n=3). For analysis of
clinical samples, the 143B cell DNA (1 ng/µl) was loaded as a
control in each run of qPCR and the mtDNA copy number of 143B cells
was adjusted as 1.00. Furthermore, we defined mtDNA copy ratio as
the mtDNA copy number of the tumor part divided by the mtDNA of the
non-tumor part for each CRC patient. The oligonucleotide sequences
of primers are summarized in Table
I (22,27,48).
 | Table I.Summary of the analyzed target genes
and sequences of the primers used to amplify the indicated
genes. |
Table I.
Summary of the analyzed target genes
and sequences of the primers used to amplify the indicated
genes.
|
| Forward primer
sequence | Reverse primer
sequence |
|---|
| DNA |
|
|
|
mtDNAa |
CACCCAAGAACAGGGTTTGT |
TGGCCATGGGTATGTTGTTAA |
|
nDNAb |
TAGAGGGACAAGTGGCGTTC |
CGCTGAGCCAGTCAGTGT |
| Messenger RNA
(mRNA) |
|
|
|
Reference gene |
|
|
|
β-actin |
CCAACCGTGAAAAGATGACC |
ACCAGAGGCATACAGGGACA |
| Target
genes |
|
|
|
PGC-1α |
TGAGAGGGCCAAGCAAAG |
ATAAATCACACGGCGCTCTT |
|
TFAM |
CAACTACCCATATTTAAAGCTCAGAA |
GAATCAGGAAGTTCCCTCCA |
|
HK-II |
CCCTGCCACCAGACTAAACT |
TGGACTTGAATCCCTTGGTC |
|
GPI |
GGAAGGGTCTGCATCACAAG |
CCTCATCAGGGCCTCTGTC |
|
PFK |
AGGAGGGGAAGGGCATCT |
TTCCTATCAAATGGGGTTGG |
|
LDH |
GCAGATTTGGCAGAGAGTATAATG |
GACATCATCCTTTATTCCGTAAAGAC |
Determination of relative protein
expression levels
The relative protein expression levels of the genes
of interest were determined using western blotting. An aliquot of
50 µg of total cellular proteins was separated on a 10% sodium
dodecyl sulfate-polyacrylamide gel electrophoresis (SDS-PAGE), and
then blotted onto a piece of BioTrace™ polyvinylidene difluoride
(PVDF) membrane (Pall Corporation, Pensacola, FL, USA).
Non-specific bindings were blocked with 5% skimmed milk in a
Tris-buffered saline Tween-20 (TBST) buffer (50 mM Tris-HCl, 150 mM
NaCl and 0.1% Tween-20, pH 7.4). The membrane was subjected to
specific primary antibodies against target proteins, as listed in
Table II, and was incubated for 16
h at 4°C (22,50). β-actin was used as the internal
control. The membrane was then incubated with a horseradish
peroxidase (HRP)-conjugated secondary antibody for 1 h at room
temperature, the protein band was visualized on X-ray film
(Fujifilm, Tokyo, Japan) using enhanced chemiluminescence (ECL)
reagents (GE Healthcare, Chalfont, UK). The band density was
scanned by a densitometer to calculate the relative protein
expression levels. Each experiment was repeated using three batches
of cultured cells (n=3).
| Table II.Summary of the primary antibodies and
their dilution titers and suppliers used in the present study. |
Table II.
Summary of the primary antibodies and
their dilution titers and suppliers used in the present study.
| Primary
antibody |
| Titer | Supplier |
|---|
| ND6 | (Subunit of complex
I, mtDNA encoded) | 1:1,000 | Molecular Probes,
Eugene, OR, USA |
| NDUFA9 | (Subunit of complex
I, nDNA encoded) | 1:1,000 | Molecular Probes,
Eugene, OR, USA |
| SDHA | (Subunit of complex
II, nDNA encoded) | 1:1,000 | Molecular Probes,
Eugene, OR, USA |
| SDHB | (Subunit of complex
II, nDNA encoded) | 1:2,000 | Molecular Probes,
Eugene, OR, USA |
| UQCRC1 | (Subunit of complex
III, nDNA encoded) | 1:2,000 | Molecular Probes,
Eugene, OR, USA |
| UQCRC2 | (Subunit of complex
III, nDNA encoded) | 1:2,000 | Molecular Probes,
Eugene, OR, USA |
| COX-II | (Subunit of complex
IV, mtDNA encoded) | 1:1,000 | Molecular Probes,
Eugene, OR, USA |
| COX-IV | (Subunit of complex
IV, nDNA encoded) | 1:1,000 | Molecular Probes,
Eugene, OR, USA |
| GPI |
| 1:1,000 | Santa Cruz
Biotechnology, Santa Cruz, CA, USA |
| LDH |
| 1:5,000 | Santa Cruz
Biotechnology, Santa Cruz, CA, USA |
| PDH |
| 1:1,000 | Santa Cruz
Biotechnology, Santa Cruz, CA, USA |
| HK-II |
| 1:1,000 | Merck Millipore,
Darmstadt, Germany |
| E-cadherin |
| 1:1,000 | Cell Signaling,
Danvers, MA, USA |
| N-cadherin |
| 1:1,000 | BD
(Becton-Dickinson and Company, Franklin Lakes, NJ, USA) |
| Vimentin |
| 1:1,000 | Sigma-Aldrich, St.
Louis, MO, USA |
| Snail |
| 1:1,000 | Abcam, Cambridge,
MA, USA |
| TFAM |
| 1:1,000 | Santa Cruz
Biotechnology, Santa Cruz, CA, USA |
| β-actin |
| 1:10,000 | Merck Millipore,
Darmstadt, Germany |
Statistical analysis
The continuous variables between two or among three
or more independent groups were analyzed using Student's t-test or
Mann-Whitey U test (two groups)/or the one-way analysis of variance
(ANOVA) or Kruskal-Wallis H test (three or more groups) when
appropriate. Significant difference was considered at a P-value
<0.05.
Results
Difference in metabolic profiles, ROS
levels and invasive activity between SW480 and SW620 CRC cell
lines
The metastatic SW620 cells exhibited a higher
percentage of fibroblast-like morphology than did primary SW480
cells under light microscopy (Fig.
1). Regarding the metabolic profiles of mitochondria (Fig. 1 and Table III), SW620 cells had a higher
mtDNA copy number (2.05±0.57 vs. 1.00±0.00, P=0.006), higher
ADP-stimulated OCR (3.41±0.02 vs. 2.94±0.09, P=0.020) and higher
respiratory control ratio (RCR, 1.90±0.03 vs. 1.57±0.06; P=0.018)
of succinate-supported respiration rate than did SW480 cells. SW620
cells had higher mRNA and protein expression levels of
mitochondrial biogenesis-related proteins including the mRNAs for
peroxisome proliferator-activated receptor γ coactivator 1-α
(PGC-1α, 6.90±0.71 vs. 1.00±0.00, P=0.007) and TFAM (2.58±0.20 vs.
1.00±0.00, P<0.001) (Table
III), and proteins for TFAM (4.01±0.48 vs. 1.00±0.00,
P<0.001) and pyruvate dehydrogenase (PDH) (1.56±0.11 vs.
1.00±0.00, P=0.001) (Fig. 1) than
did SW480 cells. SW620 cells also expressed higher protein levels
of mitochondrial respiratory enzyme complexes including
mtDNA-encoded NADH dehydrogenase subunit 6 (ND6, subunit of complex
I, 1.63±0.13 vs. 1.00±0.00, P=0.001) and cytochrome c
oxidase subunit II (COX-II, subunit of complex IV, 1.75±0.07 vs.
1.00±0.00, P=0.004) (Fig. 1), and
nDNA-encoded NADH ubiquinone oxidoreductase subunit A9 (NDUFA9;
subunit of complex I, 1.60±0.24 vs. 1.00±0.00, P=0.013),
iron-sulfur protein subunit B of succinate dehydrogenase (SDHB,
subunit of complex II, 2.55±0.67 vs. 1.00±0.00, P=0.016),
ubiquinol-cytochrome c reductase core protein I (UQCRC1,
subunit of complex III, 1.66±0.35 vs. 1.00±0.00, P=0.032) and
UQCRC2 (subunit of complex III, 2.01±0.44 vs. 1.00±0.00, P=0.084)
and cytochrome c oxidase subunit IV (COX-IV, subunit of
complex IV, 1.86±0.23 vs. 1.00±0.00, P=0.033) (Fig. 1) when compared with the SW480
cells.
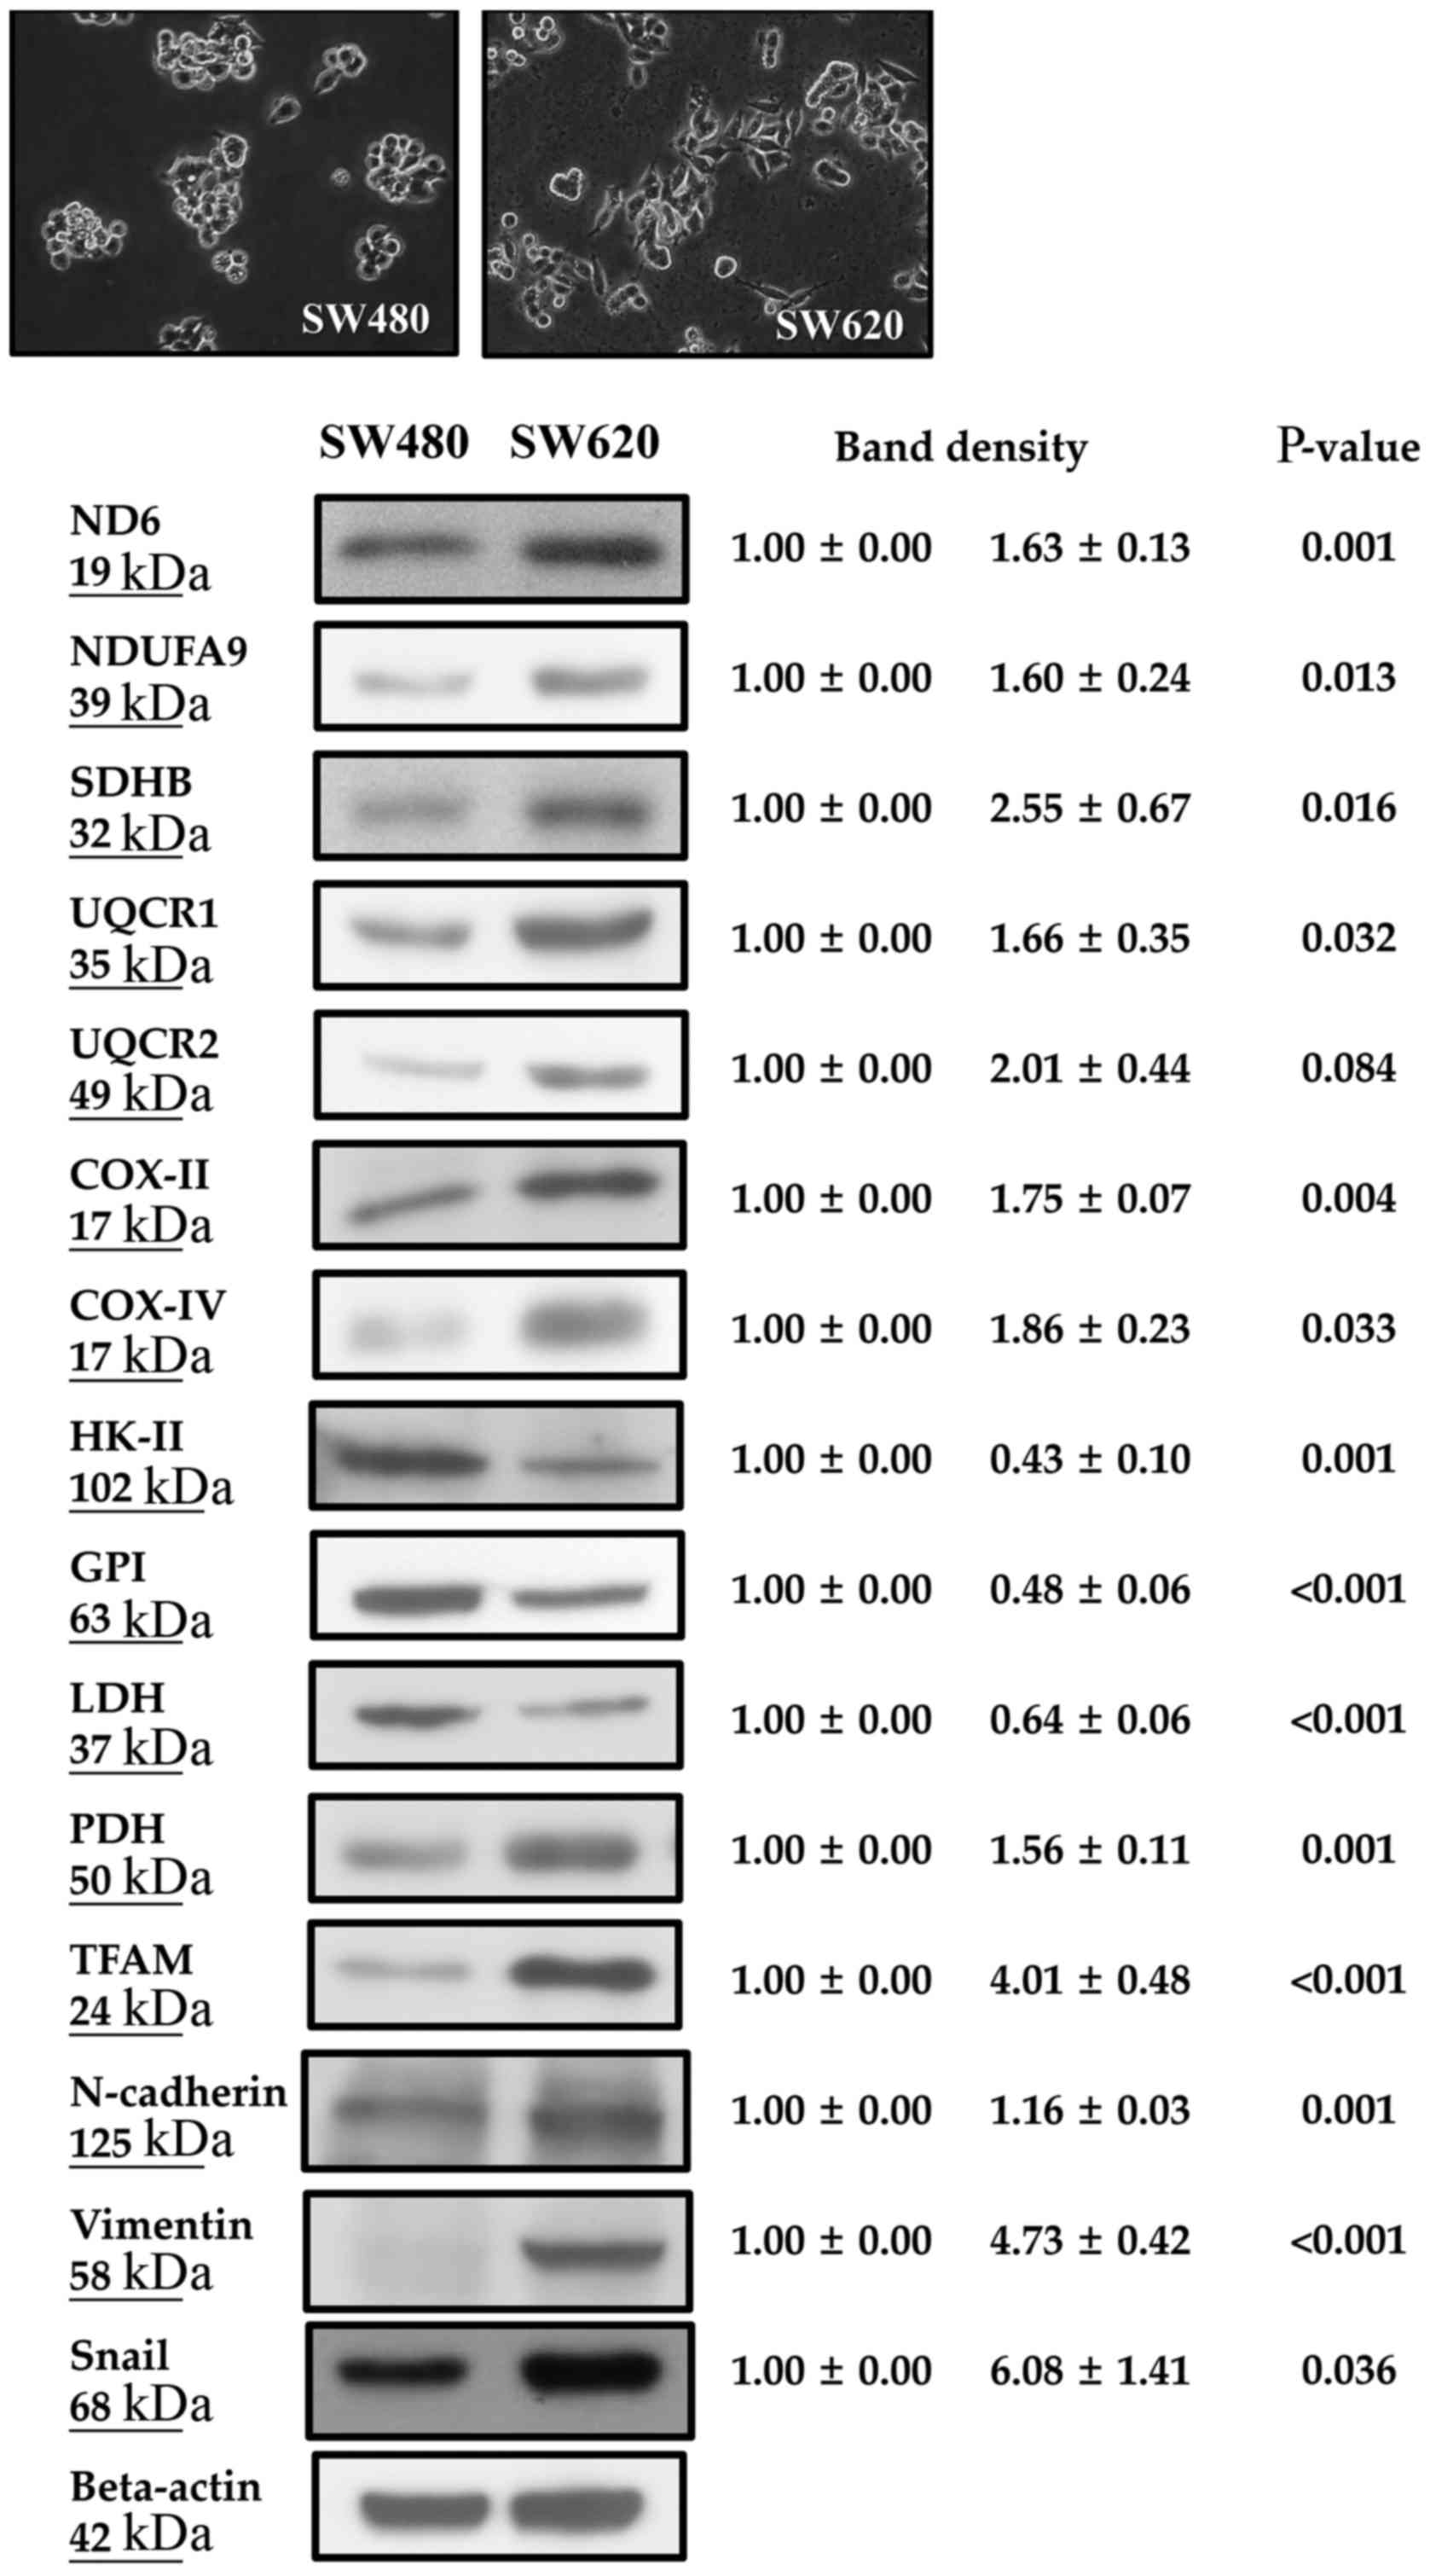 | Figure 1.SW620 cells expressed a higher
percentage of fibroblast-like morphology, higher levels of
mitochondrial biogenesis-related proteins (ND6, NDUFA9, SDHB,
UQCR1/2, COX-II/IV, PDH and TFAM), higher levels of EMT markers
(N-cadherin, vimentin and Snail), but lower expression levels of
glycolysis-related enzymes (HK-II, GPI and LDH) than SW480 cells.
ND6, NADH dehydrogenase subunit 6; NDUFA9, NADH ubiquinone
oxidoreductase subunit A9; SDHB, iron-sulfur protein subunit B of
succinate dehydrogenase; UQCRC1/2, ubiquinol-cytochrome c
reductase core protein I/II; COX-II, cytochrome c oxidase
subunit II; COX-IV, cytochrome c oxidase subunit IV; PDH,
pyruvate dehydrogenase; TFAM, mitochondrial transcriptional factor
A; HK-II, hexokinase II; GPI, glucose 6-phosphate isomerase; LDH,
lactate dehydrogenase. |
| Table III.Differences in metabolic profiles,
ROS intensity and migration/invasion activities between primary
SW480 and metastatic SW620 CRC cell lines. |
Table III.
Differences in metabolic profiles,
ROS intensity and migration/invasion activities between primary
SW480 and metastatic SW620 CRC cell lines.
|
| Cell line |
|
|---|
|
|
|
|
|---|
|
Parameters/variables | SW480 | SW620 |
P-valuea |
|---|
| mtDNA copy
number | 1.00±0.00 | 2.05±0.57 | 0.006 |
| Oxygen consumption
rate (OCR) (nmol/min/106 cells) |
|
|
|
|
Respiratory substrate |
|
|
|
|
Succinate-supported | 1.87±0.12 | 1.80±0.03 | 0.508 |
|
ADP-stimulated | 2.94±0.09 | 3.41±0.02 | 0.020 |
|
Respiratory
control ratio (RCR) | 1.57±0.06 | 1.90±0.03 | 0.018 |
| Lactate production
rate (ng/h/104 cells) | 204.7±13.1 | 141.3±8.5 | 0.002 |
| Total intracellular
ATP (fmol/cell) mRNA expression level | 4.82±0.18 | 4.71±0.12 | 0.827 |
|
Mitochondrial
biogenesis-related proteins |
|
|
|
|
PGC-1α | 1.00±0.00 | 6.90±0.71 | 0.007 |
|
TFAM | 1.00±0.00 | 2.58±0.20 | <0.001 |
|
Glycolytic enzymes |
|
|
|
|
HK-II | 1.00±0.00 | 0.73±0.06 | 0.002 |
|
GPI | 1.00±0.00 | 0.74±0.07 | 0.003 |
|
PFK | 1.00±0.00 | 0.71±0.03 | <0.001 |
|
LDH | 1.00±0.00 | 0.49±0.01 | <0.001 |
|
Relative intracellular ROS
level |
|
|
|
|
Hydrogen peroxide
(H2O2) | 1.00±0.00 | 0.57±0.05 | <0.001 |
|
Transwell assay
(cells/field) |
|
|
|
|
Migration | 93.1±31.1 | 325.6±66.8 | <0.001 |
|
Invasion | 15.8±2.5 | 58.6±4.4 | 0.006 |
Regarding the metabolic profile of glycolysis
(Fig. 1 and Table III), the SW620 cells showed lower
expression levels of glycolytic enzymes, including mRNA levels of
hexokinase II (HK-II, 0.73±0.06 vs. 1.00±0.00, P=0.002), glucose
6-phosphate isomerase (GPI; 0.74±0.07 vs. 1.00±0.00, P=0.003),
phosphofructokinase (PFK; 0.71±0.03 vs. 1.00±0.00, P<0.001) and
lactate dehydrogenase (LDH; 0.49±0.01 vs. 1.00±0.00, P<0.001)
(Table III) as well as protein
levels of HK-II (0.43±0.10 vs. 1.00±0.00, P=0.001), GPI (0.48±0.06
vs. 1.00±0.00, P<0.001) and LDH (0.64±0.06 vs. 1.00±0.00, P=001)
(Fig. 1), and a lower lactate
production rate (141.3±8.5 vs. 204.7±13.1, ng/h/104
cells, P=0.002) (Table III) when
compared with the SW480 cells.
The total intracellular ATP contents of SW620 and
SW480 cells did not differ (4.71±0.12 vs. 4.82±0.18, fmol/cell,
P=0.827, Table III). With regard
to the relative intracellular ROS levels, SW620 cells had a lower
H2O2 level than the level noted in the SW480
cells (0.57±0.05 vs. 1.00±0.00, P=0.006, Table III). The SW620 cells displayed
higher Transwell migration (325.6±66.8 vs. 93.1±31.1, cells/field,
P<0.001) and invasion (58.6±4.4 vs. 15.8±2.5, cells/field,
P=0.006) activities (Table III
and Fig. 2), and higher protein
expression levels of EMT markers N-cadherin (1.16±0.03 vs.
1.00±0.00, P=0.001), vimentin (4.73±0.42 vs. 1.00±0.00, P<0.001)
and Snail (6.08±1.41 vs. 1.00±0.00, P=0.036) (Fig. 1) when compared with these levels
noted in the SW480 cells.
Effects of oligomycin A on cell
viability, caspase 3 activity, metabolic profiles, ROS levels and
invasion activity of SW620 cells
Regarding cell viability (Fig. 3A), there were no obvious differences
between SW620 (as control at 24 and 48 h, 100.0±0.0%) and SW620
cells treated with OA at 10 µg/ml for 24 h (SW620 OA-10 24 h,
95.0±4.1%, P=0.167), between SW620 (100±0.0%) and SW620 cells
treated with OA at 10 µg/ml for 48 h (SW620 OA-10 48 h, 90.1±8.2%,
P=0.172), and between SW620 (100.0±0.0%) and SW620 cells treated
with OA at 20 µg/ml for 24 h (SW620 OA-20 24 h, 80.4±17.4%,
P=0.191). However, SW620 cells (100.0±0.0%) had a significantly
higher cell viability than did SW620 cells treated with OA at 20
µg/ml for 48 h (SW620 OA-20 48 h, 64.7±5.9%, P=0.009). In light of
these findings, we did not perform the comparison for SW620 cells
treated with OA at 20 µg/ml for 48 h.
In the analysis of the caspase 3 activity (Fig. 3B), we found no significant
difference between SW620 (100.0±0.0%) and SW620 treated with OA at
10 µg/ml for 24 h (SW620 OA-10 24 h, 121.7±7.5%, P=0.152), between
SW620 (100.0±0.0%) and SW620 treated with OA at 10 µg/ml for 48 h
(SW620 OA-10 48 h, 131.0±6.2%, P=0.089) and between SW620
(100.0±0.0%) and SW620 cells treated with OA at 20 µg/ml for 24 h
(SW620 OA-20 24 h, 109.4±8.6%, P=0.362). However, these values were
all much lower than those of SW620 cells treated with STS
(343.7±12.5%, P<0.05).
As shown in Table
IV, from SW620 to SW620 cells treated with OA at 5 and 10 µg/ml
for 24 h, there were progressive decreases in ADP-stimulated OCR
(3.41±0.02 vs. 1.20±0.14 vs. 1.09±0.18, P=0.047) and RCR (1.85±0.09
vs. 1.18±0.13 vs. 1.05±0.02, P=0.017) of succinate-supported
respiration and Transwell invasion activity of SW620 cells
(84.6±6.9 vs. 43.9±5.8 vs. 30.5±3.5, P=0.017).
| Table IV.Alterations of ADP-stimulated OCR and
RCR of succinate-supported respiration and Transwell invasion
activity in SW620 cells after treatment of cells with oligomycin
A. |
Table IV.
Alterations of ADP-stimulated OCR and
RCR of succinate-supported respiration and Transwell invasion
activity in SW620 cells after treatment of cells with oligomycin
A.
|
| SW620 | SW620 |
|
|---|
|
|
|
|
|
|---|
|
|
| Oligomycin A
(µg/ml) |
|
|---|
|
|
| 5 | 10 |
|
|---|
|
|
|
|
|
|---|
|
|
| Duration (h) |
|
|---|
|
Parameters/variables |
| 24 | 24 |
P-valuea |
|---|
| Oxygen consumption
rate (OCR) (nmol/min/106 cells) |
|
|
|
|
|
Respiratory substrate |
|
|
|
|
|
Succinate-supported | 1.85±0.11 | 1.02±0.01 | 1.04±0.15 | 0.112 |
|
ADP-stimulated | 3.41±0.02 | 1.20±0.14 | 1.09±0.18 | 0.047 |
|
Respiratory
control ratio (RCR) | 1.85±0.09 | 1.18±0.13 | 1.05±0.02 | 0.017 |
| Transwell assay
(cells/field) |
|
|
|
|
| Invasion | 84.6±6.9 | 43.9±5.8 | 30.5±3.5 | 0.017 |
From SW620 to SW620 cells treated with OA at 10
µg/ml for 24 h and further treatment of SW620 with OA at 10 µg/ml
for 48 h, we found progressive increases in the lactate production
rate (140.6±6.4 vs. 179.5±22.2 vs. 212.1±1.6, P=0.017), and
intracellular levels of H2O2 (0.59±0.01 vs.
0.77±0.03 vs. 0.81±0.07, P=0.047) and O2-• (0.68±0.01
vs. 0.85±0.02 vs. 0.88±0.03, P=0.026) (Table V). No significant differences in the
lactate production rate (206.5±15.8 vs. 212.1±1.6, P=1.000), the
intracellular levels of H2O2 (1.00±0.00 vs.
0.81±0.07, P=0.333) and O2-• (1.00±0.00 vs. 0.88±0.03,
P=0.333) were found between SW480 and SW620 cells after treatment
with OA at 10 µg/ml for 48 h (Table
V).
| Table V.Alterations of lactate production
rate, relative intracellular ROS intensity and Transwell migration
activity in SW620 cells after the treatment of oligomycin A. |
Table V.
Alterations of lactate production
rate, relative intracellular ROS intensity and Transwell migration
activity in SW620 cells after the treatment of oligomycin A.
|
| Cell lines |
|
|
|
|
|---|
|
|
|
|
|
|
|
|---|
|
| SW480 | S620 | SW620 |
|
|
|
|
|---|
|
|
|
|
|
|
|
|---|
|
|
|
| Oligomycin A
(µg/ml) |
|
|
|
|
|---|
|
|
|
| 10 | 10 | 20 |
|
|
|
|
|---|
|
|
|
|
|
|
|
|
|
|---|
|
|
|
|
| Duration (h) |
|
|
|
|
|
|---|
|
Parameters/variables |
|
| 24 | 48 | 24 |
P-valuea |
P-valueb |
P-valuec |
P-valued |
|---|
| Lactate production
rate (ng/h/104 cells) | 206.5±15.8 | 140.6±6.4 | 179.5±22.2 | 212.1±1.6 | 195.8±12.0 | 0.017 | 1.000 | 0.047 | 0.667 |
| Relative
intracellular ROS level |
|
|
|
|
|
|
|
|
|
| Hydrogen peroxide
(H2O2) | 1.00±0.00 | 0.59±0.01 | 0.77±0.03 | 0.81±0.07 | 0.76±0.08 | 0.047 | 0.333 | 0.112 | 0.333 |
| Suproxide
(O2-•) | 1.00±0.00 | 0.68±0.01 | 0.85±0.02 | 0.88±0.03 | 1.05±0.01 | 0.026 | 0.333 | 0.017 | 0.333 |
From SW620 to SW620 cells treated with OA at 10 and
20 µg/ml for 24 h, progressive increases in the lactate production
rate (140.6±6.4 vs. 179.5±22.2 vs. 195.8±12.0, P=0.047) and
intracellular level of the O2-• (0.68±0.01 vs. 0.85±0.02
vs. 1.05±0.01, P=0.017) were noted (Table V). There were no significant
differences in the lactate production rate (206.5±15.8 vs.
195.8±12.0, P=0.667), and intracellular level of O2-•
(1.00±0.00 vs. 1.05±0.01, P=0.333) between SW480 and SW620 cells
treated with OA at 20 µg/ml for 24 h (Table V).
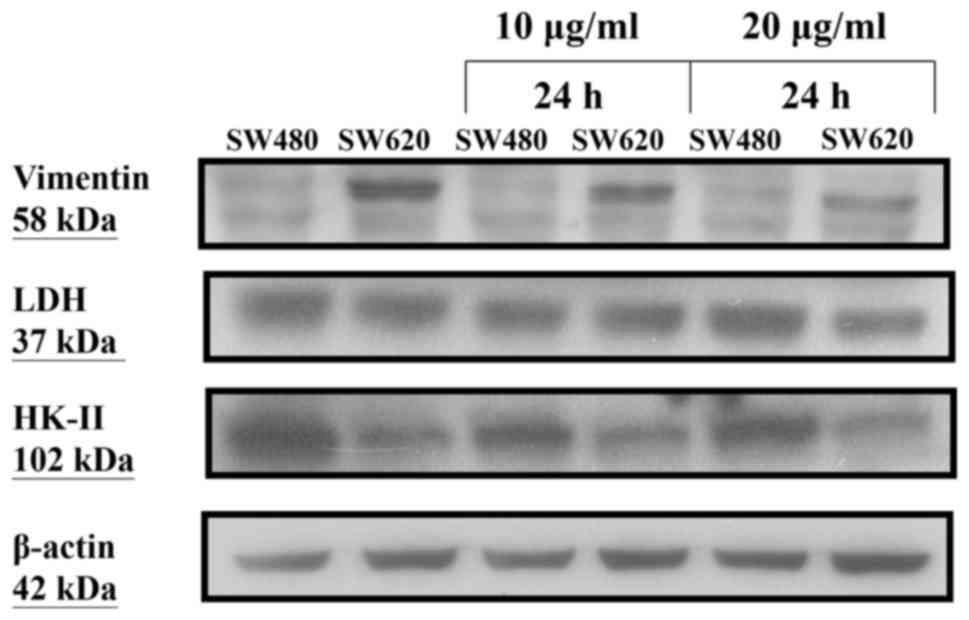
After treatment of SW480 and SW620 cells with OA at
10 and 20 µg/ml for 24 h, respectively, we found no obvious changes
in the protein expression levels of glycolytic enzymes including
HK-II and LDH. However, the protein expression level of vimentin
was decreased in SW620 cells, but unchanged in SW480 cells
(Fig. 4).
Alterations in metabolic profiles, ROS
levels and invasion activity after knockdown of TFAM in SW620
cells
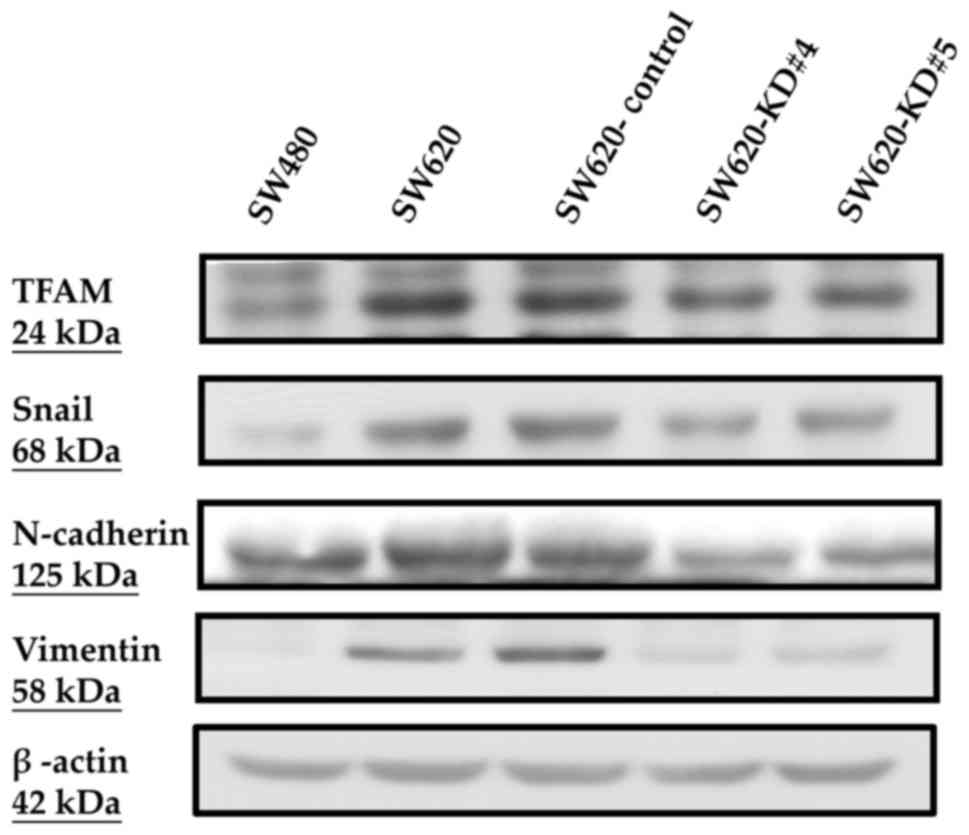
Between the parental SW620 and the SW620-Control
cells, there were no obvious differences in the protein expression
levels of TFAM, Snail, N-cadherin and vimentin (Fig. 5), in mRNA expression levels of TFAM
(2.88±0.05 vs. 2.81±0.02, P=0.122) and mtDNA copy numbers
(2.27±0.13 vs. 2.21±0.13, P=0.669) (Table VI). The consequences of TFAM
knockdown were evaluated and compared between the SW620-Control and
SW620-KD#4 as well as between the SW620-Control and SW620-KD#5
cells, respectively. Compared to the SW620-Control, both SW620-KD#4
and SW620-KD#5 cells had lower protein levels of TFAM, Snail,
N-cadherin and vimentin (Fig. 5), a
lower mRNA level of TFAM (1.81±0.03 vs. 2.81±0.02, P<0.001;
1.62±0.04 vs. 2.81±0.02, P<0.001) and lower mtDNA copy number
(1.40±0.18 vs. 2.21±0.13, P=0.036; 1.00±0.10 vs. 2.21±0.13,
P=0.009) (Table VI). Both
SW620-KD#4 and SW620-KD#5 cells had lower protein expression levels
of mtDNA-encoded ND6 and COX-II, but similar nDNA-encoded SDHA
(Fig. 6), and lower ADP-stimulated
OCR (3.78±0.13 vs. 5.61±0.01, P=0.002; 3.50±0.14 vs. 5.61±0.01,
P=0.002) and RCR (2.02±0.05 vs. 2.67±0.11, P=0.015; 1.96±0.04 vs.
2.67±0.11, P=0.012) values of succinate-supported respiration than
did the SW620-Control cells (Table
VI). In contrast, both SW620-KD#4 and SW620-KD#5 cells had
higher protein level of HK-II (Fig.
6) and higher lactate production rate (130.4±6.1 vs. 103.1±2.7,
P=0.002; 159.4±4.9 vs. 103.1±2.7, P<0.001) (Table VI) than did the SW620-Control
cells. Both SW620-KD#4 and SW620-KD#5 cells had higher
intracellular levels of O2-• (1.65±0.01 vs. 1.00±0.00,
P=0.010; 1.67±0.02 vs. 1.00±0.00, P<0.001) and
H2O2 (1.57±0.10 vs. 1.00±0.00, P=0.036;
1.73±0.10 vs. 1.00±0.00, P=0.024), but had lower Transwell invasion
activity (94.0±6.2 vs. 209.9±33.6, P=0.041; 80.7±4.8 vs.
209.9±33.6, P=0.024) when compared with the SW620-Control (Table VI). However, the protein expression
levels of GPI and LDH in the SW620-KD#4 and SW620-KD#5 cells were
not significantly different from those of the SW620-Control cells
(Fig. 6).
 | Figure 6.A decrease in the expression levels
of mtDNA-encoded proteins ND6 and COX-II without a change in
nDNA-encoded SDHA, no change in glycolysis-related enzymes LDH and
GPI but an increase in HK-II were noted in the SW620 cells
following knockdown of TFAM. ND6, mtDNA-encoded NADH dehydrogenase
subunit 6; COX-II, mtDNA-encoded, cytochrome c oxidase
subunit II; SDHA, nDNA-encoded, SDHA, succinate dehydrogenase
complex flavoprotein subunit A; HK-II, hexokinase II; GPI, glucose
6-phosphate isomerase; LDH, lactate dehydrogenase. |
| Table VI.Alterations in metabolic profiles,
ROS intensity and invasive activity after the knockdown of TFAM in
metastatic SW620 cell line. |
Table VI.
Alterations in metabolic profiles,
ROS intensity and invasive activity after the knockdown of TFAM in
metastatic SW620 cell line.
|
| Cell line |
|
|
|
|---|
|
|
|
|
|
|
|---|
|
Parameters/variables | SW480 | SW620 | SW620-Control | SW620-KD#4 | SW620-KD#5 |
P-valuea |
P-valueb |
P-valuec |
|---|
| TFAM mRNA | 1.00±0.00 | 2.88±0.05 | 2.81±0.02 | 1.81±0.03 | 1.62±0.04 | 0.122 | <0.001 | <0.001 |
| mtDNA copy
number | 1.00±0.00 | 2.27±0.13 | 2.21±0.13 | 1.40±0.18 | 1.00±0.10 | 0.669 | 0.036 | 0.009 |
| Oxygen consumption
rate (OCR)d |
|
|
|
|
|
|
|
|
|
Respiratory substrate |
|
|
|
|
|
|
|
|
|
Succinate-supported |
|
| 2.11±0.08 | 1.88±0.02 | 1.79±0.11 |
| 0.130 | 0.085 |
|
ADP-stimulated |
|
| 5.61±0.01 | 3.78±0.13 | 3.50±0.14 |
| 0.002 | 0.002 |
|
Respiratory
control ratio (RCR) |
|
| 2.67±0.11 | 2.02±0.05 | 1.96±0.04 |
| 0.015 | 0.012 |
| Lactate production
rate (ng/h/104 cells) |
|
| 103.1±2.7 | 130.4±6.1 | 159.4±4.9 |
| 0.002 | <0.001 |
| Relative
intracellular ROS level |
|
|
|
|
|
|
|
|
|
Superoxide
(O2-•) |
|
| 1.00±0.00 | 1.65±0.01 | 1.67±0.02 |
| 0.010 | <0.001 |
|
Hydrogen peroxide
(H2O2) |
|
| 1.00±0.00 | 1.57±0.10 | 1.73±0.10 |
| 0.036 | 0.024 |
| Transwell assay
(cells/field) |
|
|
|
|
|
|
|
|
|
Invasion |
|
| 209.9±33.6 | 94.0±6.2 | 53.9±7.8 |
| 0.041 | 0.024 |
Clinical parameters and mtDNA copy
ratio
The relationships between the clinical parameters
and the mtDNA copy ratios in the tumor tissues of CRC patients are
presented in Table VII. We found
that deeper tumor invasion beyond the submucosa layer (T2/T3/T4 vs.
T1; 1.22±0.83 vs. 0.64±0.32, P=0.025) and longer tumor length
(>2 vs. ≤2 cm; 1.25±0.89 vs. 0.84±0.34, P=0.069) were associated
with a higher mtDNA copy ratio in the tumor tissues of the CRC
patients examined.
| Table VII.Relationships between the clinical
parameters and the alteration of mtDNA copy ratios in CRC
patients. |
Table VII.
Relationships between the clinical
parameters and the alteration of mtDNA copy ratios in CRC
patients.
| Parameters | mtDNA copy
ratio | P-value |
|---|
| Age (years) |
| 0.462 |
| >65
(n=11) | 1.30±1.27 |
|
| ≤65
(n=22) | 1.07±0.44 |
|
| Sex |
| 0.510 |
| Male
(n=22) | 1.01±0.49 |
|
| Female
(n=11) | 1.42±1.20 |
|
| Pathological
findings |
|
|
|
T-status |
| 0.025 |
|
T1 (n=4) | 0.64±0.32 |
|
|
T2/T3/T4
(n=29) | 1.22±0.83 |
|
| N
status |
| 0.260 |
|
N(−) (n=16) | 1.00±0.56 |
|
|
N(+) (n=17) | 1.29±0.97 |
|
| M
status |
| 0.900 |
|
M0 (n=32) | 1.15±0.82 |
|
|
M1 (n=1) | 1.05±0.00 |
|
| Tumor
length (cm) |
| 0.069 |
|
≤2 (n=8) | 0.84±0.34 |
|
|
>2 (n=25) | 1.25±0.89 |
|
Discussion
Phenotypically, SW620 cells were found to have a
higher Transwell migration activity than do SW480 cells.
Biologically, SW620 cells exhibited higher expression of
mitochondrial biogenesis-related proteins, higher OCR and higher
expression of EMT markers, but lower ROS production, lower
glycolytic enzyme and lower lactate production rate than SW480
cells (Table III and Fig. 1). Furthermore, decreases in
Transwell migration activity and protein expression of EMT markers
were observed in the SW620 cells presenting with suppressed
mitochondrial function induced by OA treatment or TFAM knockdown
(Figs. 4 and 5; Tables
IV and VI).
Clinicopathologically, the colorectal cancer (CRC) tumors that
invaded beyond the submucosa layer or that had a longer tumor
length, had higher mtDNA copy ratios (Table VII). These findings substantiate
the notion that suppressed mitochondrial function or low mtDNA copy
number may contribute to a decrease in the invasion activity of CRC
cells. However, these findings are different from the well-known
Warburg effect. Thus, further studies are warranted using more
tumor specimens of CRC patients at different clinical stages,
different CRC cell lines, or using other agents to suppress
mitochondrial function in the near future.
Impairment or suppression of mitochondria in human
cancers was first described by Dr Warburg based on his finding of
enhanced glycolysis in cancer tissue even when the oxygen supply is
sufficient (4,6). As a result, some cancer researchers
claimed that mitochondrial dysfunction may be involved in the
carcinogenesis and progression of cancers (51–54).
However, there are conflicting results. During the past two
decades, alteration of mitochondrial biogenesis has been evaluated
and discussed in many human cancers (15,23,55,56). A
decrease in mtDNA copy number, an increase in oxidative mtDNA
damage or decreases in the activities of respiratory enzyme
complexes have been observed in human lung, gastric and breast
cancer, renal cell carcinoma and esophageal cancer (26,28,57,58).
On the contrary, increases in mtDNA copy number or mitochondrial
function were found in esophageal cancer or head and neck cancer
during carcinogenesis or progression of cancers (18,21,22,59).
With regard to the mitochondrial alterations in human CRC, some
reseachers have demonstrated an increase in mtDNA copy number or
increased expression of mtDNA-encoded ND2 (60–63).
In contrast, some showed a decrease in mtDNA copy number, a
decrease in mitochondrial function or the presence of mDNA mutation
(64–66). Whether mitochondrial biogenesis is
suppressed, amplified or dysfunctional in human cancers, including
CRC, has remained a puzzle.
Recently, the concept of glucose metabolic switch
(the Warburg effect) has been associated with metabolic
reprogramming in cancer mitochondria. In other words, the
consideration of maximal bioenergetic demand has been shifted to
the regulation of both biosynthetic and energetic demands (67–69).
For a given cancer cell, it needs an ATP supply, but also
carbohydrate, lipid and protein synthesis to support cancer growth.
After glucose uptake and glycolysis, PDH may convert pyruvate to
acetyl-CoA to enter the Krebs cycle in the mitochondria. The Krebs
cycle can offer high energy intermediates, NADH or
FADH2, for subsequent electron transport and ATP
production and can offer citrate, which can be exported from the
mitochondria to the cytosol, to re-form acetyl-CoA for lipid
synthesis in the cytosol. PDH plays an important role in metabolic
reprogramming of human cancer. Intriguingly, Koukourakis et
al demonstrated that when lung tissues of cancer patients
exhibited decreased PDH expression (suggesting the shutdown of
oxidative metabolism or metabolic reprogramming) and decreased LDH5
expression (suggesting a shutdown of Warburg effect and glucose
metabolic switch), they had the best prognosis (70). This explains why SW620 cells
harboring higher protein levels of PDH and TFAM expression,
indicating a higher biosynthetic and energetic activity, had a
higher Transwell migration activity than did the SW480 cells
(Figs. 1 and 2). Indeed, several studies have suggested
that most cancer mitochondria are not impaired in executing
oxidative phosphorylation. Nevertheless, they are reprogrammed to
meet the need of biosynthesis of macromolecules and growth of human
cancer (67–73). Furthermore, the associations among
EMT, stemness properties and mitochondrial metabolic reprogramming
have received great attention of cancer research scientists
(74–76). Mitochondria have remained the main
powerhouse of human cancers, and high mitochondrial function may
confer high invasive property in human cancer cells, as
demonstrated in the present study and our previous observations in
esophageal cancer cell lines (22,73).
Whether mitochondrial function does affect the
invasion activity of CRC cells, suppression of mitochondrial
function of SW620 cells could confer SW620 cells a phenotype with
lower invasion activity. After treatments of cancer cells with 5,
10 and 20 µg/ml of OA, we demonstrated that the OA-treated SW620
cells exhibited decreased Transwell migration activity and
decreased vimentin expression, increased ROS production and
increased lactate fermentation which mimicked SW480 cells (Fig. 4; Tables
IV and V). OA is commonly used
to suppress mitochondrial production of ATP. Different
concentrations of OA have been used, including 0.5 µg/ml for HepG2
cells (77), 2.5, 5, 10 and 25
µg/ml for human chondrocytes (40),
10 µg/ml for adipose tissue cells (38), and 15 µg/ml for SKBR3 and 4T1 breast
cancer cells (39). The
concentrations of 5, 10 and 20 µg/ml of OA were thus used in the
present study.
Such a high OA concentrations in the present study
did confer SW620 cells the ability to exhibit some characteristics
similar to SW480 cells (Tables IV
and V), but did not cause an
obvious decrease in cell viability or increase in caspase 3
activity in the SW620 cells (Fig. 3A
and B). However, it seemed to markedly suppress the
mitochondrial function in SW620 cells (Table IV). This indicates a near-complete
suppression of mitochondrial function of SW620 cells, which is not
applicable in a physiological condition. As a result, we further
conducted the knockdown of TFAM in SW620 cells to test our
hypothesis. The TFAM-knockdown SW620 cells did display lower RCR,
but not as low as the results following OA treatment (Tables IV and VI). The TFAM-knockdown SW620 cells
expressed lower levels of mtDNA-encoded polypeptides (ND6 and
COX-II, Fig. 6), but increased
intracellular ROS production and a lactate production rate
(Table VI) and HK-II protein
expression (Fig. 6). Subsequently,
the TFAM-knockdown SW620 cells expressed lower protein levels of
EMT markers including Snail, N-cadherin and vimentin (Fig. 5) and lower Transwell invasion
activity (Table VI). It is worth
mentioning that SW620-KD#4 and SW620-KD#5 cells did express lower
mtDNA-encoded ND6 and COX-II without obvious alteration in
nDNA-encoded SDHA (Fig. 6), which
have convinced us that these are caused by the selective effect of
TFMA knockdown rather than off-target effects. However, some
differences existed between the SW620-Control and the parental
SW620 cells, including RCR and Transwell invasion activity. The
possible effects of scramble Luc-vector, the facilitation of
Lipofectamine 2000, and the addition of puromycin for clone
selection may account for these differences. On the contrary, we
tried to further evaluate the effects of overexpression of TFAM on
the OCR, ROS, EMT markers, and invasion of SW480 and SW620 cells to
test our hypothesis. We found that SW480 with TFAM overexpression
did show increased expression of COX-II, Snail and vimentin (data
not shown). The preliminary data indicated that mitochondrial
function may serve an important role in the invasiveness of human
CRC cells. More investigations, either in vitro or ex
vivo studies, are needed in the near future to generate a clear
picture of mitochondrial function in the invasion and progression
of human cancers.
The novel role of TFAM in human colon cancer has
been a hot research topic. Studies have shown that p53 increases
mtDNA copy number via upregulation of TFAM, and a high level of
TFAM expression was found to be associated with a poor prognosis in
CRC patients (60,78,79).
Some investigators further claimed that TFAM may be involved in the
carcinogenesis of CRCs. TFAM and mitochondrial function in human
CRCs deserve further studies in the future.
A difference in ROS production was also observed
between SW480 and SW620 CRC cells, and between SW620 and SW620
cells with suppressed mitochondrial function through OA treatment
or TFAM knockdown (Tables III,
V and VI). Several recent studies suggest that
mitochondria can generate some retrograding signals, ROS included,
for cellular adaptation or cancer invasion (80–82).
The endogenous ROS generated from mitochondria through electron
leak can cross the mitochondrial membrane to regulate several
proteins, transcriptional factors and transcriptional
co-activators, e.g., PCG-1α as demonstrated in the present study
(Table III) (83,84).
PCG-1α has also been shown to play an important role in the
regulation of TFAM (11). Abrupt
production of ROS may be hazardous to living cells through the
triggering of necrosis or apoptosis. Moderate levels of ROS may act
as regulatory mediators in signaling processes. Sustained increase
in the production of ROS is implicated in the pathogenesis of
cancer and other diseases (85–87).
However, the suitable levels or thresholds of mitochondrial ROS for
cancer carcinogenesis, progression or invasion were not clearly
demonstrated in the present study and have remained unclear
(88,89).
Another important finding of the present study is
amplified lactate fermentation of SW620 cells with suppressed
mitochondrial function, and the difference in glycolysis between
SW480 and SW620 cells (Tables
III, V and VI). Since similar ATP levels were found
in SW480 and SW620 cells, it seems reasonable to conjecture that
the increase in lactate fermentation is compensated for the defects
in mitochondrial function as described by Warburg (4–6).
However, some researchers suggest that lactate fermentation from
amplified glycolysis may confer several advantages for
carcinogenesis, proliferation and progression of cancers by
providing precursors for DNA/RNA synthesis and eradicating ROS by
NADPH produced from the pentose phosphate pathway (PPP) (52,89,90).
The PPP is an offshoot pathway parallel to glycolysis that
generates NADPH and 5-carbon sugars for biosynthesis of nucleotides
(52,89).
Recent studies indicate that proto-oncogenes,
tumor-suppressor genes and specific signaling pathways may
participate in the regulation of metabolic reprogramming or
increase of glycolysis, including PI3K/Akt/mTOR1 and HIF-1/PDK1/PDH
pathways, c-myc oncogene activation, and mutant p53
tumor-suppressor gene (5,80,91–95).
However, the detail mechanism involved in CRC invasion deserves
future study.
Regarding the difference between cancer cell
invasion activity between SW480 and SW620 cells, some controversies
exist. We and some researchers have demonstrated that SW620 cells
have a higher invasion activity than SW480 cells (34,96,97).
On the contrary, higher invasion activity of SW480 cells was
observed in other studies (50,98,99).
Differences in the culture medium, cell migration assay, and
activation of signaling pathways may account for these differences.
The tumor microenvironment seems to be another important issue in
cancer cell adaptation to different cancer invasion phenotypes
(100).
In summary, the above-mentioned findings suggest
that a sufficient supply of ATP by mitochondrial respiration and
oxidative phosphorylation is essential for migration and invasion
of CRC cells. Metabolic reprogramming, amplified glycolysis and
mitochondrial retrograde signaling are advantageous for cancer
cells to achieve effective adaption to the microenvironment.
However, the checkpoint and mechanism with which to trigger
metabolic reprogramming and cancer invasion have remained a puzzle.
We speculate that this type of metabolic plasticity may be a
signature of malignant cancer cells, which may explain the failure
of many anticancer therapies.
Acknowledgements
The present study was supported by grants from the
Ministry of Science and Technology, Executive Yuan, Taiwan
(MOST104-2320-B-715-006-MY2, MOST104-2627-B-715-002 and
MOST105-2627-M-715-001-).
References
|
1
|
Puppa G, Sonzogni A, Colombari R and
Pelosi G: TNM staging system of colorectal carcinoma: A critical
appraisal of challenging issues. Arch Pathol Lab Med. 134:837–852.
2010.PubMed/NCBI
|
|
2
|
Hsu CC, Tseng LM and Lee HC: Role of
mitochondrial dysfunction in cancer progression. Exp Biol Med.
241:1281–1295. 2016. View Article : Google Scholar
|
|
3
|
Fearon ER: Molecular genetics of
colorectal cancer. Annu Rev Pathol. 6:479–507. 2011. View Article : Google Scholar : PubMed/NCBI
|
|
4
|
Warburg O, Wind F and Negelein E: The
metabolism of tumors in the body. J Gen Physiol. 8:519–530. 1927.
View Article : Google Scholar : PubMed/NCBI
|
|
5
|
Kim JW and Dang CV: Cancer's molecular
sweet tooth and the Warburg effect. Cancer Res. 66:8927–8930. 2006.
View Article : Google Scholar : PubMed/NCBI
|
|
6
|
Warburg O: On the origin of cancer cells.
Science. 123:309–314. 1956. View Article : Google Scholar : PubMed/NCBI
|
|
7
|
Bratic I and Trifunovic A: Mitochondrial
energy metabolism and ageing. Biochim Biophys Acta. 797:961–967.
2010. View Article : Google Scholar
|
|
8
|
Gilkerson R, Bravo L, Garcia I, Gaytan N,
Herrera A, Maldonado A and Quintanilla B: The mitochondrial
nucleoid: Integrating mitochondrial DNA into cellular homeostasis.
Cold Spring Harb Perspect Biol. 5:a0110802013. View Article : Google Scholar : PubMed/NCBI
|
|
9
|
Kaniak-Golik A and Skoneczna A:
Mitochondria-nucleus network for genome stability. Free Radic Biol
Med. 82:73–104. 2015. View Article : Google Scholar : PubMed/NCBI
|
|
10
|
Baker MJ, Frazier AE, Gulbis JM and Ryan
MT: Mitochondrial protein-import machinery: Correlating structure
with function. Trends Cell Biol. 17:456–464. 2007. View Article : Google Scholar : PubMed/NCBI
|
|
11
|
Lee HC and Wei YH: Mitochondrial
biogenesis and mitochondrial DNA maintenance of mammalian cells
under oxidative stress. Int J Biochem Cell Biol. 37:822–834. 2005.
View Article : Google Scholar : PubMed/NCBI
|
|
12
|
Asin-Cayuela J and Gustafsson CM:
Mitochondrial transcription and its regulation in mammalian cells.
Trends Biochem Sci. 32:111–117. 2007. View Article : Google Scholar : PubMed/NCBI
|
|
13
|
Moraes CT: What regulates mitochondrial
DNA copy number in animal cells? Trends Genet. 17:199–205. 2001.
View Article : Google Scholar : PubMed/NCBI
|
|
14
|
Boland ML, Chourasia AH and Macleod KF:
Mitochondrial dysfunction in cancer. Front Oncol. 3:2922013.
View Article : Google Scholar : PubMed/NCBI
|
|
15
|
Lin CS and Wang LS: Mitochondrial DNA
instability in human cancers. Formos J Surg. 46:71–75. 2013.
View Article : Google Scholar
|
|
16
|
Lee CH and Yu HS: Role of mitochondria,
ROS, and DNA damage in arsenic induced carcinogenesis. Front
Biosci. 8:312–320. 2016. View
Article : Google Scholar
|
|
17
|
Lee CH, Wu SB, Hong CH, Liao WT, Wu CY,
Chen GS, Wei YH and Yu HS: Aberrant cell proliferation by enhanced
mitochondrial biogenesis via mtTFA in arsenical skin cancers. Am J
Pathol. 178:2066–2076. 2011. View Article : Google Scholar : PubMed/NCBI
|
|
18
|
Kim MM, Clinger JD, Masayesva BG, Ha PK,
Zahurak ML, Westra WH and Califano JA: Mitochondrial DNA quantity
increases with histopathologic grade in premalignant and malignant
head and neck lesions. Clin Cancer Res. 10:8512–8515. 2004.
View Article : Google Scholar : PubMed/NCBI
|
|
19
|
Yu M, Shi Y, Wei X, Yang Y, Zhou Y, Hao X,
Zhang N and Niu R: Depletion of mitochondrial DNA by ethidium
bromide treatment inhibits the proliferation and tumorigenesis of
T47D human breast cancer cells. Toxicol Lett. 170:83–93. 2007.
View Article : Google Scholar : PubMed/NCBI
|
|
20
|
Lin CS, Chang SC, Ou LH, Chen CM, Hsieh
SS, Chung YP, King KL, Lin SL and Wei YH: Mitochondrial DNA
alterations correlate with the pathological status and the
immunological ER, PR, HER-2/neu, p53 and Ki-67 expression in breast
invasive ductal carcinoma. Oncol Rep. 33:2924–2934. 2015.
View Article : Google Scholar : PubMed/NCBI
|
|
21
|
Lin CS, Chang SC, Wang LS, Chou TY, Hsu
WH, Wu YC and Wei YH: The role of mitochondrial DNA alterations in
esophageal squamous cell carcinomas. J Thorac Cardiovasc Surg.
139:189–197 e184. 2010. View Article : Google Scholar : PubMed/NCBI
|
|
22
|
Lin CS, Lee HT, Lee SY, Shen YA, Wang LS,
Chen YJ and Wei YH: High mitochondrial DNA copy number and
bioenergetic function are associated with tumor invasion of
esophageal squamous cell carcinoma cell lines. Int J Mol Sci.
13:11228–11246. 2012. View Article : Google Scholar : PubMed/NCBI
|
|
23
|
Lee HC and Wei YH: Mitochondrial DNA
instability and metabolic shift in human cancers. Int J Mol Sci.
10:674–701. 2009. View Article : Google Scholar : PubMed/NCBI
|
|
24
|
Roberts ER and Thomas KJ: The role of
mitochondria in the development and progression of lung cancer.
Comput Struct Biotechnol J. 6:e2013030192013. View Article : Google Scholar : PubMed/NCBI
|
|
25
|
Lin CS, Wang LS, Tsai CM and Wei YH: Low
copy number and low oxidative damage of mitochondrial DNA are
associated with tumor progression in lung cancer tissues after
neoadjuvant chemotherapy. Interact Cardiovasc Thorac Surg.
7:954–958. 2008. View Article : Google Scholar : PubMed/NCBI
|
|
26
|
Simonnet H, Alazard N, Pfeiffer K, Gallou
C, Béroud C, Demont J, Bouvier R, Schägger H and Godinot C: Low
mitochondrial respiratory chain content correlates with tumor
aggressiveness in renal cell carcinoma. Carcinogenesis. 23:759–768.
2002. View Article : Google Scholar : PubMed/NCBI
|
|
27
|
Lin CS, Lee HT, Lee MH, Pan SC, Ke CY,
Chiu AW and Wei YH: Role of mitochondrial DNA copy number
alteration in human renal cell carcinoma. Int J Mol Sci.
17:E8142016. View Article : Google Scholar : PubMed/NCBI
|
|
28
|
Wu CW, Yin PH, Hung WY, Li AF, Li SH, Chi
CW, Wei YH and Lee HC: Mitochondrial DNA mutations and
mitochondrial DNA depletion in gastric cancer. Genes Chromosomes
Cancer. 44:19–28. 2005. View Article : Google Scholar : PubMed/NCBI
|
|
29
|
Lee YK, Woo HG and Yoon G: Mitochondrial
defect-responsive gene signature in liver-cancer progression. BMB
Rep. 48:597–598. 2015. View Article : Google Scholar : PubMed/NCBI
|
|
30
|
Yin PH, Lee HC, Chau GY, Wu YT, Li SH, Lui
WY, Wei YH, Liu TY and Chi CW: Alteration of the copy number and
deletion of mitochondrial DNA in human hepatocellular carcinoma. Br
J Cancer. 90:2390–2396. 2004. View Article : Google Scholar : PubMed/NCBI
|
|
31
|
Toki N, Kagami S, Kurita T, Kawagoe T,
Matsuura Y, Hachisuga T, Matsuyama A, Hashimoto H, Izumi H and
Kohno K: Expression of mitochondrial transcription factor A in
endometrial carcinomas: Clinicopathologic correlations and
prognostic significance. Virchows Arch. 456:387–393. 2010.
View Article : Google Scholar : PubMed/NCBI
|
|
32
|
Singh KP, Kumari R, Treas J and DuMond JW:
Chronic exposure to arsenic causes increased cell survival, DNA
damage, and increased expression of mitochondrial transcription
factor A (mtTFA) in human prostate epithelial cells. Chem Res
Toxicol. 24:340–349. 2011. View Article : Google Scholar : PubMed/NCBI
|
|
33
|
Mo M, Peng F, Wang L, Peng L, Lan G and Yu
S: Roles of mitochondrial transcription factor A and
microRNA-590-3p in the development of bladder cancer. Oncol Lett.
6:617–623. 2013.PubMed/NCBI
|
|
34
|
Hewitt RE, McMarlin A, Kleiner D, Wersto
R, Martin P, Tsokos M, Stamp GW and Stetler-Stevenson WG:
Validation of a model of colon cancer progression. J Pathol.
192:446–454. 2000. View Article : Google Scholar : PubMed/NCBI
|
|
35
|
Leibovitz A, Stinson JC, McCombs WB III,
McCoy CE, Mazur KC and Mabry ND: Classification of human colorectal
adenocarcinoma cell lines. Cancer Res. 36:4562–4569.
1976.PubMed/NCBI
|
|
36
|
Futschik M, Jeffs A, Pattison S, Kasabov
N, Sullivan M, Merrie A and Reeve A: Gene expression profiling of
metastatic and nonmetastatic colorectal cancer cell lines. Genome
Lett. 1:26–34. 2002. View Article : Google Scholar
|
|
37
|
Lee CC, Chen WS, Chen CC, Chen LL, Lin YS,
Fan CS and Huang TS: TCF12 protein functions as transcriptional
repressor of E-cadherin, and its overexpression is correlated with
metastasis of colorectal cancer. J Biol Chem. 287:2798–2809. 2012.
View Article : Google Scholar : PubMed/NCBI
|
|
38
|
Wang CH, Wang CC, Huang HC and Wei YH:
Mitochondrial dysfunction leads to impairment of insulin
sensitivity and adiponectin secretion in adipocytes. FEBS J.
280:1039–1050. 2013. View Article : Google Scholar : PubMed/NCBI
|
|
39
|
Ma J, Zhang Q, Chen S, Fang B, Yang Q,
Chen C, Miele L, Sarkar FH, Xia J and Wang Z: Mitochondrial
dysfunction promotes breast cancer cell migration and invasion
through HIF1α accumulation via increased production of reactive
oxygen species. PLoS One. 8:e694852013. View Article : Google Scholar : PubMed/NCBI
|
|
40
|
Cillero-Pastor B, Rego-Pérez I, Oreiro N,
Fernandez-Lopez C and Blanco FJ: Mitochondrial respiratory chain
dysfunction modulates metalloproteases −1, −3 and −13 in human
normal chondrocytes in culture. BMC Musculoskelet Disord.
14:2352013. View Article : Google Scholar : PubMed/NCBI
|
|
41
|
Li C, Wu Z, Liu M, Pazgier M and Lu W:
Chemically synthesized human survivin does not inhibit caspase-3.
Protein Sci. 17:1624–1629. 2008. View Article : Google Scholar : PubMed/NCBI
|
|
42
|
Salazar N, Muñoz D, Hoy J and Lokeshwar
BL: Use of shRNA for stable suppression of chemokine receptor
expression and function in human cancer cell lines. Methods Mol
Biol. 1172:209–218. 2014. View Article : Google Scholar : PubMed/NCBI
|
|
43
|
Chen CT, Shih YR, Kuo TK, Lee OK and Wei
YH: Coordinated changes of mitochondrial biogenesis and antioxidant
enzymes during osteogenic differentiation of human mesenchymal stem
cells. Stem Cells. 26:960–968. 2008. View Article : Google Scholar : PubMed/NCBI
|
|
44
|
Clerc P and Polster BM: Investigation of
mitochondrial dysfunction by sequential microplate-based
respiration measurements from intact and permeabilized neurons.
PLoS One. 7:e344652012. View Article : Google Scholar : PubMed/NCBI
|
|
45
|
Wang CH, Chen YF, Wu CY, Wu PC, Huang YL,
Kao CH, Lin CH, Kao LS, Tsai TF and Wei YH: Cisd2 modulates the
differentiation and functioning of adipocytes by regulating
intracellular Ca2+ homeostasis. Hum Mol Genet.
23:4770–4785. 2014. View Article : Google Scholar : PubMed/NCBI
|
|
46
|
Chou SJ, Tseng WL, Chen CT, Lai YF, Chien
CS, Chang YL, Lee HC, Wei YH and Chiou SH: Impaired ROS scavenging
system in human induced pluripotent stem cells generated from
patients with MERRF syndrome. Sci Rep. 6:236612016. View Article : Google Scholar : PubMed/NCBI
|
|
47
|
Lee HT, Lin CS, Chen WS, Liao HT, Tsai CY
and Wei YH: Leukocyte mitochondrial DNA alteration in systemic
lupus erythematosus and its relevance to the susceptibility to
lupus nephritis. Int J Mol Sci. 13:8853–8868. 2012. View Article : Google Scholar : PubMed/NCBI
|
|
48
|
Lee HT, Lin CS, Lee CS, Tsai CY and Wei
YH: Increased 8-hydroxy-2′-deoxyguanosine in plasma and decreased
mRNA expression of human 8-oxoguanine DNA glycosylase 1,
anti-oxidant enzymes, mitochondrial biogenesis-related proteins and
glycolytic enzymes in leucocytes in patients with systemic lupus
erythematosus. Clin Exp Immunol. 176:66–77. 2014. View Article : Google Scholar : PubMed/NCBI
|
|
49
|
Livak KJ and Schmittgen TD: Analysis of
relative gene expression data using real-time quantitative PCR and
the 2−ΔΔCt method. Methods. 25:402–408. 2001. View Article : Google Scholar : PubMed/NCBI
|
|
50
|
Kubens BS and Zänker KS: Differences in
the migration capacity of primary human colon carcinoma cells
(SW480) and their lymph node metastatic derivatives (SW620). Cancer
Lett. 131:55–64. 1998. View Article : Google Scholar : PubMed/NCBI
|
|
51
|
Koppenol WH, Bounds PL and Dang CV: Otto
Warburg's contributions to current concepts of cancer metabolism.
Nat Rev Cancer. 11:325–337. 2011. View Article : Google Scholar : PubMed/NCBI
|
|
52
|
Pedersen PL: Warburg, me and Hexokinase 2:
Multiple discoveries of key molecular events underlying one of
cancers' most common phenotypes, the ‘Warburg Effect’, i.e.,
elevated glycolysis in the presence of oxygen. J Bioenerg Biomembr.
39:211–222. 2007. View Article : Google Scholar : PubMed/NCBI
|
|
53
|
Gatenby RA and Gillies RJ: Why do cancers
have high aerobic glycolysis? Nat Rev Cancer. 4:891–899. 2004.
View Article : Google Scholar : PubMed/NCBI
|
|
54
|
Lu J, Tan M and Cai Q: The Warburg effect
in tumor progression: Mitochondrial oxidative metabolism as an
anti-metastasis mechanism. Cancer Lett. 356:156–164. 2015.
View Article : Google Scholar : PubMed/NCBI
|
|
55
|
Zong WX, Rabinowitz JD and White E:
Mitochondria and Cancer. Mol Cell. 61:667–676. 2016. View Article : Google Scholar : PubMed/NCBI
|
|
56
|
Verschoor ML, Ungard R, Harbottle A,
Jakupciak JP, Parr RL and Singh G: Mitochondria and cancer: Past,
present, and future. Biomed Res Int. 2013:6123692013. View Article : Google Scholar : PubMed/NCBI
|
|
57
|
Lee HC, Yin PH, Lin JC, Wu CC, Chen CY, Wu
CW, Chi CW, Tam TN and Wei YH: Mitochondrial genome instability and
mtDNA depletion in human cancers. Ann NY Acad Sci. 1042:109–122.
2005. View Article : Google Scholar : PubMed/NCBI
|
|
58
|
Tseng LM, Yin PH, Chi CW, Hsu CY, Wu CW,
Lee LM, Wei YH and Lee HC: Mitochondrial DNA mutations and
mitochondrial DNA depletion in breast cancer. Genes Chromosomes
Cancer. 45:629–638. 2006. View Article : Google Scholar : PubMed/NCBI
|
|
59
|
Jiang WW, Masayesva B, Zahurak M, Carvalho
AL, Rosenbaum E, Mambo E, Zhou S, Minhas K, Benoit N, Westra WH, et
al: Increased mitochondrial DNA content in saliva associated with
head and neck cancer. Clin Cancer Res. 11:2486–2491. 2005.
View Article : Google Scholar : PubMed/NCBI
|
|
60
|
Wen S, Gao J, Zhang L, Zhou H, Fang D and
Feng S: p53 increase mitochondrial copy number via up-regulation of
mitochondrial transcription factor A in colorectal cancer.
Oncotarget. 7:75981–75995. 2016.PubMed/NCBI
|
|
61
|
Gao J, Wen S, Zhou H and Feng S:
De-methylation of displacement loop of mitochondrial DNA is
associated with increased mitochondrial copy number and
nicotinamide adenine dinucleotide subunit 2 expression in
colorectal cancer. Mol Med Rep. 12:7033–7038. 2015. View Article : Google Scholar : PubMed/NCBI
|
|
62
|
Feng S, Xiong L, Ji Z, Cheng W and Yang H:
Correlation between increased copy number of mitochondrial DNA and
clinicopathological stage in colorectal cancer. Oncol Lett.
2:899–903. 2011.PubMed/NCBI
|
|
63
|
Feng S, Xiong L, Ji Z, Cheng W and Yang H:
Correlation between increased ND2 expression and demethylated
displacement loop of mtDNA in colorectal cancer. Mol Med Rep.
6:125–130. 2012.PubMed/NCBI
|
|
64
|
van Osch FH, Voets AM, Schouten LJ,
Gottschalk RW, Simons CC, van Engeland M, Lentjes MH, van den
Brandt PA, Smeets HJ and Weijenberg MP: Mitochondrial DNA copy
number in colorectal cancer: Between tissue comparisons,
clinicopathological characteristics and survival. Carcinogenesis.
36:1502–1510. 2015.PubMed/NCBI
|
|
65
|
Cui H, Huang P, Wang Z, Zhang Y, Zhang Z,
Xu W, Wang X, Han Y and Guo X: Association of decreased
mitochondrial DNA content with the progression of colorectal
cancer. BMC Cancer. 13:1102013. View Article : Google Scholar : PubMed/NCBI
|
|
66
|
Sanchez-Pino MJ, Moreno P and Navarro A:
Mitochondrial dysfunction in human colorectal cancer progression.
Front Biosci. 12:1190–1199. 2007. View
Article : Google Scholar : PubMed/NCBI
|
|
67
|
Phan LM, Yeung SC and Lee MH: Cancer
metabolic reprogramming: Importance, main features, and potentials
for precise targeted anti-cancer therapies. Cancer Biol Med.
11:1–19. 2014.PubMed/NCBI
|
|
68
|
Yoshida GJ: Metabolic reprogramming: The
emerging concept and associated therapeutic strategies. J Exp Clin
Cancer Res. 34:1112015. View Article : Google Scholar : PubMed/NCBI
|
|
69
|
Ward PS and Thompson CB: Metabolic
reprogramming: A cancer hallmark even warburg did not anticipate.
Cancer Cell. 21:297–308. 2012. View Article : Google Scholar : PubMed/NCBI
|
|
70
|
Koukourakis MI, Giatromanolaki A, Sivridis
E, Gatter KC and Harris AL; Tumor and Angiogenesis Research Group,
: Pyruvate dehydrogenase and pyruvate dehydrogenase kinase
expression in non small cell lung cancer and tumor-associated
stroma. Neoplasia. 7:1–6. 2005. View Article : Google Scholar : PubMed/NCBI
|
|
71
|
Zheng J: Energy metabolism of cancer:
Glycolysis versus oxidative phosphorylation (Review). Oncol Lett.
4:1151–1157. 2012.PubMed/NCBI
|
|
72
|
Vyas S, Zaganjor E and Haigis MC:
Mitochondria and cancer. Cell. 166:555–566. 2016. View Article : Google Scholar : PubMed/NCBI
|
|
73
|
Ahn CS and Metallo CM: Mitochondria as
biosynthetic factories for cancer proliferation. Cancer Metab.
3:12015. View Article : Google Scholar : PubMed/NCBI
|
|
74
|
Shen YA, Wang CY, Hsieh YT, Chen YJ and
Wei YH: Metabolic reprogramming orchestrates cancer stem cell
properties in nasopharyngeal carcinoma. Cell Cycle. 14:86–98. 2015.
View Article : Google Scholar : PubMed/NCBI
|
|
75
|
Shen YA, Lin CH, Chi WH, Wang CY, Hsieh
YT, Wei YH and Chen YJ: Resveratrol impedes the stemness,
epithelial-mesenchymal transition, and metabolic reprogramming of
cancer stem cells in nasopharyngeal carcinoma through p53
activation. Evid Based Complement Alternat Med. 2013:5903932013.
View Article : Google Scholar : PubMed/NCBI
|
|
76
|
Guha M, Srinivasan S, Ruthel G, Kashina
AK, Carstens RP, Mendoza A, Khanna C, Van Winkle T and Avadhani NG:
Mitochondrial retrograde signaling induces epithelial-mesenchymal
transition and generates breast cancer stem cells. Oncogene.
33:5238–5250. 2014. View Article : Google Scholar : PubMed/NCBI
|
|
77
|
Chang CJ, Yin PH, Yang DM, Wang CH, Hung
WY, Chi CW, Wei YH and Lee HC: Mitochondrial dysfunction-induced
amphiregulin upregulation mediates chemo-resistance and cell
migration in HepG2 cells. Cell Mol Life Sci. 66:1755–1765. 2009.
View Article : Google Scholar : PubMed/NCBI
|
|
78
|
Yoshida Y, Hasegawa J, Nezu R, Kim YK,
Hirota M, Kawano K, Izumi H and Kohno K: Clinical usefulness of
mitochondrial transcription factor A expression as a predictive
marker in colorectal cancer patients treated with FOLFOX. Cancer
Sci. 102:578–582. 2011. View Article : Google Scholar : PubMed/NCBI
|
|
79
|
Nakayama Y, Yamauchi M, Minagawa N,
Torigoe T, Izumi H, Kohno K and Yamaguchi K: Clinical significance
of mitochondrial transcription factor A expression in patients with
colorectal cancer. Oncol Rep. 27:1325–1330. 2012.PubMed/NCBI
|
|
80
|
Barbour JA and Turner N: Mitochondrial
stress signaling promotes cellular adaptations. Int J Cell Biol.
2014:1560202014. View Article : Google Scholar : PubMed/NCBI
|
|
81
|
da Cunha FM, Torelli NQ and Kowaltowski
AJ: Mitochondrial retrograde signaling: Triggers, pathways, and
outcomes. Oxid Med Cell Longev. 2015:4825822015. View Article : Google Scholar : PubMed/NCBI
|
|
82
|
Guha M and Avadhani NG: Mitochondrial
retrograde signaling at the crossroads of tumor bioenergetics,
genetics and epigenetics. Mitochondrion. 13:577–591. 2013.
View Article : Google Scholar : PubMed/NCBI
|
|
83
|
Murphy MP: How mitochondria produce
reactive oxygen species. Biochem J. 417:1–13. 2009. View Article : Google Scholar : PubMed/NCBI
|
|
84
|
St-Pierre J, Drori S, Uldry M, Silvaggi
JM, Rhee J, Jäger S, Handschin C, Zheng K, Lin J, Yang W, et al:
Suppression of reactive oxygen species and neurodegeneration by the
PGC-1 transcriptional coactivators. Cell. 127:397–408. 2006.
View Article : Google Scholar : PubMed/NCBI
|
|
85
|
Dröge W: Free radicals in the
physiological control of cell function. Physiol Rev. 82:47–95.
2002. View Article : Google Scholar : PubMed/NCBI
|
|
86
|
Alfadda AA and Sallam RM: Reactive oxygen
species in health and disease. J Biomed Biotechnol.
2012:9364862012. View Article : Google Scholar : PubMed/NCBI
|
|
87
|
Eisele HJ, Markart P and Schulz R:
Obstructive sleep apnea, oxidative stress, and cardiovascular
disease: Evidence from human studies. Oxid Med Cell Longev.
2015:6084382015. View Article : Google Scholar : PubMed/NCBI
|
|
88
|
Sabharwal SS and Schumacker PT:
Mitochondrial ROS in cancer: Initiators, amplifiers or an Achilles'
heel? Nat Rev Cancer. 14:709–721. 2014. View Article : Google Scholar : PubMed/NCBI
|
|
89
|
Lu F: Reactive oxygen species in cancer,
too much or too little? Med Hypotheses. 69:1293–1298. 2007.
View Article : Google Scholar : PubMed/NCBI
|
|
90
|
Kondoh H, Lleonart ME, Gil J, Wang J,
Degan P, Peters G, Martinez D, Carnero A and Beach D: Glycolytic
enzymes can modulate cellular life span. Cancer Res. 65:177–185.
2005.PubMed/NCBI
|
|
91
|
Li F, Wang Y, Zeller KI, Potter JJ, Wonsey
DR, O'Donnell KA, Kim JW, Yustein JT, Lee LA and Dang CV: Myc
stimulates nuclearly encoded mitochondrial genes and mitochondrial
biogenesis. Mol Cell Biol. 25:6225–6234. 2005. View Article : Google Scholar : PubMed/NCBI
|
|
92
|
Papandreou I, Cairns RA, Fontana L, Lim AL
and Denko NC: HIF-1 mediates adaptation to hypoxia by actively
downregulating mitochondrial oxygen consumption. Cell Metab.
3:187–197. 2006. View Article : Google Scholar : PubMed/NCBI
|
|
93
|
Buzzai M, Bauer DE, Jones RG, Deberardinis
RJ, Hatzivassiliou G, Elstrom RL and Thompson CB: The glucose
dependence of Akt-transformed cells can be reversed by
pharmacologic activation of fatty acid beta-oxidation. Oncogene.
24:4165–4173. 2005. View Article : Google Scholar : PubMed/NCBI
|
|
94
|
Düvel K, Yecies JL, Menon S, Raman P,
Lipovsky AI, Souza AL, Triantafellow E, Ma Q, Gorski R, Cleaver S,
et al: Activation of a metabolic gene regulatory network downstream
of mTOR complex 1. Mol Cell. 39:171–183. 2010. View Article : Google Scholar : PubMed/NCBI
|
|
95
|
Fields J, Hanisch JJ, Choi JW and Hwang
PM: How does p53 regulate mitochondrial respiration? IUBMB Life.
59:682–684. 2007. View Article : Google Scholar : PubMed/NCBI
|
|
96
|
Ni J, Jiang Z, Shen L, Gao L, Yu M, Xu X,
Zou S, Hua D and Wu S: β3GnT8 regulates the metastatic potential of
colorectal carcinoma cells by altering the glycosylation of CD147.
Oncol Rep. 31:1795–1801. 2014. View Article : Google Scholar : PubMed/NCBI
|
|
97
|
Cai K, Mulatz K, Ard R, Nguyen T and Gee
SH: Increased diacylglycerol kinase ζ expression in human
metastatic colon cancer cells augments Rho GTPase activity and
contributes to enhanced invasion. BMC Cancer. 14:2082014.
View Article : Google Scholar : PubMed/NCBI
|
|
98
|
Schimanski CC, Schwald S, Simiantonaki N,
Jayasinghe C, Gönner U, Wilsberg V, Junginger T, Berger MR, Galle
PR and Moehler M: Effect of chemokine receptors CXCR4 and CCR7 on
the metastatic behavior of human colorectal cancer. Clin Cancer
Res. 11:1743–1750. 2005. View Article : Google Scholar : PubMed/NCBI
|
|
99
|
Kusakai G, Suzuki A, Ogura T, Miyamoto S,
Ochiai A, Kaminishi M and Esumi H: ARK5 expression in colorectal
cancer and its implications for tumor progression. Am J Pathol.
164:987–995. 2004. View Article : Google Scholar : PubMed/NCBI
|
|
100
|
Friedl P and Alexander S: Cancer invasion
and the microenvironment: Plasticity and reciprocity. Cell.
147:992–1009. 2011. View Article : Google Scholar : PubMed/NCBI
|