Introduction
Glioma, accounting for ~80% of brain malignancies
(1), is the most lethal and
aggressive type of brain tumor in adults (2). Despite advances in multimodal
therapies including surgical resection, radiation and chemotherapy
(3), the prognosis of glioma
patients remains dismal (4,5), with a 5-year survival rate of 4.3%
(6). Due to the fact that most
glioma patients have already developed metastasis or malignant
diffusion by the time of diagnosis (2), identifying new prognostic biomarkers
and molecular targets for glioma is imperative.
To better understand the pathogenesis of glioma,
substantial efforts have been made to investigate molecular
subtypes (7,8) and potential biomarkers correlated with
the clinical prognosis (9–12). For example, The Cancer Genome Atlas
(TCGA) (13) database provides
researchers an ideal platform to explore tumorigenesis, cancer
progression and treatment responses in various types of tumors
including GBM (12,14–16).
As proliferation and metastasis play a key role in
glioma development (2), we focused
on potential genes involved in glioma proliferation and metastasis
in the present study. Capping actin protein, gelsolin-like (CapG)
was first identified as an actin binding protein of the gelsolin
superfamily, which is able to modulate actin length by capping
barbed ends in a Ca2+-dependent manner and generate
propulsive force (17,18). However, it is involved in the
regulation of actin-based cell migration in non-muscle benign cells
(19). Moreover, overexpression of
CapG has been reported to promote cell motility and increase
metastasis in breast cancer and ovarian carcinoma (20). However, the function and prognosis
of CapG in human glioma remain unclear.
In the present study, we first investigated levels
of CapG expression in a cohort of Chinese glioma patients by tissue
microarray (TMA) and estimated its prognostic value. We then tested
the differential expression and prognostic value of CapG in
an independent cohort from the TCGA dataset. Finally, we assessed
the effect of CapG on the proliferation and metastatic ability of
glioma cell lines U87 and U251. Our results revealed that CapG is a
novel independent prognostic predictor for glioma patients and
highlight a key role of CapG in proliferation and metastasis of
glioma.
Materials and methods
Patients and tissue samples
For the Chinese TMA cohort, 285 glioma patients of
different WHO grades were recruited between January 2000 and
December 2010 from the Department of Neurosurgery at Changzheng
Hospital, Second Military Medical University (SMMU) (Shanghai,
China). Sixteen normal brain tissue samples were taken from trauma
outpatients during decompression treatment. Clinical information
was obtained from medical records of the patients. Tumor histology
was confirmed by two neuropathologists independently. All
participants provided written informed consent. The present study
was approved by the Ethics Review Committee of the Second Military
Medical University and Fudan University.
Immunohistochemistry and tissue
microarray analysis
The tissue microarray construction and
immunohistochemistry analyses were performed by Shanghai Biochip
Co., Ltd. (Shanghai, China), as described previously (21,22).
The immunohistochemical staining was read and scored by two
independent pathologists in a blinded fashion. The total
immunoreactivity score was the product of the staining scores for
density and intensity (23). High
CapG expression, indicating strongly positive cases (+), had a
score of >3, while low expression indicated weakly positive
cases (−) with a score of ≤3.
Quantitative real-time PCR
Total RNA was extracted from surgically resected
tissues using TRIzol reagent (Invitrogen, Carlsbad, CA, USA)
following the manufacturer's protocol. Reverse transcription of
total RNA was performed using ReverTra Ace (Toyobo, Tokyo, Japan).
The PCR primers are avaiable upon request. Quantitative real-time
PCR was run using the ABI Prism 7900HT instruments (Applied
Biosystems, Foster City, CA, USA) in the presence of Thunderbird
SYBR qPCR Mix (Toyobo). All samples were tested in triplicate and
repeated 3 times and melting curve analysis was used to check the
specificity of amplification. The 2−ΔΔCt method
(24) was used to calculate
relative gene expression.
In silico analyses of TCGA data
The Cancer Genome Atlas (TCGA) (13) cohort (N=528; the Affymetrix
platform), an independent dataset of GBM, was included in the
present study. For the TCGA cohort, multidimensional data of
clinical information, molecular subtypes, copy number alterations,
common mutations, methylation levels and gene expression were
obtained from the TCGA data portal (http://tcga-data.nci.nih.gov/tcga/) and cBioPortal
(http://www.cbioportal.org/public-portal/), to analyze
the expression profile and prognostic significance of the CapG
gene, and their correlations with several molecular alterations. In
the analyses of the TCGA cohort, CapG gene levels were dichotomized
to low and high according to the ROC curve.
Cell culture and lentivirus
infection
U87 and U251 human glioma cell lines were purchased
from the Japanese Cancer Research Resources Bank. The glioma cells
were cultured in Dulbecco's modified Eagle's medium (DMEM) (Life
Technologies, Foster City, CA, USA) supplemented with 10% fetal
bovine serum (FBS) and penicillin (100 U/ml)/streptomycin (100
U/ml). To generate cell lines stably overexpressing CapG, we cloned
CapG from cDNA of the U251 cell line by PCR and cloned it into the
CD513B plasmid (System Biosciences, Mountain View, CA, USA) at the
EcoRI and BamHI restriction sites. To stably
interfere with CapG expression, we selected sequences targeting
CapG into the HpaI-XhoI sites plasmid LentiLox 3.7
(pLL3.7) (data available upon request). However, the shLacZ
(25) and CD513B empty vector (EV)
were used as controls for pLL3.7-shCapG and CD513B-CapG,
respectively. Lentiviral production and infection were performed as
previously described (26).
Western blotting
The tissue and cell samples were lysed in
radioimmunoprecipitation assay (RIPA) buffer containing protease
inhibitor cocktail (Sigma, St. Louis, MO, USA). The lysates were
separated on 10 or 12% SDS-PAGE gel and electrotransferred to
polyvinylidene difluoride membranes (Millipore, Billerica, MA,
USA). After blocking with 5% non-fat milk for 1 h at room
temperature and incubating with primary antibodies. CapG (Abcam,
Cambridge, MA, USA), CDK2, CDK6, Myc, cyclin A1, cyclin D1, cyclin
E, CDK4, E2F1, p15, RB and phospho-RB (ProteinTech, Group, Inc.,
Chicago, IL, USA), the membranes were incubated with the secondary
antibody (Epitomics, Burlingame, CA, USA). Anti-GAPDH antibody
(Vazyme, Nanjing, China) was used as a loading control.
Cell proliferation assays and cell
cycle analysis
Following overexpression or knockdown of CapG, the
glioma cells were seeded in 96-well plates (2,000 cells/well) in
sextuple, and the cell proliferation assay was performed using Cell
Counting Kit-8 (CCK-8; Dojindo Laboratories, Kumamoto, Japan)
according to the manufacturer's instructions. Cell cycle analysis
was performed as described previously (27). Glioma cells were washed with 1Χ PBS
3 times and fixed with 75% ice-cold ethanol. Fixed cells were
incubated in 1Χ PBS with propidium iodide (PI; 25 µg/ml) and 10
mg/ml RNase for 30 min in the dark before being analyzed by flow
cytometry. All assays were performed in 3 independent
experiments.
Wound healing assays
Cells were cultured to monolayers in 6-well plates
and a reference line was drawn at the back of each well. Three
scratches were made from one end to the other end of the well with
a sterile p200 pipette tip. The width of the wound distance was
measured at baseline. The cells were cultured in serum-free medium
for 24 and 48 h, respectively. Wound closure rate was expressed as
the distance migrated after 24 or 48 h relative to the basic width
at 4 h. Migration experiments were performed in triplicates and
repeated at least 3 times.
Transwell invasion assays
Cells were suspended in FBS-free DMEM at a
concentration of 1×10⁵ (U87 cells) and
2.5×10⁵ (U251 cells) for Transwell invasion assays using
BD BioCoat Matrigel invasion chambers (BD Biosciences, Franklin
Lakes, NJ, USA) according to the manufacturer's instructions. The
suspended cells (500 µl) were pipetted into the upper chamber,
while the lower chamber was filled with 750 µl DMEM with EGF (15
ng/ml). After 24 h of incubation at 37°C, the filter side of the
upper chamber was scrubbed with cotton swabs to remove non-invading
cells and Matrigel matrix. The migrated cells were fixed in
methanol and stained with crystal violet. Then, the membranes were
cut from the chamber and placed on microscope slides for
observation. Each invasion condition was performed in triplicates
and repeated at least 3 times.
Statistical analysis
All experiments were conducted in triplicate and are
expressed as the means and standard deviation by two-tailed
Student's t-test. Analysis of patient survival outcome was
conducted by Kaplan-Meier and Cox regression using GraphPad Prism 5
(GraphPad Software Inc., La Jolla, CA, USA) and SPSS statistics
17.0, respectively (SPSS, Inc., Chicago, IL, USA) (*P<0.05,
**P<0.01, ***P<0.001 and ‘ns’, not significant).
Results
CapG is elevated in human glioma
tissues
In the present study, a cohort of 285 glioma
specimens and 16 normal controls from a Chinese population was
enrolled in the TMA. It included 12 grade I (pilocytic
astrocytomas), 108 grade II (diffuse astrocytomas), 46 grade III
(anaplastic astrocytomas) and 119 grade IV (glioblastomas, GBM)
specimens according to the WHO grading schedule. The
clinicopathological parameters of the TMA are presented in Table I. The patient median overall
survival (OS) was 30 months for all glioma cases, with a 5-year
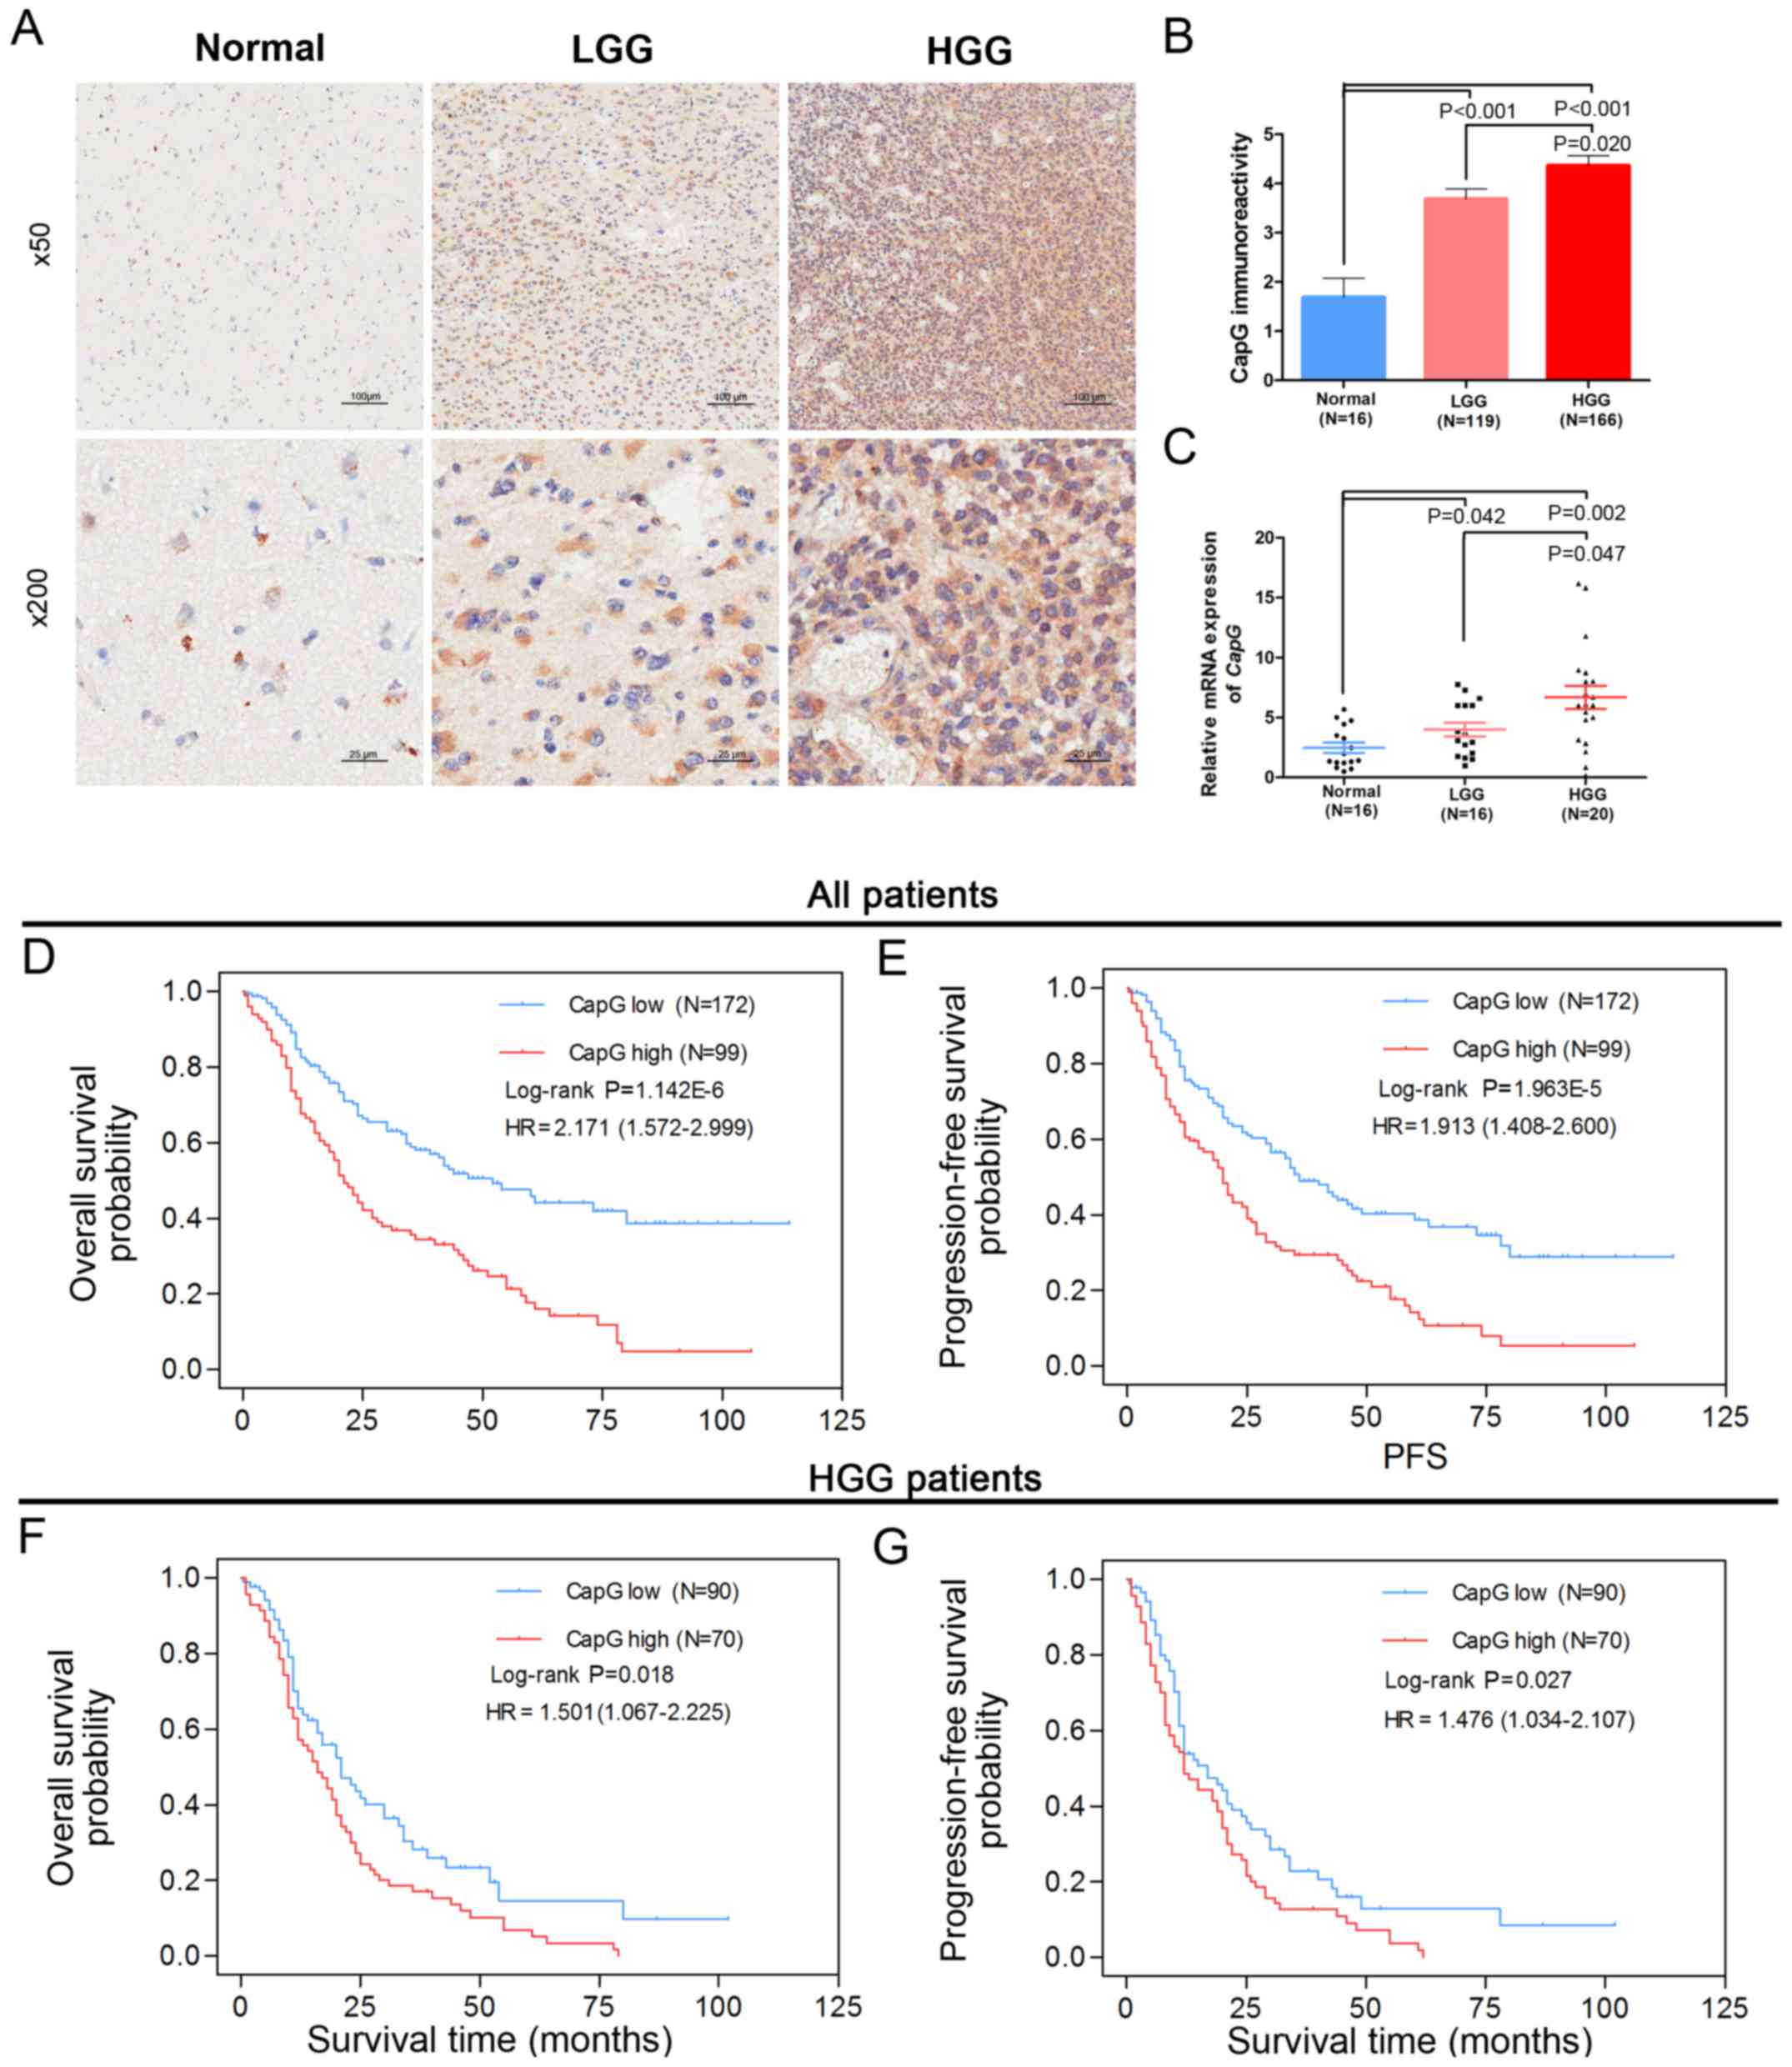
survival rate of 4.3%. Next, we examined the protein level of CapG
by immunohistochemical assay performed on the TMA and observed its
cytoplasmic expression in most samples. Furthermore, the
immunoreactivity of CapG was significantly increased with WHO grade
in the human glioma tissues when compared with normal controls:
high grade gliomas (HGG; grade III/grade IV) showed stronger
immunoreactivity than the low grade gliomas (LGG, grade I/II)
(Fig. 1A and B).
 | Table I.Clinicopathologic characteristics of
the 285 glioma patients in the Chinese TMA cohort. |
Table I.
Clinicopathologic characteristics of
the 285 glioma patients in the Chinese TMA cohort.
|
|
| WHO grade |
|---|
|
|
|
|
|---|
|
Characteristics | All glioma cases
(N=285) | Grade I (N=12) | Grade II
(N=108) | Grade III
(N=46) | Grade IV
(N=119) |
|---|
| Sex |
|
Male | 188 | 8 (66.7%) | 75 (69.4%) | 27 (58.7%) | 78 (65.5%) |
|
Female | 97 | 4 (33.3%) | 33 (30.6%) | 19 (41.3%) | 41 (34.4%) |
| Age at diagnosis
(year) |
|
<60 | 241 | 11 (91.7%) | 101 (93.5%) | 40 (90.0%) | 89 (74.8%) |
|
≥60 | 44 | 1 (8.3%) | 7 (6.5%) | 6 (10.0%) | 30 (25.2%) |
| Tumor origin |
|
Primary | 253 | 12 (100%) | 102 (94.6%) | 35 (76.1%) | 104 (87.4%) |
|
Secondary | 32 | 0 (0%) | 7 (6.4%) | 11 (33.9%) | 15 (12.6%) |
| Extent of
resection |
| Gross
total | 224 | 8 (66.7%) | 89 (82.4%) | 34 (73.9%) | 93 (78.2%) |
|
Partial | 61 | 4 (33.3%) | 19 (17.6%) | 12 (26.1%) | 26 (21.8%) |
| CapG
expression |
|
Low | 180 | 8 (66.7%) | 80 (74.1%) | 30 (65.2%) | 62 (52.1%) |
|
High | 105 | 4 (33.3%) | 28 (26.0%) | 16 (34.8%) | 57 (47.9%) |
| OS
(months) | 30 (27.4–33.5) | NAa | 45 (41.1–51.4) | 26 (23.9–37.4) | 16 (13.3–18.8) |
| Median (95%
CI) |
| PFS
(months) | 27 (24.9–30.8) | NAa | 40 (38.2–48.4) | 25 (20.8–33.2) | 14 (11.2–16.4) |
| Median (95%
CI) |
We then measured the transcriptional level of
CapG in a subset of 36 human gliomas (16 LGG and 20 HGG
specimens) and 16 normal controls via quantitative RT-PCR assay.
These samples were randomly selected from the cohort. Consistent
with the TMA data, CapG was considerably increased in human
glioma specimens according to WHO grade (Fig. 1C). These results suggest that CapG
is frequently elevated in human glioma tissues.
CapG serves as a novel prognostic
marker for glioma patients
To further investigate the correlation between CapG
expression level and clinical prognosis, we performed Kaplan-Meier
analyses and found that glioma patients with higher CapG expression
had significantly shorter overall survival (OS, log-rank
P=1.142E-06, HR=2.171, 95% CI=1.572–2.999, Fig. 1D) and progression-free survival
(PFS, log-rank, P=1.963E-05, HR=1.913, 95% CI=1.408–2.600, Fig. 1E) than those with low expression.
Moreover, we observed that HGG patients with higher CapG expression
also had an unfavorable OS (log-rank P=0.018, HR=1.501, 95%
CI=1.067–2.225, Fig. 1F) and PFS
(log-rank P=0.027, HR=1.476, 95% CI=1.034–2.107, Fig. 1G) than those with low CapG
expression.
Next, our univariate and multivariate Cox regression
analyses revealed that high CapG expression was an independent risk
predictor of both OS (P=0.003, HR=1.674, 95% CI=1.198–2.339) and
PFS (P=0.008, HR=0.008, 95% CI=1.123–2.12) in our cohort (Table II). In addition, we further
identified CapG as an independent prognostic factor for OS
(P=0.021, HR=1.541, 95% CI=1.067–2.225) and PFS (P=0.032, HR=1.476,
95% CI=1.034–2.107) of HGG patients; higher levels of CapG
predicted poorer survival (Table
II).
| Table II.Univariate and multivariate Cox
regression of CapG immunoreactivity for OS and PFS in all glioma
and HGG patients of the Chinese TMA cohort. |
Table II.
Univariate and multivariate Cox
regression of CapG immunoreactivity for OS and PFS in all glioma
and HGG patients of the Chinese TMA cohort.
|
| Univariate Cox
regression | Multivariate Cox
regression |
|---|
|
|
|
|
|---|
|
Characteristics | P-value | HR (95% CI) | P-value | HR (95% CI) |
|---|
| All glioma cases
(N=292) |
| OS |
|
Sex (male vs.
female) | 0.587 |
|
|
|
|
Age, years (≥60
vs. <60) | 0.004 | 1.844
(1.220–2.786) | 0.037 | 1.580
(1.027–2.429) |
|
Tumor origin
(secondary vs. primary) | 0.676 |
|
|
|
|
Resection (gross
total vs. patial) | 0.041 | 1.370
(1.013–1.852) | 0.825 |
|
|
Necrosis (negative
vs. positive) | 0.005 | 1.842
(1.198–2.833) | 0.076 |
|
|
Grade (III+IV vs.
I+II) |
1.069E-18 | 6.080
(4.072–9.077) |
1.079E-14 | 5.307
(3.476–8.103) |
|
CapG cytoplasm
(high vs. low) |
2.553E-06 | 2.171
(1.572–2.999) | 0.003 | 1.674
(1.198–2.339) |
|
PFS |
|
Sex (male vs.
female) | 0.597 |
|
|
|
|
Age, years (≥60
vs.<60) | 0.001 | 1.976
(1.307–2.986) | 0.003 | 1.806
(1.215–2.684) |
|
Tumor origin
(secondary vs. primary) | 0.315 |
|
|
|
|
Resection (gross
total vs. patial) | 0.067 |
|
|
|
|
Necrosis (negative
vs. positive) | 0.001 | 2.090
(1.358–3.217) | 0.138 |
|
|
Grade (III+IV vs.
I+II) |
1.911E-19 | 6.409
(4.279–9.594) |
1.424E-14 | 4.456
(3.045–6.519) |
|
CapG cytoplasm
(high vs. low) |
3.334E-04 | 1.913
(1.408–2.600) | 0.008 | 1.543
(1.123–2.120) |
| HGG (N=174) |
| OS |
|
Sex (male vs.
female) | 0.522 |
|
|
|
|
Age, years years
(≥60 vs. <60) | 0.303 |
|
|
|
|
Tumor origin
(secondary vs. primary) | 0.055 |
|
|
|
|
Resection (gross
total vs. patial) | 0.408 |
|
|
|
|
Necrosis (negative
vs. positive) | 0.817 |
|
|
|
|
CapG cytoplasm
(high vs. low) | 0.021 | 1.541
(1.067–2.225) | 0.021 | 1.541
(1.067–2.225) |
|
PFS |
|
Sex (male vs.
female) | 0.350 |
|
|
|
|
Age, years (≥60
vs. <60) | 0.104 |
|
|
|
|
Tumor origin
(secondary vs. primary) | 0.142 |
|
|
|
|
Resection (gross
total vs. patial) | 0.463 |
|
|
|
|
Necrosis (negative
vs. positive) | 0.373 |
|
|
|
|
CapG cytoplasm
(high vs. low) | 0.032 | 1.476
(1.034–2.107) | 0.032 | 1.476
(1.034–2.107) |
CapG gene expression is upregulated in
GBM specimens and is correlated with several molecular alterations
in the TCGA cohort
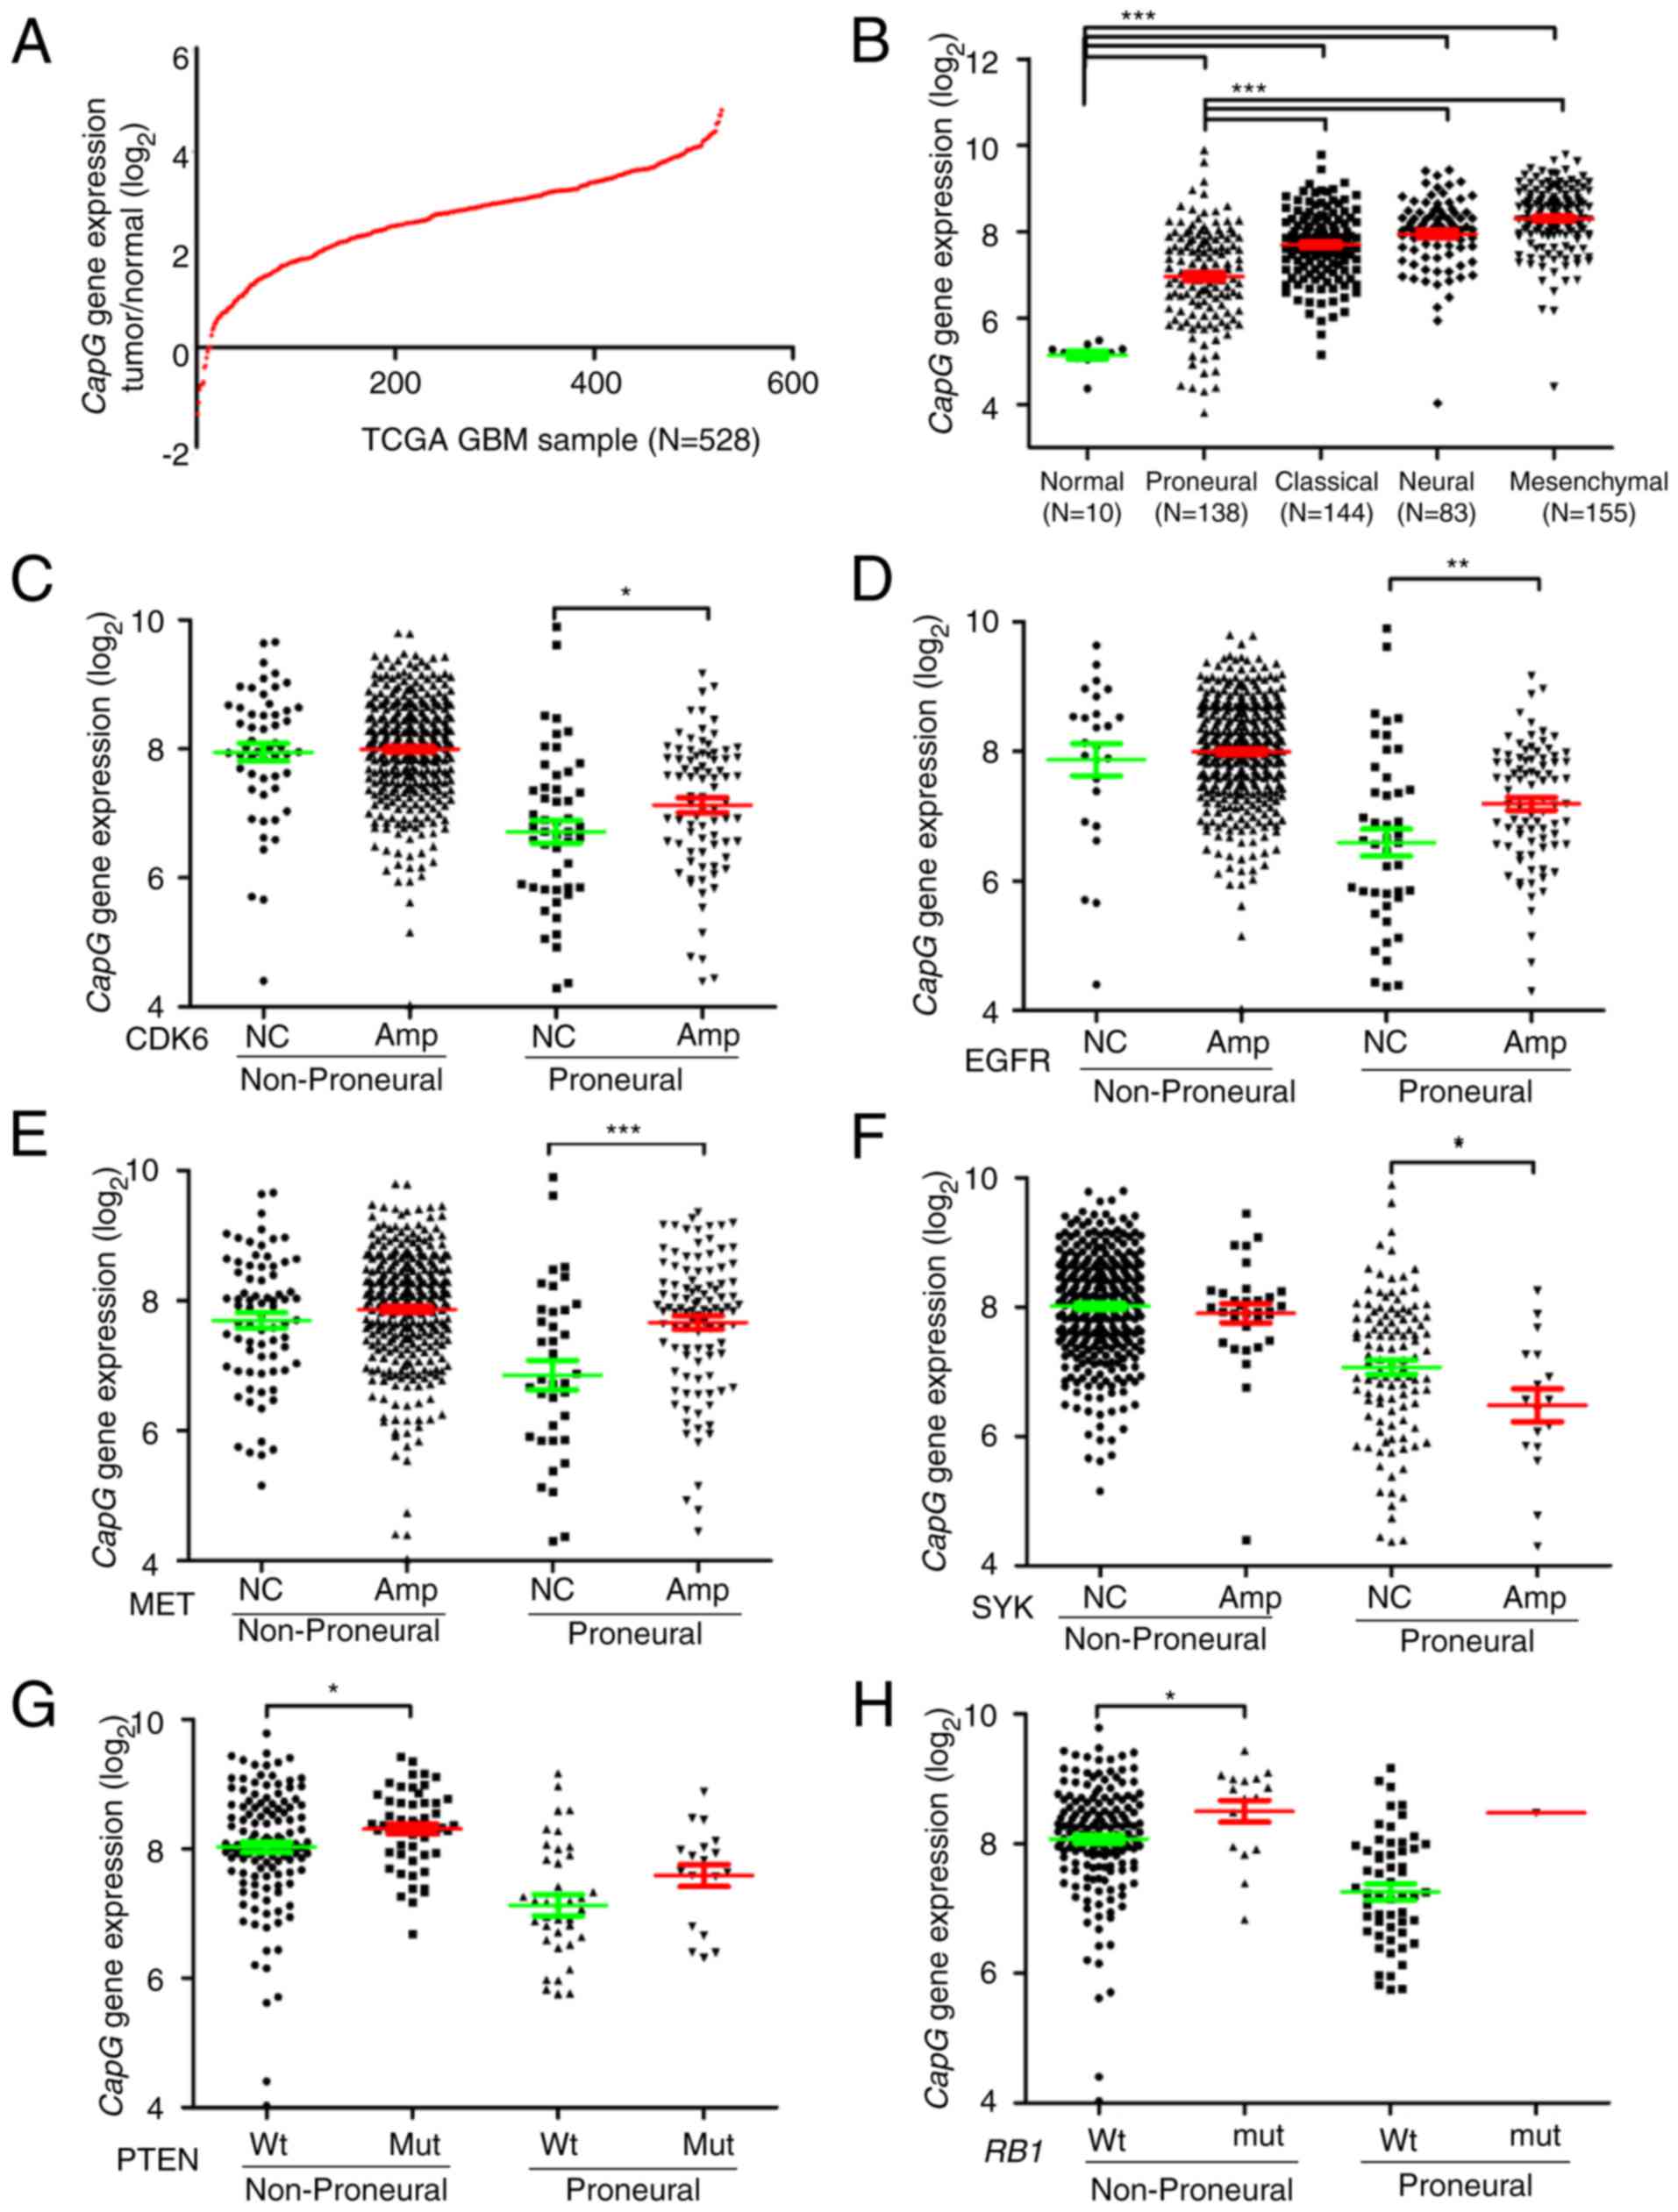
We next investigated the expression profile of the
CapG gene in an independent cohort from TCGA (13). Consequently, mRNA expression of CapG
increased in 97.7% (516/528) of the GBM specimens compared to the
normal controls (Fig. 2A). Since
TCGA network has introduced a novel molecular classification of GBM
according to gene expression, which are proneural, neural,
classical and mesenchymal (28), we
then assessed CapG expression in each of these subtypes. As
shown in Fig. 2B, we observed that
CapG expression was drastically decreased in the proneural
subtype in comparison with the others. Nevertheless, CapG
expression was still elevated in GBM samples.
To further explore the expression profile of the
CapG gene, we scanned associations between its expression
and these common genetic alterations in GBM (13,29)
including amplifications of CDK4, CDK6, EGFR,
AKT3, PDGFRA, MDM2, MET, MDM4,
MYCN, CCND2, PIK3CA, mutations in PTEN,
TP53, IDH1, EGFR, NF1, RB1,
PIK3R1, ATRX, PIK3CA, CTNND2,
SPTA1, GABRA6, LZTR1, and deletions of
PTEN, CDKN2A, CDKN2B, CDKN2C, NF1,
PARK2, RB1. As a result, we found that CapG
expression exhibited a correlation with the amplification of
CDK6, EGFR, MET, SYK, ANXA1,
MYCN, PDGFRA, and mutations of PTEN,
IDH1, RB1.
Since we ascertained that CapG expression is
correlated with the GBM subtype, we then explored whether the
differential CapG expression with the above-mentioned common
genetic alterations was dependent on the specific subtype.
Consequently, cases with CDK6 amplification or EGFR
amplification or MET amplification had higher levels of
CapG expression than those with no copy number alterations
in the proneural subtype, while there were no dramatic changes in
non-proneural subtypes (Fig. 2C-E).
Moreover, cases with SYK amplification had lower CapG
expression level than those with no copy number alterations in the
proneural subtype, and there was also no obvious change in the
non-proneural subtype (Fig. 2F). In
contrast, cases with PTEN mutation or RB1 mutation
showed a higher level of CapG expression than cases with
wild-type only in the non-proneural subtype (Fig. 2G and H). However, cases with
ANXA1 amplification, MYCN amplification,
PDGFRA amplification, or IDH1 mutation exhibited no
significant CapG expression change in the proneural or
non-proneural subtypes when compared with those without these
genetic alterations (data available on request).
High expression of CapG significantly
predicts unfavorable clinical outcome of GBM patients in the TCGA
cohort
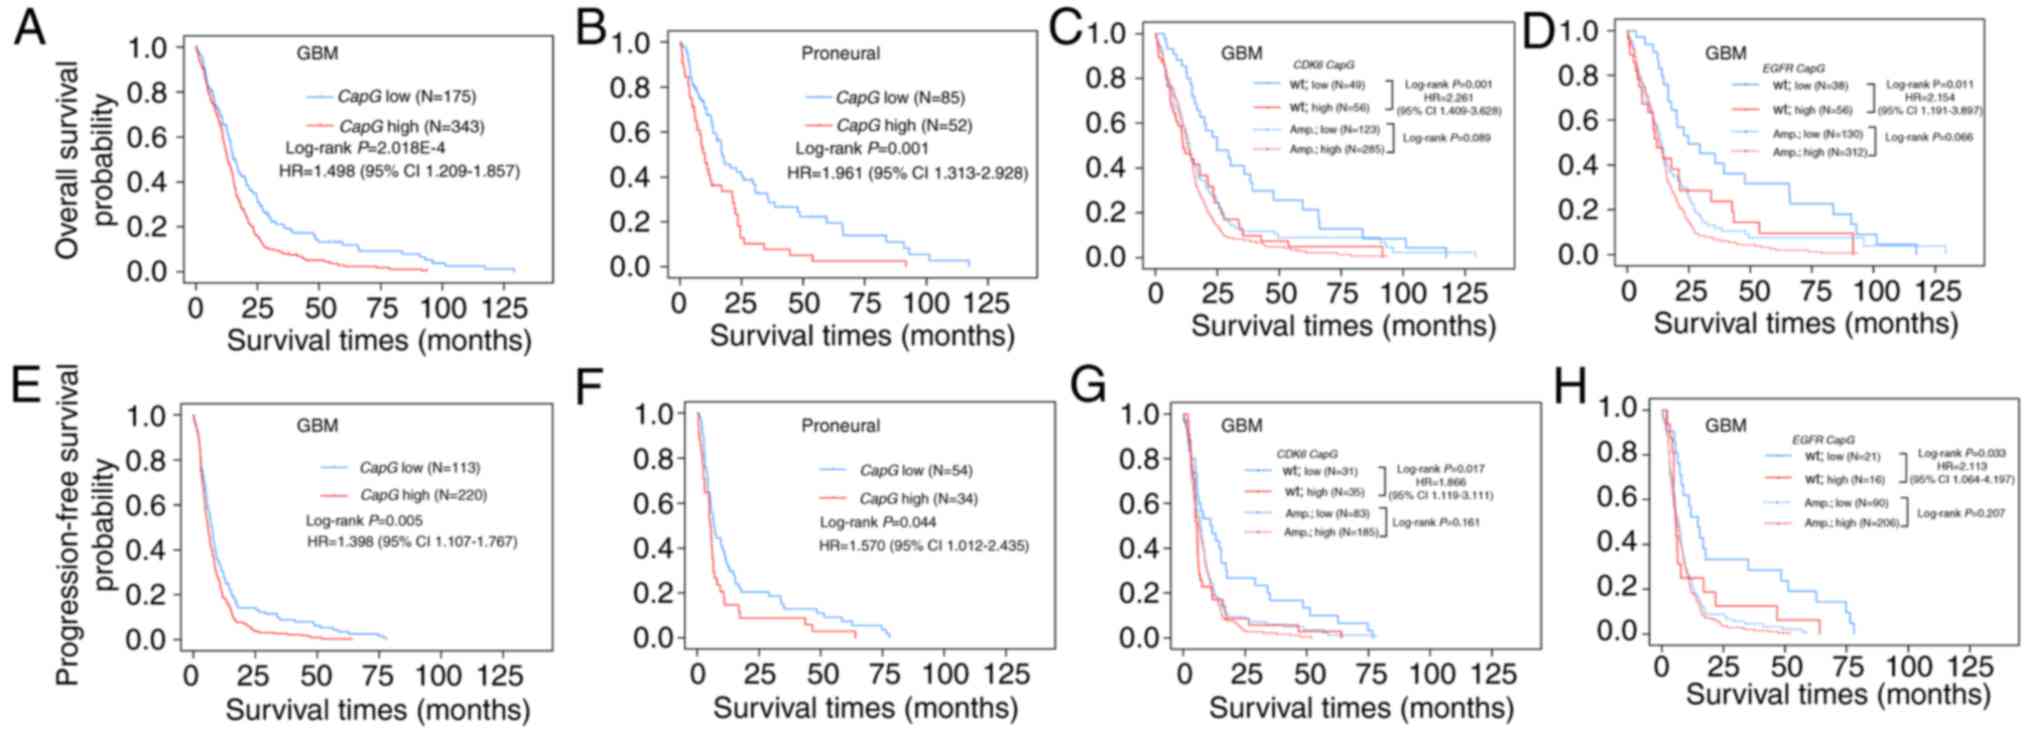
To further explore the relationship between
CapG expression and GBM patient clinical outcome in the TCGA
cohort, we compared the OS and PFS of all GBM patients with
differential CapG expression and observed statistically
significant disadvantage in prognosis for GBM patients with higher
CapG expression (OS, log-rank P=2.018E-04, HR=1.498, 95%
CI=1.209–1.857, Fig. 3A; PFS,
log-rank P=0.005, HR=1.398, 95% CI=1.107–1.767, Fig. 3E). Multivariate Cox regression
further validated the CapG expression as an independent
predictor for the GBM patient OS (P=0.002, HR=1.546, 95%
CI=1.170–2.042) and PFS (P=0.029, HR=1.400, 95% CI=1.035–1.893) in
the TCGA cohort (Table III).
| Table III.Univariate and multivariate Cox
regression of CapG expression for OS and PFS in GBM patients
of the TCGA cohort. |
Table III.
Univariate and multivariate Cox
regression of CapG expression for OS and PFS in GBM patients
of the TCGA cohort.
|
| Univariate Cox
regression | Multivariate Cox
regression |
|---|
|
|
|
|
|---|
|
Characteristics | P-value | HR (95% CI) | P-value | HR (95% CI) |
|---|
| GBM (N=528) |
| OS |
|
Sex (male vs.
female) | 0.464 |
|
|
|
|
Age, years (>60
vs. <60) |
1.415E-10 | 1.938
(1.583–2.372) |
1.577E-04 | 1.609
(1.257–2.058) |
|
Tumor origin
(secondary vs primary) |
4.415E-05 | 0.394
(0.252–0.616) | 0.021 | 0.558
(0.339–0.917) |
|
Subtype (proneural
vs. non-proneural) | 0.038 | 0.786
(0.626–0.986) | 0.024 | 1.425
(1.047–1.940) |
|
EGFR
(amplification vs. wild-type) |
1.066E-04 | 1.846
(1.354–2.518) | 0.372 |
|
|
CDK6
(amplification vs. wild-type) | 0.002 | 1.495
(1.162–1.922) | 0.413 |
|
|
SYK
(amplification vs. wild-type) | 0.831 |
|
|
|
|
MYCN
(amplification vs. wild-type) | 0.087 |
|
|
|
|
MET
(amplification vs. wild-type) | 0.030 | 1.275
(1.023–1.589) | 0.299 |
|
|
PTEN
(mutation vs. wild-type) | 0.863 |
|
|
|
|
RB1
(mutation vs. wild-type) | 0.363 |
|
|
|
|
IDH1
(mutation vs. wild-type) |
1.003E-04 | 0.373
(0.227–0.613) | 0.019 | 0.486
(0.266–0.887) |
|
CAPG
expression (high vs. low) |
2.246E-04 | 1.498
(1.209–1.857) | 0.002 | 1.546
(1.170–2.042) |
|
PFS |
|
Sex (male vs.
female) | 0.350 |
|
|
|
|
Age, years (>60
vs. <60) |
7.769E-05 | 1.566
(1.254–1.956) | 0.114 |
|
|
Tumor origin
(secondary vs primary) |
1.821E-06 | 0.294
(0.178–0.486) |
3.154E-04 | 0.350
(0.197–0.619) |
|
Subtype (proneural
vs. non-proneural) | 0.038 | 0.762
(0.589–0.985) | 0.022 | 1.493
(1.060–2.104) |
|
EGFR
(amplification vs. wild-type) |
4.563E-05 | 2.197
(1.505–3.208) | 0.011 | 2.384
(1.223–4.648) |
|
CDK6
(amplification vs. wild-type) | 0.025 | 1.375
(1.041–1.816) | 0.876 |
|
|
SYK
(amplification vs. wild-type) | 0.193 |
|
|
|
|
MYCN
(amplification vs. wild-type) | 0.619 |
|
|
|
|
MET
(amplification vs. wild-type) | 0.184 |
|
|
|
|
PTEN
(mutation vs. wild-type) | 0.780 |
|
|
|
|
RB1
(mutation vs. wild-type) | 0.816 |
|
|
|
|
IDH1
(mutation vs. wild-type) | 0.015 | 0.501
(0.287–0.872) | 0.845 |
|
|
CAPG
expression (high vs. low) | 0.005 | 1.398
(1.107–1.767) | 0.029 | 1.400
(1.035–1.893) |
Moreover, we next performed survival analysis for
each molecular subtype and detected that only the proneural (OS,
log-rank P=0.001; HR=1.961, 95% CI=1.313–2.928, Fig. 3B; PFS, log-rank P=0.044; HR=1.570,
95% CI=1.012–2.435, Fig. 3F)
subtype retained statistical significance. In addition, we carried
out survival analyses stratified by the status of these common
genetic alterations in GBM and found the effect of CapG on
GBM patient prognosis was associated with EGFR amplification
or CDK6 amplification. It is noteworthy that the prognostic
value of CapG was highly significant in individuals with
wild-type CDK6 (OS, log-rank P=0.001, HR=2.261, 95%
CI=1.409–3.628, Fig. 3C; PFS,
log-rank P=0.017, HR=1.966, 95% CI=1.119–3.111, Fig. 3G) or EGFR (OS, log-rank
P=0.011, HR=2.154, 95% CI=1.191–3.897, Fig. 3D; PFS, log-rank P=0.033, HR=2.113,
95% CI=1.064–4.197, Fig. 3H), but
not significant in individuals with amplification of CDK6 or
EGFR. Furthermore, patients with low CapG expression
and wild-type EGFR or CDK6 had the most favorable
prognosis, whereas patients with high CapG expression and
amplification of EGFR or CDK6 had the poorest
prognosis (Fig. 3C, D, G and
H).
CapG regulates glioma cell
proliferation in vitro
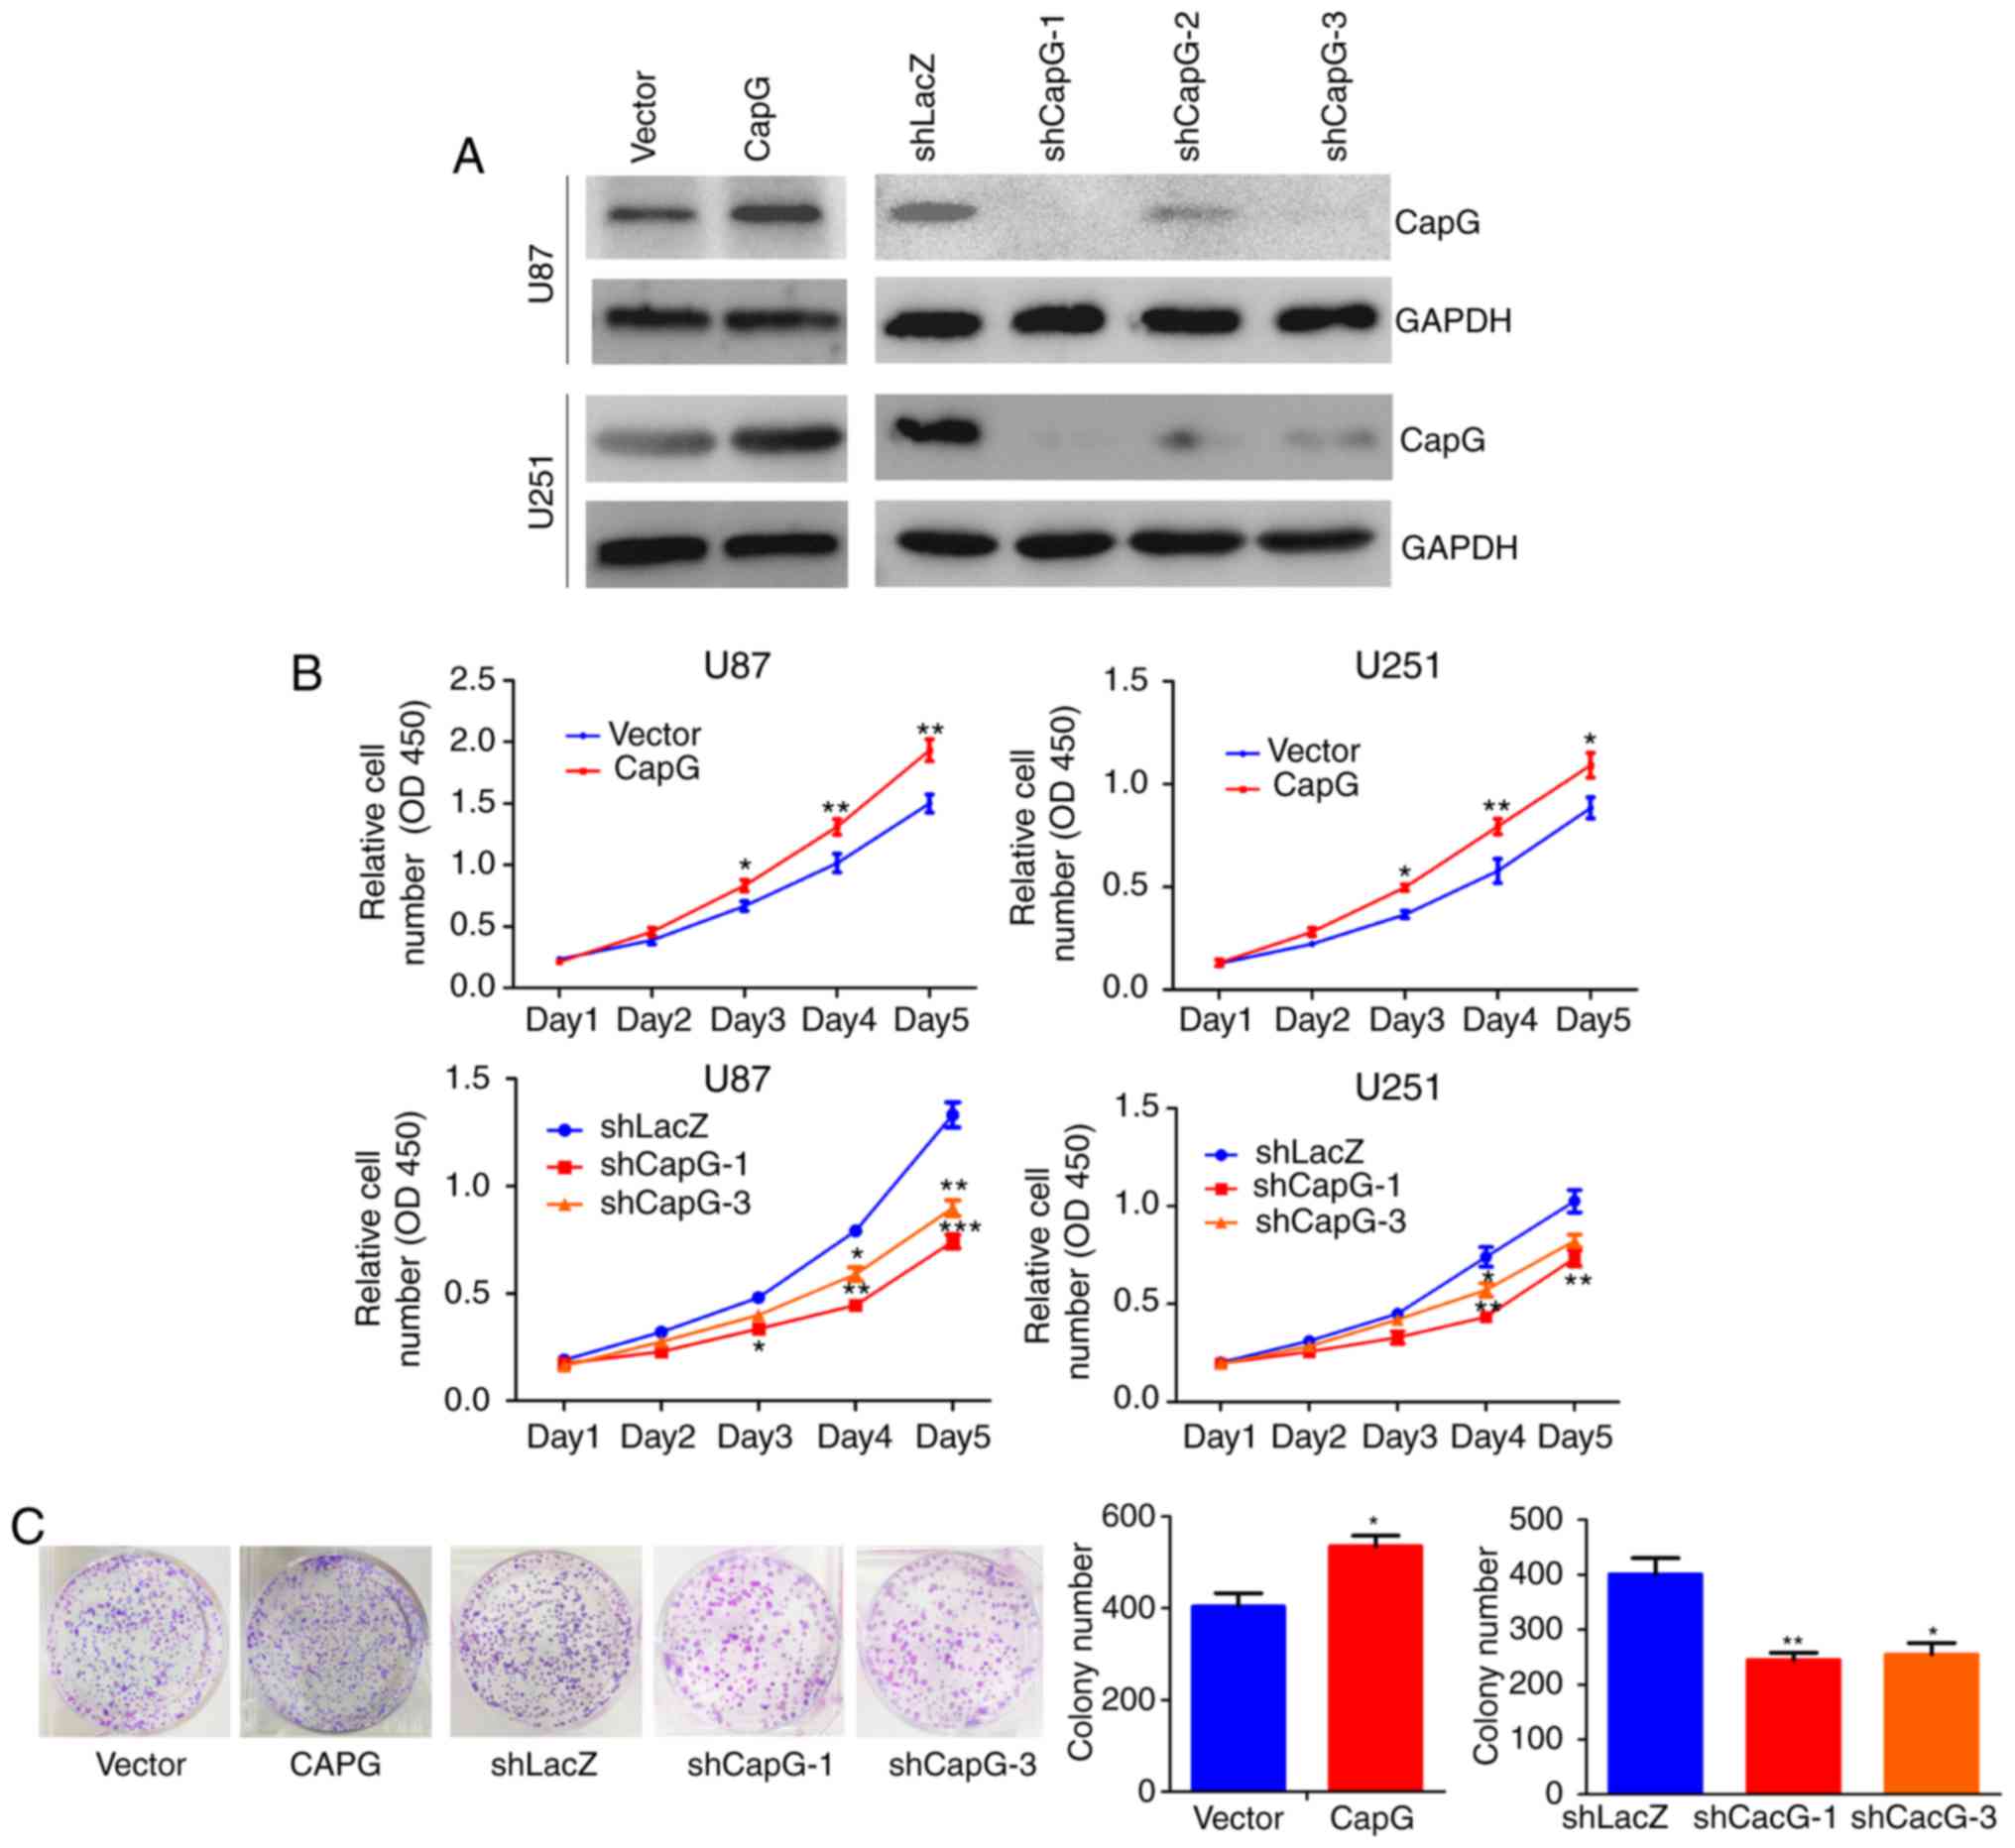
Given that CapG is significantly upregulated in
human glioma, we inferred that CapG may promote glioma cell
proliferation. To confirm our hypothesis, we performed lentiviral
infection to stably overexpress or knockdown CapG in U87 and U251
glioma cells. The efficiency of ectopic expression of CapG was
verified by real-time PCR (data not shown) and western blotting
(Fig. 4A). Thus shCAPG-1 and
shCAPG-3 were chosen for the following study according to their
silencing efficiency.
We then studied the effect of CapG on cellular
proliferation in U87 and U251 cells using CCK-8 assay. The results
showed that overexpression of CapG significantly promoted the
proliferation in comparison with the control groups, whereas
knockdown of endogenous CapG markedly inhibited cellular growth in
both cell lines (Fig. 4B). Colony
formation assay consistently showed that overexpression of CapG in
U251 cells markedly increased the number of colonies, whereas
knockdown of CapG significantly decreased the colony numbers
compared with the controls (Fig.
4C).
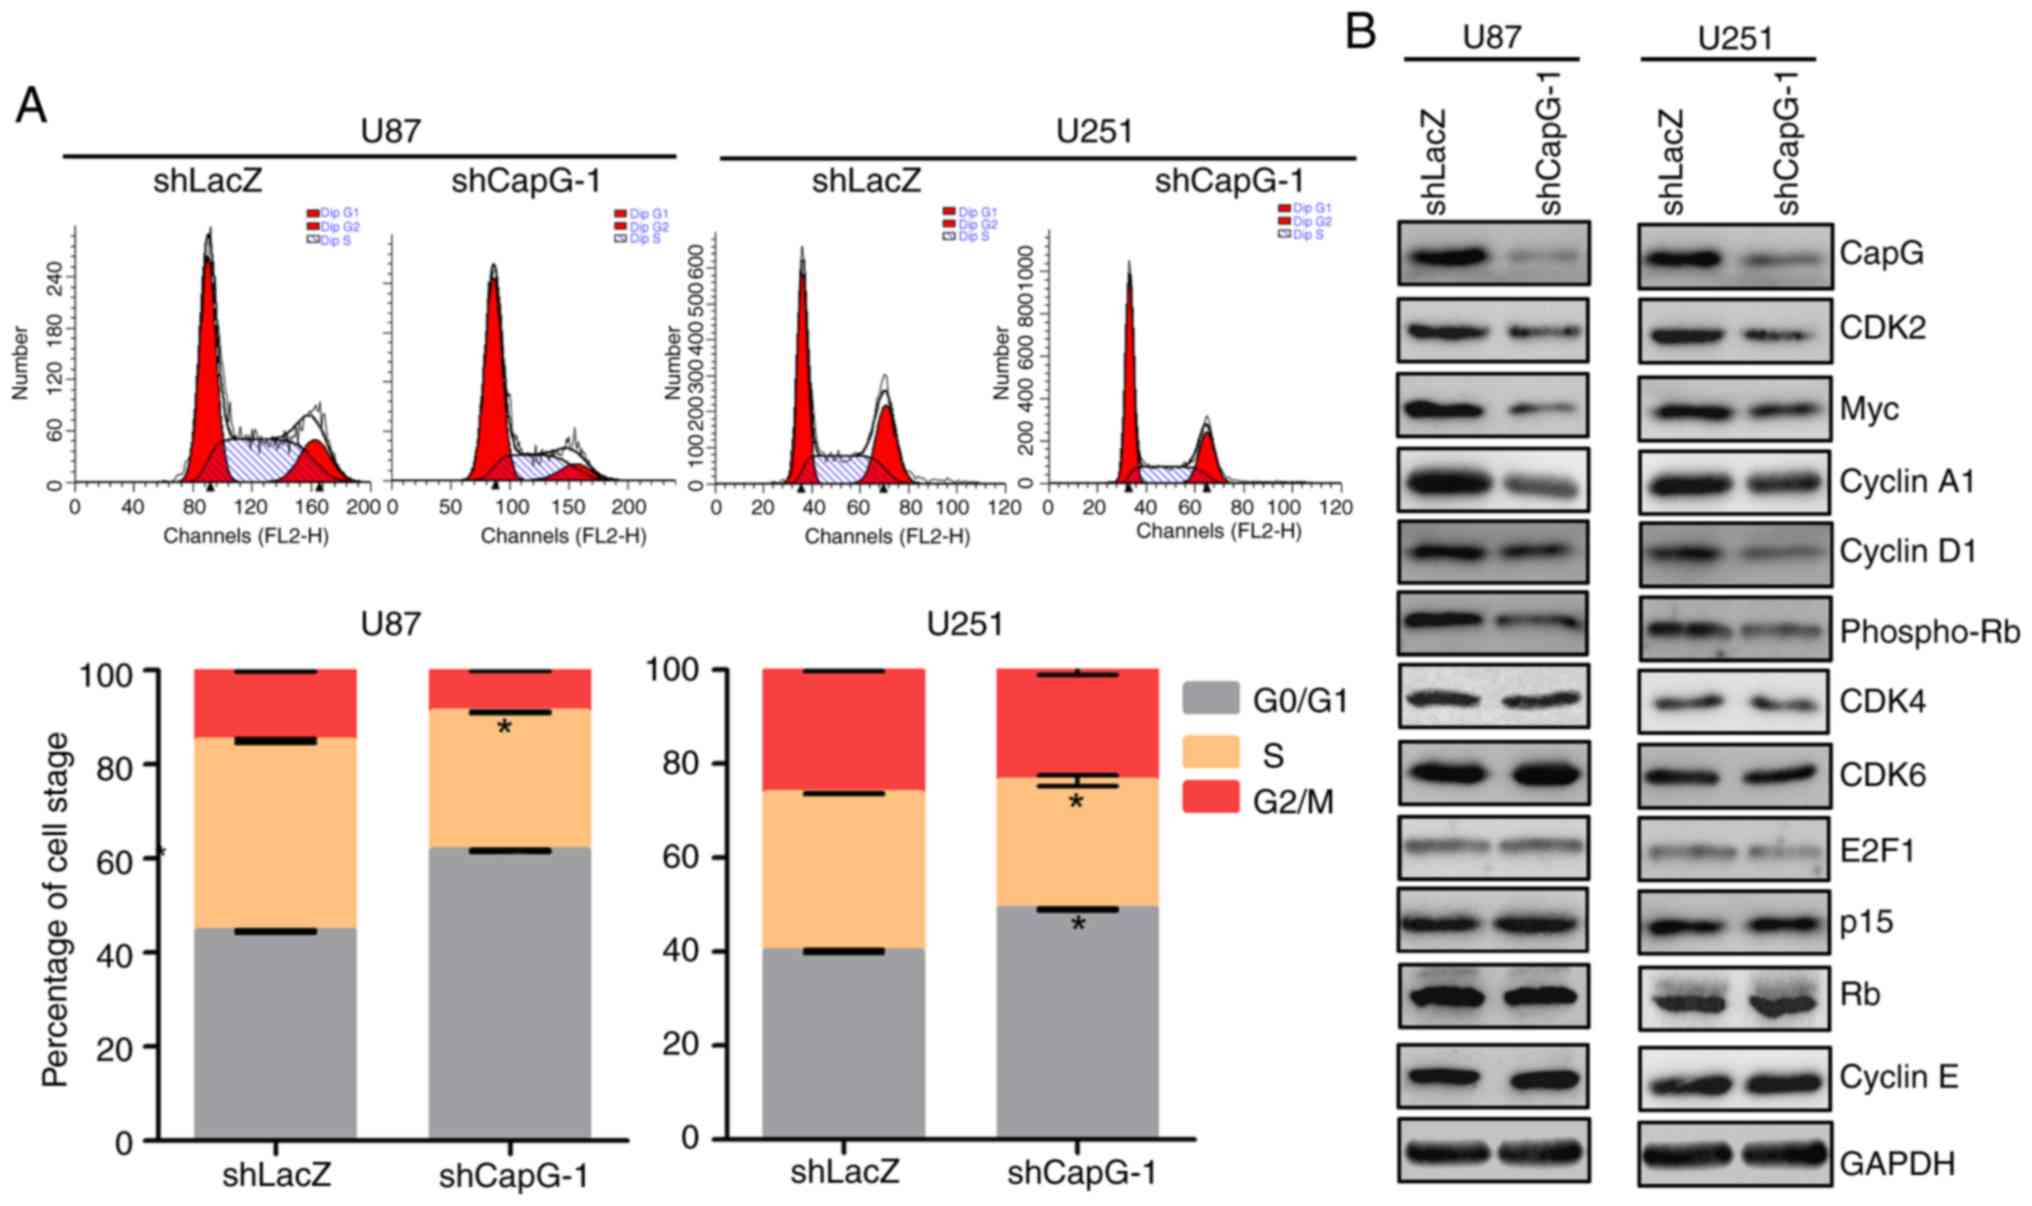
CapG regulates G1/S phase progression
of the glioma cell cycle
To elucidate the mechanism by which depletion of
CapG inhibits cell proliferation in U87 and U251 cells, we
performed flow cytometry to analyze whether the inhibition is
correlated with specific cell cycle changes. Compared with the
shLacZ groups, U87 and U251 cells with CapG depletion showed marked
increases in the percentage of cell in the G0/G1 phase and
substantial decrease in the S phase (Fig. 5A). To further investigate the
molecules involved in the changes in the cell cycle, we determined
the expression of several important regulators of the G1 phase by
western blot assays (30–32). As shown in Fig. 5B, we observed that depletion of CapG
significantly suppressed CDK2, Myc, cyclin A1 and D1, and
phospho-RB expression in the U87 and U251 cells. However, the
expression levels of cyclin E, CDK4, CDK6, E2F1, p15 and RB had no
significant changes after CapG depletion. Collectively, these
results suggest that knockdown of endogenous CapG induces G0/G1
cell cycle arrest in glioma cells.
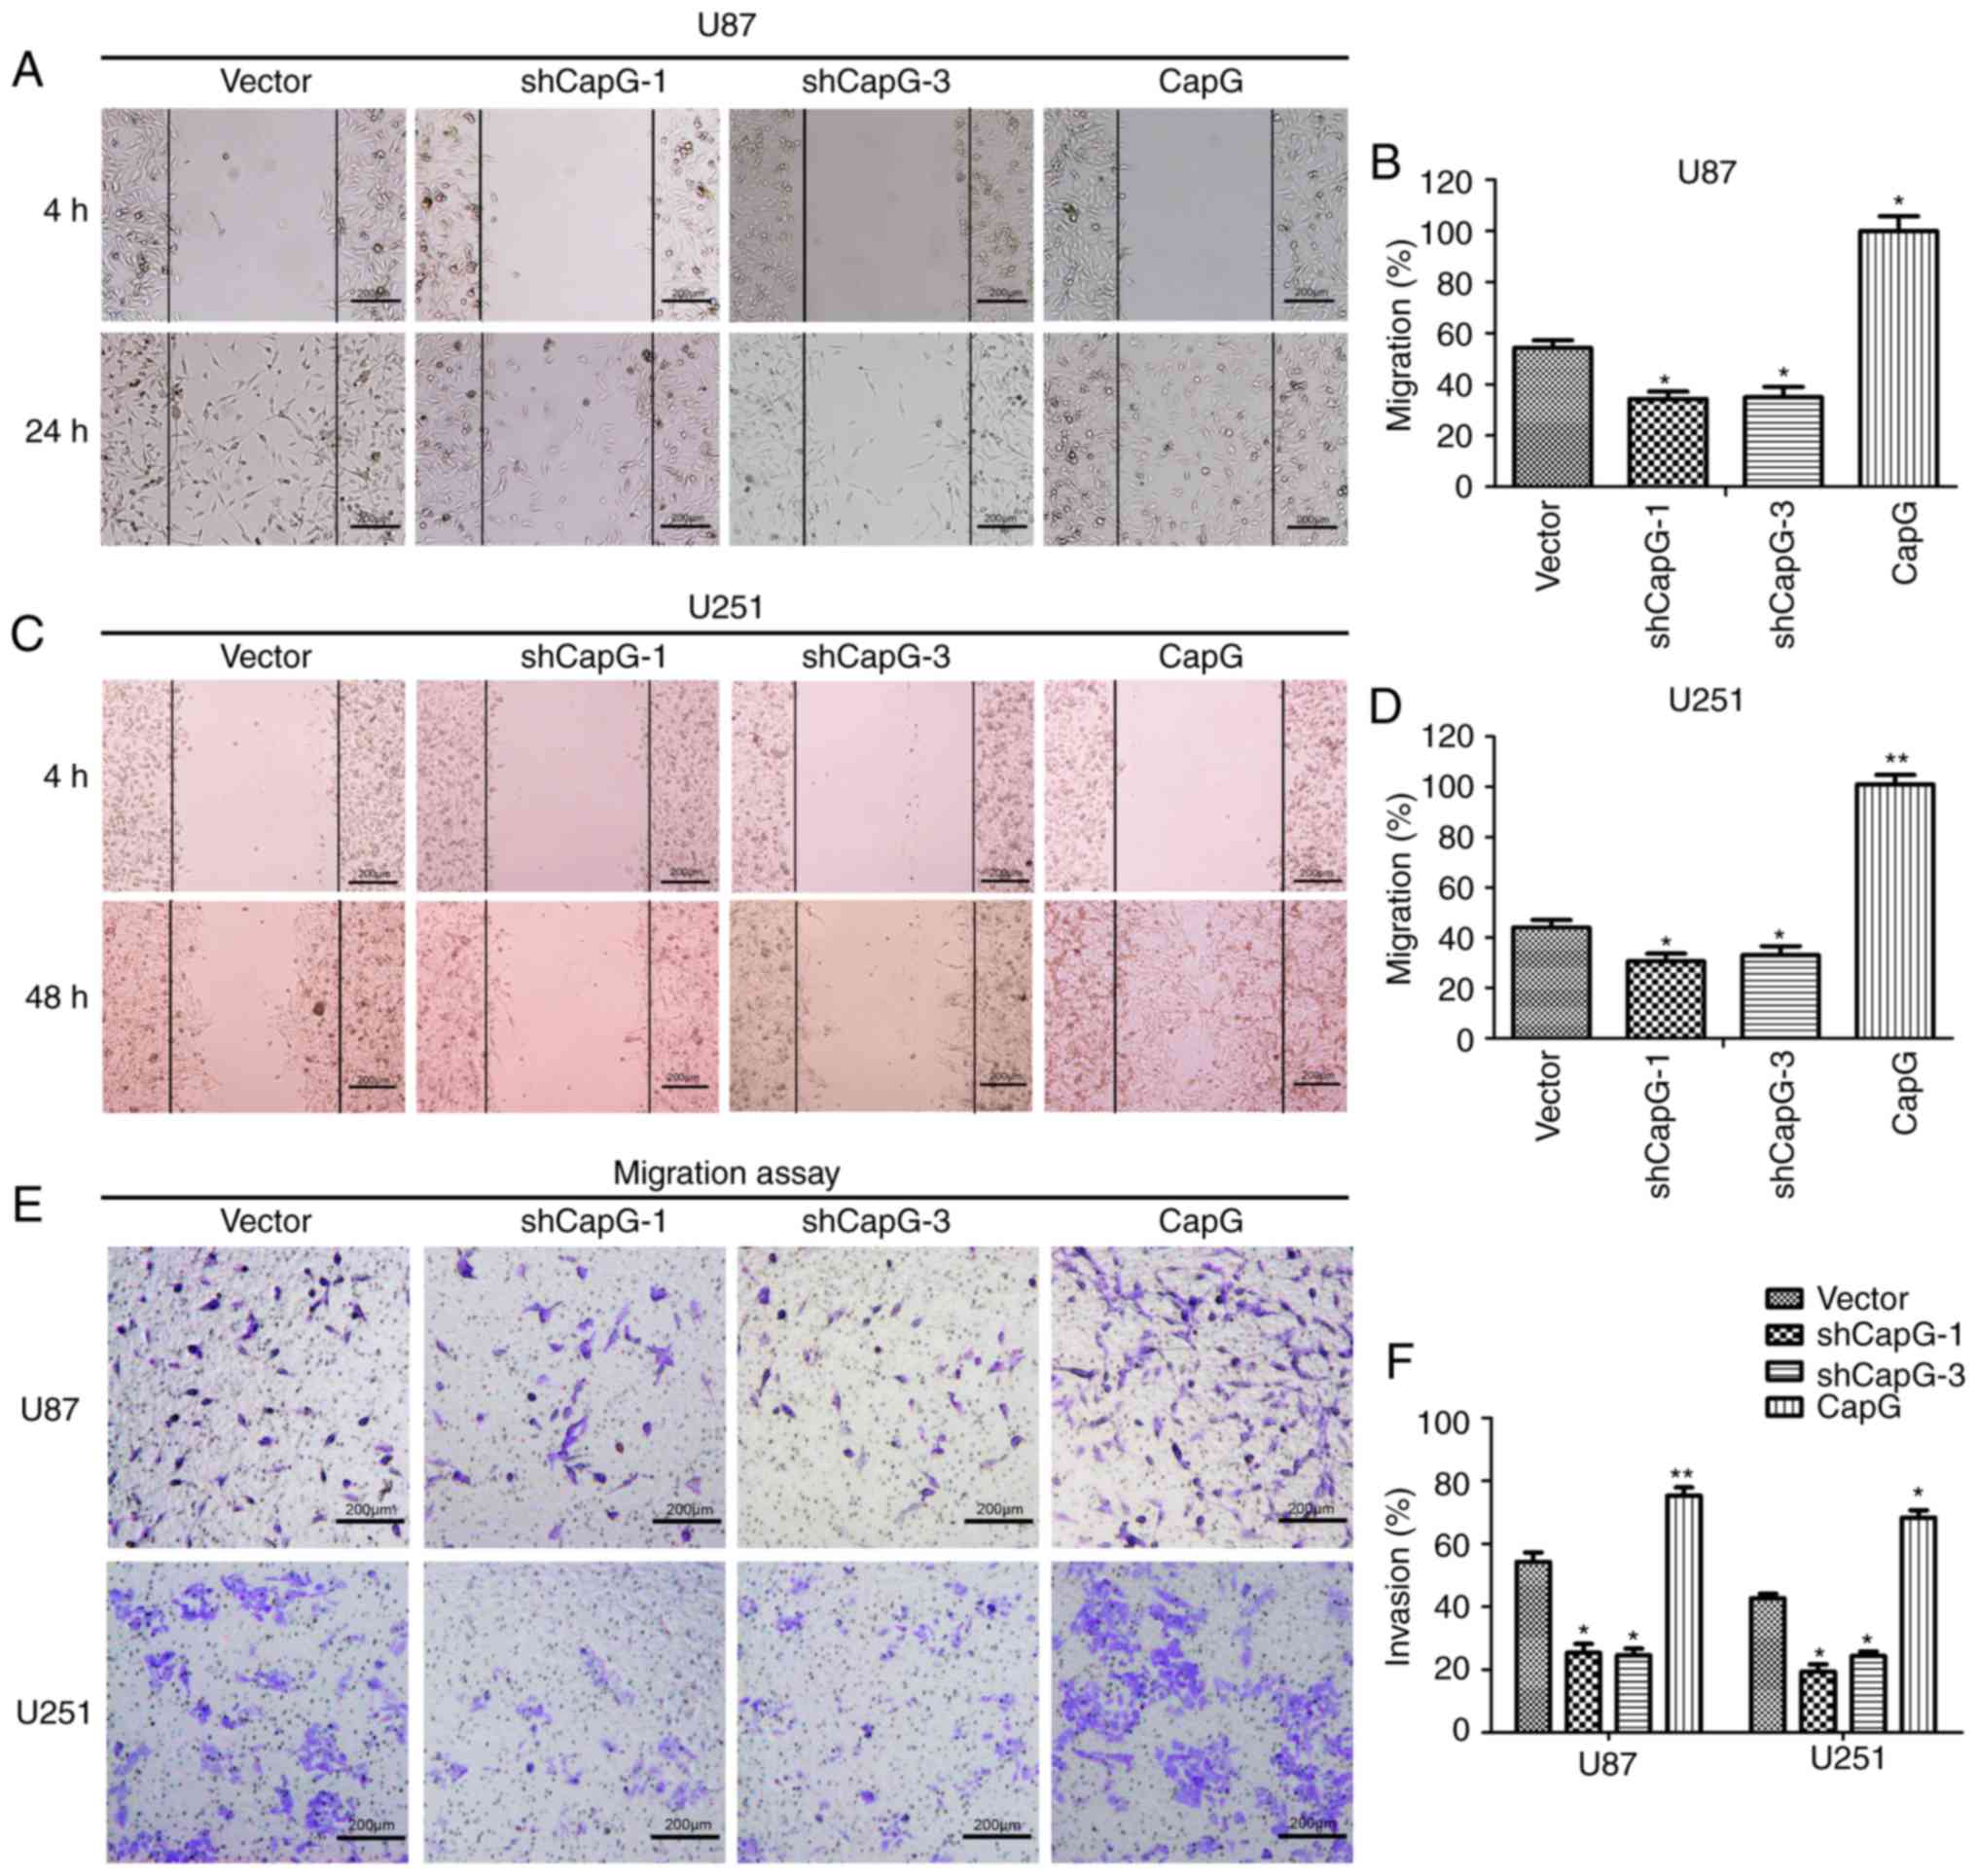
Ectopic CapG expression affects glioma
cell migration and invasiveness
Recent research has shown that suppression of CapG
expression influences the metastasis of prostate cancer cells
(20,29). We then examined the impact of CapG
on glioma cell migration and invasiveness in vitro. In wound
healing assays, CapG overexpression increased cell migration
markedly within 24 or 48 h compared to the control cells, while
silencing of CapG resulted in slower wound healing (Fig. 6A-D). However, the effect on cell
invasiveness was next assessed by Transwell invasion assays.
Consistent with the abovementioned migration analyses, CapG
upregulation substantially increased the invasive ability of the
glioma cells while CapG depletion resulted in a significant
decrease in invasiveness of the cells (Fig. 6E and F). Therefore, glioma cell
migration and invasiveness were positively correlated with CapG
expression levels.
Discussion
In the present study, we demonstrated the prognostic
value of CapG as well as its important role in proliferation and
metastasis of glioma. In the TCGA data analysis, we attempted to
explore the correlation of CapG with common genetic
alterations of GBM. Notably, we noted that CapG expression
was correlated to several of them (amplifications of CDK6,
EGFR, MET and SYK, mutations of PTEN
and RB1), and the correlation was only observed in
non-proneural or proneural subtype. These data provide a clue for
further study of the regulation of CapG expression in GBM
patients. Moreover, we investigated the influence of differential
CapG expression on GBM patient prognosis stratified by these
molecular alterations. Kaplan-Meier analysis suggested that the
prognostic significance of CapG was dependent on the status
of EGFR or CDK6 alteration.
EGFR is a vital oncogene found in many
malignancies, and the majority of GBM show activated EGFR
signaling through its amplification or genetic alteration, which
drives the proliferation and metastasis of glioma cells (33). However, EGFR, CDK6, a G1 cell cycle
regulatory protein, is upregulated in glioma tissues and mediates
glioma cell proliferation and migration (34). As the expression of CapG was
only correlated with the amplification of EGFR/CDK6
in the proneural subtype, we inferred that the proneural gene
expression profile mediated the interaction between
EGFR/CDK6 and CapG. Therefore, the change in
CapG expression level could further influence the
proliferation and metastasis of glioma.
CapG, an actin binding protein, modulates the
dynamics of the actin cytoskeleton and aberrant turnover of the
actin cytoskeleton, which are closely associated with cell
proliferation and motility (35).
There is evidence that the CapG expression level is related to
tumor cell proliferation and metastasis (36,37),
and may be valuable for evaluating tumor progression and prognosis.
For example, overexpression of CapG may be associated with tumor
progression, as CapG protein is significant increased in pancreatic
ductal adenocarcinoma and lung adenocarcinoma (38–40).
CapG expression was also found to be upregulated in ovarian cancer
and is possibly associated with survival outcome and advanced
disease stage (20). In the present
study, the mRNA and protein levels of CapG were significantly
increased in human glioma, and higher CapG expression was an
independent prognostic factor for predicting unfavorable prognosis.
In subsequent function validation, CapG promoted cell proliferation
and mediated G1/S transition in glioma cell lines U87 and U251.
These results suggest that CapG is a putative oncogene in
human glioma.
Recent findings have demonstrated that cancer
metastasis and diffusion rely on increased tumor cell motility by
accelerating cytoplasmic actin turnover (35). In the present study, the wound
healing and Transwell invasion assays indicated that CapG plays a
critical role in glioma migration and invasiveness. It has been
reported that nuclear complexes are significant for migration and
invasiveness (41). Furthermore,
nuclear complexes carry nuclear actin and are modified by actin
binding protein (41). Given that
CapG is an actin binding protein, and elevated CapG is found at the
tumor invasion interface zone in breast cancer (42), we postulated that CapG expression
may directly modulate cell migration and invasion.
In summary, the present study illustrated that CapG
expression was significantly elevated in human glioma, and it
predicted an unfavorable prognosis of glioma as a novel and
independent prognostic factor, which was confirmed in a TMA
analyses of a Chinese cohort and the independent TCGA dataset. In
addition, the expression profile and prognostic value of CapG were
correlated with different subtypes and several molecular features
of GBM. Furthermore, CapG plays an important role in the
proliferation and metastasis of glioma cells, suggesting its
application as a promising therapeutic target of human glioma.
Acknowledgements
This study was supported by the National Natural
Science Foundation of China (grant nos. 81772657, 81372706,
81372235 and 81071739). We thank Bo Zhu (School of Life Sciences,
Fudan University) for his help with the Transwell invasion assays.
We further thank all participants recruited in the present
study.
Competing interests
The authors declare that they have no competing
interests.
Glossary
Abbreviations
Abbreviations:
|
CapG
|
capping actin protein,
gelsolin-like
|
|
GBM
|
glioblastoma
|
|
CCK-8
|
Cell Counting Kit-8
|
|
TMA
|
tissue microarray
|
|
TCGA
|
The Cancer Genome Atlas
|
|
LGG
|
low-grade glioma
|
|
HGG
|
high-grade glioma
|
|
OS
|
overall survival
|
|
PFS
|
progression-free survival
|
|
HR
|
hazard ratio
|
|
CI
|
confidence interval
|
References
|
1
|
Ostrom QT, Gittleman H, Farah P, Ondracek
A, Chen Y, Wolinsky Y, Stroup NE, Kruchko C and Barnholtz-Sloan JS:
CBTRUS statistical report: Primary brain and central nervous system
tumors diagnosed in the United States in 2006–2010. Neuro Oncol. 15
Suppl 2:ii1–ii56. 2013. View Article : Google Scholar : PubMed/NCBI
|
|
2
|
Westphal M and Lamszus K: The neurobiology
of gliomas: From cell biology to the development of therapeutic
approaches. Nat Rev Neurosci. 12:495–508. 2011. View Article : Google Scholar : PubMed/NCBI
|
|
3
|
Stupp R, Mason WP, Van den Bent MJ, Weller
M, Fisher B, Taphoorn MJ, Belanger K, Brandes AA, Marosi C, Bogdahn
U, et al: Radiotherapy plus concomitant and adjuvant temozolomide
for glioblastoma. N Engl J Med. 352:987–996. 2005. View Article : Google Scholar : PubMed/NCBI
|
|
4
|
Van Meir EG, Hadjipanayis CG, Norden AD,
Shu HK, Wen PY and Olson JJ: Exciting new advances in
neuro-oncology: The avenue to a cure for malignant glioma. CA
Cancer J Clin. 60:166–193. 2010. View Article : Google Scholar : PubMed/NCBI
|
|
5
|
Tanaka S, Louis DN, Curry WT, Batchelor TT
and Dietrich J: Diagnostic and therapeutic avenues for
glioblastoma: No longer a dead end? Nat Rev Clin Oncol. 10:14–26.
2013. View Article : Google Scholar : PubMed/NCBI
|
|
6
|
Gilbert MR, Dignam JJ, Armstrong TS, Wefel
JS, Blumenthal DT, Vogelbaum MA, Colman H, Chakravarti A, Pugh S,
Won M, et al: A randomized trial of bevacizumab for newly diagnosed
glioblastoma. N Engl J Med. 370:699–708. 2014. View Article : Google Scholar : PubMed/NCBI
|
|
7
|
Sun Y, Zhang W, Chen D, Lv Y, Zheng J,
Lilljebjorn H, Ran L, Bao Z, Soneson C, Sjogren HO, et al: A glioma
classification scheme based on coexpression modules of EGFR and
PDGFRA. Proc Natl Acad Sci USA. 111:pp. 3538–3543. 2014; View Article : Google Scholar : PubMed/NCBI
|
|
8
|
Yan W, Zhang W, You G, Zhang J, Han L, Bao
Z, Wang Y, Liu Y, Jiang C, Kang C, et al: Molecular classification
of gliomas based on whole genome gene expression: A systematic
report of 225 samples from the Chinese Glioma Cooperative Group.
Neuro Oncol. 14:1432–1440. 2012. View Article : Google Scholar : PubMed/NCBI
|
|
9
|
Gao YF, Mao XY, Zhu T, Mao CX, Liu ZX,
Wang ZB, Li L, Li X, Yin JY, Zhang W, et al: COL3A1 and SNAP91:
Novel glioblastoma markers with diagnostic and prognostic value.
Oncotarget. 7:70494–70503. 2016. View Article : Google Scholar : PubMed/NCBI
|
|
10
|
Shi Y, Chen C, Zhang X, Liu Q, Xu JL,
Zhang HR, Yao XH, Jiang T, He ZC, Ren Y, et al: Primate-specific
miR-663 functions as a tumor suppressor by targeting PIK3CD and
predicts the prognosis of human glioblastoma. Clin Cancer Res.
20:1803–1813. 2014. View Article : Google Scholar : PubMed/NCBI
|
|
11
|
Meng J, Li P, Zhang Q, Yang Z and Fu S: A
radiosensitivity gene signature in predicting glioma prognostic via
EMT pathway. Oncotarget. 5:4683–4693. 2014. View Article : Google Scholar : PubMed/NCBI
|
|
12
|
Meng D, Chen Y, Yun D, Zhao Y, Wang J, Xu
T, Li X, Wang Y, Yuan L, Sun R, et al: High expression of N-myc
(and STAT) interactor predicts poor prognosis and promotes tumor
growth in human glioblastoma. Oncotarget. 6:4901–4919. 2015.
View Article : Google Scholar : PubMed/NCBI
|
|
13
|
Cancer Genome Atlas Research Network, .
Comprehensive genomic characterization defines human glioblastoma
genes and core pathways. Nature. 455:1061–1068. 2008. View Article : Google Scholar : PubMed/NCBI
|
|
14
|
Rutledge WC, Kong J, Gao J, Gutman DA,
Cooper LA, Appin C, Park Y, Scarpace L, Mikkelsen T, Cohen ML, et
al: Tumor-infiltrating lymphocytes in glioblastoma are associated
with specific genomic alterations and related to transcriptional
class. Clin Cancer Res. 19:4951–4960. 2013. View Article : Google Scholar : PubMed/NCBI
|
|
15
|
Lin Y, Chen Y, Wang Y, Yang J, Zhu VF, Liu
Y, Cui X, Chen L, Yan W, Jiang T, et al: ZIP4 is a novel molecular
marker for glioma. Neuro Oncol. 15:1008–1016. 2013. View Article : Google Scholar : PubMed/NCBI
|
|
16
|
Chen Y, Meng D, Wang H, Sun R, Wang D,
Wang S, Fan J, Zhao Y, Wang J, Yang S, et al: VAMP8 facilitates
cellular proliferation and temozolomide resistance in human glioma
cells. Neuro Oncol. 17:407–418. 2015. View Article : Google Scholar : PubMed/NCBI
|
|
17
|
Silacci P, Mazzolai L, Gauci C,
Stergiopulos N, Yin HL and Hayoz D: Gelsolin superfamily proteins:
Key regulators of cellular functions. Cell Mol Life Sci.
61:2614–2623. 2004. View Article : Google Scholar : PubMed/NCBI
|
|
18
|
Van Impe K, De Corte V, Eichinger L,
Bruyneel E, Mareel M, Vandekerckhove JL and Gettemans J: The
nucleo-cytoplasmic actin-binding protein CapG lacks a nuclear
export sequence present in structurally related proteins. J Biol
Chem. 278:17945–17952. 2003. View Article : Google Scholar : PubMed/NCBI
|
|
19
|
Witke W, Li W, Kwiatkowski DJ and
Southwick FS: Comparisons of CapG and gelsolin-null macrophages:
Demonstration of a unique role for CapG in receptor-mediated
ruffling, phagocytosis, and vesicle rocketing. J Cell Biol.
154:775–784. 2001. View Article : Google Scholar : PubMed/NCBI
|
|
20
|
Dahl E, Sadr-Nabavi A, Klopocki E, Betz B,
Grube S, Kreutzfeld R, Himmelfarb M, An HX, Gelling S, Klaman I, et
al: Systematic identification and molecular characterization of
genes differentially expressed in breast and ovarian cancer. J
Pathol. 205:21–28. 2005. View Article : Google Scholar : PubMed/NCBI
|
|
21
|
Fan S, Meng D, Xu T, Chen Y, Wang J, Li X,
Chen H, Lu D, Chen J and Lan Q: Overexpression of SLC7A7 predicts
poor progression-free and overall survival in patients with
glioblastoma. Med Oncol. 30:3842013. View Article : Google Scholar : PubMed/NCBI
|
|
22
|
Kononen J, Bubendorf L, Kallioniemi A,
Barlund M, Schraml P, Leighton S, Torhorst J, Mihatsch MJ, Sauter G
and Kallioniemi OP: Tissue microarrays for high-throughput
molecular profiling of tumor specimens. Nat Med. 4:844–847. 1998.
View Article : Google Scholar : PubMed/NCBI
|
|
23
|
Ohuchida K, Mizumoto K, Ishikawa N, Fujii
K, Konomi H, Nagai E, Yamaguchi K, Tsuneyoshi M and Tanaka M: The
role of S100A6 in pancreatic cancer development and its clinical
implication as a diagnostic marker and therapeutic target. Clin
Cancer Res. 11:7785–7793. 2005. View Article : Google Scholar : PubMed/NCBI
|
|
24
|
Livak KJ and Schmittgen TD: Analysis of
relative gene expression data using real-time quantitative PCR and
the 2ΔΔCT method. Methods. 25:402–408. 2001. View Article : Google Scholar : PubMed/NCBI
|
|
25
|
Malliri A, Van Es S, Huveneers S and
Collard JG: The Rac exchange factor Tiam1 is required for the
establishment and maintenance of cadherin-based adhesions. J Biol
Chem. 279:30092–30098. 2004. View Article : Google Scholar : PubMed/NCBI
|
|
26
|
Lois C, Hong EJ, Pease S, Brown EJ and
Baltimore D: Germline transmission and tissue-specific expression
of transgenes delivered by lentiviral vectors. Science.
295:868–872. 2002. View Article : Google Scholar : PubMed/NCBI
|
|
27
|
Li X, Wan XC, Chen HB, Yang S, Liu YY, Mo
WJ, Meng DL, Du WT, Huang Y, Wu H, et al: Identification of
miR-133b and RB1CC1 as independent predictors for biochemical
recurrence and potential therapeutic targets for prostate cancer.
Clin Cancer Res. 20:2312–2325. 2014. View Article : Google Scholar : PubMed/NCBI
|
|
28
|
Verhaak RG, Hoadley KA, Purdom E, Wang V,
Qi Y, Wilkerson MD, Miller CR, Ding L, Golub T, Mesirov JP, et al:
Integrated genomic analysis identifies clinically relevant subtypes
of glioblastoma characterized by abnormalities in PDGFRA, IDH1,
EGFR, and NF1. Cancer Cell. 17:98–110. 2010. View Article : Google Scholar : PubMed/NCBI
|
|
29
|
Brennan CW, Verhaak RG, McKenna A, Campos
B, Noushmehr H, Salama SR, Zheng S, Chakravarty D, Sanborn JZ,
Berman SH, et al: The somatic genomic landscape of glioblastoma.
Cell. 155:462–477. 2013. View Article : Google Scholar : PubMed/NCBI
|
|
30
|
Kato J, Matsushime H, Hiebert SW, Ewen ME
and Sherr CJ: Direct binding of cyclin-D to the retinoblastoma
gene-product (prb) and pRb phosphorylation by the cyclin
D-dependent kinase Cdk4. Genes Dev. 7:331–342. 1993. View Article : Google Scholar : PubMed/NCBI
|
|
31
|
Lundberg AS and Weinberg RA: Functional
inactivation of the retinoblastoma protein requires sequential
modification by at least two distinct cyclin-cdk complexes. Mol
Cell Biol. 18:753–761. 1998. View Article : Google Scholar : PubMed/NCBI
|
|
32
|
Weinberg RA: The retinoblastoma protein
and cell-cycle control. Cell. 81:323–330. 1995. View Article : Google Scholar : PubMed/NCBI
|
|
33
|
Francis JM, Zhang CZ, Maire CL, Jung J,
Manzo VE, Adalsteinsson VA, Homer H, Haidar S, Blumenstiel B,
Pedamallu CS, et al: EGFR variant heterogeneity in glioblastoma
resolved through single-nucleus sequencing. Cancer Discov.
4:956–971. 2014. View Article : Google Scholar : PubMed/NCBI
|
|
34
|
Li C, Lei B, Huang S, Zheng M, Liu Z, Li Z
and Deng Y: H19 derived microRNA-675 regulates cell proliferation
and migration through CDK6 in glioma. Am J Transl Res. 7:1747–1764.
2015.PubMed/NCBI
|
|
35
|
Hall A: The cytoskeleton and cancer.
Cancer Metastasis Rev. 28:5–14. 2009. View Article : Google Scholar : PubMed/NCBI
|
|
36
|
Wu JH, Tian XY and Hao CY: The
significance of a group of molecular markers and
clinicopathological factors in identifying colorectal liver
metastasis. Hepatogastroenterology. 58:1182–1188. 2011. View Article : Google Scholar : PubMed/NCBI
|
|
37
|
Li T, Hong X, Zhao J, Teng Y, Zheng J,
Chen H, Chen H and Li H: Gelsolin-like actin-capping protein is
associated with patient prognosis, cellular apoptosis and
proliferation in prostate cancer. Biomark Med. 10:1251–1260. 2016.
View Article : Google Scholar : PubMed/NCBI
|
|
38
|
Shao F, Zhang R, Dong L and Ying K:
Overexpression of gelsolin-like actin-capping protein is associated
with progression of lung adenocarcinoma. Tohoku J Exp Med.
225:95–101. 2011. View Article : Google Scholar : PubMed/NCBI
|
|
39
|
Zhu WY, Hunag YY, Liu XG, He JY, Chen DD,
Zeng F, Zhou JH and Zhang YK: Prognostic evaluation of CapG,
gelsolin, P-gp, GSTP1, and Topo-II proteins in non-small cell lung
cancer. Anat Rec. 295:208–214. 2012. View Article : Google Scholar
|
|
40
|
Thompson CC, Ashcroft FJ, Patel S, Saraga
G, Vimalachandran D, Prime W, Campbell F, Dodson A, Jenkins RE,
Lemoine NR, et al: Pancreatic cancer cells overexpress gelsolin
family-capping proteins, which contribute to their cell motility.
Gut. 56:95–106. 2007. View Article : Google Scholar : PubMed/NCBI
|
|
41
|
Hubert T, Van Impe K, Vandekerckhove J and
Gettemans J: The F-actin filament capping protein CapG is a bona
fide nucleolar protein. Biochem Biophys Res Commun. 377:699–704.
2008. View Article : Google Scholar : PubMed/NCBI
|
|
42
|
Kang S, Kim MJ, An H, Kim BG, Choi YP,
Kang KS, Gao MQ, Park H, Na HJ, Kim HK, et al: Proteomic molecular
portrait of interface zone in breast cancer. J Proteome Res.
9:5638–5645. 2010. View Article : Google Scholar : PubMed/NCBI
|