Introduction
Gastric cancer is one of the most common types of
cancer worldwide and is ranked second in regards to cancer-related
deaths worldwide (1). Although
significant progress has been made in the diagnosis and treatment
of gastric cancer, modest progress has been made in improving
gastric cancer-related mortality. Furthermore, it has been
hypothesized that the gastric cancer-related death rate will
continue to increase in the future. Thus, there is an urgent need
to identify novel biomarkers that could be used to predict
prognosis and elucidate the underlying molecular mechanisms
(2,3).
Ninety years ago, Otto Warburg published a series of
studies linking metabolism and cancer through enhanced aerobic
glycolysis (also known as the Warburg effect), which distinguishes
cancer from normal tissues (4).
According to the results of recent studies, aberrant cancer cell
metabolism has been regarded as one of the hallmarks of cancer
(5). It is known that solid tumors
reside in a microenvironment with limited oxygen and nutrient
supply; to survive under such a hostile microenvironment, tumor
cells must shift their pattern of metabolism (6). Cancer cells are characterized by a
glucose metabolism. Under hypoxic conditions, cancer cells shift
their metabolism to glycolysis. Although, in terms of ATP
generation, the process of glycolysis is not highly efficient
because only two ATPs are generated. However, through glycolysis,
cancer cells utilize glucose to form building blocks for
macromolecule synthesis. Furthermore, lactate acid could be
produced by glycolysis and accumulated lactic acid could cause an
acidic microenvironment. The extracellular matrix becomes
relatively unstable in an acidic environment, which facilitates the
metastasis of cancer cells. Thus, it is hypothesized that targeting
cancer cell metabolism may help improve and discover novel
strategies against cancer (7).
Hypoxia inducible factor 1α (HIF1α) is regarded as a
master regulator of aerobic glycolysis in cancer cells. HIF1α
initiates the transcription of genes that encodes transporters and
enzymes in regulating glycolysis and the pentose phosphate pathway.
The glycolytic products pyruvate and lactate could also induce
HIF1α accumulation, suggesting a feed-forward mechanism. The
positive feedback loop further enhances the aerobic glycolysis
cascade (8). Furthermore,
tumor-promoting signaling pathways could also be activated under
hypoxia, such as the PI3K/AKT/mTOR and MAPK signaling pathways.
Activation of these pathways is also involved in HIF1α and
glycolysis upregulation (9).
Another important role of glycolysis and HIF1α is that HIF1α
transcribes many metastasis and angiogenesis genes. For example,
metastasis-associated genes such as Twist and angiogenesis-related
genes such as VEGF and VEGFR are all HIF1α target genes.
Additionally, the process of glycolysis also results in elevation
of these genes, favoring metastasis. In recent years, the impact of
cancer cell metabolism on gastric cancer has received an increasing
amount of attention (10,11). Glycolysis also participates in
chemotherapy and radiotherapy resistance, which may account for the
poor prognosis of gastric cancer patients (12). For example, under genotoxic stress
conditions, tumor cells shift their glucose metabolism pattern to
glycolysis through regulation of mitochondrial-localized metabolism
regulator Sirtuin 4 (SIRT4) (13).
In conclusion, targeting cancer cell metabolism may
be utilized to uncover novel predictive and treatment strategies
for cancer. In the present study, using gastric cancer cells as a
research model, we uncovered a novel protein AAED1 that was
upregulated in gastric cancer. Furthermore, in vitro studies
demonstrated that silencing of AAED1 inhibited the proliferation of
gastric cancer cells. Mechanistic studies demonstrated that AAED1
positively regulated aerobic glycolysis via regulating HIF1α. The
present study shed light on novel markers and strategies against
gastric cancer and provide directions for further research.
Materials and methods
Cell culture
Human gastric cancer AGS and MGC-803 cell lines were
used in the present study. The cell lines were obtained from the
Cell Bank of Institute of Biochemistry and Cell Biology at the
Chinese Academy of Sciences (Shanghai, China). The two cell lines
were grown in Dulbecco's modified Eagle's medium (DMEM)
supplemented with 10% fetal bovine serum (FBS) and 1%
penicillin-streptomycin (Gibco; Thermo Fisher Scientific, Inc.,
Waltham, MA, USA) at 37°C with humidified 5% CO2.
Establishment of AAED1-silenced cell
lines
In order to silence AAED1 expression in gastric
cancer cell lines, a lentivirus-mediated transfection method was
used. A pLKO.1 TRC cloning vector that was obtained from Addgene
Inc. (Cambridge, MA, USA) was used to express shRNA targets against
AAED1 (14). The 21-bp targets
against AAED1 were 5′-CGGCATTTCCTGTGTTACAT-3′ and
5′-CGCGATAGGAATAGGTTGGAT-3′, respectively. The lentivirus was
produced by co-transfecting AAED1-ilencing constructs with psPAX2
and pMD2.G vectors in a ratio of 4:3:1 into 293T cells. Stable
AAED1-silenced cell lines were obtained by infecting AGS and
MGC-803 cells and subsequent puromycin selection.
Cell viability assay
Cell Counting Kit-8 (CCK-8; Dojindo Molecular
Technologies, Inc., Kumamoto, Japan) was used to measure the cell
viability. Briefly, 200 µl medium containing cells (3,000/well) was
seeded into 96-well plates. After culturing for the indicated
times, CCK-8 solution was added into each well at 37°C. After 2 h,
the optical density values of each well were measured using a
microplate reader at 450 nm.
Colony-formation assay
AGS and MGC-803 cells (5×10²) stably
expressing shRNA targets against AAED1 and its relative control
cells were seeded. After cultivating for 10 days, 4%
paraformaldehyde was used to fix the cells followed by staining
with 1% crystal violet. The colonies were counted subsequently.
Briefly, the images of the plates were taken on a gel imager using
a light filter, and colonies >500 µm or other appropriate
diameters were counted.
Quantitative real-time PCR
Total RNA was extracted using TRIzol reagent
(Invitrogen; Thermo Fisher Scientific, Inc., Waltham, MA, USA).
Takara PrimeScript RT reagent kit was used for reverse
transcription to obtain cDNA (Takara Bio, Inc., Otsu, Japan). The
expression status of candidate genes and β-actin were determined by
quantitative real-time PCR using an Applied Biosystems®
7900HT Real-Time PCR system (Thermo Fisher Scientific). β-actin was
used as the reference genes. Thermocycling conditions were 40
cycles of 95°C 5 sec and 60°C 30 sec. The method of quantifications
were calculated according to a previous report (15). Primer sequences are listed in
Table I.
 | Table I.Primer sequences used in the present
study. |
Table I.
Primer sequences used in the present
study.
| AAED1 forward |
5′-AAGGAGACCCAGCTCAGCAAGGTG-3′ |
| AAED1 reverse |
5′-AGCAGGTTAGACACTGCACGAGGA-3′ |
| GLUT1 forward |
5′-CTTTGTGGCCTTCTTTGAAGT-3′ |
| GLUT1 reverse |
5′-CCACACAGTTGCTCCACAT-3′ |
| HK2 forward |
5′-GATTGTCCGTAACATTCTCATCGA-3′ |
| HK2 reverse |
5′-TGTCTTGAGCCGCTCTGAGAT-3′ |
| PGK1 forward |
5′-CAAGGTTAAAGCCGAGCCAGCCAA-3′ |
| PGK1 reverse |
5′-GCCTTCTGTGGCAGATTGACTCC-3′ |
| LDHA forward |
5′-TGGAGATTCCAGTGTGCCTGTATGG-3′ |
| LDHA reverse |
5′-CACCTCATAAGCACTCTCAACCACC-3′ |
| β-actin
forward |
5′-CCAACCGCGAGAAGATGACCCA-3′ |
| β-actin
reverse |
5′-ATCACGATGCCAGTGGTACG-3′ |
Western blot analysis
Cells were washed with ice-cold phosphate-buffered
saline (PBS) and lysed in RIPA buffer (150 mM NaCl, 1% NP-40, 50 mM
Tris/HCl, pH 8.0 and 10% glycerol) containing protease and
phosphatase inhibitors purchased from Selleck Chemicals LLC
(Houston, TX, USA). Cell debris was removed by centrifugation at
12,000 rpm for 20 min at 4°C. Protein concentrations of the whole
cell lysate were determined using a Thermo Pierce® BCA
protein assay kit (Thermo Fisher Scientific). Equal amounts of 20
µg total protein were subjected to SDS-PAGE separation and then
transferred to polyvinylidene difluoride (PVDF) membranes. An
antibody against AAED1 was purchased from Sigma-Aldrich (Merck
KGaA). Glut1 (dilution factor 1:500; cat. no. 21829-1-AP), Hk2
(dilution factor 1:1,000; cat. no. 22029-1-AP), Ldha (dilution
factor 1:3,000; cat. no. 19987-1-AP), Pgk1 (dilution factor
1:1,000; cat. no. 17811-1-AP), ERK1/2 (dilution factor 1:1,000;
cat. no. 16443-1-AP), Akt1 (dilution factor 1:1,000; 10176-2-AP),
p-Akt1 (dlituion factor 1:1,000; cat. no. 66441-1-lg) and β-actin
(dilution factor 1:3,000; cat. no. 60008-1-lg) antibodies were
manufactured by Proteintech Group (Rosemont, IL, USA).
Phospho-p44/p42 MAPK (Erk1/2) (Thr202/Tyr204) (dilution factor
1:1,000; cat. no. 9101) was purchased from Cell signaling
Technology (Danvers, MA, USA).
Extracellular acidification rate
(ECAR) and oxygen consumption rate (OCR)
Cellular glycolytic capacity and mitochondrial
function were determined using the XF96 Extracellular Flux Analyzer
(Seahorse Bioscience; Agilent Technologies, North Billerica, MA,
USA), according to the manufacturer's instructions included in the
Seahorse XF Glycolysis Stress Test kit (cat. no. 103020) and the
Cell Mito Stress Test kit (cat. no. 103015). ECAR shows the ability
of glycolysis. Before adding glucose, the ECAR value is known as
the basic value, which reflects the acid production through the
non-glycolytic pathway. When glucose is added, ECAR reflects the
glycolysis capacity of the cells. When oligo is added, oxidative
phosphorylation is inhibited, and the increased value of ECAR
reflects the total glycolysis capacity of the cells, which is also
known as the potential glycolysis ability of the cells. The total
numerical value is the maximum glycolysis ability of the cells.
2-DG, which is finally added, is an inhibitor of glycolysis, and
the ECAR change after this step reflects the acid production
through the non-glycolytic pathway. In OCR assay, the basal value
before adding oligo reflects the basic oxygen consumption of the
cells, which includes two components; mitochondrial oxidative
phosphorylation and proton leakage oxygen consumption. Protons form
electrical potential energy on the mitochondrial membrane via the
respiratory chain. Some of protons reflux and ATP is formed through
ATP synthetase, and the potential energy is transformed into energy
in the form of ATP. Another part of the proton is oxidized by the
proton in the mitochondrial membrane, and the potential energy is
not used to synthesize ATP, but to heat energy. After the addition
of ATP synthase inhibitor oligo, the decrease in oxygen consumption
reflects the oxygen consumption of the body in the process of ATP
synthesis, which indirectly reflects the ATP production of the
cells. FCCP is a kind of uncoupler that can be regarded as a proton
carrier, which allows a large number of protons to flow back.
Oxygen consumption after the addition of FCCP reflects the largest
mitochondrial oxygen consumption capacity, indirectly reflecting
the maximum breathing capacity. Finally, two types of agents,
amphoterin A and rotenone, were added, and they were respiratory
chain inhibitors, which completely prevented the oxygen consumption
of mitochondria.
Immunohistochemistry
The 80 clinical tissue samples used in this study
were histopathologically and clinically diagnosed at the Shanghai
Ninth People's Hospital Affiliated to Shanghai Jiaotong University
School of Medicine (Shanghai, China) between June 2014 and May
2017. The age distribution of patients (47 males and 33 females)
was between 28 and 75 years. Prior patient consent and approval
from the Institutional Research Ethics Committee were obtained.
Paraffin-embedded tissue slides were deparaffinized in xylene,
rehydrated through a graded alcohol series, blocked in methanol
containing 3% hydrogen peroxide, and then incubated with an AAED1
antibody (dilution 1:50; cat. no. HPA021294; Sigma-Aldrich, Merck
KGaA). Followed by PBS solution rinsing, the slides were incubated
with secondary antibodies and peroxidase reagent at room
temperature (cat. no. GK6007; Beijing Genetech, Co., Ltd., China).
At the end, the slides were incubated with 3,3′-diaminobenzidine
solution at room temperature for 10 min and counterstained with
hematoxylin. A scoring scale was used to evaluate the percentage of
cells stained (0, <10%; 1, 10–25%; 2, >25–50%; 3, >50–75%;
and 4, >75%) and intensity of staining (0, negative; 1, low; 2,
moderate; and 3, strong). The overall staining scores were
determined by combining the two scores (frequency plus intensity).
An immunohistochemical score >6 was defined as high expression,
whereas a score ≤6 was defined as low expression (16).
Promoter activity assessment by
Dual-Luciferase assay
AGS and MGC-803 cells were seeded on 96-well culture
plates and transfected with indicated vectors using Invitrogen™
Lipofectamine™ 2000 (Thermo Fisher Scientific). HIF1α activity was
assessed using HRE-luciferase firefly luciferase construct (Addgene
plasmid 26731) (17). pRL-TK
(Promega, Madison, WI, USA) was used as an internal control.
Firefly and Renilla luciferase activities were measured
using a Dual-Luciferase system (Promega), as described in the
manufacturer's protocol.
Measurement of intracellular ROS
levels
Intracellular ROS were detected using a Reactive
Oxygen Species Assay kit (Beyotime Institute of Biotechnology,
Haimen, China). In brief, cells were washed with PBS. Then, cells
were stained with 10 µmol/l DCFH-DA at 37°C for 20 min according to
the manufacturer's instructions. DCFH-DA was deacetylated
intracellularly by non-specific esterase, which was further
oxidized by ROS to the fluorescent compound 2,7-dichlorofluorescein
(DCF). DCF fluorescence was detected using a FACScan flow cytometer
(Becton-Dickinson; BD Biosciences, Franklin Lakes, NJ, USA).
Statistical analysis
All data are presented as the mean ± SD; experiments
were repeated at least three times. Two-tailed unpaired Student's
t-tests and one-way analysis of variance (ANOVA) and post hoc tests
were used to evaluate the data. SPSS version 16.0 (SPSS, Inc.,
Chicago, IL, USA) was used for data analysis. Differences were
considered significant at *P<0.05, **P<0.01, ***P<0.001,
****P<0.0001 as indicated in the figures.
Results
AAED1 expression is upregulated in
gastric cancer
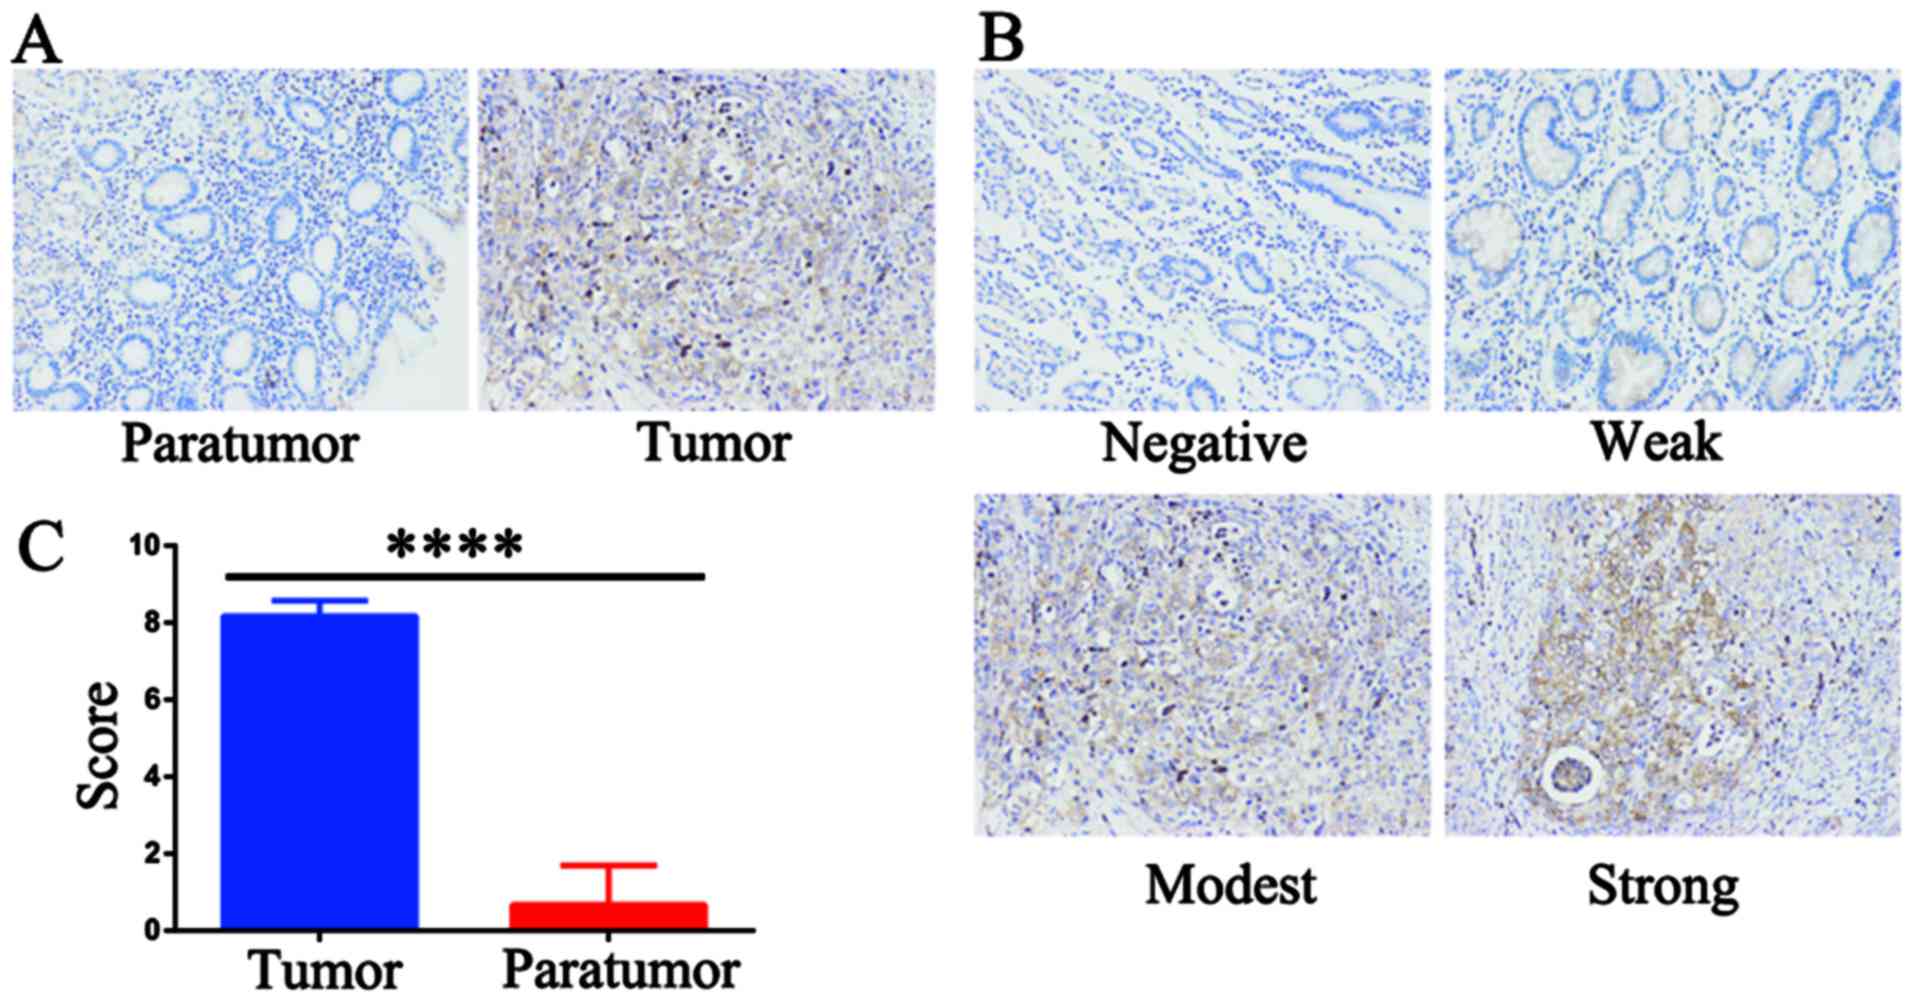
To verify the expression status of AAED1 in gastric
cancer, IHC staining was performed using an AAED1 antibody. As
shown, AAED1 was significantly higher in gastric tumor samples than
that in normal paratumor samples (Fig.
1A). The scoring criteria was listed as negative, weak, modest
and strong (Fig. 1B). Results
indicated that AAED1 expression was significantly higher in gastric
tumor samples than that in the paratumor samples (Fig. 1C). Taken together, these results
suggested that AAED1 may be a tumor-promoting marker in gastric
cancer.
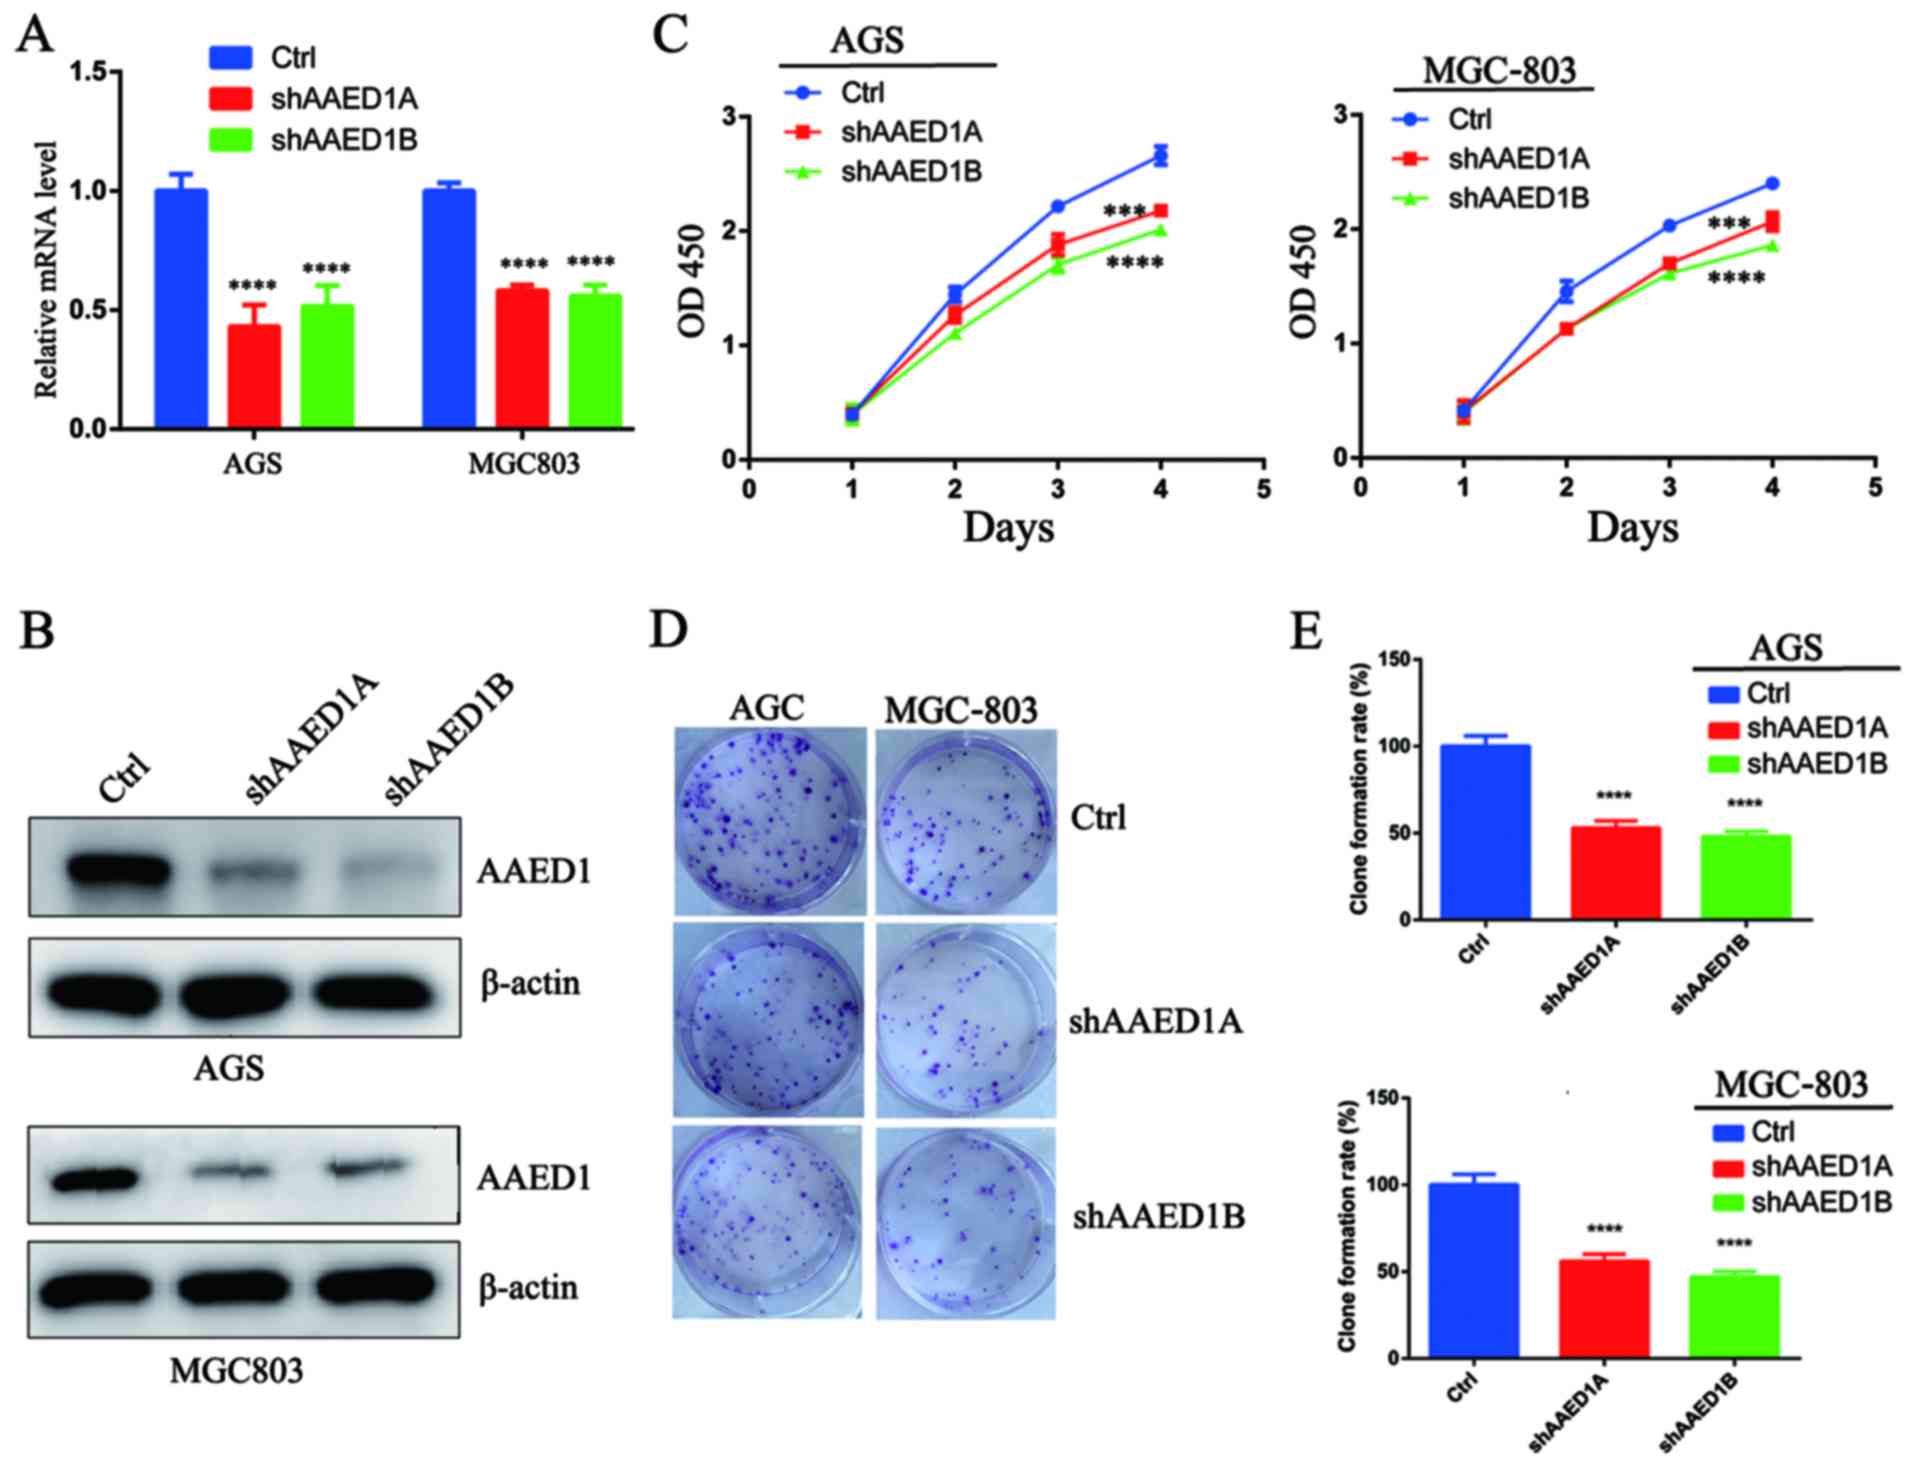
AAED1 regulates the proliferation of
gastric cancer cells
To confirm the role of AAED1 in gastric cancer cell
proliferation, we firstly silenced AAED1 expression in gastric
cancer cell lines using a lentivirus-mediated method. Two shRNA
targets that efficiently suppressed AAED1 mRNA expression in AGS
and MGC-803 cells were generated (Fig.
2A). Immunoblotting with AAED1 antibodies further verified the
silencing effect (Fig. 2B). Next, a
CCK-8 cell viability assay was performed, and the results indicated
that silencing of AAED1 expression inhibited cell viability in the
AGS and MGC-803 cells (Fig. 2C).
Finally, the impact of AAED1 on colony formation capacity was
assessed. As shown, silencing of AAED1 expression significantly
inhibited colony formation capacity (Fig. 2D and E). Collectively, these results
suggested that AAED1 may have positively regulated proliferation in
gastric cancer cells.
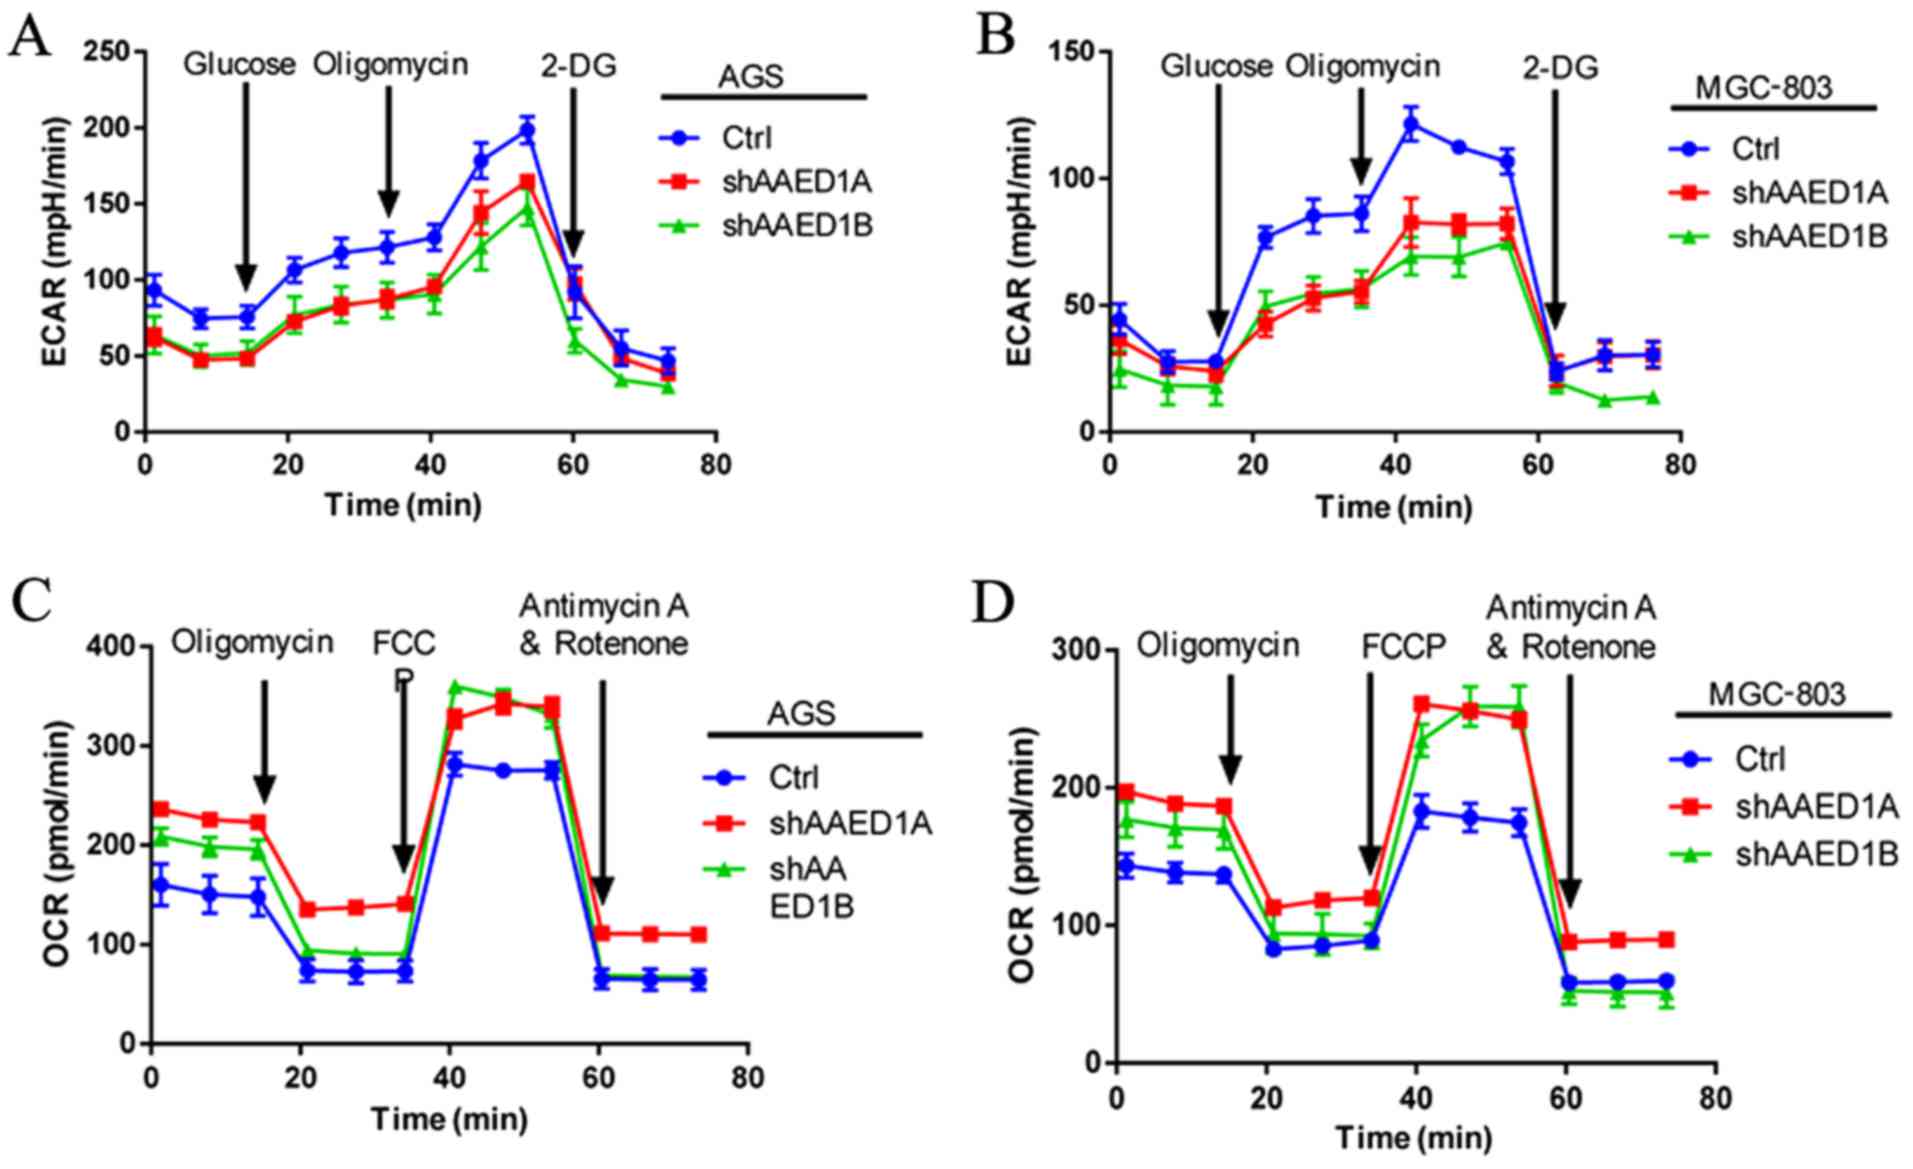
AAED1 positively regulates aerobic
glycolysis in gastric cancer cells
Aberrant cancer cell metabolism is pronounced in
cancer cells to facilitate uncontrolled proliferation. Aerobic
glycolysis is the best characterized metabolic reprogramming that
regulates cancer cell proliferation. Thus, we analyzed the impact
of AAED1 on gastric cancer cell metabolism. Through glycolysis,
cancer cells utilize glucose to produce lactate and increased
levels of lactate could produce an acidic environment that could be
measured by extracellular acidification rate (ECAR). Our ECAR
measurement results demonstrated that silencing of AAED1 expression
decreased ECAR levels, indicating that AAED1 is a positive
regulator of aerobic glycolysis (Fig.
3A and B). During glycolysis, mitochondrial respiration was
impaired and was measured using the oxygen consumption rate (OCR).
In AAED1-silenced AGS and MGC-803 cells, we observed an increase in
OCR levels, which further reinforced the impact of AAED1 on aerobic
glycolysis (Fig. 3C and D). In
conclusion, our results suggested that AAED1 is a positive
regulator of glycolysis, and AAED1 supports the proliferation of
gastric cancer cells.
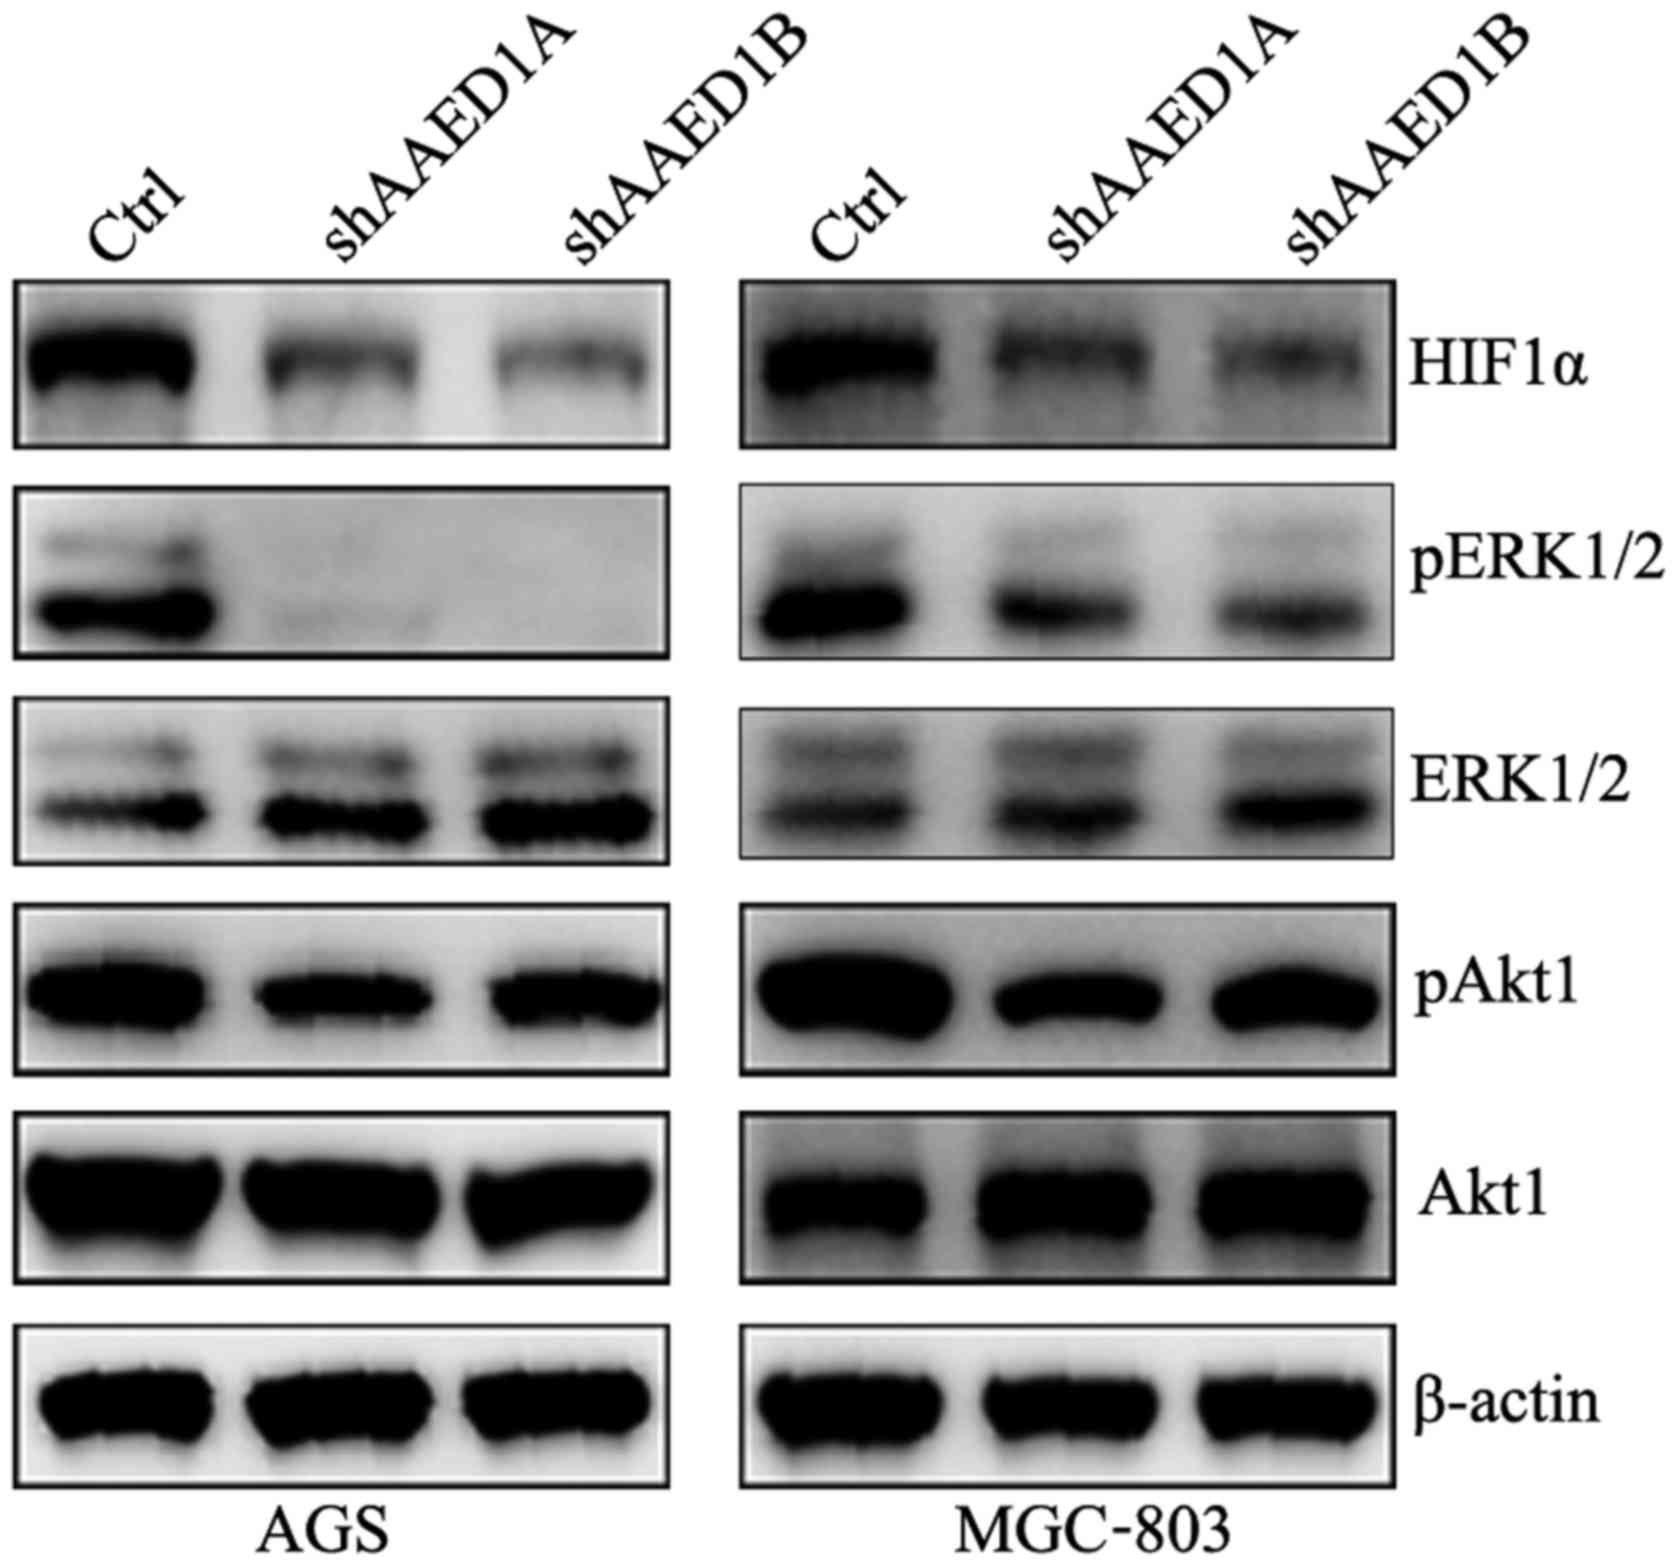
AAED1 positively regulates the
ERK/Akt1/HIF1α signaling pathway in gastric cancer cells
To search for the molecular pathway that
participates in aerobic glycolysis by AAED1 in gastric cancer
cells, the changes in HIF1α expression in AAED1-knockdown AGS and
MGC-803 cells were examined. As observed, HIF1α protein levels were
observably decreased in the AAED1-silenced cells. Activation of
ERK1/2 and Akt1 has been reported to positively regulate aerobic
glycolysis and to regulate HIF1α and HIF1α-transcriptional
activity. Thus, we performed immunoblot analysis to observe changes
in the ERK1/1 and Akt1 activation status in the AGS and MGC-803
cells. As shown, silencing of AAED1 inhibited the activation of
ERK1/2 and Akt1, which may account for the regulation of HIF1α by
AAED1 in gastric cancer cells (Fig.
4).
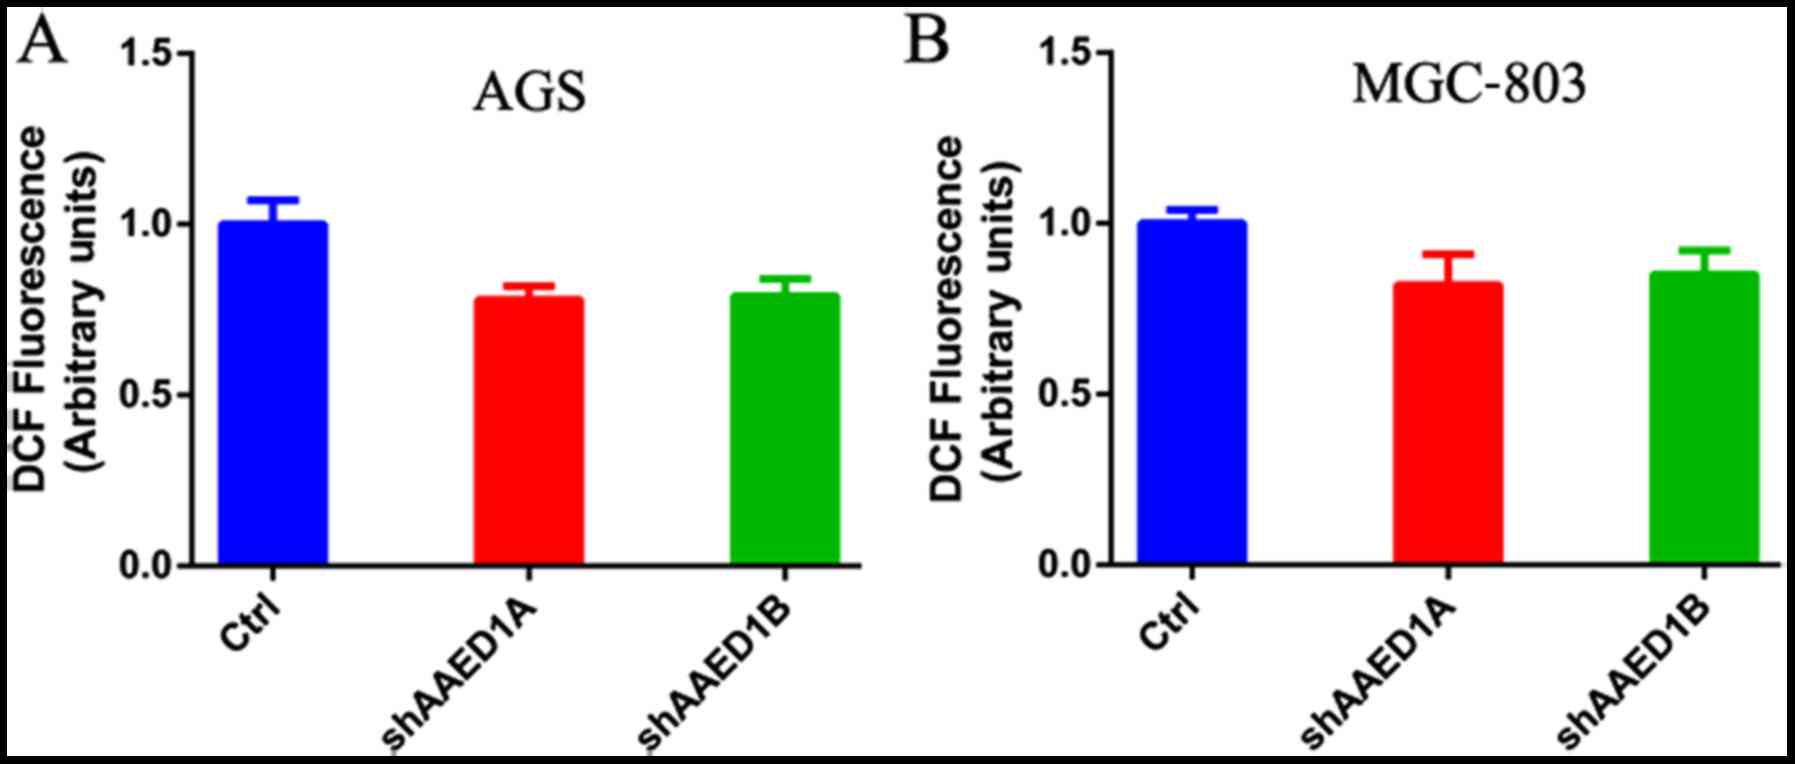
AAED1 regulates ROS generation in
gastric cancer cells
AAED1 may play an antioxidant role in cancer cells.
As observed above, AAED1 regulated ERK1/2 and Akt1 activation, two
signaling pathways that may regulate ROS generation and antioxidant
response. Thus, we measured the influence of AAED1 on ROS
generation in AGS and MGC-803 cells. As shown, silencing of AAED1
expression in these two gastric cancer cell lines decreased
intracellular ROS levels (Fig. 5A and
B).
AAED1 modulates the expression of
glycolysis-related genes and HIF1α transcriptional activity
Aerobic glycolysis is a multiple step enzymatic
process to metabolize glucose. Among the many glycolysis genes,
GLUT1, HK2, PGK1 and LDHA are reported to catalyze the
rate-limiting steps and are direct HIF1α target genes. Thus,
quantitative real-time PCR (qPCR) analysis was performed to assess
the impact of AAED1 on the expression status of GLUT1, HK2, PGK1
and LDHA. As shown, AAED1 knockdown significantly decreased the
expression of these HIF1α-targeted, glycolysis genes (Fig. 6A-D). Furthermore, western blot
analysis results were consistent with the qPCR results, and the
protein levels of GLUT1, HK2, PGK1 and LDHA were decreased in the
presence of AAED1 knockdown (Fig. 6E
and F). GLUT1, HK2, PGK1 and LDHA are HIF1α target genes and
conserve hypoxia response elements on their promoter region. HIF1α
transcription activity could be assessed by using HRE-luciferase
activity. Then, we performed a Dual-Luciferase assay, and our
results demonstrated that AAED1 significantly regulated
HRE-luciferase activity in a dose-dependent manner (Fig. 6G and H).
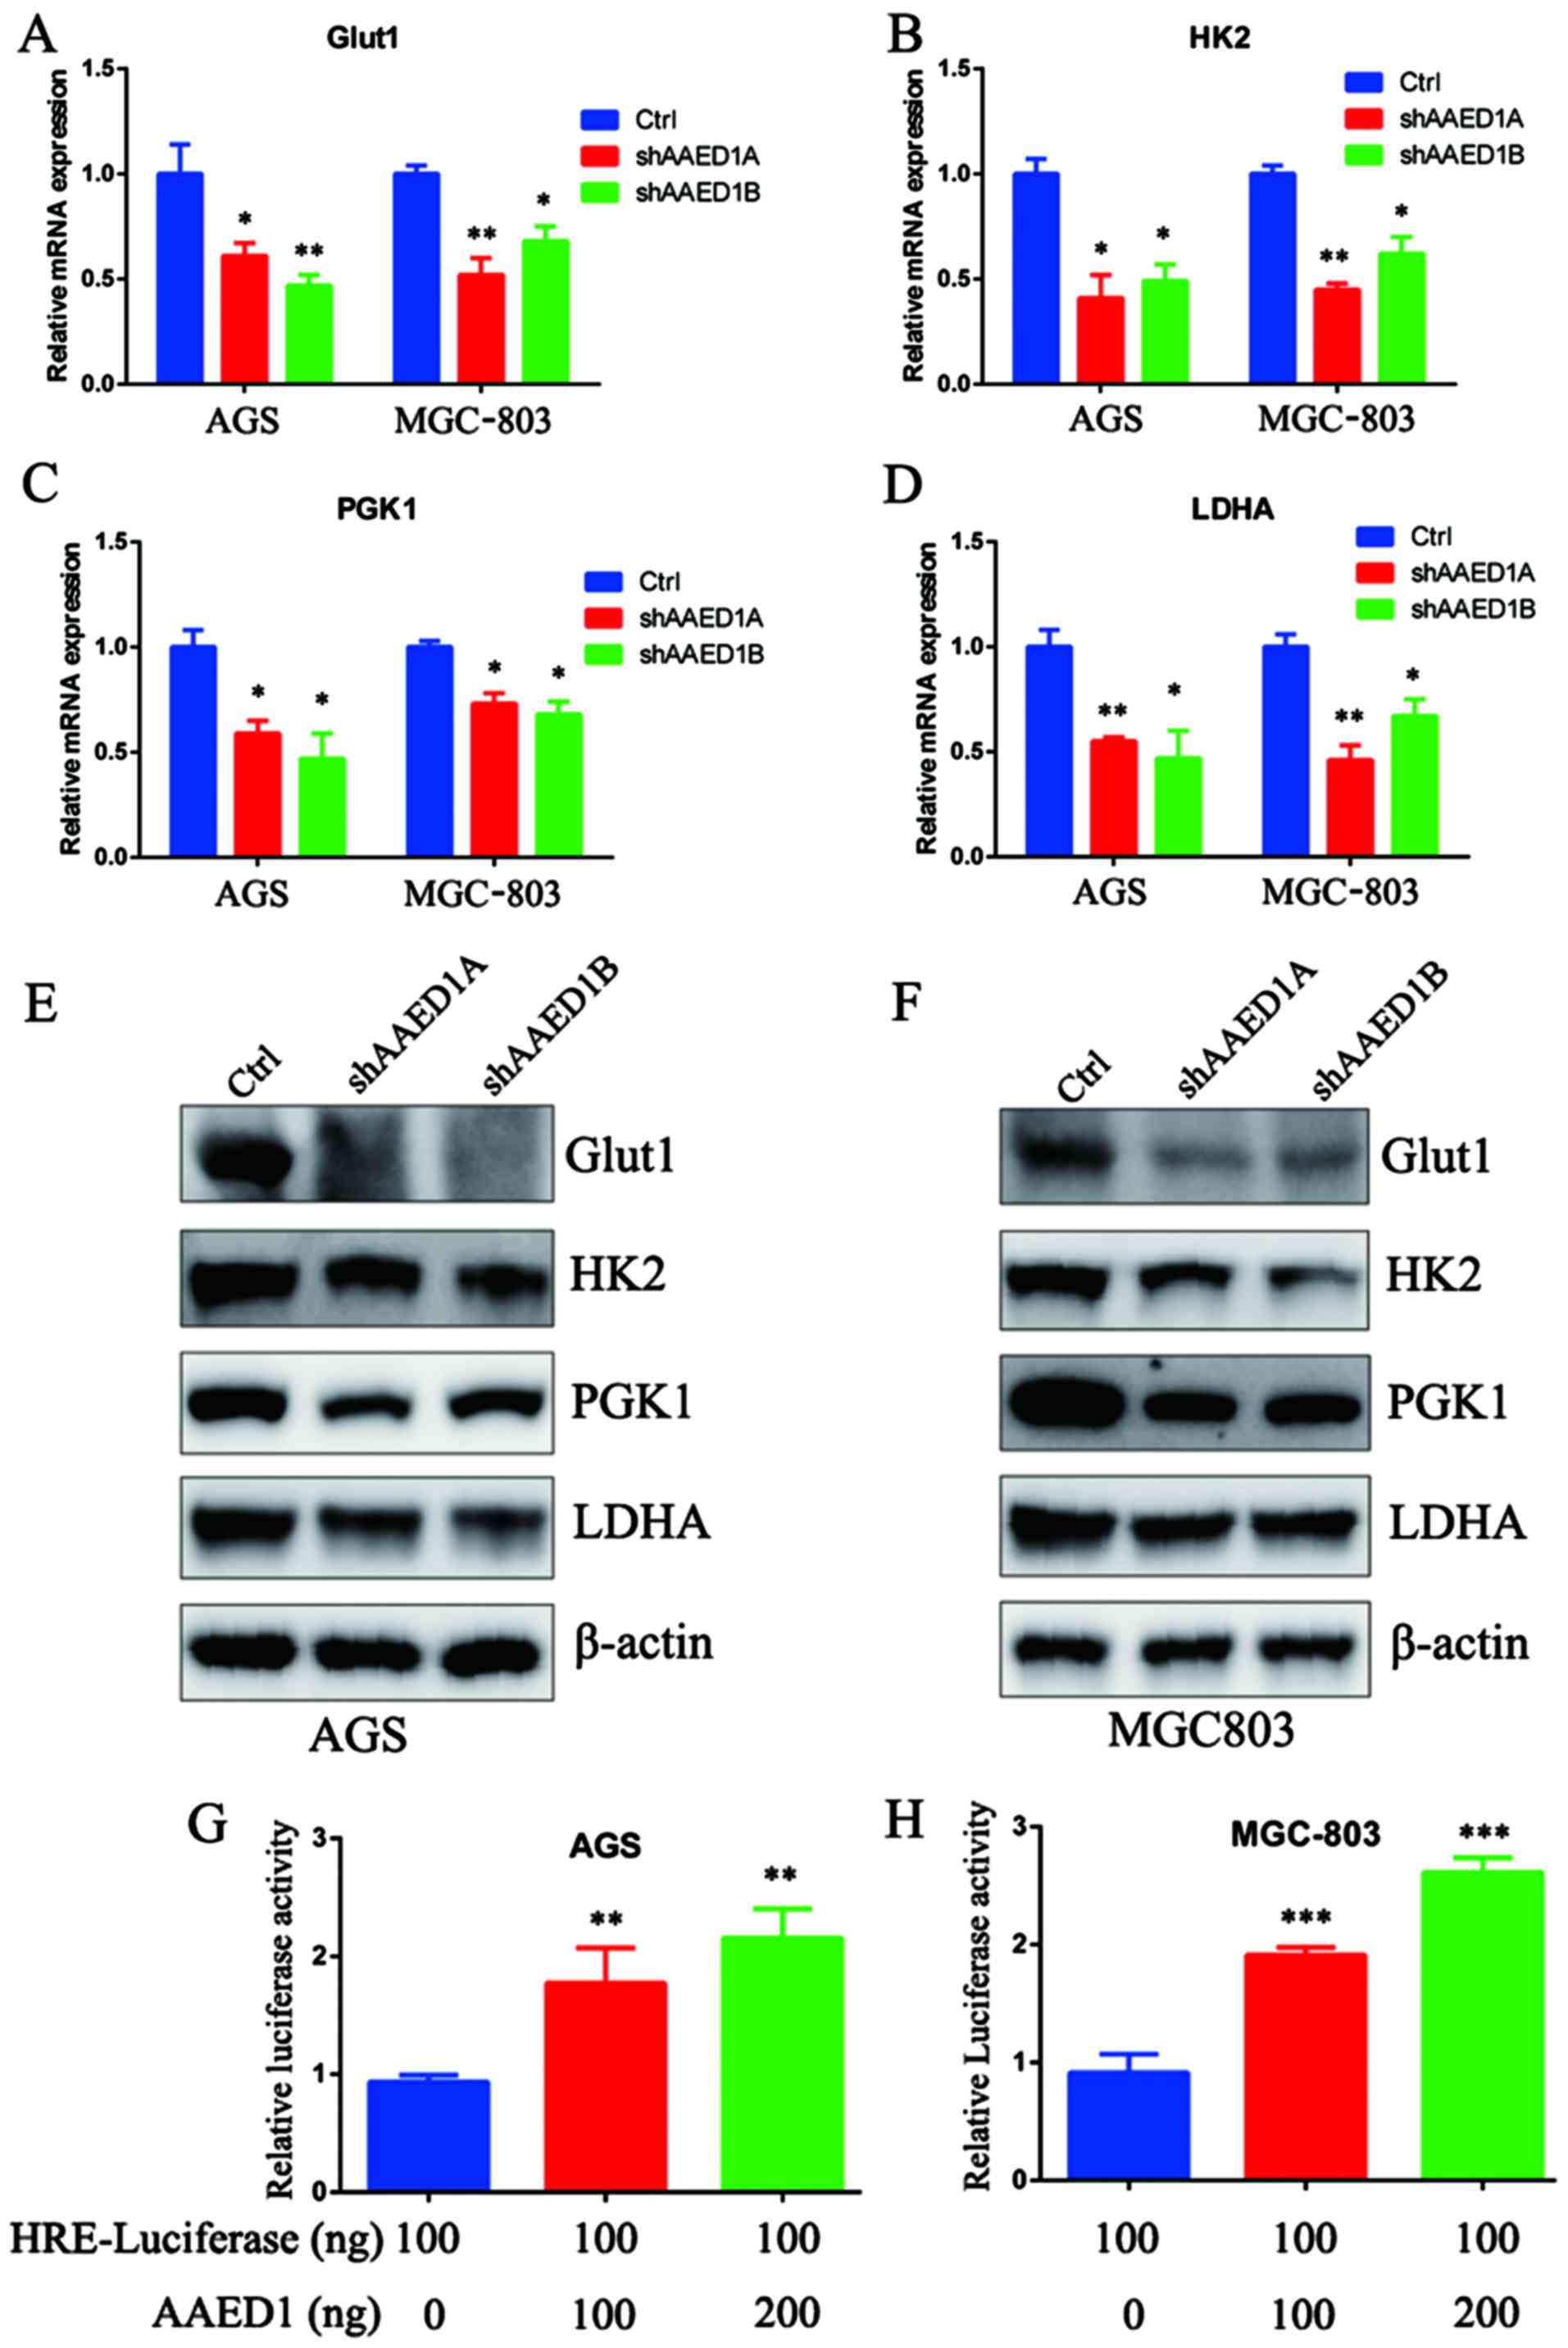 | Figure 6.AAED1 modulates the expression of
glycolysis genes and HIF1α transcriptional activity. Aerobic
glycolysis is a multi-step process catalyzed by glycolysis enzymes.
(A-D) In AAED1-silenced AGS and MGC-803 cells, we observed a
significant decrease in mRNA levels of Glut1, HK2, PGK1 and LDHA,
all of which are HIF1α targets. (E and F) We observed a relevant
decrease in the protein levels of these enzymes. (G and H)
Additionally, we observed the impact of AAED1 on HIF1α
transcriptional activity by HRE-luciferase assay and the results
demonstrated that AAED1 regulated HRE-luciferase activity in a
dose-dependent manner. *P<0.05, **P<0.01, ***P<0.001.
AAED1, AhpC/TSA antioxidant enzyme domain containing 1; Glut1,
glucose transporter 1; HK2, hexokinase 2; PGK1, phosphoglycerate
kinase 1; LDHA, lactate dehydrogenase A. |
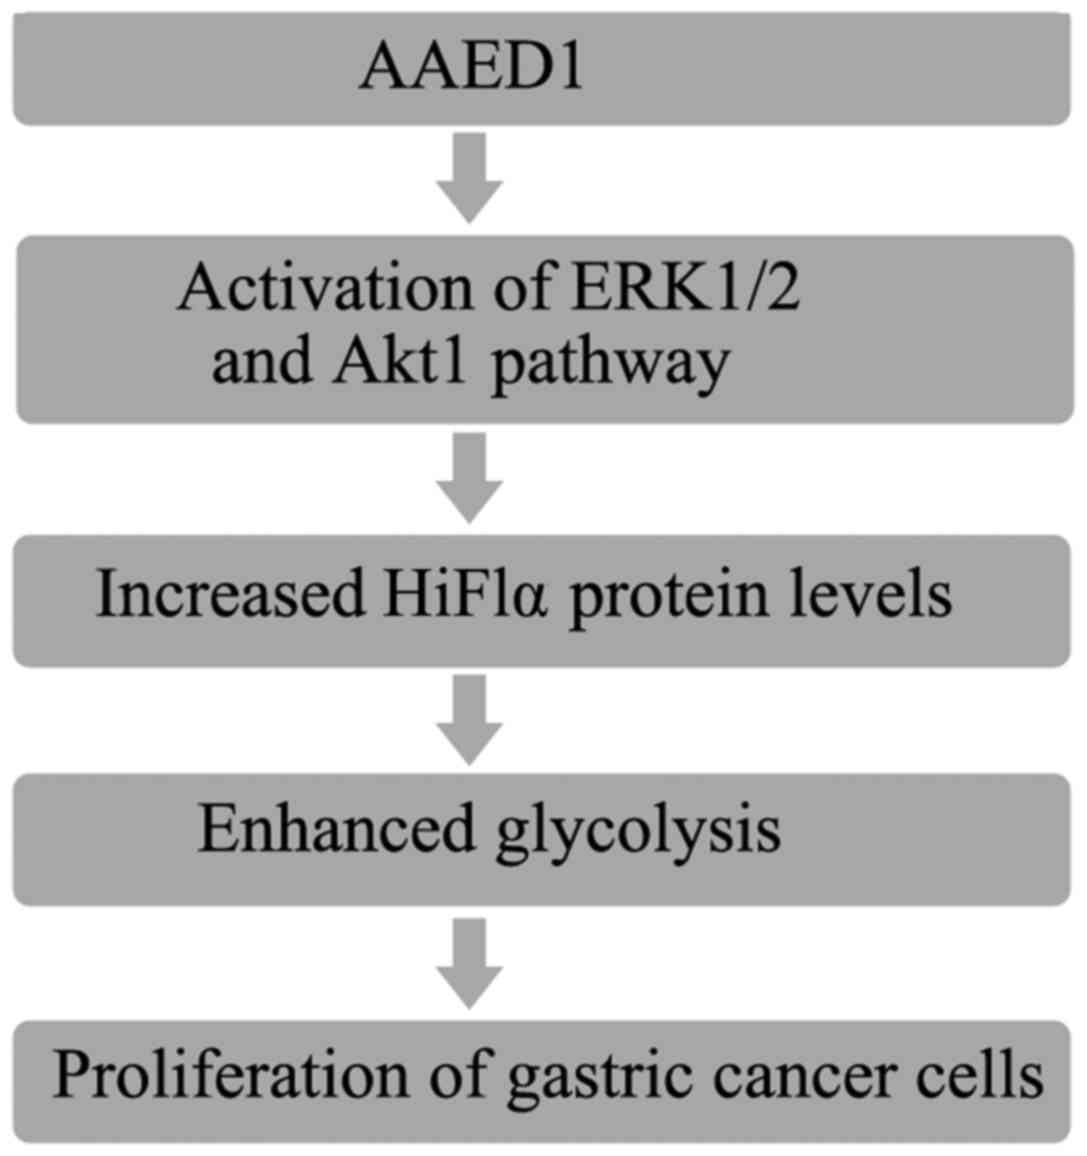
In conclusion, the results of the present study
demonstrated that AAED1 levels were increased in patients with
gastric cancer. In vitro results suggested that AAED1
positively regulated ERK1/2 and AKT1 activation and the relevant
HIF1α upregulation. Increased HIF1α resulted in increased
expression of glycolysis genes and enhanced glycolysis, which
favors uncontrolled proliferation of gastric cancer cells (Fig. 7).
Discussion
In the present study, we demonstrated that AAED1 was
upregulated in gastric cancer. In vitro studies demonstrated
that AAED1 regulated cell proliferation. Mechanistic studies
demonstrated that AAED1 regulated HIF1α and HIF1α-transcriptional
activity, leading to enhanced glycolysis in gastric cancer
cells.
AAED1 consists of the AphC/TSA antioxidant enzyme
domain, which indicates that it may play certain roles in
antioxidant response. Thus, in the present study, we measured its
effect on ROS generation in gastric cancer cells. Our results
demonstrated that silencing of AAED1 in AGS and MGC-803 cells
inhibited intracellular ROS levels. Previous studies have
demonstrated that intracellular ROS levels regulate HIF1α protein
stability, resulting in metabolism reprogramming (18,19).
Consistently, we also demonstrated that HIF1α protein levels were
significantly decreased in AAED1-silenced gastric cancer cells.
Further studies are needed to examine the impact of AAED1 on HIF1α
protein level stability regulation, especially post-translational
modifications, such as ubiquitination, as intracellular ROS levels
were found to regulate hydroxylation of HIF1α, leading to
ubiquitination of this protein (20–22).
Another possible impact of AAED1 on HIF1α protein level regulation
is that AAED1 regulated the activation status of ERK1/2 and Akt1
(23,24). Phosphorylation of HIF1α by ERK1/2 is
also critical for the stability of HIF1α, as phosphorylation of
HIF1α and subsequent ubiquitination of HIF1α by FBW7 could lead to
destruction of HIF1α (25). Another
possible mechanism underlying AAED1 in intracellular ROS generation
might be attributed to nuclear factor (erythroid-derived 2)-like 2
(NRF2)-mediated antioxidant responses. NRF2 has been demonstrated
in many type of cancers, such as breast cancer, liver cancer and
pancreatic cancer (26–29). Aberrancies in intracellular ROS
levels were found to regulate NRF2 protein levels and NRF2-mediated
antioxidant response, leading to cell proliferation and
chemotherapy and radiotherapy resistance (30). Thus, the present study indicated
further directions for studying the impact of AAED1 on NRF2 and on
chemotherapy and radiotherapy resistance, two facets that may
regulate a poorer survival in patients with gastric cancer.
In the present study, we demonstrated that AAED1
regulated aerobic glycolysis in gastric cancer cells. The impact of
aerobic glycolysis has been demonstrated to play vital roles in
maintaining cancer cell proliferation under severely hypoxic
conditions caused by limited oxygen and nutrient supply.
Furthermore, glycolysis produces lactate, leading to an acidic
microenvironment of cancer cells (31). Under acidic conditions, the
extracellular matrix becomes unstable, which favors the metastasis
of cancer cells (32,33). For example, in gastric cancer cells,
epithelial-mesenchymal-transition (EMT) regulator Snail-mediated
repression of glycolytic enzyme fructose-bisphosphatase 1 (FBP1)
provides metastatic advantages to gastric cancer cells (34). Some EMT regulators such as Twist1,
are also HIF1α targets. Moreover, glycolysis regulator HIF1α could
also regulate angiogenesis, which plays significant roles in the
metastasis of cancerous cells (35,36).
Thus, the present observation inspired us to carry out further
studies to examine the impact of AAED1 and AAED1-mediated
glycolysis on the metastasis of gastric cancer.
AAED1 was observed in the present study to maintain
proliferation and glycolysis of gastric cancer, indicating its
possible roles in cancer development. In line with this, we
demonstrated that AAED1 protein levels were significantly higher in
gastric cancer tissues than the relevant adjacent tissues,
indicating its roles as a possible marker for the diagnosis and
prognosis of gastric cancer. In our future studies, we plan to
increase the number of patients and perform IHC staining and
overall survival analysis to validate the possible role of AAED1 in
the prognosis of gastric cancer. Furthermore, based on the role of
AAED1 on gastric cancer proliferation, identifying small molecules
that could inhibit AAED1 activity may help to uncover novel
strategies for the treatment of gastric cancer.
In conclusion, the present study provides a novel
role for AAED1 in gastric cancer cell proliferation and metabolic
regulation. These results suggested that AAED1 may be a promising
therapeutic target for gastric cancer.
Acknowledgements
We acknowlege Henghua Zhou for her help in
pathological assistance.
Funding
The present study was supported by the Shanghai
Municipal Commission of Health and Family Planning (grant no.
20164Y0255).
Availability of data and materials
The datasets used during the present study are
available from the corresponding author upon reasonable
request.
Authors' contributions
BZ performed most of the assays in the manuscript.
JW, YC, ML and BW collected and analysed the data; YG designed and
supervised the manuscript. All authors read and approved the
manuscript and agree to be accountable for all aspects of the
research in ensuring that the accuracy or integrity of any part of
the work are appropriately investigated and resolved.
Ethics approval and consent to
participate
The study protocol was approved by the Bioethical
Commission of Shanghai Ninth People's Hospital Affiliated to
Shanghai Jiaotong University School of Medicine.
Patient consent for publication
Not applicable.
Competing interests
The authors state that they have no competing
interests.
References
|
1
|
Siegel RL, Miller KD and Jemal A: Cancer
statistics, 2017. CA Cancer J Clin. 67:7–30. 2017. View Article : Google Scholar : PubMed/NCBI
|
|
2
|
Fu DG: Epigenetic alterations in gastric
cancer (Review). Mol Med Rep. 12:3223–3230. 2015. View Article : Google Scholar : PubMed/NCBI
|
|
3
|
Ushijima T and Sasako M: Focus on gastric
cancer. Cancer Cell. 5:121–125. 2004. View Article : Google Scholar : PubMed/NCBI
|
|
4
|
Koppenol WH, Bounds PL and Dang CV: Otto
Warburg's contributions to current concepts of cancer metabolism.
Nat Rev Cancer. 11:325–337. 2011. View
Article : Google Scholar : PubMed/NCBI
|
|
5
|
Hanahan D and Weinberg RA: Hallmarks of
cancer: The next generation. Cell. 144:646–674. 2011. View Article : Google Scholar : PubMed/NCBI
|
|
6
|
Keith B, Johnson RS and Simon MC: HIF1α
and HIF2α: Sibling rivalry in hypoxic tumour growth and
progression. Nat Rev Cancer. 12:9–22. 2011. View Article : Google Scholar : PubMed/NCBI
|
|
7
|
Tennant DA, Durán RV and Gottlieb E:
Targeting metabolic transformation for cancer therapy. Nat Rev
Cancer. 10:267–277. 2010. View
Article : Google Scholar : PubMed/NCBI
|
|
8
|
Denko NC: Hypoxia, HIF1 and glucose
metabolism in the solid tumour. Nat Rev Cancer. 8:705–713. 2008.
View Article : Google Scholar : PubMed/NCBI
|
|
9
|
Majmundar AJ, Wong WJ and Simon MC:
Hypoxia-inducible factors and the response to hypoxic stress. Mol
Cell. 40:294–309. 2010. View Article : Google Scholar : PubMed/NCBI
|
|
10
|
Rankin EB and Giaccia AJ: The role of
hypoxia-inducible factors in tumorigenesis. Cell Death Differ.
15:678–685. 2008. View Article : Google Scholar : PubMed/NCBI
|
|
11
|
Xiao S and Zhou L: Gastric cancer:
Metabolic and metabolomics perspectives (Review). Int J Oncol.
51:5–17. 2017. View Article : Google Scholar : PubMed/NCBI
|
|
12
|
Yang W, Ma J, Zhou W, Cao B, Zhou X, Yang
Z, Zhang H, Zhao Q, Fan D and Hong L: Molecular mechanisms and
theranostic potential of miRNAs in drug resistance of gastric
cancer. Expert Opin Ther Targets. 21:1063–1075. 2017. View Article : Google Scholar : PubMed/NCBI
|
|
13
|
Jeong SM, Xiao C, Finley LW, Lahusen T,
Souza AL, Pierce K, Li YH, Wang X, Laurent G, German NJ, et al:
SIRT4 has tumor-suppressive activity and regulates the cellular
metabolic response to DNA damage by inhibiting mitochondrial
glutamine metabolism. Cancer Cell. 23:450–463. 2013. View Article : Google Scholar : PubMed/NCBI
|
|
14
|
Moffat J, Grueneberg DA, Yang X, Kim SY,
Kloepfer AM, Hinkle G, Piqani B, Eisenhaure TM, Luo B, Grenier JK,
et al: A lentiviral RNAi library for human and mouse genes applied
to an arrayed viral high-content screen. Cell. 124:1283–1298. 2006.
View Article : Google Scholar : PubMed/NCBI
|
|
15
|
Livak KJ and Schmittgen TD: Analysis of
relative gene expression data using real-time quantitative PCR and
the 2−ΔΔCT method. Methods. 25:402–408. 2001.
View Article : Google Scholar : PubMed/NCBI
|
|
16
|
Zhang Z, Li J, Zheng H, Yu C, Chen J, Liu
Z, Li M, Zeng M, Zhou F and Song L: Expression and cytoplasmic
localization of SAM68 is a significant and independent prognostic
marker for renal cell carcinoma. Cancer Epidemiol Biomarkers Prev.
18:2685–2693. 2009. View Article : Google Scholar : PubMed/NCBI
|
|
17
|
Emerling BM, Weinberg F, Liu JL, Mak TW
and Chandel NS: PTEN regulates p300-dependent hypoxia-inducible
factor 1 transcriptional activity through Forkhead transcription
factor 3a (FOXO3a). Proc Natl Acad Sci USA. 105:2622–2627. 2008.
View Article : Google Scholar : PubMed/NCBI
|
|
18
|
Bell EL, Emerling BM, Ricoult SJ and
Guarente L: SirT3 suppresses hypoxia inducible factor 1α and tumor
growth by inhibiting mitochondrial ROS production. Oncogene.
30:2986–2996. 2011. View Article : Google Scholar : PubMed/NCBI
|
|
19
|
Finley LW, Carracedo A, Lee J, Souza A,
Egia A, Zhang J, Teruya-Feldstein J, Moreira PI, Cardoso SM, Clish
CB, et al: SIRT3 opposes reprogramming of cancer cell metabolism
through HIF1α destabilization. Cancer Cell. 19:416–428. 2011.
View Article : Google Scholar : PubMed/NCBI
|
|
20
|
Adler V, Yin Z, Tew KD and Ronai Z: Role
of redox potential and reactive oxygen species in stress signaling.
Oncogene. 18:6104–6111. 1999. View Article : Google Scholar : PubMed/NCBI
|
|
21
|
Bell EL, Klimova TA, Eisenbart J,
Schumacker PT and Chandel NS: Mitochondrial reactive oxygen species
trigger hypoxia-inducible factor-dependent extension of the
replicative life span during hypoxia. Mol Cell Biol. 27:5737–5745.
2007. View Article : Google Scholar : PubMed/NCBI
|
|
22
|
Chandel NS, McClintock DS, Feliciano CE,
Wood TM, Melendez JA, Rodriguez AM and Schumacker PT: Reactive
oxygen species generated at mitochondrial complex III stabilize
hypoxia-inducible factor-1alpha during hypoxia: A mechanism of O2
sensing. J Biol Chem. 275:25130–25138. 2000. View Article : Google Scholar : PubMed/NCBI
|
|
23
|
Pore N, Jiang Z, Shu HK, Bernhard E, Kao
GD and Maity A: Akt1 activation can augment hypoxia-inducible
factor-1alpha expression by increasing protein translation through
a mammalian target of rapamycin-independent pathway. Mol Cancer
Res. 4:471–479. 2006. View Article : Google Scholar : PubMed/NCBI
|
|
24
|
Minet E, Arnould T, Michel G, Roland I,
Mottet D, Raes M, Remacle J and Michiels C: ERK activation upon
hypoxia: Involvement in HIF-1 activation. FEBS Lett. 468:53–58.
2000. View Article : Google Scholar : PubMed/NCBI
|
|
25
|
Cassavaugh JM, Hale SA, Wellman TL, Howe
AK, Wong C and Lounsbury KM: Negative regulation of HIF-1α by an
FBW7-mediated degradation pathway during hypoxia. J Cell Biochem.
112:3882–3890. 2011. View Article : Google Scholar : PubMed/NCBI
|
|
26
|
Lu K, Alcivar AL, Ma J, Foo TK, Zywea S,
Mahdi A, Huo Y, Kensler TW, Gatza ML and Xia B: NRF2 induction
supporting breast cancer cell survival is enabled by oxidative
stress-induced DPP3-KEAP1 interaction. Cancer Res. 77:2881–2892.
2017. View Article : Google Scholar : PubMed/NCBI
|
|
27
|
Ngo HK, Kim DH, Cha YN, Na HK and Surh YJ:
Nrf2 mutagenic activation drives hepatocarcinogenesis. Cancer Res.
77:4797–4808. 2017.PubMed/NCBI
|
|
28
|
Abu-Alainin W, Gana T, Liloglou T,
Olayanju A, Barrera LN, Ferguson R, Campbell F, Andrews T, Goldring
C, Kitteringham N, et al: UHRF1 regulation of the Keap1-Nrf2
pathway in pancreatic cancer contributes to oncogenesis. J Pathol.
238:423–433. 2016. View Article : Google Scholar : PubMed/NCBI
|
|
29
|
Hayes AJ, Skouras C, Haugk B and Charnley
RM: Keap1-Nrf2 signalling in pancreatic cancer. Int J Biochem Cell
Biol. 65:288–299. 2015. View Article : Google Scholar : PubMed/NCBI
|
|
30
|
Sporn MB and Liby KT: NRF2 and cancer: The
good, the bad and the importance of context. Nat Rev Cancer.
12:564–571. 2012. View
Article : Google Scholar : PubMed/NCBI
|
|
31
|
Cardone RA, Casavola V and Reshkin SJ: The
role of disturbed pH dynamics and the Na+/H+
exchanger in metastasis. Nat Rev Cancer. 5:786–795. 2005.
View Article : Google Scholar : PubMed/NCBI
|
|
32
|
Kato Y, Lambert CA, Colige AC, Mineur P,
Noël A, Frankenne F, Foidart JM, Baba M, Hata R, Miyazaki K and
Tsukuda M: Acidic extracellular pH induces matrix
metalloproteinase-9 expression in mouse metastatic melanoma cells
through the phospholipase D-mitogen-activated protein kinase
signaling. J Biol Chem. 280:10938–10944. 2005. View Article : Google Scholar : PubMed/NCBI
|
|
33
|
Lu P, Takai K, Weaver VM and Werb Z:
Extracellular matrix degradation and remodeling in development and
disease. Cold Spring Harb Perspect Biol. 3:a0050582011. View Article : Google Scholar : PubMed/NCBI
|
|
34
|
Yu J, Li J, Chen Y, Cao W, Lu Y, Yang J
and Xing E: Snail enhances glycolysis in the epithelial-mesenchymal
transition process by targeting FBP1 in gastric cancer. Cell
Physiol Biochem. 43:31–38. 2017. View Article : Google Scholar : PubMed/NCBI
|
|
35
|
Yang MH, Wu MZ, Chiou SH, Chen PM, Chang
SY, Liu CJ, Teng SC and Wu KJ: Direct regulation of TWIST by
HIF-1alpha promotes metastasis. Nat Cell Biol. 10:295–305. 2008.
View Article : Google Scholar : PubMed/NCBI
|
|
36
|
Arany Z, Foo SY, Ma Y, Ruas JL,
Bommi-Reddy A, Girnun G, Cooper M, Laznik D, Chinsomboon J,
Rangwala SM, et al: HIF-independent regulation of VEGF and
angiogenesis by the transcriptional coactivator PGC-1alpha. Nature.
451:1008–1012. 2008. View Article : Google Scholar : PubMed/NCBI
|