Introduction
Urothelial bladder cancer (UBC) is recorded as the
seventh most commonly occurring malignancy in men and the
seventeenth most common in women (1). The prevention of risk factors,
including smoking and occupational chemicals, has resulted in a
decrease of the UBC burden in Western communities; yet, no
clinically relevant differences in UBC mortality have been observed
over the past 30 years (2).
Standard treatment modalities for UBC have not
changed a lot in recent years and encompass intravesical
chemotherapy for non-muscle-invasive bladder cancer (NMIBC) and
cystectomy with cisplatin-based systemic chemotherapy for MIBC;
however, recently, immunotherapy and more precisely, atezolizumab
or pembrolizumab, has been approved by the Food and Drug
Administration for patients with metastatic disease who progressed
during or following cisplatin-based chemotherapy (1,2).
Recent insights into the biology of UBC by whole genome, RNA and
microRNA sequencing have identified molecular subtypes in MIBC with
different putative therapeutic targets and variable sensitivity to
currently available chemotherapies (3,4). These
studies are part of an ongoing effort to further characterize UBC,
using protein and gene expression profiles to identify patients who
are at risk for progression or recurrence and may benefit from a
more aggressive therapeutic approach, as well as to avoid
over-treatment of tumors with a relatively indolent clinical course
(3). Numerous genes have been
implicated in the development and progression of UBC, and their
altered expression has been attributed to gene mutations and
epigenetic changes. In the latter category, non-coding RNAs
(ncRNAs) have been demonstrated to serve important roles in
carcinogenesis and cancer metastasis via complex mechanisms,
including transcriptional and post-transcriptional regulation, and
chromatin interactions (5). The
ncRNAs are divided into small regulatory RNAs and long ncRNAs
(lncRNAs), composed of >200 nucleotides (6). Urothelial carcinoma-associated 1
(UCA1) is an lncRNA that was first isolated by Wang et
al (7) in 2006 and was
initially proposed as a urinary biomarker for the detection of UBC,
although reports about the efficiency and clinical application of
UCA1 as a diagnostic test have been controversial (8,9).
Concurrently, UCA1 was shown to have tumorigenic properties,
as shown in vitro by enhanced proliferation, invasion,
migration and therapy resistance of UBC cell lines (10,11). A
subsequent study identified UCA1 as a crucial element in
cell cycle regulation by positive indirect action on the
phosphoinositide 3-kinase (PI3K)-protein kinase B (AKT)-mechanistic
target of rapamycin pathway through the p300 coactivator cAMP
response element-binding protein (CREB) (12). The majority of these results are
provided by in vitro cellular assays, and together they
suggest that UCA1 is associated with more aggressive tumor
behavior and could therefore have prognostic implications in UBC.
Indeed, several studies, mainly conducted in Chinese patients with
solid tumors (esophageal, gastric, colorectal, prostate, breast,
endometrial, ovarian or non-small cell lung carcinoma) reported
that a high level of UCA1 expression was associated with
positive lymph node metastasis, higher clinical stage and poor
survival (13,14). To date few and contradictory data
are currently available with regard to the expression of
UCA1 [measured by reverse transcription-quantitative
polymerase chain reaction (RT-qPCR)] in series of human UBC and its
association with UBC morphology and aggressiveness (7,15). In
the present study, chromogenic in situ hybridization (CISH)
was applied to analyze the expression of UCA1 in human UBC
samples, thus integrating expression levels and in vivo
morphological context. Additionally, the study aimed to determine
the value of UCA1 as a prognostic marker in patients with
UBC and its association with other biological markers associated
with UBC aggressiveness, including p53, encoded by key tumor
suppressor gene TP53, and the proliferation marker Ki-67
(16,17).
Materials and methods
Ethics statement
The present study was approved by the Ethical
Committee of the Erasme University Hospital (Brussels, Belgium;
ref., P2015/041). According to Belgian law, no written informed
consent was required for archival material in the context of
retrospective studies. The ethical committee thus waived the
requirement for written informed consent from the participant.
Tissue samples
A total of 11 human UBC tissue microarrays (TMA) and
one normal urothelium TMA were manufactured (MiniCore tissue
arrayer; Mitogen Ltd., Harpenden, UK) using available archival
formalin-fixed and paraffin-embedded (FFPE, ISO15189 standard)
samples from cases of 271 UBC and 40 samples of normal urothelium
collected between January 1997 and December 2007 in the Erasme
Hospital Biobank (Brussels, Belgium; BE_BERA1; Biobanque Hôpital
Erasme-ULB (BERA); BE_NBWB1; Biothèque Wallonie Bruxelles (BWB);
BBMRI-ERIC). Cases for which archival material was insufficient or
not available were excluded from the analysis. The time period was
selected in order to obtain a follow-up of at least 5 years for all
patients. All the tumors are from patients who were not previously
treated for UBC (primary tumor resection), and whose
histopathological diagnoses were reviewed and characterized by an
uropathologist. Tumor grades and stages were adjusted to comply
with the new 2016 WHO classification (18) and the new 2017 TNM Classification of
Malignant Tumours (Union for International Cancer Control)
(19) (Table I). For each case, six tissues cores
of 600 µm in diameter targeting the tumor area (without distinction
between the areas of bladder wall) and four tissues cores of 600 µm
in diameter targeting the normal urothelium were included in the
TMAs. Subsequent to validating each TMA for RNA and tissue fixation
quality, 208 out of the 271 preselected UBC cases and 20 samples of
normal urothelium were included. The available clinical and
pathological features of the patients and their tumors are
described in Table I. Patient
outcomes were characterized in terms of disease-free survival (DFS)
and cancer-specific survival (CSS), i.e., periods from the date of
the first tumor resection (the date of the diagnosis) until the
date of recurrence or mortality (DFS) or the date of mortality due
to tumor progression (CSS).
 | Table I.Patient demographics and baseline
features (n=208). |
Table I.
Patient demographics and baseline
features (n=208).
| Clinical
features | NMIBC (n=145) | MIBC (n=63) |
|---|
| Median age (range),
years | 69.4 (35.4–97) | 71.1
(33.9–91.3) |
| Sex, n (%) |
|
Male | 118 (81.4) | 54 (85.7) |
|
Female | 27 (18.6) | 9 (14.3) |
| UBC morphology, n
(%) |
|
Papillary lesions | 140 (96.6) | 46 (73.0) |
| Flat
lesions | 5 (3.4) | 17 (27.0) |
| UBC variant
histology, n (%) |
|
Present | 11 (7.6) | 27 (42.9) |
|
Squamous | 3 (2.1) | 13 (20.6) |
|
Glandular | 2 (1.4) | 7 (11.1) |
|
Micropapillary | 6 (4.1) | 8 (12.7) |
|
Sarcomatoid | 1 (0.7) | 6 (9.5) |
|
Absent | 134 (92.4) | 36 (57.1) |
| Multifocality, n
(%) |
|
Present | 40 (27.6) | 20 (31.7) |
|
Absent | 95 (65.5) | 38 (60.3) |
|
Unknown | 10 (6.9) | 5 (8.0) |
| Concomitant CIS, n
(%) |
|
Present | 19 (13.1) | 30 (47.6) |
|
Absent | 125 (86.2) | 26 (41.3) |
|
Unknowna | 1 (0.7) | 7 (11.1) |
| Lymphovascular
invasion, n (%) |
|
Present | 5 (3.4) | 36 (57.1) |
|
Absent | 109 (75.2) | 18 (28.6) |
|
Unknowna | 31 (21.4) | 9 (14.3) |
| 2016 WHO grading, n
(%) |
|
PUNLMP | 31 (21.4) | 0 (0.0) |
| Low
grade | 64 (44.1) | 1 (1.6) |
| High
grade | 50 (34.5) | 62 (98.4) |
| Recurrence, n
(%) |
|
Yes | 55 (62.1) | 31 (49.2) |
| No | 55 (37.9) | 32 (50.8) |
| Mortalities, n
(%) |
|
Yes | 4 (2.7) | 12 (19) |
| No | 141 (97.3) | 51 (81) |
| Median follow-up
(range) |
|
Months | 83.6 (0.1–212) | 14.1
(0.0–189.2) |
|
Years | 7 (0.0–17.7) | 1.2 (0.0–15.8) |
UCA1 CISH
Detection of UCA1 RNA was performed by CISH
using the RNAscope® Singleplex Target Probe and the
RNAscope 2.0 HD Detection kit (Advanced Cell Diagnostics, Newark,
CA, USA). Sections (5-µm thick) of all TMAs were baked at 60°C for
1 h and deparaffinized. Slides were rehydrated and three pre-treat
solutions were successively applied according to the manufacturers
recommendations. Following retrieval, UCA1 anti-sense probe
(RNAscope Singlepex Target Probe), positive (RNAscope Positive
Control Probe-PPIB; cat. no. 313901) or negative control probe
(RNAscope Negative Control Probe-DapB; cat. no. 310043) were
dispensed onto slides at 40°C for 2 h. Following hybridization,
slides were incubated with six oligonucleotide probes for signal
amplification. The first four amplifiers were hybridized at 40°C
and the last two were incubated at room temperature. Following each
hybridization step, slides were washed with a washing buffer two
times at room temperature. For chromogenic detection, equal volumes
of BROWN-A and BROWN-B DAB substrates from the CISH kit were
dropped onto each slide for 10 min at room temperature. Tissue
nuclei were then stained using Gill's hematoxylin (Vector
Laboratories, Ltd., Peterborough, UK; cat. no. H-3401) for 2 min at
room temperature. Only cases for which the positive (PPIB) and the
negative (bacterial DapB gene, which encodes for the
dihydrodipicolinate reductase protein) probes were validated on
tissue cores (to ensure the quality of the RNA in the tissue and
the absence of false-positive results, respectively) were included
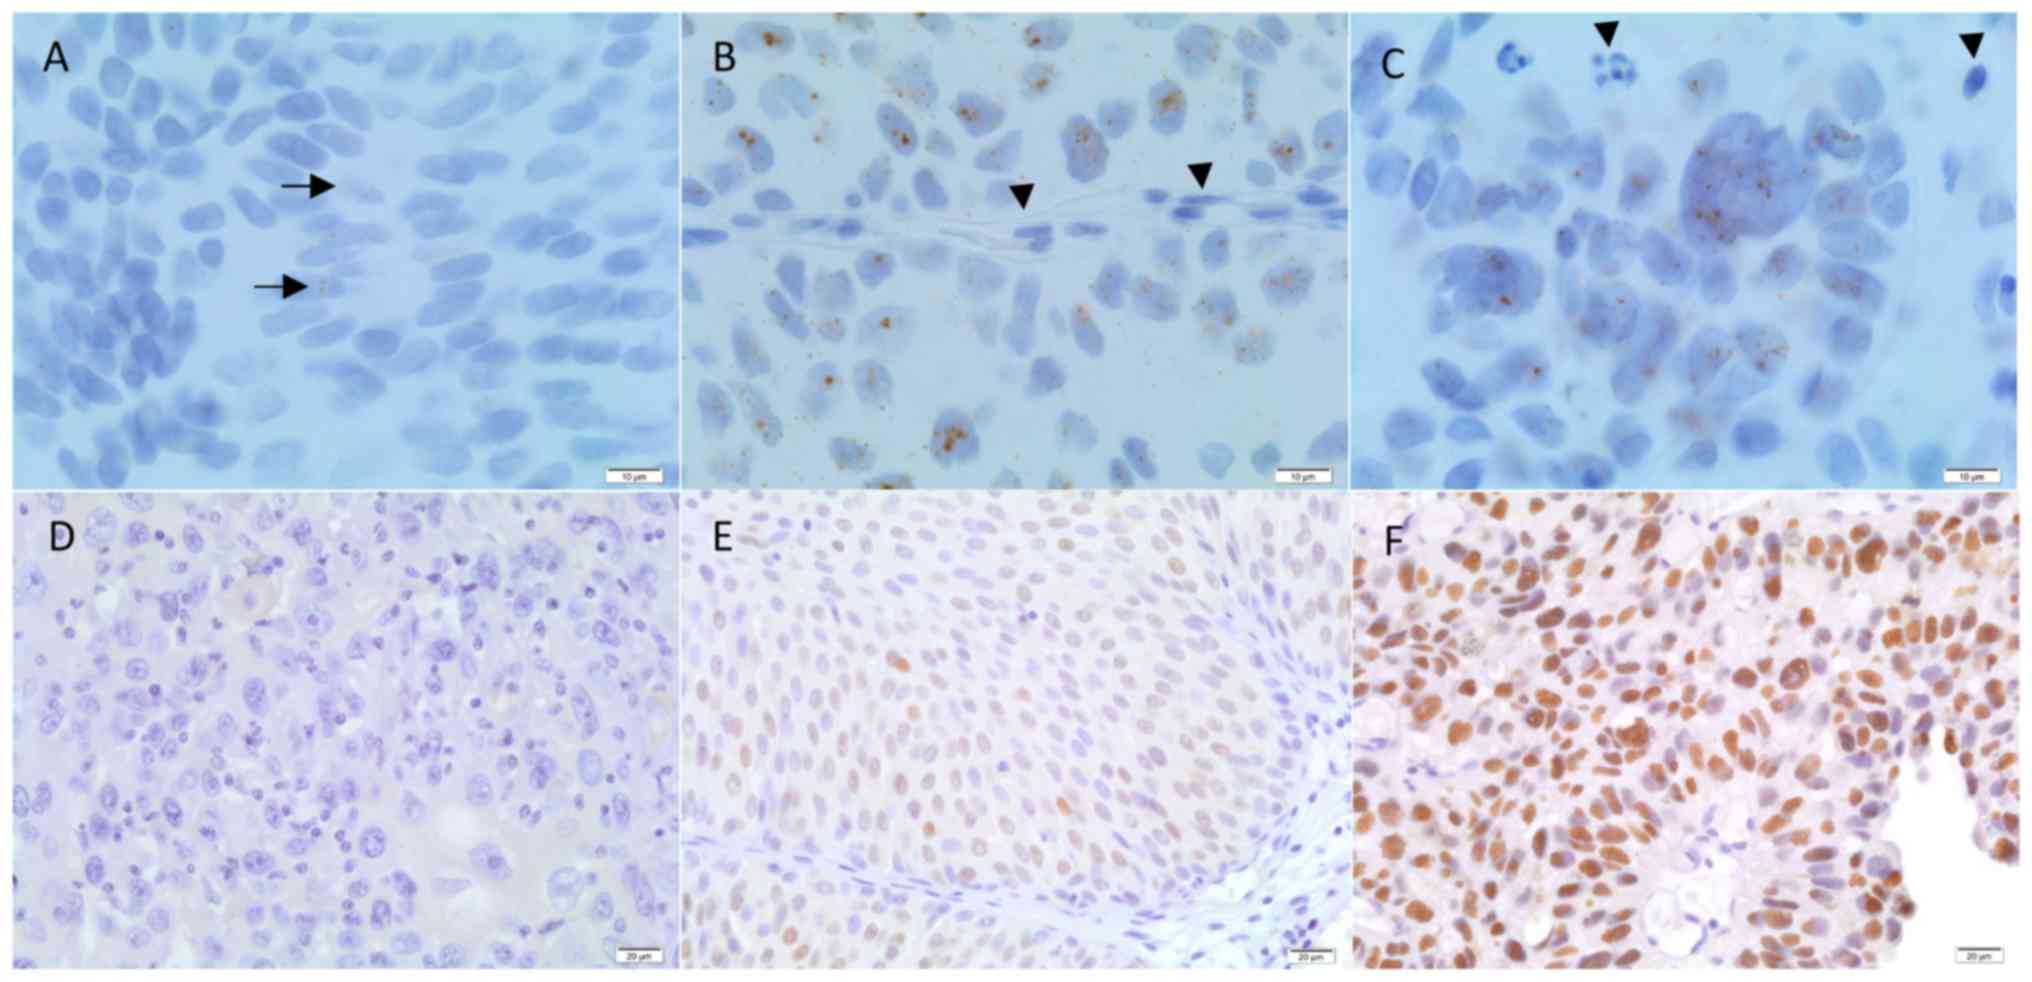
in the study. UCA1 CISH staining was visualized by using
Spot Browser V2e (Alphelys, Plaisir, France) and scored by two
independent observers using a three-tiered scoring system as
follows: 0, no staining; 1, a few dots observed in a few tumor
cells; and 2, >10 dots homogeneously observed in tumor cells;
Fig. 1). For each UBC case, the
mean score of the 6 tissue cores was calculated and the case was
categorized as ‘UCA1-negative or with low expression’ and as
‘UCA1-positive or overexpressed’ if the mean score was ≤1
and >1, respectively.
Immunohistochemistry (IHC)
Sections (5-µm thick) of all TMAs were subjected to
standard IHC on a Ventana Discovery XT (Ventana Medical Systems,
Inc., Tucson, AZ, USA) using the DABMap detection system according
to the manufacturer's protocols. Briefly, the slides were incubated
with the rabbit monoclonal anti-Ki-67 antibody for 24 min at 37°C
(RTU antibody: ~2 µg/ml, clone 30-9; cat. no. 790-4286; Ventana
Medical Systems, Inc.) or with the mouse monoclonal anti-p53
antibody for 28 min at 37°C (RTU antibody: ~2.5 µg/ml, clone
Bp53-11; cat. no. 760-2542; Ventana Medical Systems, Inc.). The
slides were washed and incubated with the biotinylated secondary
antibody (1:200 dilution; cat. no. BA-2001 for anti-mouse antibody;
cat. no. BA-1000 for anti-rabbit antibody; both Vector
Laboratories, Ltd.) for 24 min at 37°C and 20 min at 37°C,
respectively, followed by the addition of complex
avidin-horseradish peroxidase. Immunostainings were detected by
incubation with diaminobenzidine and hydrogen peroxide. All IHC
slides were counterstained with Gill's hematoxylin for 2 min at
room temperature, dehydrated and mounted. For each staining, an
external positive control was included as well as a negative
control, which entailed replacing the primary antibody with
non-immune serum (Dako; Agilent Technologies, Inc., Santa Clara,
CA, USA). In addition, anti-vimentin immunostaining (RTU antibody:
~2.5 µg/ml, clone V9; cat. no. 790-2917; Ventana Medical Systems,
Inc.) for 24 min at 37°C was performed on each TMA for the quality
control of tissue fixation. Two independent observers performed the
semi-quantitative assessment of p53 IHC expression by using a
three-tier score as follows: 0, no staining; 1, ≤25% of cells with
weak, heterogeneous cytoplasmic and nuclear staining; and 2,
>25% of cells with high homogeneous nuclear staining (Fig. 1). For discordant cases, a third
pathologist blinded to previous results reclassified the p53 IHC
staining. Ki-67 slides were digitalized using a NanoZoomer 2.0 HT
(Hamamatsu Photonics K.K., Hamamatsu, Japan) and Ki-67 expression
was quantitatively evaluated using Visiomorph DP 5.1 (Visiopharm,
Hoersholm, Denmark) in the tumor areas manually selected on the
digital slides by a pathologist. The Ki-67 labeling index
(Ki-67_LI), corresponding to the ratio between the surface area
occupied by the positive nuclei and the total nucleus area, was
globally computed for each case (across the 6 cores), as previously
detailed (20,21). Based on published data (16), a threshold of 25% in terms of
Ki-67_LI was used for statistical analyses.
Statistical analysis
All statistical analyses were performed using
Statistica 12 (StatSoft, Inc., Tulsa, OK, USA). Comparisons between
two independent groups of numerical data were performed using the
non-parametric Mann-Whitney test. The association between two
qualitative variables was assessed using Fisher's exact test or the
χ2 test, depending on whether the two variables were
binary or not. Univariate survival analyses were performed using a
standard Kaplan-Meier analysis and a log-rank test, with the
exception of cases of continuous variables, for which univariate
Cox regression was used. The analyses were completed using
multivariate Cox regression; when analyzing the set of clinical
variables, those with univariate results of P<0.05 were
selected. The potential contributions of the biological variables
were then tested to the final ‘clinical’ model by adjusting for
those for which the univariate results indicated a P-value of
<0.1. For each statistical analysis, the cases with missing
value(s) in the concerned variable(s) were omitted.
Results
As illustrated in Fig.
1A-C, the CISH methodology detected UCA1 dot expression in the
cytoplasm and in the nucleus of urothelial normal and tumor cells.
All the normal urothelium cases showed UCA1 dot positivity (data
not shown). No UCA1 dot staining was observed in endothelial,
stromal or inflammatory cells (Fig.
1A-C). UCA1 dot positivity was detected in 166 out of the 208
UBC included in the present study (80%). According to the
semi-quantitative scoring, UCA1 overexpression (with a positivity
mean score of >1) was observed in 72/208 UBC (35%), including 55
(76%) NMIBC [i.e. 32/84 (38%) pTa and 23/61 (38%) pT1] and 17 (24%)
MIBC, respectively (Table II).
UCA1 overexpression was not statistically associated with tumor
morphology (papillary vs. flat lesions), presence of a secondary
histological variant (including squamous, sarcomatoid, glandular or
micropapillary mixed UBC tumors), tumor multifocality or the
presence of concomitant carcinoma in situ (CIS) (Table II). However, UBC overexpressing
UCA1 was statistically associated with less lymphovascular
invasion compared with UBC that failed to overexpress UCA1
(P=0.02). No statistical association was found between UCA1
overexpression and UBC tumor grade (papillary urothelial neoplasm
of low malignant potential, low-grade and high-grade tumors) or
stage (‘pTa, pT1, pT2, pT3, pT4’ or ‘NMIBC vs. MIBC’) (Table II). Regarding p53 expression in
UBC, it was noted that the complete absence of p53 expression
(i.e., a score of 0; Fig. 1D) and
strong and diffuse nuclear p53 staining in >25% of UBC cells
(i.e., a score of 2; Fig. 1F)
followed similar profiles in terms of UBC aggressiveness as opposed
to the weak and heterogeneous p53 expression pattern (i.e., a score
of 1) (data not shown); these results were similar to those of
previous studies regarding p53 expression in serous ovarian and
endometrial carcinoma (22–24). The data obtained from UBC associated
with a p53 ‘score 0’ and a p53 ‘score 2’ were grouped (referred to
as the ‘p53-mutated immunoprofile’), as opposed to the p53 ‘score
1’ (referred to as the ‘p53-wild-type immunoprofile’), for use in
future statistical analyses. These analyses showed that, compared
with the ‘p53-wild-type’ immunoprofile, the ‘p53-mutated’
immunoprofile was observed significantly more in association with
flat UBC morphology (P=0.01), presence of a secondary histological
variant (P=0.00001), concomitant CIS (P=0.0006), lymphovascular
invasion (P=0.0002), UBC tumor high-grade (P=0.00001) and UBC tumor
high-stage (P=0.00003) (Table II).
Similarly, a high Ki-67 proliferative index (>25%) was observed
significantly more in association with more aggressive UBC, i.e.,
UBC with flat urothelial morphology (P=0.04), presence of a
secondary histological variant (P=0.003), concomitant CIS
(P=0.00003), lymphovascular invasion (P<0.00001), tumor grade
(P<0.00001) and tumor stage (P<0.00001; Table II).
| Table II.Biomarker expression and associations
with pathological features of UBC. |
Table II.
Biomarker expression and associations
with pathological features of UBC.
|
| UCA1 RNA
(CISH) (n=208) | p53 nuclear
staining (IHC) (n=199) | Ki-67 nuclear
staining (%) (n=205) |
|---|
|
|
|
|
|
|---|
| Feature | Negative or low
expression (n=136), n (%) | Positive
(overexpression) (n=72), n (%) | P-value | Weak and
heterogeneous (n=125), n (%) | Negative or high
(n=74), n (%) | P-value | <25% (n=149) n
(%) | ≥25% (n=56) n
(%) | P-value |
|---|
| UBC morphology |
|
Papillary lesions | 121 (89) | 65 (90) | ns | 118 (94) | 62 (84) | 0.01 | 137 (92) | 46 (82) | 0.04 |
| Flat
lesions | 15 (11) | 7 (10) |
| 7 (6) | 12 (16) |
| 12 (8) | 10 (18) |
|
| UBC variant
histologya |
|
Absent | 107 (79) | 63 (87.5) | ns | 114 (91) | 48 (65) | 0.00001 | 129 (87) | 38 (68) | 0.003 |
|
Present | 29 (21) | 9 (12.5) |
| 11 (9) | 26 (35) |
| 20 (13) | 18 (32) |
|
| Multifocality |
|
Absent | 92/129 (71) | 41/64 (64) | ns | 84/114 (74) | 45/71 (63) | ns | 97/139 (70) | 34/51 (67) | ns |
|
Present | 37/129 (29) | 23/64 (36) |
| 30/114 (26) | 26/71 (37) |
| 42/139 (30) | 17/51 (33) |
|
|
Unknown | 7 | 8 |
| 11 | 3 |
| 10 | 5 |
|
| Concomitant
CIS |
|
Absent | 95/130 (73) | 56/70 (80) | ns | 101/120 (84) | 44/71 (62) | 0.0006 | 122/147 (83) | 26/50 (52) | 0.00003 |
|
Present | 35/130 (27) | 14/70 (20) |
| 19/120 (16) | 27/71 (38) |
| 25/147 (17) | 24/50 (48) |
|
|
Unknownb | 6 | 2 |
| 5 | 3 |
| 2 | 6 |
|
| Lymphovascular
invasion |
|
Absent | 83/117 (71) | 44/51 (86) | 0.02 | 83/97 (86) | 38/64 (59) | 0.0002 | 103/119 (87) | 21/46 (46) | <0.00001 |
|
Present | 34/117 (29) | 7/51 (14) |
| 14/97 (14) | 26/64 (41) |
| 16/119 (13) | 25/46 (54) |
|
|
Unknownb | 19 | 21 |
| 28 | 10 |
| 30 | 10 |
|
| 2016 WHO
grading |
|
PUNLMP | 20 (15) | 11 (15) |
| 23 (18) | 8 (11) |
| 31 (21) | 0 |
|
| Low
grade | 41 (30) | 24 (33) | ns | 52 (42) | 12 (16) | 0.00001 | 61 (41) | 3 (5) | <0.00001 |
| High
grade | 75 (55) | 37 (51) |
| 50 (40) | 54 (73) |
| 57 (38) | 53 (95) |
|
| TNM staging (UICC
2017; 8th ed.) |
| NMIBC
(<pT2) | 90 (66) | 55 (76) | ns | 101 (81) | 39 (53) | 0.00003 | 121 (81) | 21 (37) | <0.00001 |
| MIBC
(≥pT2) | 46 (34) | 17 (24) |
| 24 (19) | 35 (47) |
| 28 (19) | 35 (63) |
|
To evaluate the prognostic contribution of
UCA1 overexpression in patients with UBC, first, the impact
of the clinical factors (listed in Table I) on DFS and CSS (Table III) was analyzed. Univariate
survival rate analyses revealed that patient age (P=0.0003),
multifocality (P=0.03), concomitant CIS (P=0.00005), lymphovascular
tumor cell invasion (P<0.00001), UBC tumor high-grade (P=0.0003)
and UBC tumor high-stage (P=0.00002) were all significantly
associated with reduced DFS rate. With the exception of patient age
and multifocality, the same clinical factors were all significantly
associated with reduced survival rate (P<0.01 and P<0.001
respectively, Table III).
Regarding UCA1 expression, no significant impact was
observed on DFS (Table III).
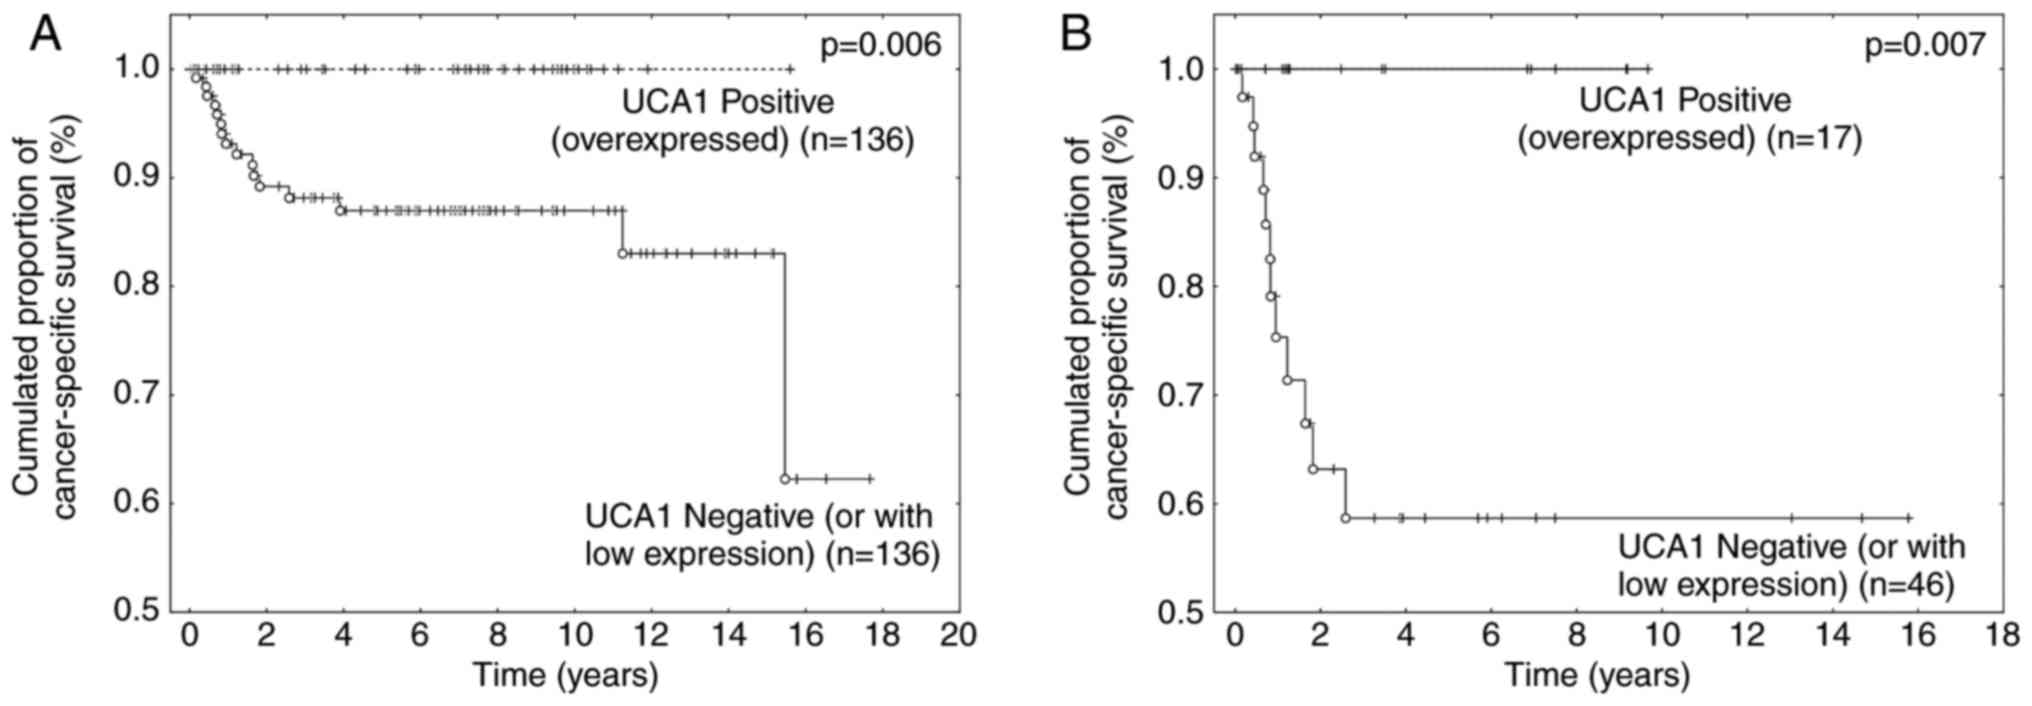
Conversely, UCA1 overexpression was significantly associated
with increased survival rate in UBC patients (P=0.006), and this
result was independent of tumor stage (Fig. 2A and B). Indeed, patients with MIBC
that overexpressed UCA1 were associated with a 5-year
survival rate of 100%, while the 5-year survival rate was only 58%
for patients whose MIBC failed to overexpress the biomarker
(P=0.007; Fig. 2B). All patients
with UBC that overexpressed UCA1 in the present series
remained alive at the end of this study (Fig. 2A and B). Considering only the
UCA1 group with ‘negative or with low expression’,
multivariate survival analyses combining tumor stage, concomitant
CIS and lymphovascular invasion highlighted a high tumor stage
(≥pT2) as being the sole independent prognostic factor associated
with worse survival rate for UBC patients (P=0.003; data not
shown).
| Table III.Univariate survival analyses for
patients with UBC. |
Table III.
Univariate survival analyses for
patients with UBC.
| Feature | Disease-free
survival, P-value | Cancer-specific
survival, P-value |
|---|
| Age,
yearsa | 0.0003 | ns |
| UBC morphology |
| Papillary
lesions |
| Flat
lesions | ns | ns |
| UBC variant
histologyb,c |
| Absent |
|
Present | ns | ns |
|
Multifocalityb |
| Absent |
|
Present | 0.03 | ns |
| Concomitant
CISb |
| Absent |
|
Present | 0.00005 | <0.00001 |
| Lymphovascular
invasionb |
| Absent |
|
Present | <0.00001 | 0.0006 |
| 2016 WHO
gradingb |
| Low grade |
| High
grade | 0.0003 | 0.002 |
| TNM staging |
| (UICC 2017; 8th
ed.)b |
| NMIBC
(<pT2) |
| MIBC
(≥pT2) | 0.00002 | <0.00001 |
| UCA1
overexpressionb |
| Negative or low
expression |
|
Positive (overexpression) | ns | 0.006 |
Finally, the study investigated whether the
expression of UCA1, p53 and Ki-67 was interrelated. As noted
in Table IV, UCA1
overexpression was more frequently observed in association with
weak and heterogeneous expression of p53 (i.e., a ‘p53-wildtype
immunoprofile’; P=0.003) and with a low Ki-67 proliferative index
(<25%; P=0.008), compared with the absence of UCA1
overexpression.
| Table IV.Interrelation between expression of
UCA1, p53 and Ki-67 in urothelial bladder cancer. |
Table IV.
Interrelation between expression of
UCA1, p53 and Ki-67 in urothelial bladder cancer.
|
| UCA1 RNA
(CISH) (n=208) | p53 nuclear
staining (IHC) (n=199)a | Ki-67 nuclear
staining (%) (n=205)a |
|---|
|
|
|
|
|
|---|
| Factor | Negative or low
expression (n=136), n (%) | Positive
(overexpression) (n=72), n (%) | P-value | Weak and
heterogeneous (n=125), n (%) | Negative or high
(n=74), n (%) | P-value | <25% (n=149) n
(%) | ≥25% (n=56) n
(%) | P-value |
|---|
| UCA1 RNA
(CISH) |
|
Negative or low
expression | na | na |
| 73/125 (58) | 58/74 (78) | 0.003 | 89/149 (60) | 44/56 (79) | 0.008 |
|
Positive (overexpression) | na | na |
| 52/125 (42) | 16/74 (22) |
| 60/149 (40) | 12/56 (21) |
|
| p53 nuclear
staining (IHC) |
| Weak
and heterogeneous | 73/131 (56) | 52/68 (76) | 0.003 | na | na |
| 107/145 (74) | 18/54 (33) | <0.00001 |
|
Negative or high | 58/131 (44) | 16/68 (24) |
| na | na |
| 38/145 (26) | 36/54 (67) |
|
|
Unknowna | 5 | 4 |
|
|
|
| 4 | 2 |
|
| Ki-67 nuclear
staining (IHC, %) |
|
<25% | 89/133 (67) | 60/72 (83) | 0.008 | 107/125 (86) | 38/74 (51) | <0.00001 | na | na |
|
|
≥25% | 44/133 (33) | 12/72 (16) |
| 18/125 (14) | 36/74 (49) |
| na | na |
|
|
Unknowna | 3 | 0 |
|
|
|
|
|
|
|
Discussion
Advances in the sequencing of the human genome led
to the determination that protein-coding genes compose <3% of
the human genome. Yet >80% of genes are actively transcribed to
RNA without protein-coding potential, referred to as ncRNAs
(5). Accumulating evidence has
shown that lncRNAs are often altered in urological cancer types,
notably in the prostate and kidneys, and in UBC (25,26).
Among these lncRNAs, UCA1 was originally reported to be
involved in UBC carcinogenesis, promoting in vitro
tumorigenicity and invasive behavior (10–12)
Moreover, recent meta-analyses investigating the association
between the expression levels of UCA1 and prognosis (using
RT-qPCR methodology approaches) noted that UCA1 was
implicated in the biology of other solid tumors, including gastric,
colorectal, lung, breast and ovarian carcinoma (13,14).
Data from those meta-analyses (mainly conducted in Chinese
patients) concluded a global positive association between a high
expression level of UCA1 RNA and tumor stage, lymph node
metastasis and poor survival (13,14).
Taking into account the previous in vitro results regarding
UCA1 involvement in the carcinogenesis of UBC cell lines, it
was notable and unexpected that these meta-analyses did not
included studies on patients with UBC (13,14).
In 2017, Droop et al (15)
reported the RT-qPCR expression levels of several lncRNAs
(including UCA1) in a series of 106 UBC cases in order to
assess the correlation with clinicopathological parameters,
including tumor grade, tumor stage and patient survival; the data
of the publicly available bladder urothelial carcinoma dataset from
The Cancer Genome Atlas (TCGA) was also analyzed (15). In the series, it was found that
patients with high UCA1 expression experienced considerably
better overall survival rate compared with that of patients with
low levels of UCA1 expression, but this result was not
confirmed in the TCGA dataset (15). Notably, the present study confirmed
this result in a larger series of UBC cases and using another
methodology (CISH instead of RT-qPCR). Indeed, it was shown that
patients whose UBC overexpressed UCA1 were associated with
improved overall survival rate compared with that of patients whose
UBC failed to overexpress this biomarker, and this result was
significantly maintained in the aggressive group of MIBC. In the
present series, no patient with MIBC that overexpressed UCA1
succumbed during the follow-up (>5 years), as opposed to a
5-year survival rate of 58% in the group with UBC that did not
overexpress UCA1. Notably [and similarly to Droop et
al (15)], no statistical
association was found between UCA1 overexpression and known
pathological prognostic factors in UBC, including tumor
architecture (papillary vs. flat UBC), presence of a histological
secondary variant, tumor multifocality, concomitant CIS, tumor
grade and tumor stage. By consequence, UCA1 overexpression
appears to be a potential novel independent molecular biomarker
associated with an improved CSS in patients with UBC in general,
and with MIBC, in particular. This result opposes data provided by
Wang et al (7) in 2006,
which positively associated the expression of UCA1 in 46 UBC
cases with tumor stage, grade and multicentricity. However, precise
data regarding UBC sample characterization and patient follow-up
were not available in the study manuscript or supplementary data.
The present results were also strengthened by the negative
association between UCA1 expression and two biomarkers
(Ki-67 and p53) associated with UBC aggressiveness. Indeed, UBC
that overexpressed UCA1 more often presented a low Ki-67
proliferative index and a p53 ‘wild-type’ immunoprofile and thus
behaved less aggressively as compared with UBC that failed to
overexpress UCA1.
In the present study, the CISH methodology was
selected instead of RT-qPCR as CISH enables the gathering of
genetic information in the context of tissue morphology, i.e., the
tumor cells and their microenvironment. This methodology is
currently used in pathology labs to improve patient management
(27). UCA1 signal dots was
detected in 80% of all the UBC samples, but clear UCA1
overexpression was only observed in 35% of them. As illustrated in
Fig. 1B-C, UCA1
overexpression was only considered when numerous UCA1 dots
were observed in urothelial tumor cells, and these results were
concordantly obtained by two different pathologists. Consequently,
the positivity threshold for CISH used in the present study should
be easily applied by pathologists in daily practice for the
management of patients with UBC.
Genes and pathways that are key drivers of UBC have
been identified by previous genome-wide expression and sequencing
studies, and a complex landscape with numerous molecular subclasses
that travel across conventional tumor grade and stage have been
revealed (3,28). UBC are genomically heterogeneous,
with frequent alterations in genes regulating receptor kinase
signaling, cell cycle control and chromatin state, resulting in
distinct clinical outcomes (29).
Using next-generation sequencing, Kim et al (29) identified PI3K/AKT pathway
alterations in 35% of UBC cases, and noted that in UBC patients
treated with radical cystectomy, PIK3CA mutation or
PI3K/AKT pathway alterations are associated with a
significant favorable prognosis, whereas TP53 and
CDKN2A alterations are associated with poor outcomes.
Notably, two recent publications linked UCA1 to PI3K/AKT
pathway activation (12), but also
to CDKN2A-p16INK mRNA stabilization (30). Yang et al (12) showed that UCA1 stimulated
cell cycle progression by increasing CREB expression via activation
of the PI3K/AKT pathway in vitro in the human bladder cancer
BLZ-211 cell line, with UCA1 expression being positively
correlated with AKT1 expression and AKT phosphorylation. In 2014,
Kumar et al (30)
demonstrated that UCA1 may act as a tumor suppressor gene,
as its overexpression of UCA1 was able to induce cellular
senescence at least partially by the disruption of p16INK
mRNA and hnRNPA1 interactions, resulting in increased
CDKN2A-p16INK mRNA stability (30). In accord with this study, the
present study showed that the overexpression of UCA1 was
more frequently observed in association with a low Ki-67
proliferative index. Taken together, these previous studies appear
to be in line with the present results suggesting that UCA1
overexpression should be associated with less aggressive bladder
tumors.
In conclusion, the present study provides novel
evidence regarding UCA1 expression in urothelial tumor cells
and its involvement in UBC carcinogenesis. The results highlight
the independent contribution of UCA1 overexpression towards
improved outcomes for patients with UBC. The findings confirm the
large heterogeneity that composes the MIBC group and may open novel
avenues in order to better stratify patients with regards to
management and treatment.
Acknowledgements
The authors would like to thank their collaborators
from the Erasme Hospital Biobank (Brussels, Belgium; BE_BERA1;
Biobanque Hôpital Erasme-ULB (BERA); BE_NBWB1; Biothèque Wallonie
Bruxelles (BWB); BBMRI-ERIC) for having made available a large
number of UBC samples. The authors would particularly like to thank
DiaPath, part of the Center for Microscopy and Molecular Imaging
(CMMI, Charleroi, Hainaut, Belgium) for TMA manufacturing, CISH and
IHC experiments, and biomarker quantification.
Funding
Funding for the present study was from Fonds Yvonne
Boël (Brussels, Belgium; http://www.fondsyvonneboel.be/). The Center for
Microscopy and Molecular Imaging is supported by the European
Regional Development Fund (http://ec.europa.eu/regional_policy/thefunds/regional/index_en.cfm)
and the Walloon Region (http://www.wallonie.be/). The funders had no role in
study design, data collection and analysis, decision to publish or
preparation of the manuscript.
Availability of data and materials
All data generated or analyzed during this study are
included in this published article.
Authors' contributions
LL and DM: Constitution of the clinical series,
validation of quality controls and biomarkers quantification, and
assistance in writing the manuscript. MLM: Implementation of the
methodology for setting up UCA1 detection by CISH and
assiatnce in writing the manuscript. JA: TMA manufacturing, IHC and
CISH experiments, quality control validation, and assistance in
writing the manuscript. YRVE: Slide digitalization and
computer-assisted quantitative analyses of KI-67 labeling index
using Visiomorph DP 5.1. TR: Assistance with clinical case
selection. CD: Statistical analyses and writing of the manuscript.
IS: Data analyses and assistance in writing the manuscript. SR:
Case reviews and classifications, biomarker quantification, data
analyses and manuscript writing.
Ethics approval and consent to
participate
The present study was approved by the Ethical
Committee of the Erasme University Hospital (Brussels, Belgium;
ref., P2015/041).
Patient consent for publication
According to Belgian law, no written informed
consent was required for archival material in the context of
retrospective studies. The ethical committee thus waived the
requirement for written informed consent from the participant.
Competing interests
The authors declare that they have no competing
interests.
References
|
1
|
Babjuk M, Böhle A, Burger M, Capoun O,
Cohen D, Compérat EM, Hernández V, Kaasinen E, Palou J, Rouprêt M,
et al: EAU guidelines on non-muscle-invasive urothelial carcinoma
of the bladder: Update 2016. Eur Urol. 71:447–461. 2017. View Article : Google Scholar : PubMed/NCBI
|
|
2
|
Witjes Alfred J, Lebret T, Compérat EM,
Cowan NC, De Santis M, Bruins HM, Hernández V, Espinós EL, Dunn J,
Rouanne M, et al: Updated 2016 EAU guidelines on muscle-invasive
and metastatic bladder cancer. Eur Urol. 71:462–475. 2017.
View Article : Google Scholar : PubMed/NCBI
|
|
3
|
Knowles MA and Hurst CD: Molecular biology
of bladder cancer: New insights into pathogenesis and clinical
diversity. Nat Rev Cancer. 15:25–41. 2015. View Article : Google Scholar : PubMed/NCBI
|
|
4
|
Sjödahl G, Lauss M, Lövgren K, Chebil G,
Gudjonsson S, Veerla S, Patschan O, Aine M, Fernö M, Ringnér M, et
al: A molecular taxonomy for urothelial carcinoma. Clin Cancer Res.
18:3377–3386. 2012. View Article : Google Scholar : PubMed/NCBI
|
|
5
|
Yang G, Lu X and Yuan L: LncRNA: A link
between RNA and cancer. Biochim Biophys Acta. 1839:1097–1109. 2014.
View Article : Google Scholar : PubMed/NCBI
|
|
6
|
Zhang Q, Su M, Lu G and Wang J: The
complexity of bladder cancer: Long noncoding RNAs are on the stage.
Mol Cancer. 12:1012013. View Article : Google Scholar : PubMed/NCBI
|
|
7
|
Wang XS, Zhang Z, Wang HC, Cai JL, Xu QW,
Li MQ, Chen YC, Qian XP, Lu TJ, Yu LZ, et al: Rapid identification
of UCA1 as a very sensitive and specific unique marker for human
bladder carcinoma. Clin Cancer Res. 12:4851–4858. 2006. View Article : Google Scholar : PubMed/NCBI
|
|
8
|
Milowich D, Le Mercier M, De Neve N,
Sandras F, Roumeguere T, Decaestecker C, Salmon I and Rorive S:
Diagnostic value of the UCA1 test for bladder cancer
detection: A clinical study. Springerplus. 4:3492015. View Article : Google Scholar : PubMed/NCBI
|
|
9
|
Srivastava AK, Singh PK, Rath SK, Dalela
D, Goel MM and Bhatt ML: Appraisal of diagnostic ability of UCA1 as
a biomarker of carcinoma of the urinary bladder. Tumour Biol.
35:11435–11442. 2014. View Article : Google Scholar : PubMed/NCBI
|
|
10
|
Xue M, Li X, Li Z and Chen W: Urothelial
carcinoma associated 1 is a hypoxia-inducible factor-1α-targeted
long noncoding RNA that enhances hypoxic bladder cancer cell
proliferation, migration, and invasion. Tumour Biol. 35:6901–6912.
2014. View Article : Google Scholar : PubMed/NCBI
|
|
11
|
Wang X, Gong Y, Jin B, Wu C, Yang J, Wang
L, Zhang Z and Mao Z: Long non-coding RNA urothelial carcinoma
associated 1 induces cell replication by inhibiting BRG1 in 5637
cells. Oncol Rep. 32:1281–1290. 2014. View Article : Google Scholar : PubMed/NCBI
|
|
12
|
Yang C, Li X, Wang Y, Zhao L and Chen W:
Long non-coding RNA UCA1 regulated cell cycle distribution via CREB
through PI3-K dependent pathway in bladder carcinoma cells. Gene.
496:8–16. 2012. View Article : Google Scholar : PubMed/NCBI
|
|
13
|
Liu FT, Zhu PQ, Luo HL, Zhang Y and Qiu C:
Prognostic value of long non-coding RNA UCA1 in human solid tumors.
Oncotarget. 7:57991–58000. 2016.PubMed/NCBI
|
|
14
|
Wang X, Peng F, Cheng L, Yang G, Zhang D,
Liu J, Chen X and Zhao S: Prognostic and clinicopathological role
of long non-coding RNA UCA1 in various carcinomas. Oncotarget.
8:28373–28384. 2017.PubMed/NCBI
|
|
15
|
Droop J, Szarvas T, Schulz WA, Niedworok
C, Niegisch G, Scheckenbach K and Hoffmann MJ: Diagnostic and
prognostic value of long noncoding RNAs as biomarkers in urothelial
carcinoma. PLoS One. 12:e01762872017. View Article : Google Scholar : PubMed/NCBI
|
|
16
|
Ding W, Gou Y, Sun C, Xia G, Wang H, Chen
Z, Tan J, Xu K and Qiang D: Ki-67 is an independent indicator in
non-muscle invasive bladder cancer (NMIBC); combination of EORTC
risk scores and Ki-67 expression could improve the risk
stratification of NMIBC. Urol Oncol. 32(42): e13–e19. 2014.
|
|
17
|
Margulis V, Shariat SF, Ashfaq R,
Sagalowsky AI and Lotan Y: Ki-67 is an independent predictor of
bladder cancer outcome in patients treated with radical cystectomy
for organ-confined disease. Clin Cancer Res. 12:7369–7373. 2006.
View Article : Google Scholar : PubMed/NCBI
|
|
18
|
Moch H, Humphrey PA, Ulbright TM and
Reuter VE: WHO Classification of Tumours of the Urinary System and
Male Genital Organs. 4th edition. IARC; Lyon 8: 2016
|
|
19
|
Brierley JD, Gospodarowicz MK and
Wittekind C: The TNM Classification of Malignant Tumours. 8th
edition. Union for International Cancer Control (UICC);
Wiley-Blackwell: 2017
|
|
20
|
Decaestecker C, Lopez XM, D'Haene N,
Roland I, Guendouz S, Duponchelle C, Berton A, Debeir O and Salmon
I: Requirements for the valid quantification of immunostains on
tissue microarray materials using image analysis. Proteomics.
9:4478–4494. 2009. View Article : Google Scholar : PubMed/NCBI
|
|
21
|
Rorive S, Lopez XM, Maris C, Trepant AL,
Sauvage S, Sadeghi N, Roland I, Decaestecker C and Salmon I: TIMP-4
and CD63: New prognostic biomarkers in human astrocytomas. Mod
Pathol. 23:1418–1428. 2010. View Article : Google Scholar : PubMed/NCBI
|
|
22
|
Talhouk A, McConechy MK, Leung S, Li-Chang
HH, Kwon JS, Melnyk N, Yang W, Senz J, Boyd N, Karnezis AN, et al:
A clinically applicable molecular-based classification for
endometrial cancers. Br J Cancer. 113:299–310. 2015. View Article : Google Scholar : PubMed/NCBI
|
|
23
|
Kurman RJ, Carcangiu ML, Herrington CS and
Young RH: WHO classification of tumors of female reproductive
organs. 4th edition. IARC; Lyon 6: 2014
|
|
24
|
Mota A, Triviño JC, Rojo-Sebastian A,
Martínez-Ramírez A, Chiva L, González-Martín A, Garcia JF,
Garcia-Sanz P and Moreno-Bueno G: Intra-tumor heterogeneity in TP53
null high grade serous ovarian carcinoma progression. BMC Cancer.
15:9402015. View Article : Google Scholar : PubMed/NCBI
|
|
25
|
Martens-Uzunova ES, Böttcher R, Croce CM,
Jenster G, Visakorpi T and Calin GA: Long noncoding RNA in
prostate, bladder, and kidney cancer. Eur Urol. 65:1140–1151. 2014.
View Article : Google Scholar : PubMed/NCBI
|
|
26
|
Xue M, Chen W and Li X: Urothelial cancer
associated 1: A long noncoding RNA with a crucial role in cancer. J
Cancer Res Clin Oncol. 142:1407–1419. 2016. View Article : Google Scholar : PubMed/NCBI
|
|
27
|
Guhley ML and Tang W: Laboratory assays
for Epstein-Barr virus-related disease. J Mol Diagn. 10:279–292.
2008. View Article : Google Scholar : PubMed/NCBI
|
|
28
|
Aine M, Eriksson P, Liedberg F, Höglund M
and Sjödahl G: On molecular classification of bladder cancer: Out
of one, many. Eur Urol. 68:921–923. 2015. View Article : Google Scholar : PubMed/NCBI
|
|
29
|
Kim PH, Cha EK, Sfakianos JP, Iyer G,
Zabor EC, Scott SN, Ostrovnaya I, Ramirez R, Sun A, Shah R, et al:
Genomic predictors of survival in patients with high-grade
urothelial carcinoma of the bladder. Eur Urol. 67:198–201. 2015.
View Article : Google Scholar : PubMed/NCBI
|
|
30
|
Kumar PP, Emechebe U, Smith R, Franklin S,
Moore B, Yandell M, Lessnick SL and Moon AM: Coordinated control of
senescence by lncRNA and a novel T-box3 co-repressor complex.
Elife. 3:2014. View Article : Google Scholar : PubMed/NCBI
|