Introduction
Boron is a naturally occurring element, representing
0.001% of the Earth's crust (1).
Borax, which is also known as sodium tetraborate decahydrate
(Na2B4O710H2O), is an
important boron compound (2). In
animals and humans, borax has been reported to be involved in
metabolic processes associated with hormones and minerals (3). It has also been demonstrated to
possess anti-inflammatory activity, indicating its therapeutic
potential (4,5). Boron supplementation in the diet
(borax, 100 mg/kg) has also been implicated to decrease lipid
peroxidation and enhance antioxidant defense (6). Previous studies have suggested that
the mechanism underlying the anti-inflammatory properties of borax
involved the suppression of interleukin (caspase-)-8, indicating
that borax is potentially applicable for a bactericidal agent
(7,8). However, numerous studies exploring the
mutagenic properties of borax reported that its genotoxicity was
nearly undetectable in bacteria and cultured mammalian cells
(9,10). Furthermore, previous studies
revealed that different concentrations of borax affected cell
survival and cell growth in addition to altering the properties of
a few chromosomes in humans, which were possibly caused by various
genetic defects resulting from abnormalities in human chromosome
(11,12). Additionally, borax has been widely
known to have detrimental effects on lymphocyte proliferation,
which is also highly vulnerable to induced sister chromatid
exchange in human chromosomes (13). Thus, certain cellular toxicities
indicated that those alterations were ascribed to genetic defects
caused by borax in humans (14).
Notably, it has been recently identified that borax treatment
enhanced the resistance of DNA to titanium dioxide-induced damage
(15). Taken together, numerous
studies have focused on the application of borax for tumor
prevention and demonstrated a strong inverse correlation between
borax and various types of cancer, including prostate cancer, lung
cancer, cervical cancer and hepatocellular carcinoma (HCC)
(6–15). Although increasing studies have
revealed various functions for borax, the underlying mechanisms of
those effects remain unidentified, in particular regarding its
genetic influences on various cells.
Our previous results indicated the effects of borax
on tumor cells (HepG2) in vitro (Wu et al unpublished
data). It was revealed that caspase--6 expression was increased
following 2-h borax treatment in HepG2 cells and cell proliferation
was inhibited following 24-h borax (4 mM) treatment. The numbers of
living HepG2 cells and the borax concentrations were inversely
correlated. Additionally, the 50% inhibitory concentration of borax
was estimated as 4 mM (16).
Although borax can be genotoxic at high doses, it is not highly
mutagenic and does not easily form DNA adducts (17). Accordingly, borax is considered to
induce oxidative stress through the depletion of glutathione and
protein-bound sulfhydryl groups, which results in enhanced
apoptosis and the production of reactive oxygen species (18,19).
In brief, borax is predominately non-genotoxic and epigenetic
mechanisms are likely to underlie the mechanism for its induction
of carcinogenesis, during which the expression of multiple
essential genes are altered (12).
Theoretically, exposure of HepG2 cells to borax for
either 2 or 24 h may induce alterations in the expression levels in
various critical genes, and these genes may therefore serve
essential roles in various signaling pathways. The present study
explored gene expression alterations directly caused by treatments
with doses of borax (4 mM) in HepG2 cells for either 2 or 24 h and
investigated the biological functions of those genes with
significantly altered expression levels. Analysis of gene
expression was performed through assessment of Affymetrix GeneChip
data, followed by gene ontology (GO) analysis and pathway
analysis.
Materials and methods
Cell culture
HepG2 cells were obtained from the China Center for
Type Culture Collection (Wuhan University, Wuhan, China) and seeded
in Dulbecco's modified Eagle's medium supplemented with 10% fetal
bovine serum (FBS; cat. no. 10099-141; Gibco; Thermo Fisher
Scientific, Inc., Waltham, MA, USA) 1 day prior to borax (4 mM;
Tianjin Bodi Chemical Co. Ltd., Tianjin, China) treatment in a
humidified 5% CO2 incubator at 37°C for either 2 or 24
h. Following 2- or 24-h treatment with 4 mM borax, the culture
medium was replenished with fresh media without borax.
RNA extraction and microarray
hybridization
Following borax treatment, total RNA was extracted
from HepG2 cells using TRIzol (cat. no. 3101-100; Invitrogen;
Thermo Fisher Scientific, Inc.), followed by its purification using
a miRNeasy Mini Kit (cat. no. 217004; Qiagen GmbH, Hilden,
Germany). RNA integrity was also examined using an Agilent
Bioanalyzer 2100 (grant no. G2938A; Agilent Technologies, Inc.,
Santa Clara, CA, USA). To obtain biotin-tagged cDNA, total RNA was
subsequently amplified, labeled and purified using a WT PLUS
Reagent kit (cat. no. 902280; Affymetrix; Thermo Fisher Scientific,
Inc.). Array hybridization was performed using an Affymetrix
GeneChip Human Gene 2.0 ST Array (Affymetrix; Thermo Fisher
Scientific, Inc.) and Hybridization Oven 645 (cat. no.
00-0331-220V; Affymetrix; Thermo Fisher Scientific, Inc.), the Gene
Chip was subsequently washed using a Hybridization, Wash and Stain
Kit (cat. no. 900720; Affymetrix; Thermo Fisher Scientific, Inc.)
in a Fluidics Station 450 (cat. no. 00-0079, Affymetrix; Thermo
Fisher Scientific, Inc.). A GeneChip Scanner 3000 (cat. no.
00-00213; Affymetrix; Thermo Fisher Scientific, Inc.) was used to
scan the results, which were controlled by Command Console Software
4.0 (Affymetrix; Thermo Fisher Scientific, Inc.) to summarize probe
cell intensity data, namely, the CEL files with default settings.
Following this, CEL files were normalized according to gene and
exon level using Expression Console Software 4.0 (Affymetrix;
Thermo Fisher Scientific, Inc.). All of the procedures, including
array hybridization and scanning, were independently performed
according to a standard protocol (20) for microarray experiments (n=3).
Validation of selected differentially
expressed genes using reverse transcription-quantitative polymerase
chain reaction (RT-qPCR)
Single-stranded cDNAs were converted from 2.0 µg of
total RNA extracted from cells using an RT kit (cat. no. M1701;
Promega Corporation, Madison, WI, USA) with a temperature protocol
of 72°C for 10 min. qPCR analysis was performed using 2.0 µg cDNA
from each sample, pair-specific primers (Table I; Shanghai GeneChem Co., Ltd.,
Shanghai, China) and a SYBR green PCR Master Mix kit (cat. no.
639676; Takara Bio, Inc., Otsu, Japan). The thermocycling
conditions used were as follows: 40 cycles at 95°C for 30 sec, 72°C
for 45 sec, and 1 cycle at 72°C for 10 min. Quantitative
measurement of the expression level of each gene was obtained by
independent experiments (n=3). Samples were normalized to the
expression level of GAPDH. Additionally, according to the
2−ΔΔCq method (21), all
of the results were detected as fold-change relative to the
corresponding mRNA expression level in control cells.
 | Table I.Sequences of primers employed for
reverse transcription-quantitative polymerase chain reaction and
their anticipated polymerase chain reaction product size. |
Table I.
Sequences of primers employed for
reverse transcription-quantitative polymerase chain reaction and
their anticipated polymerase chain reaction product size.
| Primer | Forward
(5′-3′) | Reverse
(5′-3′) | Length (bp) |
|---|
| AZI2 |
AACACTAAGGAATCGAAACTCG |
GAGCAAAATGGGAAGCAACAG | 186 |
| BPGM |
GCGTCTAAATGAGCGTCACTAT |
GGAGGCGGGGTTACATTGTAG | 120 |
| FAM102B |
TGCTGGTGAATCTGAATCTTTG |
CTGAGGTATTTCTCCTGTGGC | 236 |
| FBXO9 |
AGTGGATGTTTGAACTTGCTC |
GCCTGTTCTTGTTTTCCTTTG | 121 |
| HOXB5 |
GACCACGATCCACAAATCAAGC |
TGCCACTGCCATAATTTAGCAAC | 120 |
| KIAA0430 |
ACCCTCCACTTCGCCAATG |
CTTTGCGAGTCTAACAGTGCG | 96 |
| MBTPS1 |
TTTGACACTGGGCTGAGCGAGAA |
CGCCGATGCTGAGGTTTAACACG | 280 |
| MYO10 |
AGGAGGAAGTTCGGGAAGTGT |
CTTCTCCCCTGAGGAACATTG | 192 |
| NBPF1 |
GCCCTGATGTAGAAACTTC |
ATTCTTAGCAGTACGATTCG | 146 |
| PRUNE1 |
GCCTCAAGTACCCACCCTAAC |
AGAGGGCACTCATCCACCAAG | 278 |
| SETD5 |
TACCTGGTGTCCTTGTGGTCT |
CGCTTCTTGGGTTTGGTTCTT | 246 |
| SNX13 |
ATATCCTCTGCTTTGTGGGTG |
AGATTCATCATCGCTTAGTGT | 281 |
| TSR2 |
CCCTGTTCCTCTGTCTGGCTCC |
CTTCCTCACAATGACCGCACC | 169 |
| TTLL4 |
TCTTTCTGCTTGCGTTCGAG |
AGAGGTATGGTTCTGTGGATGAG | 154 |
| UPF2 |
GGAGGTATCAAGTCCCGATGA |
GTTGGGTAACTGCTGTAGGAAAG | 202 |
| RCN2 |
TTCAGGTCCCGGTTTGAGTCT |
TCAAGCCTGCCATCGTTATCT | 252 |
| USP16 |
ATGAGGTCCAGTATTGTAGTTC |
ACTGAGTCCTTTCACGGTTAT | 236 |
| RASL11A |
TATTCACGGCTGGTCTATGTCG |
CACGCATTTGGACAGGGAATC | 120 |
| PPIL1 |
TGGGAATCATTGTGCTGGAG |
CGAGGGTCACAAAGAACTGG | 291 |
| MTIF2 |
TGGTTGCTGGAAAATGTTGGG |
CACGGGCTTTCTGATGTGCTT | 276 |
| MAPK4 |
CGGTGTCAATGGTTTGGTGC |
GACGATGTTGTCGTGGTCCA | 151 |
| LMAN2L |
ACTCGCTGTCGAAGCCCTA |
CTGGGGTAAGGCGGATATACT | 105 |
| CENPN |
TGAACTGACAACAATCCTGAAG |
CTTGCACGCTTTTCCTCACAC | 129 |
| CDCA8 |
GCAGGAGAGCGGATTTACAAC |
CTGGGCAATACTGTGCCTCTG | 141 |
| EFR3A |
GCTGTTCCGCTTTGCGTCCTC |
AGAAGTTGGTCCAGTGCCTCC | 232 |
| PPIP5K2 |
ACTGGACAAAGCGGTTGCCTAT |
TGGGATTATTTGGGTCACGGT | 167 |
Construction of adenoviral
vectors
PCR was performed to amplify the encoding sequences
of abundantly expressed genes. Gene interference RNA fragments (100
µmol; three codon sites; Table II)
of those amplified sequences were subcloned into a plasmid (300
ng/µl; Shanghai GeneChem Co., Ltd., Shanghai, China) backbone using
the T4DNA ligase (cat. no. 170702; Takara Bio, Inc.) following the
digestion of the restriction enzyme. The pGCScaspase--004-iRNA and
the GV115-NC were co-transformed into Escherichia coli
GRM602 with backbone vector GV115-NC for homologous recombination.
The recombinant plasmid pAd-iRNA digested with PacI
(Fermentas; Thermo Fisher Scientific, Inc.) was used to transfect
293T cells (Thermo Fisher Scientific, Inc.) using Lipofectamine
2000 (cat. no. 11668-027; Invitrogen; Thermo Fisher Scientific,
Inc.) for further packaging and amplification of the viruses and
used in all groups (including any controls). The time interval was
72 h between transfection and subsequent experimentation. A control
group (non-targeting shRNA) and positive control
(specific-targeting shRNA) were used.
| Table II.Sequences of RNAis (three codon sites
for each gene) employed to plasmid backbone. |
Table II.
Sequences of RNAis (three codon sites
for each gene) employed to plasmid backbone.
| Genes | Codon sites | Target
sequence |
|---|
| PRUNE1 | PSC56272 |
TCGAGAAGTGCAGTCAGAT |
|
| PSC56273 |
ATGTAAGTTGCCAACAGTT |
|
| PSC56274 |
GCATGGATCTTGAACAGAA |
| NBPF1 | PSC29636 |
GCGAGAAGGCAGAGACGAA |
|
| PSC29637 |
TGACAATGATCACGATGAA |
|
| PSC29638 |
AGTCATATTCCCACAGTAA |
| PPIL1 | PSC40511 |
ACAGAATTATCAAAGACTT |
|
| PSC40512 |
AGGTTACTACAATGGCACA |
|
| PSC40513 |
CTCCAAAGACCTGTAAGAA |
| UPF2 | PSC56248 |
GCCTAGATTCGAGCTTAAA |
|
| PSC56249 |
CACCTAATGCAGATCTAAT |
|
| PSC56250 |
CTTGTACCAAGGAAAGTAA |
| MBTPS1 | PSC56266 |
GTCGTGATAACACAGACTT |
|
| PSC56267 |
TAACAATGTAATCATGGTT |
|
| PSC56268 |
TGACTTTGAAGGTGGAATT |
| SETD5 | PSC56263 |
ACTTTGTAAGTCAGATGAT |
|
| PSC56264 |
GCATTTAGATCATCACAAA |
|
| PSC56265 |
ATCAGGAACACTGACCATT |
| RCN2 | PSC42354 |
GCTTCATCTAATTGATGAA |
|
| PSC42355 |
GGTTTGAGTCTTGAAGAAT |
|
| PSC42356 |
GATGTATGATCGTGTGATT |
| TSR2 | PSC48385 |
CCAGTTTGTTAAACTCCTT |
|
| PSC48386 |
CTTTACTCAGGATTTACTA |
|
| PSC48387 |
AAAGAATGTGCGGTCTTTA |
| SNX13 | PSC56275 |
CAATTCAATGAGGAATGTT |
|
| PSC56276 |
CTGAAATCTTTGATGACAT |
|
| PSC56277 |
TGATTCTAACTGCAACTAT |
| CENPN | PSC32095 |
AACTGACAACAATCCTGAA |
|
| PSC32096 |
AATGCAGTCTGGATTCGAA |
|
| PSC32097 |
TAGTTCAGCACTTGATCCA |
| PPIP5K2 | PSC36126 |
CTGTGATGTGTTTCAGCAT |
|
| PSC36127 |
TGAAATTTCCACTAGCGAA |
|
| PSC36128 |
AGAGATTCATTGGAGACTA |
| USP16 | PSC56254 |
GTGATATTCCACAAGATTT |
|
| PSC56255 |
GAATAAACTGCTTTGTGAA |
|
| PSC56256 |
CAGAAGAAATCATGTTTAT |
| TTLL4 | PSC42339 |
TGGTCAGTTTGAACGAATT |
|
| PSC42340 |
ACATGAAGTCTCCTAGTTT |
|
| PSC42341 |
CCTCATCTACAGTCTCTTT |
| AZI2 | PSC56260 |
ATATCGAGAGGTTTGCATT |
|
| PSC56261 |
GAGGACAGAGGTGGAAACTCA |
|
| PSC56262 |
CAGCTACAATCTAAAGAAGTA |
| LMAN2L | PSC41153 |
CATAGTCATTGGTATCATA |
|
| PSC41154 |
GGCATTTGACGATAATGAT |
|
| PSC41155 |
AACGTTCGAGTACTTGAAA |
| CDCA8 | PSC24168 |
TTGACTCAAGGGTCTTCAA |
|
| PSC24169 |
TGGATATCACCGAAATAAA |
|
| PSC24170 |
CCTCCTTTCTGAAAGACTT |
| BPGM | PSC39388 |
AGCCATTAAGAAAGTAGAA |
|
| PSC39389 |
CATTCTTCTGGAATTGGAT |
|
| PSC39390 |
CGAAGTATTACGTGGCAAA |
| MTIF2 | PSC56269 |
AGACTCACATTTAGATGAA |
|
| PSC56270 |
CGTAATGGACATGTAATTT |
|
| PSC56271 |
AGGAGAAGAAATTCTTGAA |
| MAPK4 | PSC56251 |
AAGGATCGTGGATCAACAT |
|
| PSC56252 |
GACCTCAATGGTGCGTGCA |
|
| PSC56253 |
TCGCGCAGTGGGTCAAGAG |
| FBXO9 | PSC56257 |
AGAGGTTCAACAAACTCAT |
|
| PSC56258 |
TCAGATCATTGGAGCAGTT |
|
| PSC56259 |
TGATATAGAGTTCAAGATT |
Cell culture and transfection
HepG2 cells were seeded in a 96-well black-bottom
plate (1,500-2,500 cells/well; Corning Inc., Corning, NY, USA)
filled with DMEM supplemented with FBS in a humidified incubator
containing 5% CO2 at 37°C. The viral particles were
added to serum-free medium when confluency reached 20–40 %. The
media was replaced with fresh medium supplemented with FBS
following 12 h of incubation. Cells were subsequently incubated for
a further 72 h until the transfection rate reached 70–90 %. GFP
expression was analyzed in HepG2 cells 48 and 72 h post-infection
with AdGFP using fluorescence and light microscopy to determine the
optimal transfection rate for subsequent experiments. Cells were
subsequently collected for further use. Decreased expression of
genes following treatment with shRNA was validated with
RT-qPCR.
Cell proliferation assay
To identify the specific effects of those abundantly
expressed genes on the proliferation of HepG2 cells, these cells
were infected with adenovirus, seeded in a 96-well plate
(2×10³/well) and cultured in a humidified incubator
containing 5% CO2 at 37°C for 24 h. The plates were
scanned using Celigo Image Cytometer Instrumentation (Nexcelom
Bioscience Instruments (Shanghai) Co., Ltd.m Shanghai, China)
(22,23) to acquire images every 24 h,
measuring the number of viable cells with 5-day sequential
monitoring. Gross quantitative analyses were independently
performed (n≥3), including the total number count, cell growth
[shControl/experimental (transfected with RNAiMax) group,
>1.5-fold change], position information and average integrated
intensity of certain gated events for each fluorescence channel in
individual wells.
Statistical analysis
A computational analysis of microarray data was
performed using GeneSpring v12.0 (Agilent Technologies, Inc., Santa
Clara, CA, USA). Based on a Student's t-test analysis,
differentially expressed genes were filtered through statistical
estimation of fold-changes from replicated samples (fold change
≥2.0) using a P-value threshold (P<0.05). Distinguishable gene
expression of those samples was demonstrated via hierarchical
clustering, followed by heatmap generation. Additionally, GO and
pathway analyses of differentially expressed genes were performed
to determine the potential signaling pathways underlying their
biological functions. Public data from bioinformatics resources
(http://www.geneontology.org/) were
utilized for GO enrichment analysis. Ingenuity Pathway Analysis was
utilized to identify genes whose expression was changed by at least
2-fold.
Results
Gene expression changes
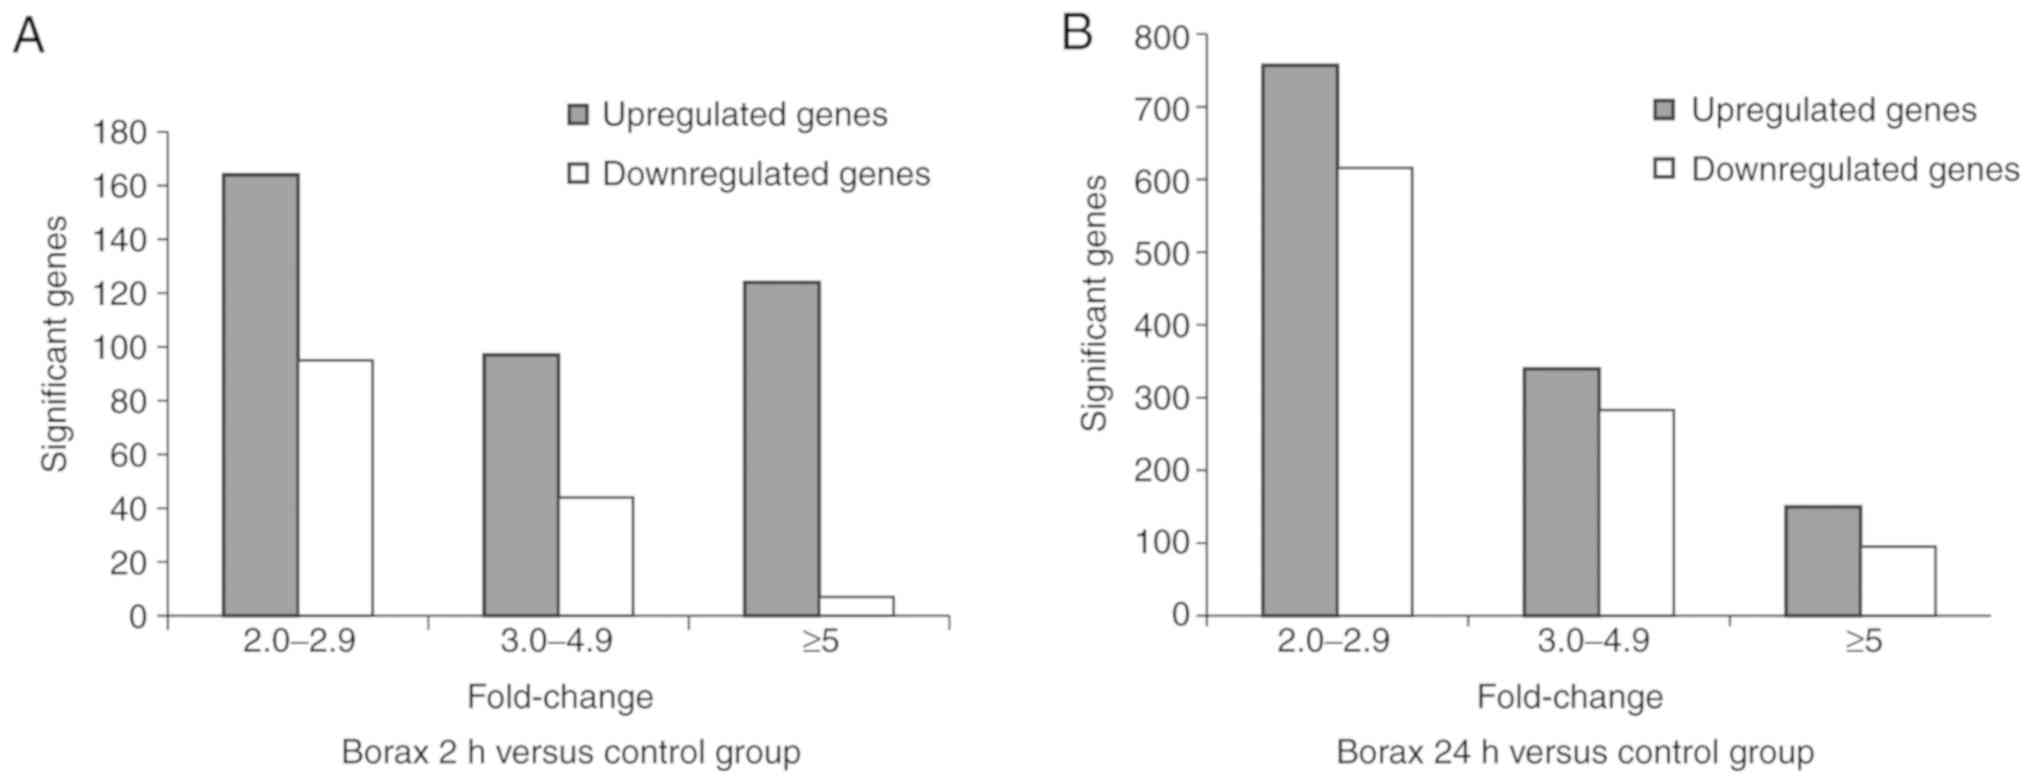
Gene microarray analysis revealed that there were
significant expressional alterations of 530 genes in HepG2 cells in
the 2-h borax treatment group compared with the control group (fold
change ≥2.0; P<0.05). Among them, 146 genes were downregulated
and 384 genes were upregulated (P<0.05; Fig. 1A). Furthermore, the expression
levels of 1,763 genes were changed in HepG2 cells when the 24-h
borax treatment group was compared with the control group (fold
change ≥2.0; P<0.05). Among these genes, 719 were downregulated
and 1,044 were upregulated (P<0.05; Fig. 1B).
Gene expression and GO analysis
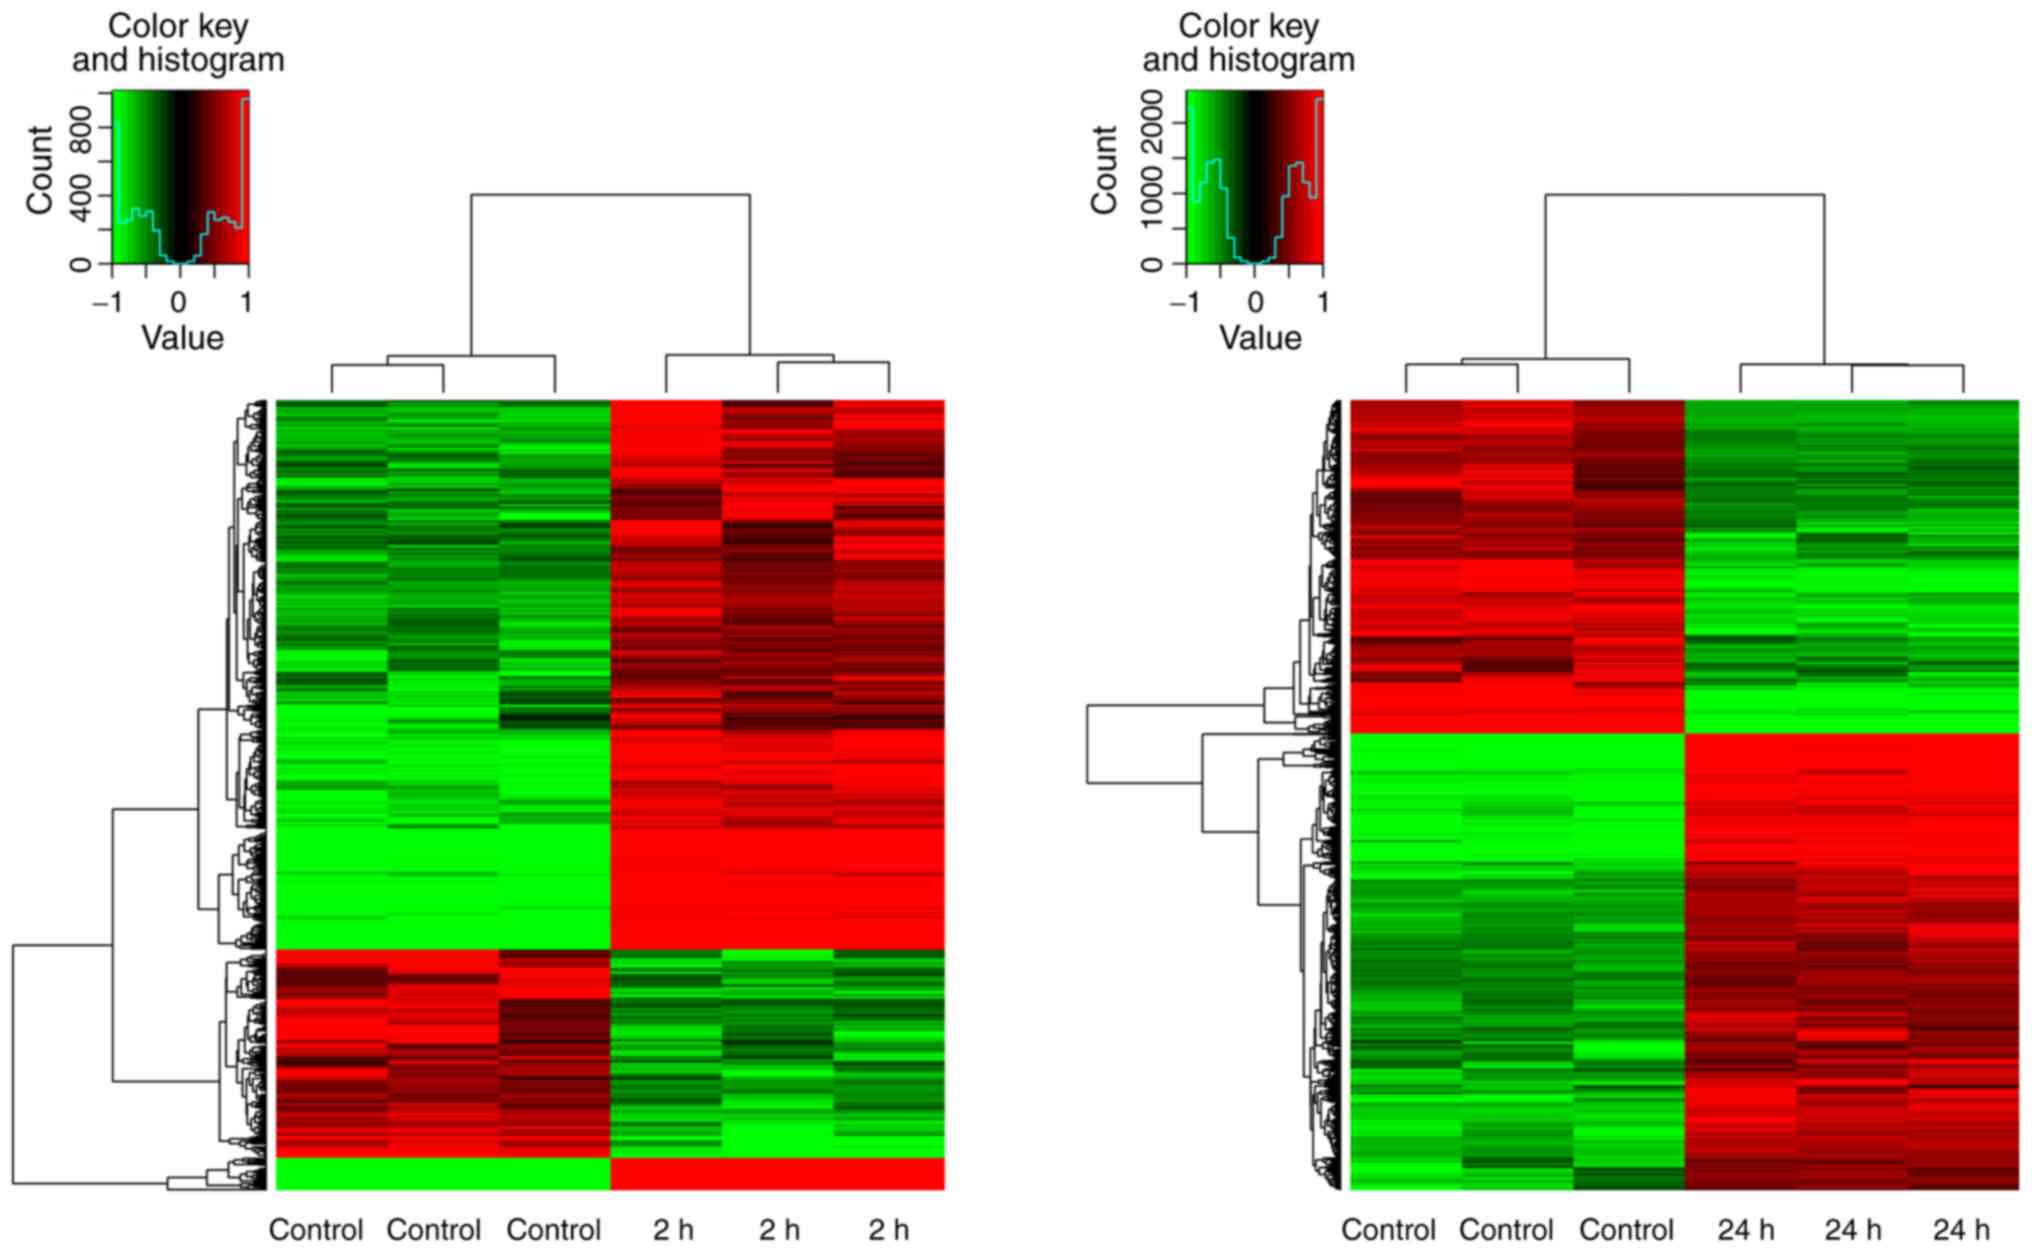
Differentially expressed genes were stratified by
treatment duration and presented as heatmaps either in red
(upregulation) or green (downregulation), revealing an overall
global change in expression for all genes (P<0.05; Fig. 2). Furthermore, detectable
differences in gene expression patterns among those groups were
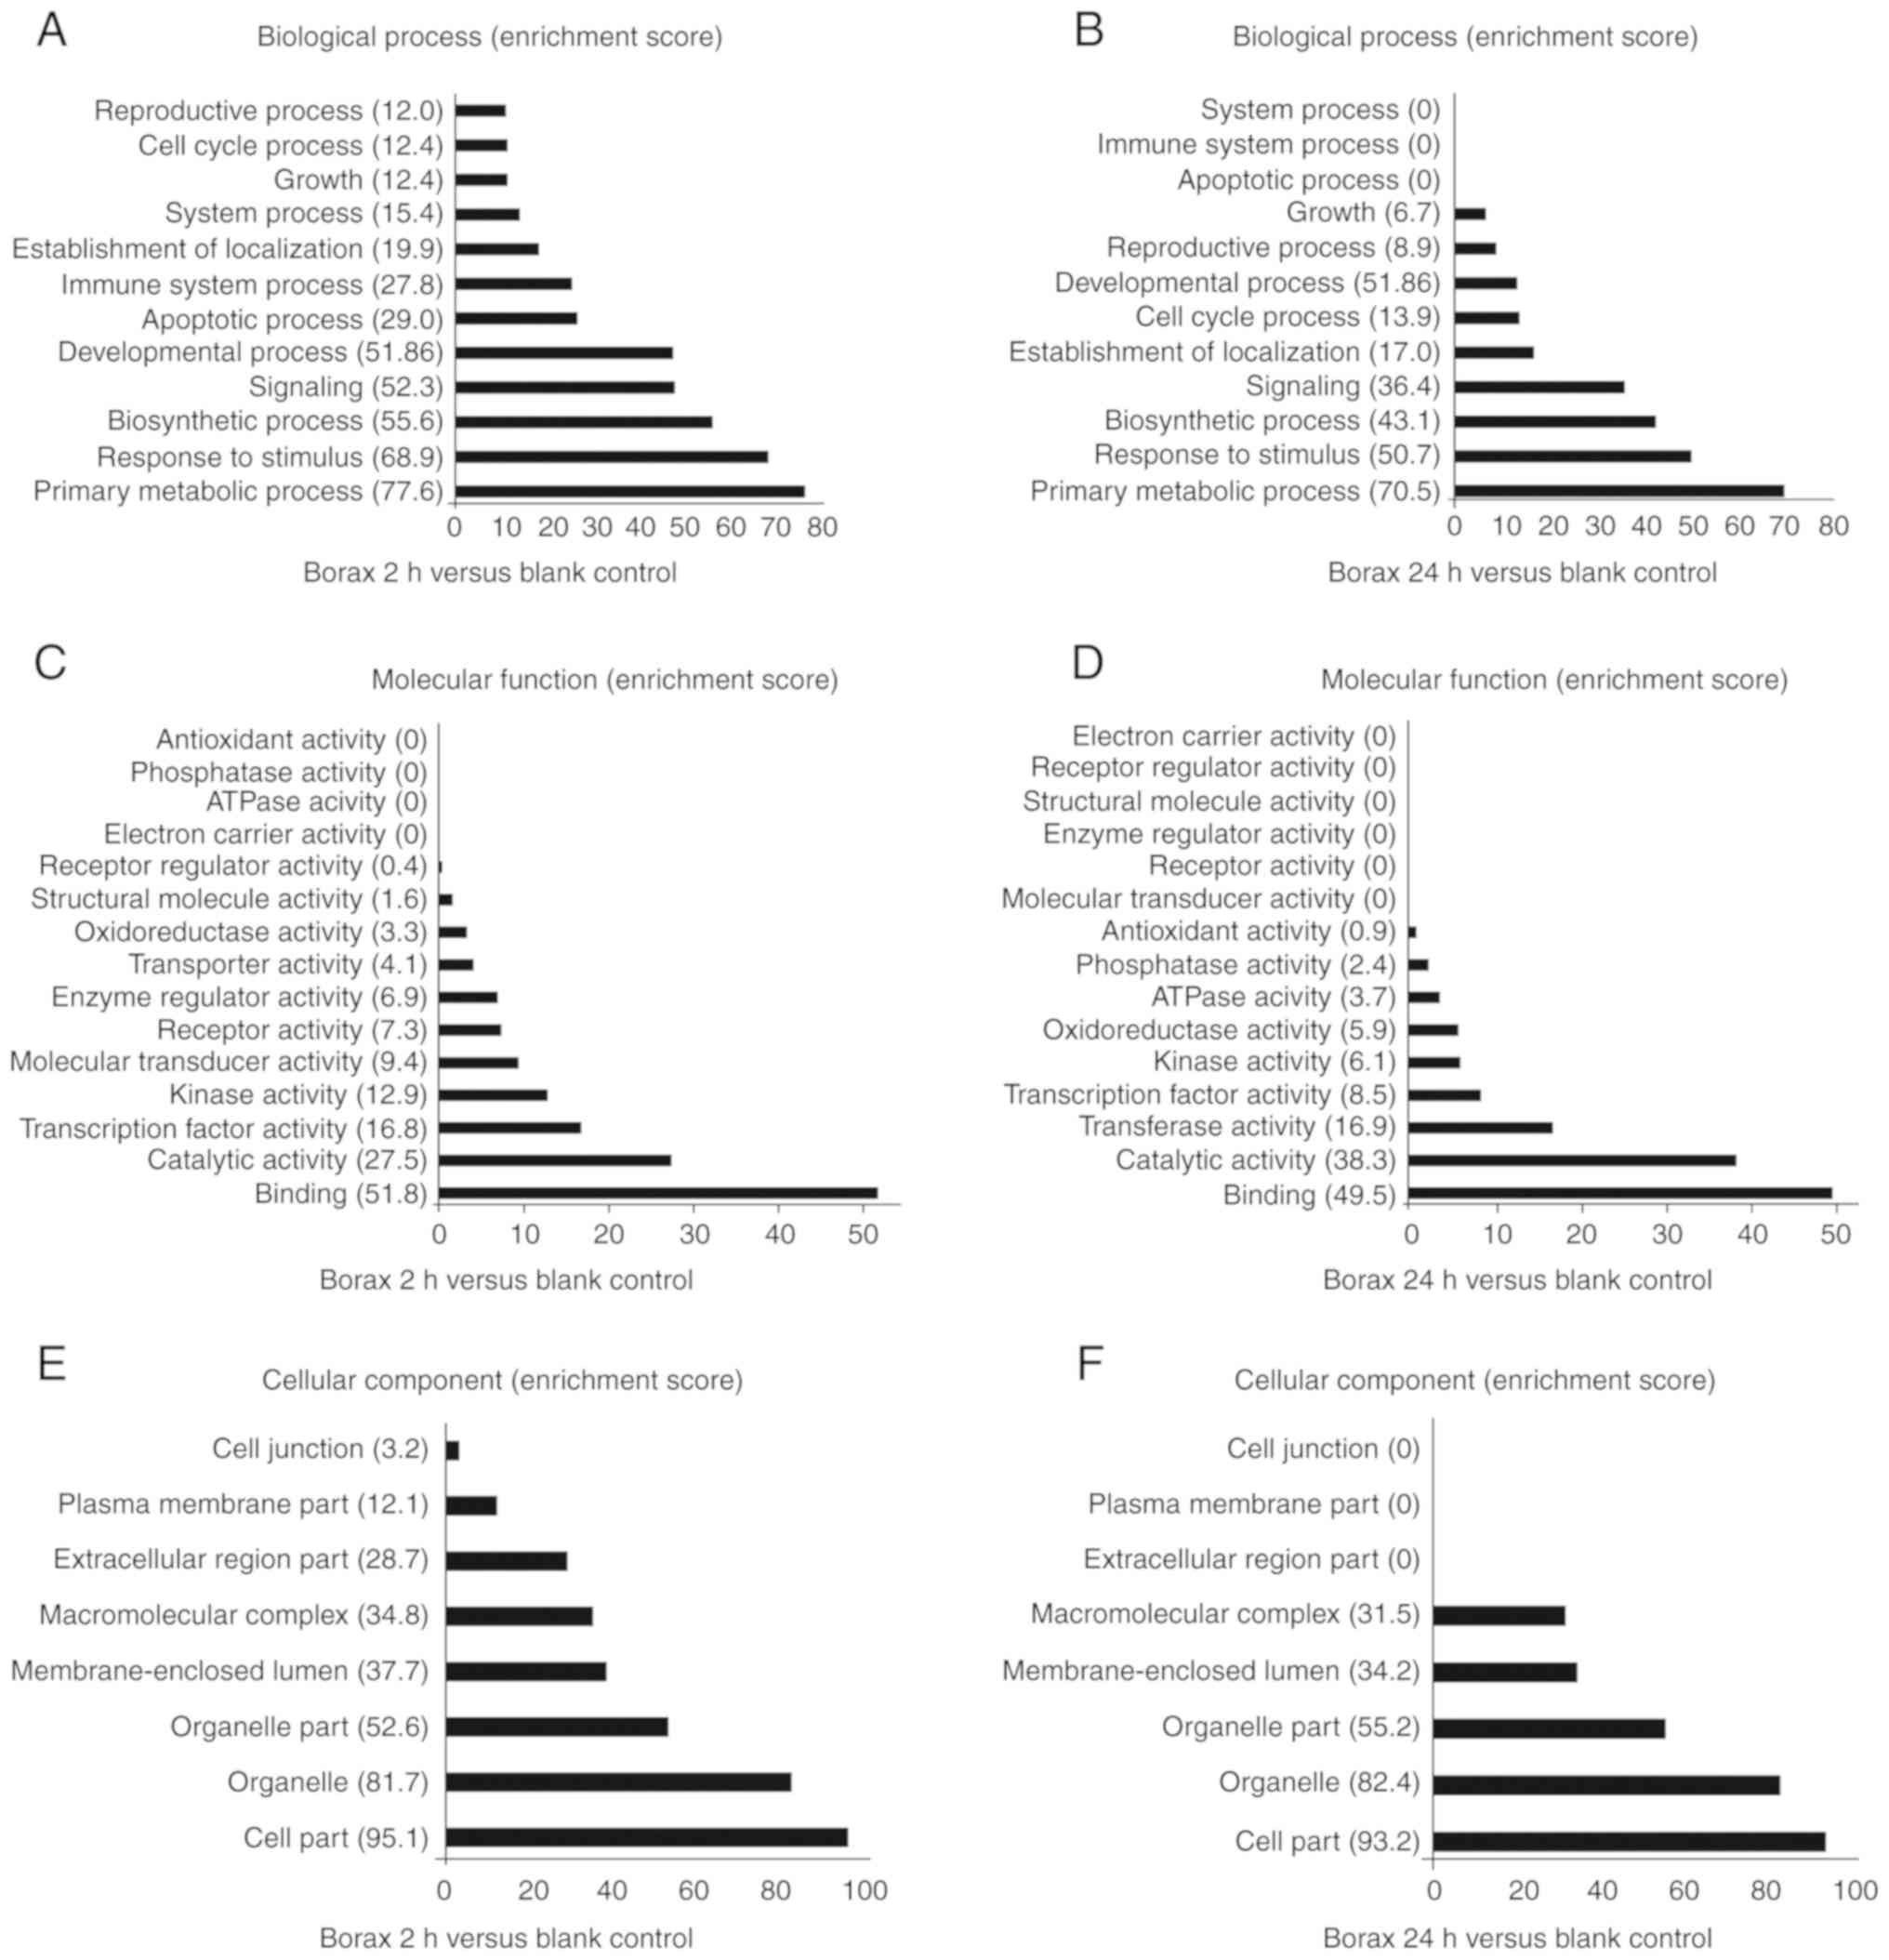
also revealed by hierarchical clustering analyses. To determine the
biological dysfunctionality associated with the altered gene
expression induced by borax treatment, public data from
bioinformatics resources (http://www.geneontology.org/) were utilized for GO
enrichment analysis. Based on the cellular components, biological
processes and molecular functions of each gene, significantly
enriched GO terms were also arranged correspondingly (Fig. 3).
Pathway analysis
To determine which pathways were involved, Ingenuity
Pathway Analysis was utilized to identify genes whose expression
was changed by at least 2-fold. Furthermore, analyses of functional
pathways indicated that the genes with expression levels that were
significantly altered in cells from the 2-h treatment group
compared with those in the control group were involved in seven
KEGG pathways (P<0.01; Table
III). Furthermore, significantly altered genes in cells from
the 24-h treatment group compared with those in the control group
were primarily associated with five KEGG pathways (P<0.01;
Table IV).
| Table III.Differentially expressed genes
involved in signal transduction (2 h vs. Control group). |
Table III.
Differentially expressed genes
involved in signal transduction (2 h vs. Control group).
| Pathway/genebank
ID | Probe_Set_ID | Gene symbol | Description of
expression product | Fold change | P-values | Regulation after
borax treeatment |
|---|
| hsa04010:MAPK
signaling pathway |
|
| NM_001202233 |
TC12000414.hg.1 | NR4A1 | Nuclear receptor
subfamily 4, group A, member 1 | 21.7 | 0.000881 | Up |
| NM_005252 |
TC11001948.hg.1 | FOS | FBJ murine
osteosarcoma viral oncogene homolog | 11.3 | 0.000164 | Up |
| NM_001199741 |
TC01000745.hg.1 | GADD45A | Growth arrest and
DNA-damage-inducible, alpha | 10.7 | 0.000054 | Up |
| NM_004419 |
TC10000801.hg.1 | DUSP5 | Dual specificity
phosphatase 5 | 10.6 | 0.000096 | Up |
| NM_000575 |
TC02002218.hg.1 | IL1A | Interleukin-1,
alpha | 8.3 | 0.005040 | Up |
| NM_001394 |
TC08001099.hg.1 | DUSP4 | Dual specificity
phosphatase 4 | 5.6 | 0.002509 | Up |
| NM_005354 |
TC19001285.hg.1 | JUND | Jun D
proto-oncogene | 3.4 | 0.001100 | Up |
| NM_015675 |
TC19000055.hg.1 | GADD45B | Growth arrest and
DNA-damage-inducible, beta | 3.3 | 0.000382 | Up |
| NM_001195053 |
TC12001625.hg.1 | DDIT3 |
DNA-damage-inducible transcript 3 | 2.3 | 0.005761 | Up |
| NM_030640 |
TC12001255.hg.1 | DUSP16 | Dual specificity
phosphatase 16 | 2.3 | 0.000079 | Up |
| NM_000576 |
TC02002219.hg.1 | IL1B | Interleukin-1,
beta | 2.1 | 0.016505 | Up |
| NM_004651 |
TC05001184.hg.1 | MYO10 | Myosin 10 | −7.17 | 0.001269 | Down |
| NM_005345 |
TC06000384.hg.1 | HSPA1A | Heat shock 70 kDa
protein 1A | −4.2 | 0.011012 | Down |
| NM_005346 |
TC06000385.hg.1 | HSPA1B | Heat shock 70 kDa
protein 1B | −4.3 | 0.010610 | Down |
| NM_002228 |
TC01001927.hg.1 | JUN | Jun
proto-oncogene | −2.1 | 0.000287 | Down |
|
| hsa04064:NF-kappa B
signaling pathway |
|
| NM_000963 |
TC01003638.hg.1 | PTGS2 |
Prostaglandin-endoperoxide synthase 2
(prostaglandin G/H synthase and cyclooxygenase) | 75.7 | 0.000000 | Up |
| NM_006290 |
TC06001027.hg.1 | TNFAIP3 | Tumor necrosis
factor, alpha-induced protein 3 | 68.3 | 0.000000 | Up |
| NM_020529 |
TC14001036.hg.1 | NFKBIA | Nuclear factor of
kappa light polypeptide gene enhancer in B-cells inhibitor,
alpha | 9.2 | 0.000014 | Up |
| NM_001165 |
TC11000956.hg.1 | BIRC3 | Baculoviral IAP
repeat containing 3 | 3.7 | 0.000004 | Up |
| NM_002089 |
TC04001286.hg.1 | CXCL2 | Chemokine (C-X-C
motif) ligand 2 | 4.0 | 0.010873 | Up |
| NM_015675 |
TC19000055.hg.1 | GADD45B | Growth arrest and
DNA-damage-inducible, beta | 3.3 | 0.000382 | Up |
| NM_000576 |
TC02002219.hg.1 | IL1B | Interleukin-1,
beta | 2.1 | 0.016505 | Up |
|
| hsa04621:NOD-like
receptor signaling pathway |
|
| NM_006290 |
TC06001027.hg.1 | TNFAIP3 | Tumor necrosis
factor, alpha-induced protein 3 | 68.3 | 0.000000 | Up |
| NM_020529 |
TC14001036.hg.1 | NFKBIA | Nuclear factor of
kappa light polypeptide gene enhancer in B-cells inhibitor,
alpha | 9.2 | 0.000014 | Up |
| NM_002089 |
TC04001286.hg.1 | CXCL2 | Chemokine (C-X-C
motif) ligand 2 | 4.0 | 0.010873 | Up |
| NM_001165 |
TC11000956.hg.1 | BIRC3 | Baculoviral IAP
repeat containing 3 | 3.7 | 0.000004 | Up |
| NM_000576 |
TC02002219.hg.1 | IL1B | Interleukin-1,
beta | 2.1 | 0.016505 | Up |
| NM_000600 |
TC05002383.hg.1 | IL6 | Interleukin-6 | 2.4 | 0.007231 | Up |
| NM_100616406 |
TC17000132.hg.1 | MIR4521 | MicroRNA 4521 | −6.61 | 0.000125 | Down |
|
| hsa04115:p53
signaling pathway |
|
| NM_001199741 |
TC01000745.hg.1 | GADD45A | Growth arrest and
DNA-damage-inducible, alpha | 10.7 | 0.000054 | Up |
| NM_003246 |
TC15000270.hg.1 | THBS1 | Thrombospondin
1 | 6.5 | 0.002300 | Up |
| NM_000602 |
TC07000643.hg.1 | SERPINE1 | Serpin peptidase
inhibitor, clade E (nexin, plasminogen activator inhibitor type 1),
member 1 | 4.7 | 0.010348 | Up |
| NM_021127 |
TC18000213.hg.1 | PMAIP1 |
Phorbol-12-myristate-13-acetate-induced
protein 1 | 4.7 | 0.000034 | Up |
| NM_015675 |
TC19000055.hg.1 | GADD45B | Growth arrest and
DNA-damage-inducible, beta | 3.3 | 0.000382 | Up |
|
| hsa04141:Protein
processing in endoplasmic reticulum |
|
| NM_014330 |
TC19000711.hg.1 | PPP1R15A | Protein phosphatase
1, regulatory subunit 15A | 4.4 | 0.006746 | Up |
| NM_018566 |
TC01003773.hg.1 | YOD1 | YOD1 OTU
deubiquinating enzyme 1 homolog | 3.7 | 0.000181 | Up |
| NM_001433 |
TC17001796.hg.1 | ERN1 | Endoplasmic
reticulum to nucleus signaling 1 | 2.6 | 0.000008 | Up |
| NM_001195053 |
TC12001625.hg.1 | DDIT3 |
DNA-damage-inducible transcript 3 | 2.3 | 0.005761 | Up |
| NM_005346 |
TC06000385.hg.1 | HSPA1B | Heat shock 70 kDa
protein 1B | −4.3 | 0.010610 | Down |
| NM_005345 |
TC06000384.hg.1 | HSPA1A | Heat shock 70 kDa
protein 1A | −4.2 | 0.011012 | Down |
| NM_003791 |
TC16001307.hg.1 | MBTPS1 | Membrane-bound
transcription factor peptidase, site 1 | −3.2 | 0.000643 | Down |
| NM_001172415 |
TC09001009.hg.1 | BAG1 | BCL2-associated
athanogene | −2.1 | 0.000440 | Down |
|
| hsa04668:TNF
signaling pathway |
|
| NM_000963 |
TC01003638.hg.1 | PTGS2 |
Prostaglandin-endoperoxide synthase 2
(prostaglandin G/H synthase and cyclooxygenase) | 75.7 | 0.000000 | Up |
| NM_006290 |
TC06001027.hg.1 | TNFAIP3 | Tumor necrosis
factor, alpha-induced protein 3 | 68.3 | 0.000000 | Up |
| NM_001168319 |
TC06000087.hg.1 | EDN1 | Endothelin 1 | 13.1 | 0.000004 | Up |
| NM_005252 |
TC11001948.hg.1 | FOS | FBJ murine
osteosarcoma viral oncogene homolog | 11.3 | 0.000164 | Up |
| NM_020529 |
TC14001036.hg.1 | NFKBIA | Nuclear factor of
kappa light polypeptide gene enhancer in B-cells inhibitor,
alpha | 9.2 | 0.000014 | Up |
| NM_002089 |
TC04001286.hg.1 | CXCL2 | Chemokine (C-X-C
motif) ligand 2 | 4.0 | 0.010873 | Up |
| NM_001165 |
TC11000956.hg.1 | BIRC3 | Baculoviral IAP
repeat containing 3 | 3.7 | 0.000004 | Up |
| NM_001130046 |
TC02001364.hg.1 | CCL20 | Chemokine (C-C
motif) ligand 20 | 3.0 | 0.002008 | Up |
| NM_000600 |
TC05002383.hg.1 | IL6 | Interleukin-6 | 2.4 | 0.007231 | Up |
| NM_000576 |
TC02002219.hg.1 | IL1B | Interleukin-1,
beta | 2.1 | 0.016505 | Up |
| NM_003955 |
TC17001917.hg.1 | SOCS3 | Suppressor of
cytokine signaling 3 | 2.1 | 0.003726 | Up |
| NM_002228 |
TC01001927.hg.1 | JUN | Jun
proto-oncogene | −2.1 | 0.000287 | Down |
|
| hsa04620:Toll-like
receptor signaling pathway |
|
| NM_005252 |
TC11001948.hg.1 | FOS | FBJ murine
osteosarcoma viral oncogene homolog | 11.3 | 0.000164 | Up |
| NM_020529 |
TC14001036.hg.1 | NFKBIA | Nuclear factor of
kappa light polypeptide gene enhancer in B-cells inhibitor,
alpha | 9.2 | 0.000014 | Up |
| NM_000600 |
TC05002383.hg.1 | IL6 | Interleukin-6 | 2.4 | 0.007231 | Up |
| NM_000576 |
TC02002219.hg.1 | IL1B | Interleukin-1, beta
(IL1B) | 2.1 | 0.016505 | Up |
| NM_002228 |
TC01001927.hg.1 | JUN | Jun
proto-oncogene | −2.1 | 0.000287 | Down |
| Table IV.Differentially expressed genes
involved in signal transduction (24 h vs. control group). |
Table IV.
Differentially expressed genes
involved in signal transduction (24 h vs. control group).
| Pathway/Genebank
ID | Probe_Set_ID | Gene symbol | Description of
expression product | Fold change | P-values | Regulation after
borax treeatment |
|---|
| hsa04110:Cell
cycle |
|
| NM_002392 |
TC12000606.hg.1 | MDM2 | Mdm2, p53 E3
ubiquitin protein ligase homolog | 13.8 | 0.00010 | Up |
| NM_001199741 |
TC01000745.hg.1 | GADD45A | Growth arrest and
DNA-damage-inducible, alpha | 7.9 | 0.00006 | Up |
| NM_000389 |
TC06000532.hg.1 | CDKN1A | Cyclin-dependent
kinase inhibitor 1A (p21, Cip1) | 4.4 | 0.00015 | Up |
| NM_001259 |
TC07001603.hg.1 | CDK6 | Cyclin-dependent
kinase 6 | 4.3 | 0.00013 | Up |
| NM_001079846 |
TC16000823.hg.1 | CREBBP | CREB binding
protein (CREBBP) | 3.0 | 0.00007 | Up |
| NM_001799 |
TC05000301.hg.1 | CDK7 | Cyclin-dependent
kinase 7 | 2.8 | 0.00039 | Up |
| NM_007637 |
TC10001228.hg.1 | ZNF84 | Zinc finger protein
84 | 2.42 | 0.00063 | Up |
| NM_001789 |
TC03001374.hg.1 | CDC25A | Cell division cycle
25 homolog A | 2.4 | 0.00041 | Up |
| NM_002553 |
TC07001724.hg.1 | ORC5 | Origin recognition
complex, subunit 5 | 2.3 | 0.00012 | Up |
| BC012827 |
TC01000545.hg.1 | CDC20 | Cell division cycle
20 homolog | 2.2 | 0.00364 | Up |
| NM126792 |
TC05001184.hg.1 | B3GALT6 | Beta
1,3-galactosyltransferase polypeptide 6 | −18.97 | 0.00000 | Down |
| NM009917 |
TC06001313.hg.1 | FAM20B | Family with
sequence similarity 20, member B | −5.13 | 0.00002 | Down |
| NM_001262 |
TC01000619.hg.1 | CDKN2C | Cyclin-dependent
kinase inhibitor 2C (p18, inhibits CDK4) | −4.8 | 0.00364 | Down |
| NM_003318 |
TC06000761.hg.1 | TTK | TTK protein
kinase | −3.7 | 0.00008 | Down |
| NM_001237 |
TC04001516.hg.1 | CCNA2 | Cyclin A2
(CCNA2) | −3.5 | 0.00007 | Down |
| NM_004701 |
TC15000449.hg.1 | CCNB2 | Cyclin B2
(CCNB2) | −2.7 | 0.00011 | Down |
| NM_005611 |
TC16000448.hg.1 | RBL2 | Retinoblastoma-like
2 (p130) | −2.6 | 0.00001 | Down |
| NM_001178138 |
TC03001849.hg.1 | TFDP2 | Transcription
factor Dp-2 (E2F dimerization partner 2) | −2.5 | 0.00001 | Down |
| NM_001786 |
TC02001182.hg.1 | CDK1 | Cyclin-dependent
kinase 1 | −2.5 | 0.00163 | Down |
| NM_002388 |
TC06001799.hg.1 | MCM3 | Minichromosome
maintenance complex component 3 | −2.5 | 0.00000 | Down |
| NM_057749 |
TC08001438.hg.1 | CCNE2 | Cyclin E2
(CCNE2) | −2.4 | 0.00622 | Down |
| NM_001042749 |
TC0X000606.hg.1 | STAG2 | Stromal antigen 2
(STAG2 | −2.2 | 0.00017 | Down |
| NM_005915 |
TC02002376.hg.1 | MCM6 | Minichromosome
maintenance complex component 6 | −2.1 | 0.00019 | Down |
| NM_001136197 |
TC19000070.hg.1 | FZR1 | Fizzy/cell division
cycle 20 related 1 | −2.1 | 0.00348 | Down |
| NM_022809 |
TC05001829.hg.1 | CDC25C | Cell division cycle
25 homolog C | −2.1 | 0.00092 | Down |
|
| hsa04115:p53
signaling pathway |
|
| NM_002392 |
TC12000606.hg.1 | MDM2 | Mdm2, p53 E3
ubiquitin protein ligase homolog | 13.8 | 0.00010 | Up |
| NM_008870 |
TC13000386.hg.1 | IER3 | Immediate early
response 3 | 8.47 | 0.00200 | Up |
| NM_001199741 |
TC01000745.hg.1 | GADD45A | Growth arrest and
DNA-damage-inducible, alpha | 7.9 | 0.00006 | Up |
| NM_021127 |
TC18000213.hg.1 | PMAIP1 |
Phorbol-12-myristate-13-acetate-induced
protein 1 | 6.1 | 0.00001 | Up |
| NM_000389 |
TC06000532.hg.1 | CDKN1A | Cyclin-dependent
kinase inhibitor 1A | 4.4 | 0.00015 | Up |
| NM_001259 |
TC07001603.hg.1 | CDK6 | Cyclin-dependent
kinase 6 | 4.3 | 0.00013 | Up |
| NM_001172477 |
TC08001496.hg.1 | RRM2B | Ribonucleotide
reductase M2 B | 3.7 | 0.00015 | Up |
| NM_001199933 |
TC06001997.hg.1 | SESN1 | Sestrin 1 | 3.6 | 0.00004 | Up |
| NM_000602 |
TC07000643.hg.1 | SERPINE1 | serpin peptidase
inhibitor, clade E (nexin, plasminogen activator inhibitor type 1),
member 1 | 2.2 | 0.00406 | Up |
| NM_004324 |
TC19000716.hg.1 | BAX | BCL2-associated X
protein | 2.2 | 0.00672 | Up |
| NM_001034 |
TC02000057.hg.1 | RRM2 | ribonucleotide
reductase M2 | −2.9 | 0.00010 | Down |
| NM_002639 |
TC18000226.hg.1 | SERPINB5 | Serpin peptidase
inhibitor, clade B (ovalbumin), member 5 | −2.8 | 0.00756 | Down |
| NM_001196 |
TC01000866.hg.1 | BID | BH3 interacting
domain death agonist | −2.5 | 0.00002 | Down |
| NM_016426 |
TC22000394.hg.1 | GTSE1 | G-2 and S-phase
expressed 1 | −2.4 | 0.00019 | Down |
| NM_003620 |
TC17000739.hg.1 | PPM1D | Protein
phosphatase, Mg2+/Mn2+ dependent, 1D | 4.5 | 0.00005 | Up |
| NM_003842 |
TC08001049.hg.1 | TNFRSF10B | Tumor necrosis
factor receptor superfamily, member 10b | 3.8 | 0.00005 | Up |
| NM_031459 |
TC01000377.hg.1 | SESN2 | Sestrin 2 | 3.7 | 0.00119 | Up |
| NM_003246 |
TC15000270.hg.1 | THBS1 | Thrombospondin
1 | 2.5 | 0.00013 | Up |
| NM_010277 |
TC66000070.hg.1 | UBE4B | Ubiquitination
factor E4B | −17.44 | 0.00000 | Down |
| NM_005351 |
TC62000079.hg.1 | PLOD1 | Procollagen-lysine,
2-oxoglutarate 5-dioxygenase 1 | −16.78 | 0.00104 | Down |
| NM_004701 |
TC15000449.hg.1 | CCNB2 | Cyclin B2 | −2.7 | 0.00011 | Down |
| NM_001786 |
TC02001182.hg.1 | CDK1 | Cyclin-dependent
kinase 1 | −2.5 | 0.00163 | Down |
| NM_057749 |
TC08001438.hg.1 | CCNE2 | Cyclin E2 | −2.4 | 0.00622 | Down |
| NM_022470 |
TC03002022.hg.1 | ZMAT3 | Zinc finger,
matrin-type 3 | −2.2 | 0.00161 | Down |
|
| hsa04668:TNF
signaling pathway |
|
|
|
| NM_006290 |
TC06001027.hg.1 | TNFAIP3 | Tumor necrosis
factor, alpha-induced protein 3 | 20.2 | 0.00007 | Up |
| NM_006941 |
TC11001948.hg.1 | TCF19 | Transcription
factor 19 | 8.96 | 0.00064 | Up |
| NM_001168319 |
TC06000087.hg.1 | EDN1 | Endothelin 1 | 3.0 | 0.00025 | Up |
| NM_001145138 |
TC11001939.hg.1 | RELA | V-rel
reticuloendotheliosis viral oncogene homolog A (avian) | 3.0 | 0.00002 | Up |
| NM_001244134 |
TC10002935.hg.1 | MAP3K8 | Mitogen-activated
protein kinase kinase kinase 8 | 2.9 | 0.00013 | Up |
| NM_000214 |
TC20000621.hg.1 | JAG1 | Jagged 1 | 2.7 | 0.00019 | Up |
| NM_000963 |
TC01003638.hg.1 | PTGS2 |
Prostaglandin-endoperoxide synthase 2
(prostaglandin G/H synthase and cyclooxygenase) | 2.6 | 0.02677 | Up |
| NM_001166 |
TC11000957.hg.1 | BIRC2 | Baculoviral IAP
repeat containing 2 | 2.3 | 0.00069 | Up |
| NM_000600 |
TC05001366.hg.1 | IL6 | Interleukin-6 | 2.2 | 0.00002 | Up |
| NM_182810 |
TC22000317.hg.1 | ATF4 | Activating
transcription factor 4 (tax-responsive enhancer element B67) | 2.2 | 0.00548 | Up |
| NM-029914 |
TC61000040.hg.1 | UBIAD1 | UbiA
prenyltransferase domain containing 1 | −16.88 | 0.00108 | Down |
| NM_001256045 |
TC03001824.hg.1 | PIK3CB |
Phosphoinositide-3-kinase, catalytic, beta
polypeptide | −4.7 | 0.00000 | Down |
| NM_001065 |
TC12001135.hg.1 | TNFRSF1A | Tumor necrosis
factor receptor superfamily, member 1A | −4.0 | 0.00035 | Down |
| NM_002758 |
TC17000807.hg.1 | MAP2K6 | Mitogen-activated
protein kinase kinase 6 | −4.0 | 0.00021 | Down |
| NM_002982 |
TC17000383.hg.1 | CCL2 | Chemokine (C-C
motif) ligand 2 | −2.6 | 0.03428 | Down |
| NM_001114172 |
TC01002616.hg.1 | PIK3R3 |
Phosphoinositide-3-kinase, regulatory
subunit 3 (gamma) | −2.3 | 0.00083 | Down |
| NM_005027 |
TC19002628.hg.1 | PIK3R2 |
Phosphoinositide-3-kinase, regulatory
subunit 2 (beta) | −2.3 | 0.00044 | Down |
| NM_001136153 |
TC06004121.hg.1 | ATF6B | Activating
transcription factor 6 beta | −2.1 | 0.00045 | Down |
| NM_001199427 |
TC14000786.hg.1 | TRAF3 | TNF
receptor-associated factor 3 (TRAF3) | −2.1 | 0.00073 | Down |
|
| hsa04152:AMPK
signaling pathway |
|
|
|
| NM_003749 |
TC13000871.hg.1 | IRS2 | Insulin receptor
substrate 2 | 3.5 | 0.00044 | Up |
| NM_000875 |
TC15000949.hg.1 | IGF1R | Insulin-like growth
factor 1 receptor | 3.5 | 0.00188 | Up |
| NM_181715 |
TC01003280.hg.1 | CRTC2 | CREB regulated
transcription coactivator 2 | 3.0 | 0.00176 | Up |
| NM_006253 |
TC12000936.hg.1 | PRKAB1 | Protein kinase,
AMP-activated, beta 1 non-catalytic subunit | 2.7 | 0.00031 | Up |
| NM_012238 |
TC10000400.hg.1 | SIRT1 | Sirtuin 1 | 2.5 | 0.00023 | Up |
| NM_001018053 |
TC01001731.hg.1 | PFKFB2 |
6-phosphofructo-2-kinase/fructose-2,6-biphosphatase
2 | 2.4 | 0.00008 | Up |
| NM_000859 |
TC05000363.hg.1 | HMGCR |
3-hydroxy-3-methylglutaryl-CoA
reductase | −4.8 | 0.00001 | Down |
| NM_001256045 |
TC03001824.hg.1 | PIK3CB |
Phosphoinositide-3-kinase, catalytic, beta
polypeptide | −4.7 | 0.00000 | Down |
| NM_005063 |
TC10000721.hg.1 | SCD | Stearoyl-CoA
desaturase (delta-9-desaturase) | −4.6 | 0.00323 | Down |
| NM_001237 |
TC04001516.hg.1 | CCNA2 | Cyclin A2 | −3.5 | 0.00007 | Down |
| NM_001199756 |
TC01001771.hg.1 | PPP2R5A | Protein phosphatase
2, regulatory subunit B′, alpha | −2.8 | 0.00000 | Down |
| NM_004104 |
TC17001973.hg.1 | FASN | Fatty acid
synthase | −2.6 | 0.00024 | Down |
| NM_198834 |
TC17001406.hg.1 | ACACA | Acetyl-CoA
carboxylase alpha | −2.6 | 0.00073 | Down |
| NM_005027 |
TC19002628.hg.1 | PIK3R2 |
Phosphoinositide-3-kinase, regulatory
subunit 2 | −2.3 | 0.00044 | Down |
| NM_001114172 |
TC01002616.hg.1 | PIK3R3 |
Phosphoinositide-3-kinase, regulatory
subunit 3 (gamma) | −2.3 | 0.00083 | Down |
| NM_005037 |
TC03000069.hg.1 | PPARG | Peroxisome
proliferator-activated receptor gamma | −2.1 | 0.00108 | Down |
| NM_001177562 |
TC11002284.hg.1 | PPP2R1B | Protein phosphatase
2, regulatory subunit A | −2.0 | 0.01473 | Down |
|
| hsa04621:NOD-like
receptor signaling pathway |
|
| NM_006290 |
TC06001027.hg.1 | TNFAIP3 | Tumor necrosis
factor, alpha-induced protein 3 | 20.2 | 0.00007 | Up |
| NM_001562 |
TC11002293.hg.1 | IL18 | Interleukin-18 | 3.1 | 0.00033 | Up |
| NM_001145138 |
TC11001939.hg.1 | RELA | V-rel
reticuloendotheliosis viral oncogene homolog A | 3.0 | 0.00002 | Up |
| NM_001166 |
TC11000957.hg.1 | BIRC2 | Baculoviral IAP
repeat containing 2 | 2.3 | 0.00069 | Up |
| NM_004620 |
TC11001560.hg.1 | TRAF6 | TNF
receptor-associated factor 6, E3 ubiquitin protein ligase | 2.3 | 0.00000 | Up |
| NM_000600 |
TC05001366.hg.1 | IL6 | Interleukin-6 | 2.2 | 0.00002 | Up |
| NM_001006600 |
TC05000280.hg.1 | ERBB2IP | Erbb2 interacting
protein | −3.1 | 0.00030 | Down |
| NM_002982 |
TC17000383.hg.1 | CCL2 | Chemokine (C-C
motif) ligand 2 | −2.6 | 0.03428 | Down |
| NM_001017963 |
TC14001526.hg.1 | HSP90AA1 | Heat shock protein
90 kDa alpha (cytosolic), class A member 1 | −2.5 | 0.00029 | Down |
Validation of the expression of genes
by qPCR
To validate potentially valuable genes that were
screened by microarray results, the results between the clustered
selected transcripts and those from RT-qPCR were compared (Fig. 2). Following borax treatment, 26
downregulated genes were identified on the basis of fold-change
threshold, and the potentially functional correlation of caspase--6
or P53 signaling with proliferation in HepG2 cells was suggested.
Additionally, RT-qPCR also revealed a few abundantly expressed
genes, including AZI2, BPGM, FBXO9, MBTPS1, NBPF1, PRUNE1, SNX13,
SETD5, TSR2, TTLL4, UPF2, RCN2, USP16, PPcaspase-1, MTIF2, MAPK4,
LMAN2L, CENPN, CDCA8 and PPIP5K2, in HepG2 cells with no borax
treatment.
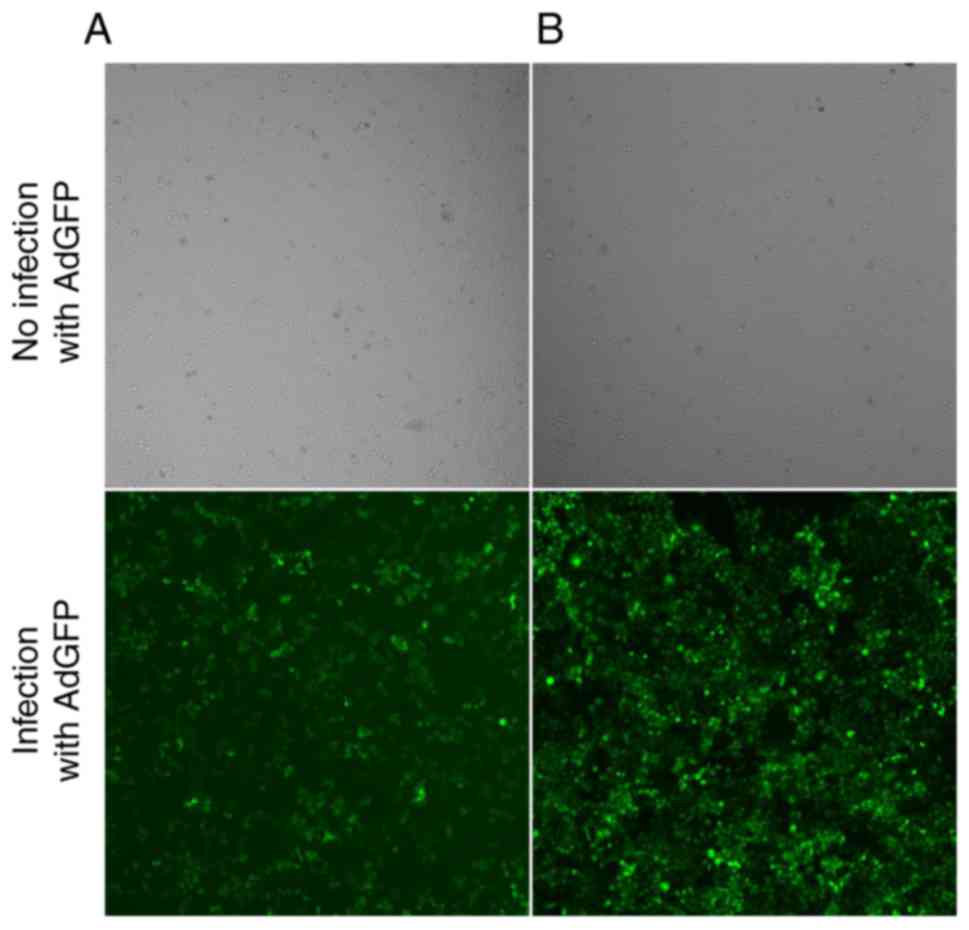
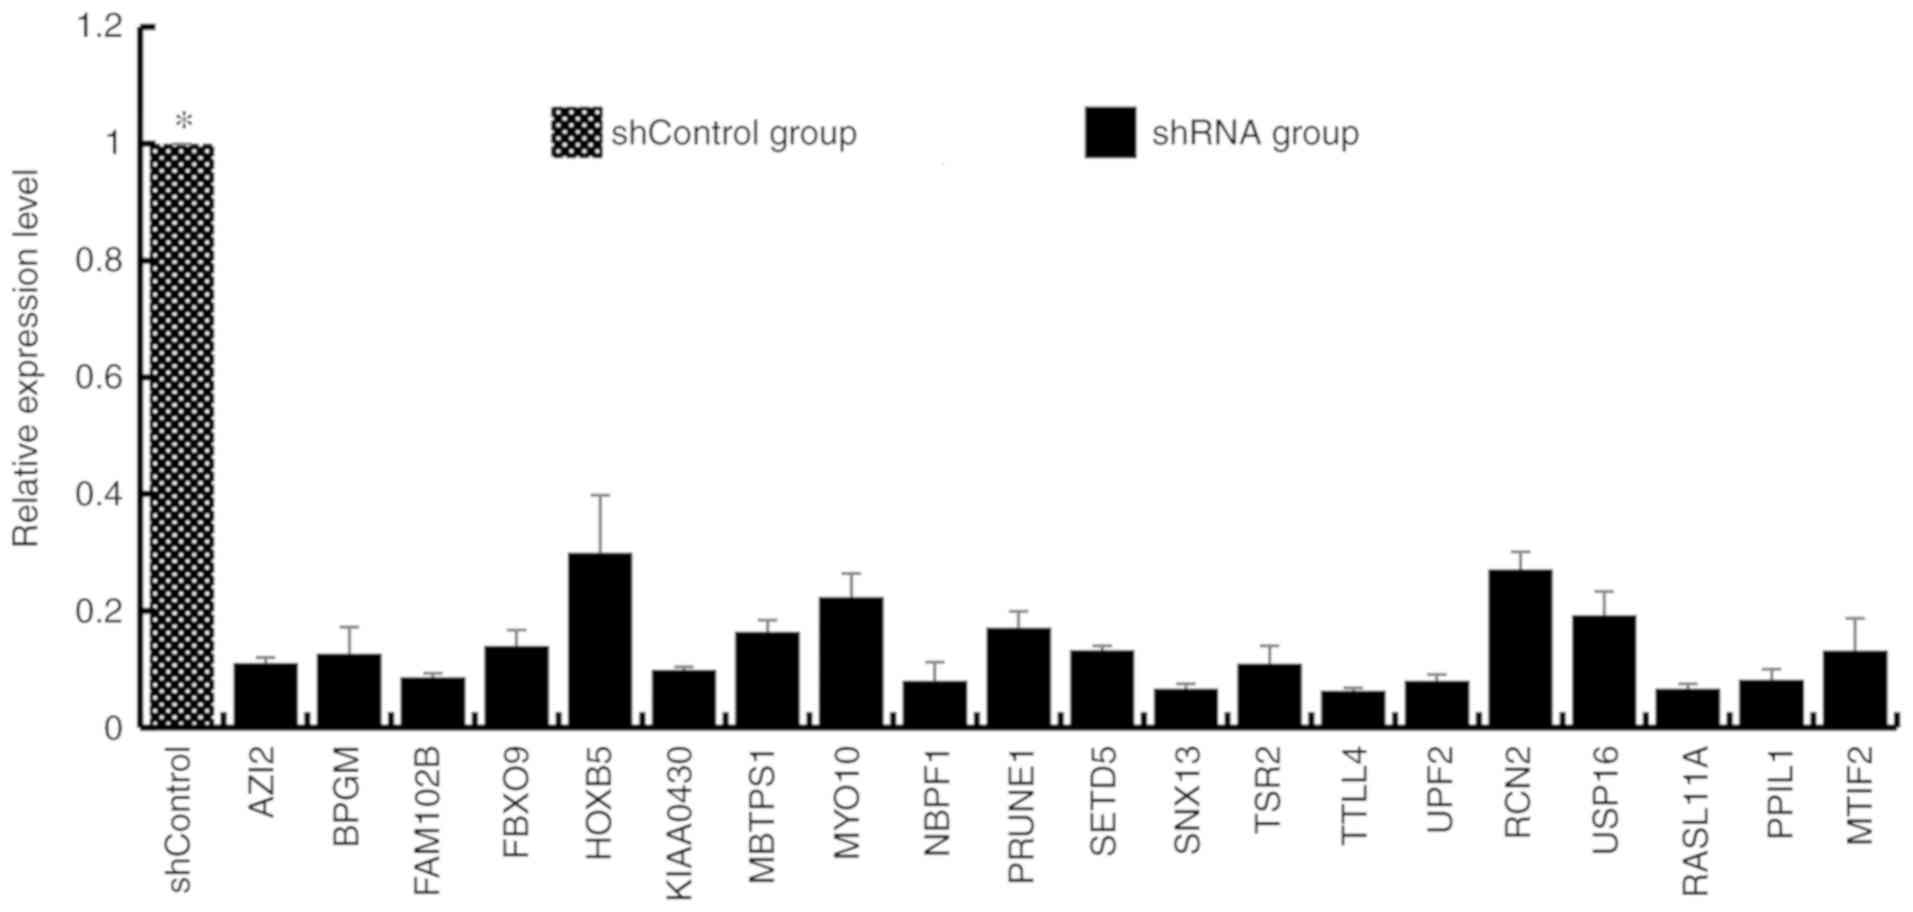
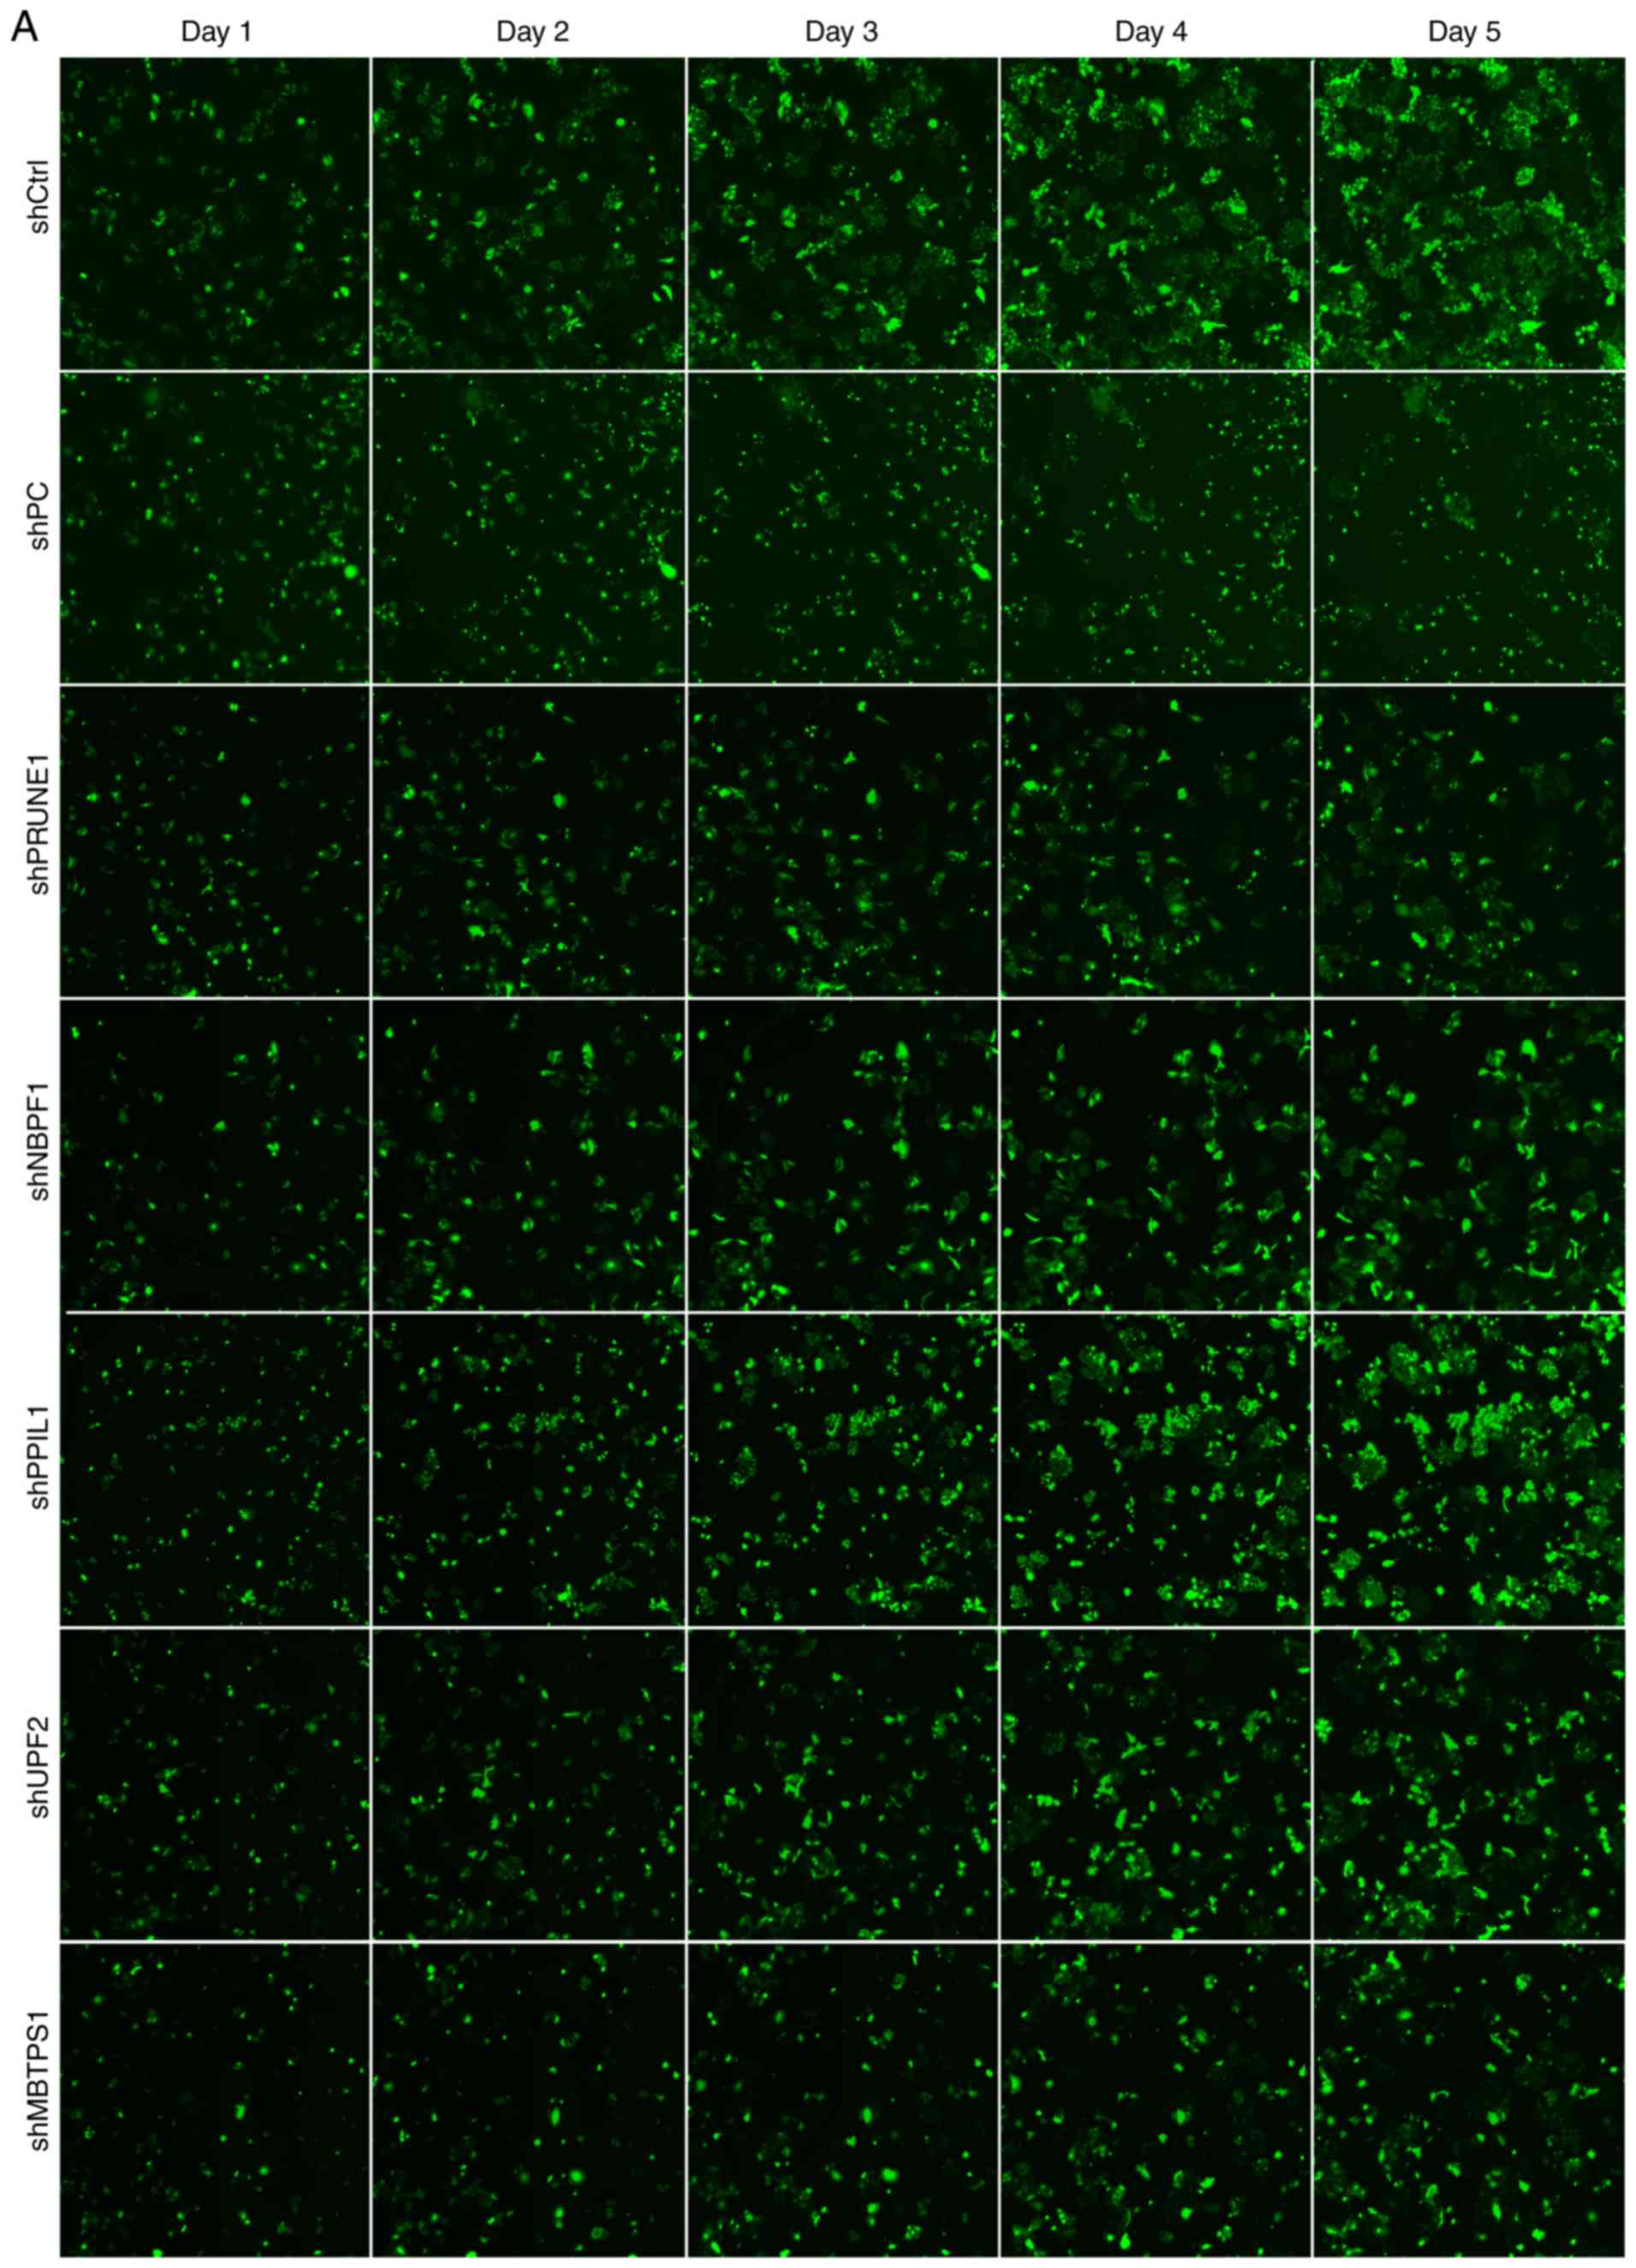
Effects of abundantly expressed genes
on cell proliferation
HepG2 cells infected with recombinant adenovirus
were cultured for 48–72 h. When adenoviral green fluorescent
protein (AdGFP) reached over 80%, recombinant adenovirus was
considered to be efficiently infected HepG2 cells in vitro
(Fig. 4), and decreased expression
of genes was established following transfection with each shRNA
(Fig. 5). On the 5th day following
the infection, the proliferation of iRNA-treated HepG2 cells was
significantly suppressed (fold change ≥1.5) compared with those in
the control group (P<0.05). Furthermore, the target genes of
RNAi fragments included PRUNE1, NBPF1, PPcaspase-1, UPF2 and MBTPS1
(fold change ≥1.50; Fig. 6). These
findings indicted that, compared with control group cells, cell
proliferation in the shRNA group was significantly reduced (fold
change ≥1.5). Therefore it was inferred that the target gene of RNA
lentivirus in the shRNA group was tumor cells proliferation-related
positive gene.
Discussion
Boron is a naturally abundant element on the earth
(24). Notably, borax is a boron
compound, which plays essential roles in many industries and in
daily life (25). Currently,
several boron-containing molecules have been applied for the
treatment of multiple diseases, including inflammation, diabetes
and cancer (26,27). Some of these treatments have
produced positive results in preclinical and clinical trials
(28,29). For instance, previous studies
revealed boric acid/borax mediated protection against
TiO2 genotoxicity in peripheral blood cells (30). In addition, borax mediated the
stimulation of sister chromatid exchange in human chromosomes
and/or lymphocyte proliferation (1). Furthermore, a previous study revealed
that peripheral blood cells with aflatoxin B1-induced genetic
damage were sufficiently rescued by borax treatment, which has also
been indicated to be an effective antiepileptic drug (31,32).
The properties of borax are also considered to be
correlated with genetic defects and genotoxicity. Specifically, it
is widely accepted that when borax is applied at high
concentrations, it is cytotoxic to mammalian cells, although cell
transformation assays show that borax treatment is weakly mutagenic
and not oncogenic (33). In our
previous study, it was indicated that borax induced a strong
increase in caspase--6 production, which was accompanied by the
enhanced expression of p53-modulated genes, including p21, Bax and
Puma (16). Considering that the
precise regulation of borax-induced genotoxicity has not been well
defined, novel mechanisms underlying the genetic actions and
potential new biological effects of borax on various cell-types
require more insight.
In the present study, microarray analysis indicated
that the expression levels of 530 genes were changed in HepG2 cells
in the 2-h treatment group. Among them, 146 were downregulated and
384 were upregulated. Notably, MYO10, one of the downregulated
genes, encodes a member of the myosin superfamily, which mediates
the migration and invasion of tumor cells, suggesting that it
contributes to the metastatic phenotype, possibly via its direct
involvement in the assembly of molecular motors (34,35).
miR-4521 was also downregulated, which is closely correlated with
signal transduction, mediating DNA binding, receptor activity and
other processes (36). The DDIT3
gene, which encodes a suppressor protein that primarily inhibits
mTOR signaling under stress conditions and is partially involved in
cancer progression (37), was also
downregulated with borax treatment. Heat shock protein (HSP)25
protein is encoded by the HSPβ-1 gene. HSPβ-1 is a member of the
HSP family (38) and is abundantly
expressed in various types of cancer associated with poor prognosis
and resistance to chemotherapy, possibly through their aggressive
tumor behavior and metastasis (39). In the present study, HSPβ-1 was also
significantly downregulated. Early growth response protein 1, which
is involved in the initial stage of the inflammatory response,
possibly through its critical roles as a tumor suppressor or
promoter (40), was upregulated
following 2-h borax treatment in the present study. Furthermore,
prostaglandin-endoperoxide synthase 2, a principal inflammatory
mediator and a UV-inducible enzyme the catalyzes the first step in
the synthesis of prostaglandin E2 (41), was also upregulated. Additionally,
TNFAIP3 and caspase--6, which are associated with inflammation and
stress reaction (42), were also
found to be upregulated. Notably, TNFAIP3 acts as a critical
molecular switch to discriminate tumor necrosis factor-induced
NF-κB signaling from the activated JNK signaling pathways in
hepatocytes when stimulated with varying cytokine concentrations
under normal or pathological conditions (43). These findings implicate
downregulated/upregulated genes following borax treatment impact
the migration and invasion of tumor cells, DNA binding signal
transduction, inflammation and stress reactions. However, the
specific mechanisms involved require further study.
The expression levels of 1,763 genes were changed in
cells from the 24-h treatment group compared with those in the
control group. Specifically, 719 genes were downregulated and 1,044
genes were upregulated (Fig. 1).
Among them, the downregulated genes included B3GALT6, a critical
enzyme catalyzing the formation of the tetrasaccharide linkage
region, the mutation of which results in proteoglycan maturation
defects (44). In the present
study, FAM20B was downregulated in the 24-h treatment group.
Notably, it was previously indicated that FAM20B deletion is
associated with Ehlers-Danlos syndrome (45,46).
UBE4B was also downregulated in cells from the 24-h treatment group
in the present study. A previous study revealed that silencing of
UBE4B expression inhibited the proliferation, colony formation,
migration and invasion of liver cancer cells in vitro, and
resulted in significant apoptosis. Therefore, it was suggested that
this gene may be a good prognostic candidate for liver cancer
(47). The overexpression of UBE4B,
which is widely accepted as a p53 upstream target gene, contributes
to the migration and invasion of tumor cells (48,49).
UBIAD1, also known as UbiA prenyltransferase domain-containing
protein 1, functions as an important regulator in the cell
progression of bladder and prostate cancer, as well as vascular
integrity, possibly through its modulation of metabolism of
intracellular cholesterol and protection against oxidative stress
(50). UBIAD1 was also
downregulated. Additionally, PLOD1, which is associated with cell
apoptosis, cell cycle and metastasis (51), was also found to be
downregulated.
In the present study, 24-h treatment with borax
upregulated the expression of several genes, including ZNF84, which
is also known as a zinc finger transcription factor gene (52). ZNF84 is located in chromosome
12q24.33, which is correlated with recurrent breakpoints and
allelic loss in a few types of cancer (52,53).
Immediate early response 3 was another upregulated gene that
normally regulates apoptosis, proliferation and the maintenance of
HCCs (54,55). TCF19, which was also upregulated,
has been identified to be a good prognostic candidate for HCC,
thereby becoming a promising candidate for preclinical and/or
clinical studies to determine its potential risk in HCCs (56).
Distinct sets of genes were found to be altered
after different treatment durations, namely, borax treatments for
either 2 or 24 h in HepG2 cells. Exposure to borax for 2 h altered
the expression levels of genes encoding proteins involved in signal
transduction underlying stress response, biopolymer metabolic
process, the inflammatory response (e.g., NF-κB and caspase--6) and
unfolded protein response among other possibilities. Notably, the
results for cells from the 2-h treatment group revealed the
disruption of certain metabolic processes involved in inflammation
and stress response. Accordingly, borax treatment for 24 h caused
the dysregulation of genes involved in a number of signaling
pathways, which are associated with enhanced cell proliferation and
apoptosis underlying the disruption of both vascular integrity and
suppression of tumor cell progression (16), indicating that the disruption of
those signaling pathways may contribute to carcinogenesis in
borax-treated HepG2 cells.
Enriched GO analyses in the present study revealed
that the significantly enriched gene sets included the response to
primary metabolic process, response to stimulus, biosynthetic
process, developmental process, apoptotic process, immune system
process, binding, catalytic activity, cell part, organelles, and
others. In the present study, the downregulation of PRUNE1, NBPF1,
PPcaspase-1, UPF2, and MBTPS1 suggested that they inhibited the
growth of HepG2 cells. For instance, PRUNE1 is a member of the
Asp-His-His phosphoesterase protein superfamily, which is involved
in cell motility and is implicated in cancer progression (57). NBPF1 is a tumor suppressor in
several cancer types and can act as a tumor suppressor modulating
cell apoptosis, possibly through the inhibition of various proteins
involved in the cell cycle (58).
NBPF1 is also implicated in cancer progression (59). PPcaspase-1 has also been reported to
be upregulated in human colon cancer cells. Accordingly, small
interfering RNA-mediated PPcaspase-1 knockdown resulted in cell
apoptosis in those cells (60).
Therefore, precise modulations of the expression level of these
critical genes leads to accurate regulation of cellular activity,
thereby contributing to the suppressed initiation of cancer
progression. Notably, future progress in identifying the basic
features of these essential proteins may provide further insights
into the diagnosis and prognosis of certain types of human cancer
and may also aid the production of novel strategies to develop more
effective and efficient therapeutic agents against those types of
cancer.
To conclude, 2- and 24-h borax treatment caused
significant alterations in the expression levels of various genes.
However, based on the length of treatment different sets of genes
were altered. Dysregulated genes were identified to be involved in
various critical signaling pathways underlying biological
processes, including the inflammatory response, stress response,
cell apoptosis, signal transduction and cell-to-cell signaling.
Some of these changes in those biological processes persisted 24 h
after treatment. Thus, it was demonstrated that borax could induce
significant alterations in gene expression. However, further
studies are required to determine whether these changes are
ascribed to genetic alterations in the promoter or regulatory
regions of dysregulated genes. Notably, these studies could bring
further insights into how borax affects gene expression. The
present study provides the fundamental basis for exploring the
carcinogenicity of borax treatment in HepG2 to reveal the
underlying cellular and molecular mechanisms, the basic biological
characteristics and associated pathways, which warrant further
investigation.
Acknowledgements
Not applicable.
Funding
This work was funded by the National Natural
Scientific Foundation of China (grant no. 81872509), the Natural
Science Foundation of Hubei Provincial Department of Education
(grant no. D20172101), the Hubei Provincial Technology Innovation
Project (grant no. 2017ACA176), the Hubei Province Health and
Family Planning Scientific Research Project (grant no. WJ2019M054),
the Natural Science Foundation of Hubei Provincial Department of
Education (grant no. Q20162113) and the Natural Science Foundation
of the Bureau of Science and Technology of Shiyan City (grant no.
18Y76, 17Y47).
Availability of data and materials
The datasets used and/or analyzed during the current
study are available from the corresponding author on reasonable
request.
Authors' contributions
LW, YW, ZGT and YSZ conceived and designed the
experiments. LW, ZPZ, JZ, HMW, GMW and SW contributed reagents,
materials and analysis tools and performed the experiments. LW,
WBZ, QHC, LHY and MXL analyzed and interpreted the experimental
data. LW was a major contributor in writing the manuscript. All
authors read and approved the final manuscript.
Ethics approval and consent to
participate
Not applicable.
Patient consent for publication
Not applicable.
Competing interests
The authors declare that they have no competing
interests.
References
|
1
|
Routray I and Ali S: Boron induces
lymphocyte proliferation and modulates the priming effects of
lipopolysaccharide on macrophages. PLoS One. 11:e01506072016.
View Article : Google Scholar : PubMed/NCBI
|
|
2
|
Neiner D, Sevryugina YV, Harrower LS and
Schubert DM: Structure and properties of sodium enneaborate,
Na2[B8O11(OH)4]·B(OH)3·2H2O.
Inorg Chem. 56:7175–7181. 2017. View Article : Google Scholar : PubMed/NCBI
|
|
3
|
Alak G, Parlak V, Yeltekin AÇ, Ucar A,
Çomaklı S, Topal A, Atamanalp M, Özkaraca M and Türkez H: The
protective effect exerted by dietary borax on toxicity metabolism
in rainbow trout (Oncorhynchus mykiss) tissues. Comp Biochem
Physiol C Toxicol Pharmacol. 216:82–92. 2019. View Article : Google Scholar : PubMed/NCBI
|
|
4
|
Alak G, Parlak V, Aslan ME, Ucar A,
Atamanalp M and Turkez H: Borax supplementation alleviates
hematotoxicity and DNA damage in rainbow trout (Oncorhynchus
mykiss) exposed to copper. Biol Trace Elem Res. 187:536–542. 2019.
View Article : Google Scholar : PubMed/NCBI
|
|
5
|
Hussain SA, Abood SJ and Gorial FI: The
adjuvant use of calcium fructoborate and borax with etanercept in
patients with rheumatoid arthritis: Pilot study. J Intercult
Ethnopharmacol. 6:58–64. 2016. View Article : Google Scholar : PubMed/NCBI
|
|
6
|
Ince S, Kucukkurt I, Cigerci IH, Fatih
Fidan A and Eryavuz A: The effects of dietary boric acid and borax
supplementation on lipid peroxidation, antioxidant activity, and
DNA damage in rats. J Trace Elem Med Biol. 24:161–164. 2010.
View Article : Google Scholar : PubMed/NCBI
|
|
7
|
Sandeep Varma R, Shamsia S, Thiyagarajan
OS, Vidyashankar S and Patki PS: Yashada bhasma (Zinc calx) and
Tankana (Borax) inhibit Propionibacterium acne and suppresses acne
induced inflammation in vitro. Int J Cosmet Sci. 36:361–368. 2014.
View Article : Google Scholar : PubMed/NCBI
|
|
8
|
López-Cabrera Y, Castillo-García EL,
Altamirano-Espino JA, Pérez-Capistran T, Farfán-García ED,
Trujillo-Ferrara JG and Soriano-Ursúa MA: Profile of three
boron-containing compounds on the body weight, metabolism and
inflammatory markers of diabetic rats. J Trace Elem Med Biol.
50:424–429. 2018. View Article : Google Scholar : PubMed/NCBI
|
|
9
|
Geyikoglu F and Turkez H: Boron compounds
reduce vanadium tetraoxide genotoxicity in human lymphocytes.
Environ Toxicol Pharmacol. 26:342–347. 2008. View Article : Google Scholar : PubMed/NCBI
|
|
10
|
Gülsoy N, Yavas C and Mutlu Ö: Genotoxic
effects of boric acid and borax in zebrafish, Danio rerio using
alkaline comet assay. EXCLI J. 14:890–899. 2015.PubMed/NCBI
|
|
11
|
Sarkar PK, Prajapati PK, Shukla VJ and
Ravishankar B: Evaluation of processed borax as antidote for
aconite poisoning. J Ethnopharmacol. 205:138–146. 2017. View Article : Google Scholar : PubMed/NCBI
|
|
12
|
Capkin E, Ozcelep T, Kayis S and Altinok
I: Antimicrobial agents, triclosan, chloroxylenol,
methylisothiazolinone and borax, used in cleaning had genotoxic and
histopathologic effects on rainbow trout. Chemosphere. 182:720–729.
2017. View Article : Google Scholar : PubMed/NCBI
|
|
13
|
Pongsavee M: Genotoxic effects of borax on
cultured lymphocytes. Southeast Asian J Trop Med Public Health.
40:411–418. 2009.PubMed/NCBI
|
|
14
|
Pongsavee M: Effect of borax on immune
cell proliferation and sister chromatid exchange in human
chromosomes. J Occup Med Toxicol. 4:272009. View Article : Google Scholar : PubMed/NCBI
|
|
15
|
Çelikezen FÇ, Toğar B, Özgeriş FB, İzgi MS
and Türkez H: Cytogenetic and oxidative alterations after exposure
of cultured human whole blood cells to lithium metaborate
dehydrate. Cytotechnology. 68:821–827. 2016. View Article : Google Scholar : PubMed/NCBI
|
|
16
|
Wei Y, Yuan FJ, Zhou WB, Wu L, Chen L,
Wang JJ and Zhang YS: Borax-induced apoptosis in HepG2 cells
involves p53, Bcl-2, and Bax. Genet Mol Res. 15:2016. View Article : Google Scholar :
|
|
17
|
Brocato J and Costa M: Basic mechanics of
DNA methylation and the unique landscape of the DNA methylome in
metal-induced carcinogenesis. Crit Rev Toxicol. 43:493–514. 2013.
View Article : Google Scholar : PubMed/NCBI
|
|
18
|
Hazman Ö, Bozkurt MF, Fidan AF, Uysal FE
and Çelik S: the effect of boric acid and borax on oxidative
stress, inflammation, ER stress and apoptosis in cisplatin
toxication and nephrotoxicity developing as a result of toxication.
Inflammation. 41:1032–1048. 2018. View Article : Google Scholar : PubMed/NCBI
|
|
19
|
Oh SH and Lim SC: A rapid and transient
ROS generation by cadmium triggers apoptosis via caspase-dependent
pathway in HepG2 cells and this is inhibited through
N-acetylcysteine-mediated catalase upregulation. Toxicol Appl
Pharmacol. 212:212–223. 2006. View Article : Google Scholar : PubMed/NCBI
|
|
20
|
Cartularo L, Laulicht F, Sun H, Kluz T,
Freedman JH and Costa M: Gene expression and pathway analysis of
human hepatocellular carcinoma cells treated with cadmium. Toxicol
Appl Pharmacol. 288:399–408. 2015. View Article : Google Scholar : PubMed/NCBI
|
|
21
|
Livak KJ and Schmittgen TD: Analysis of
relative gene expression data using real-time quantitative PCR and
the 2(-Delta Delta C(T)) method. Methods. 25:402–408. 2001.
View Article : Google Scholar : PubMed/NCBI
|
|
22
|
Zhang DY, Liu Z, Lu Z, Sun WL, Ma X, Zhang
P, Wu BQ and Cui PY: Lentivirus-mediated overexpression of HSDL2
suppresses cell proliferation and induces apoptosis in
cholangiocarcinoma. Onco Targets Ther. 11:7133–7142. 2018.
View Article : Google Scholar : PubMed/NCBI
|
|
23
|
Zheng J, You W, Zheng C, Wan P, Chen J,
Jiang X, Zhu Z, Zhang Z, Gong A, Li W, et al: Knockdown of FBXO39
inhibits proliferation and promotes apoptosis of human osteosarcoma
U-2OS cells. Oncol Lett. 16:1849–1854. 2018.PubMed/NCBI
|
|
24
|
Yamada KE and Eckhert CD: Boric acid
activation of eIF2α and Nrf2 Is PERK dependent: A mechanism that
explains how boron prevents DNA damage and enhances antioxidant
status. Biol Trace Elem Res. 188:2–10. 2019. View Article : Google Scholar : PubMed/NCBI
|
|
25
|
Matencio A, Navarro-Orcajada S,
García-Carmona F and López-Nicolás JM: Ellagic acid-borax
fluorescence interaction: Application for novel cyclodextrin-borax
nanosensors for analyzing ellagic acid in food samples. Food Funct.
9:3683–3687. 2018. View Article : Google Scholar : PubMed/NCBI
|
|
26
|
Donoiu I, Militaru C, Obleagă O, Hunter
JM, Neamţu J, Biţă A, Scorei IR and Rogoveanu OC: Effects of
boron-containing compounds on cardiovascular disease risk factors-a
review. J Trace Elem Med Biol. 50:47–56. 2018. View Article : Google Scholar : PubMed/NCBI
|
|
27
|
Worm DJ, Els-Heindl S, Kellert M, Kuhnert
R, Saretz S, Koebberling J, Riedl B, Hey-Hawkins E and
Beck-Sickinger AG: A stable meta-carborane enables the generation
of boron-rich peptide agonists targeting the ghrelin receptor. J
Pept Sci. 24:e31192018. View Article : Google Scholar : PubMed/NCBI
|
|
28
|
Rico P, Rodrigo-Navarro A and
Salmerón-Sánchez M: Borax-Loaded PLLA for promotion of myogenic
differentiation. Tissue Eng Part A. 21:2662–2672. 2015. View Article : Google Scholar : PubMed/NCBI
|
|
29
|
Das BC, Thapa P, Karki R, Schinke C, Das
S, Kambhampati S, Banerjee SK, Van Veldhuizen P, Verma A, Weiss LM
and Evans T: Boron chemicals in diagnosis and therapeutics. Future
Med Chem. 5:653–676. 2013. View Article : Google Scholar : PubMed/NCBI
|
|
30
|
Turkez H: Effects of boric acid and borax
on titanium dioxide genotoxicity. J Appl Toxicol. 28:658–664. 2008.
View Article : Google Scholar : PubMed/NCBI
|
|
31
|
Jensen JP: The rise and fall of borax as
an antiepileptic drug. Arch Neurol. 63:621–622. 2006. View Article : Google Scholar : PubMed/NCBI
|
|
32
|
Meyer-Hamme G, Beckmann K, Radtke J,
Efferth T, Greten HJ, Rostock M and Schröder S: A survey of chinese
medicinal herbal treatment for chemotherapy-induced oral mucositis.
Evid Based Complement Alternat Med. 2013:2849592013. View Article : Google Scholar : PubMed/NCBI
|
|
33
|
Landolph JR: Cytotoxicity and negligible
genotoxicity of borax and borax ores to cultured mammalian cells.
Am J Ind Med. 7:31–43. 1985. View Article : Google Scholar : PubMed/NCBI
|
|
34
|
Chen CP, Sun ZL, Lu X, Wu WX, Guo WL, Lu
JJ, Han C, Huang JQ and Fang Y: MiR-340 suppresses cell migration
and invasion by targeting MYO10 in breast cancer. Oncol Rep.
35:709–716. 2016. View Article : Google Scholar : PubMed/NCBI
|
|
35
|
Makowska KA, Hughes RE, White KJ, Wells CM
and Peckham M: Specific myosins control actin organization, cell
morphology, and migration in prostate cancer cells. Cell Rep.
13:2118–2125. 2015. View Article : Google Scholar : PubMed/NCBI
|
|
36
|
Zhang H, He P, Huang R, Sun L, Liu S, Zhou
J, Guo Y, Yang D and Xie P: Identification and bioinformatic
analysis of dysregulated microRNAs in human oligodendroglial cells
infected with borna disease virus. Mol Med Rep. 14:4715–4722. 2016.
View Article : Google Scholar : PubMed/NCBI
|
|
37
|
Pinto JA, Rolfo C, Raez LE, Prado A,
Araujo JM, Bravo L, Fajardo W, Morante ZD, Aguilar A, Neciosup SP,
et al: In silico evaluation of DNA Damage Inducible Transcript 4
gene (DDIT4) as prognostic biomarker in several malignancies. Sci
Rep. 7:15262017. View Article : Google Scholar : PubMed/NCBI
|
|
38
|
Shatov VM, Weeks SD, Strelkov SV and Gusev
NB: The role of the arginine in the conserved N-terminal domain
RLFDQxFG motif of human small heat shock proteins HspB1, HspB4,
HspB5, HspB6, and HspB8. Int J Mol Sci. 19(pii): E21122018.
View Article : Google Scholar : PubMed/NCBI
|
|
39
|
Konda JD, Olivero M, Musiani D, Lamba S
and Di Renzo MF: Heat-shock protein 27 (HSP27, HSPB1) is synthetic
lethal to cells with oncogenic activation of MET, EGFR and BRAF.
Mol Oncol. 11:599–611. 2017. View Article : Google Scholar : PubMed/NCBI
|
|
40
|
Mohamad T, Kazim N, Adhikari A and Davie
JK: EGR1 interacts with TBX2 and functions as a tumor suppressor in
rhabdomyosarcoma. Oncotarget. 9:18084–18098. 2018. View Article : Google Scholar : PubMed/NCBI
|
|
41
|
Li H, Wang J, Liu X and Cheng Q:
MicroRNA-204-5p suppresses caspase-6-mediated inflammatory response
and chemokine generation in HK-2 renal tubular epithelial cells by
targeting caspase-6R. Biochem Cell Biol. 97:109–117. 2019.
View Article : Google Scholar : PubMed/NCBI
|
|
42
|
Zhai Y, Lin P, Feng Z, Lu H, Han Q, Chen
J, Zhang Y, He Q, Nan G, Luo X, et al: TNFAIP3-DEPTOR complex
regulates inflammasome secretion through autophagy in ankylosing
spondylitis monocytes. Autophagy. 14:1629–1643. 2018. View Article : Google Scholar : PubMed/NCBI
|
|
43
|
Pinna F, Bissinger M, Beuke K, Huber N,
Longerich T, Kummer U, Schirmacher P, Sahle S and Breuhahn K:
A20/TNFAIP3 discriminates tumor necrosis factor (TNF)-Induced NF-κB
from JNK pathway activation in hepatocytes. Front Physiol.
8:6102017. View Article : Google Scholar : PubMed/NCBI
|
|
44
|
Wen J, Xiao J, Rahdar M, Choudhury BP, Cui
J, Taylor GS, Esko JD and Dixon JE: Xylose phosphorylation
functions as a molecular switch to regulate proteoglycan
biosynthesis. Proc Natl Acad Sci USA. 111:15723–15728. 2014.
View Article : Google Scholar : PubMed/NCBI
|
|
45
|
Taylan F and Mäkitie O: Abnormal
proteoglycan synthesis due to gene defects causes skeletal diseases
with overlapping phenotypes. Horm Metab Res. 48:745–754. 2016.
View Article : Google Scholar : PubMed/NCBI
|
|
46
|
Van Damme T, Pang X, Guillemyn B, Gulberti
S, Syx D, De Rycke R, Kaye O, de Die-Smulders CEM, Pfundt R,
Kariminejad A, et al: Biallelic B3GALT6 mutations cause
spondylodysplastic Ehlers-Danlos syndrome. Hum Mol Genet.
27:3475–3487. 2018. View Article : Google Scholar : PubMed/NCBI
|
|
47
|
Zhang XF, Pan QZ, Pan K, Weng DS, Wang QJ,
Zhao JJ, He J, Liu Q, Wang DD, Jiang SS, et al: Expression and
prognostic role of ubiquitination factor E4B in primary
hepatocellular carcinoma. Mol Carcinog. 55:64–76. 2016. View Article : Google Scholar : PubMed/NCBI
|
|
48
|
Periz G, Lu J, Zhang T, Kankel MW,
Jablonski AM, Kalb R, McCampbell A and Wang J: Regulation of
protein quality control by UBE4B and LSD1 through p53-mediated
transcription. PLoS Biol. 13:e10021142015. View Article : Google Scholar : PubMed/NCBI
|
|
49
|
Wang B, Wu H, Chai C, Lewis J, Pichiorri
F, Eisenstat DD, Pomeroy SL and Leng RP: MicroRNA-1301 suppresses
tumor cell migration and invasion by targeting the p53/UBE4B
pathway in multiple human cancer cells. Cancer Lett. 401:20–32.
2017. View Article : Google Scholar : PubMed/NCBI
|
|
50
|
Okano T: A new horizon in vitamin K
research. Yakugaku Zasshi. 136:1141–1159. 2016.(In Japanese).
View Article : Google Scholar : PubMed/NCBI
|
|
51
|
Li L, Wang W, Li X and Gao T: Association
of ECRG4 with PLK1, CDK4, PLOD1 and PLOD2 in esophageal squamous
cell carcinoma. Am J Transl Res. 9:3741–3748. 2017.PubMed/NCBI
|
|
52
|
Rosati M, Rocchi M, Storlazzi CT and
Grimaldi G: Assignment to chromosome 12q24.33, gene organization
and splicing of the human KRAB/FPB containing zinc finger gene
ZNF84. Cytogenet Cell Genet. 94:127–130. 2001. View Article : Google Scholar : PubMed/NCBI
|
|
53
|
Assou S, Cerecedo D, Tondeur S, Pantesco
V, Hovatta O, Klein B, Hamamah S and De Vos J: A gene expression
signature shared by human mature oocytes and embryonic stem cells.
BMC Genomics. 10:102009. View Article : Google Scholar : PubMed/NCBI
|
|
54
|
Zhou Q, Hahn JK, Neupane B, Aidery P,
Labeit S, Gawaz M and Gramlich M: Dysregulated ier3 expression is
associated with enhanced apoptosis in titin-based dilated
cardiomyopathy. Int J Mol Sci. 18(pii): E7232017. View Article : Google Scholar : PubMed/NCBI
|
|
55
|
Tran DDH, Koch A, Allister A, Saran S,
Ewald F, Koch M, Nashan B and Tamura T: Treatment with MAPKAP2
(MK2) inhibitor and DNA methylation inhibitor, 5-aza dC,
synergistically triggers apoptosis in hepatocellular carcinoma
(HCC) via tristetraprolin (TTP). Cell Signal. 28:1872–1880. 2016.
View Article : Google Scholar : PubMed/NCBI
|
|
56
|
Mathew S, Abdel-Hafiz H, Raza A, Fatima K
and Qadri I: Host nucleotide polymorphism in hepatitis B
virus-associated hepatocellular carcinoma. World J Hepatol.
8:485–498. 2016. View Article : Google Scholar : PubMed/NCBI
|
|
57
|
Zollo M, Ahmed M, Ferrucci V, Salpietro V,
Asadzadeh F, Carotenuto M, Maroofian R, Al-Amri A, Singh R,
Scognamiglio I, et al: PRUNE is crucial for normal brain
development and mutated in microcephaly with neurodevelopmental
impairment. Brain. 140:940–952. 2017. View Article : Google Scholar : PubMed/NCBI
|
|
58
|
Li D, Li P, Wu J, Yi J, Dou Y, Guo X, Yin
Y, Wang D, Ma C and Qiu L: Methylation of NBPF1 as a novel marker
for the detection of plasma cell-free DNA of breast cancer
patients. Clin Chim Acta. 484:81–86. 2018. View Article : Google Scholar : PubMed/NCBI
|
|
59
|
Andries V, Vandepoele K, Staes K, Berx G,
Bogaert P, Van Isterdael G, Ginneberge D, Parthoens E,
Vandenbussche J, Gevaert K and van Roy F: NBPF1, a tumor suppressor
candidate in neuroblastoma, exerts growth inhibitory effects by
inducing a G1 cell cycle arrest. BMC Cancer. 15:3912015. View Article : Google Scholar : PubMed/NCBI
|
|
60
|
Stegmann CM, Lührmann R and Wahl MC: The
crystal structure of PPcaspase-1 bound to cyclosporine A suggests a
binding mode for a linear epitope of the SKIP protein. PLoS One.
5:e100132010. View Article : Google Scholar : PubMed/NCBI
|