Introduction
Diffuse-type gastric cancers (DGCs), which are
characterized by poorly differentiated adenocarcinoma that lack
cell-cell adhesion and infiltrate into the stroma as single or
clustered cells without glandular architecture (1,2), show
worse prognosis than the intestinal type (2,3). A
characteristic genetic alteration of DGC is the Ras homolog family
member A (RHOA) missense mutation that is reported in 14–25%
of DGC patients (4–6).
A previous report, which evaluated the
clinicopathological features of 87 DGC patients by comparing the
morphological features of RHOA-mutated and wild-type tumors,
revealed a distinct permeative intramucosal growth pattern in the
mutated tumors (7). RHOA has various
biological functions, such as cytokinesis, cell motility and tissue
development (8,9). Recently, we revealed that RHOA
mutations contribute to cancer cell survival and cell migration
through their dominant negative effect on the Rho-associated kinase
(ROCK) pathway (10), but little is
understood of how these functions are related to the
clinicopathological features of DGC.
Thus, the present study was designed to evaluate the
relationship between the features of DGC and RHOA mutations
in vivo. To this end, we first considered which model was
most suited for our evaluation. Orthotopic inoculation is reported
to be more likely to reproduce the histopathology of clinical
tumors compared to a subcutaneous model (11–13). Our
own previous study using a RHOA-mutated cancer cell line
supported these reports by revealing that, compared with
subcutaneous models, orthotopic models exhibited abundant stroma
and an invasive character (14). This
information prompted us to study the effects of RHOA
mutations in vivo by inoculating the tumor cells into the
stomachs of SCID mice.
To understand the molecular mechanism of the effects
of RHOA mutations, the tumor microenvironment must be
analyzed, as both cancer and stromal cells play key roles in
forming the tumor microenvironment (15). Therefore, we decided to carry out a
transcriptome analysis using next generation sequencing technology,
which makes it possible to distinguish human (tumor cells) and
mouse (stromal cells) sequences (14,16–18). Thus,
in the present study the effects of mutant RHOA were
evaluated by combining transcriptome analysis of the tumor and
stromal components and pathological analysis using an orthotopic
xenograft model.
Materials and methods
Cell lines
The human gastric cancer cell line MKN74 (19) was purchased from the cell bank of the
Japanese Collection of Research Bioresources (National Institutes
of Biomedical Innovation, Health and Nutrition, Osaka, Japan). It
was cultured using RPMI-1640 medium (Sigma-Aldrich; Merck KGaA)
supplemented with 10% heat-inactivated fetal bovine serum (FBS;
Sigma-Aldrich; Merck KGaA), 10 mM HEPES (Gibco; Thermo Fisher
Scientific, Inc., Waltham, MA, USA), 1 mM sodium pyruvate (Gibco;
Thermo Fisher Scientific, Inc.) and 2.5 g/l D-glucose
(Sigma-Aldrich; Merck KGaA). The cells were maintained in a
humidified incubator at 37°C with 5% CO2.
Generation of MKN74 cell lines
expressing RHOA mutations
The methods to establish MKN74 cell lines expressing
RHOA mutations were previously described (10). In brief, the coding sequences for the
RHOA mutation (NCBI RefSeq Sequence: NM_001664.3) were
inserted into the pLVSIN-CMV vector (Takara Bio Inc., Shiga,
Japan). The mixture of expression vector and ViraPower Lentiviral
Packaging Mix (Thermo Fisher Scientific, Inc.) was introduced into
Lenti-X 293T cells (Takara Bio Inc.) using FuGENE HD Transfection
Reagent (Promega Corp., Madison, WI, USA). After 48 h, the culture
medium was harvested and virus particles were concentrated with
Lenti-X Concentrator (Takara Bio Inc.). Prepared lentivirus was
transfected into each cell line with hexadimethrine bromide (final
8 µg/ml; Sigma-Aldrich; Merck KGaA). Hygromycin (Thermo Fisher
Scientific, Inc.) was added to establish stable transfectants at a
final concentration of 25 µg/ml for MKN74. The RHOA cDNA
introduced to the MKN74 cells have mutations that cause resistance
to RHOA-siRNA. Thus, we confirmed the expression of
exogenous RHOA by western blot analysis after RHOA-siRNA
treatment to eliminate endogenous RHOA which was hindering
detection of the transgenes (10).
These cells showed comparable cell growth in vitro (Fig. S1). As for other in vitro
profiles, we reported the cell motility and actin stress fiber
formation in our previous study (10)
and the features are summarized in Table
I.
 | Table I.In vitro phenotypes of the
MKN74 cells used for engraftment. |
Table I.
In vitro phenotypes of the
MKN74 cells used for engraftment.
| Transfected
RHOA | Cell growth
rate | Migration
activitya | Invasion
activitya | Actin fiber
formationb |
|---|
| WT | n.s. | Low | n.s. | High |
| Y42C | n.s. | High | n.s. | Low |
| Y42S | n.s. | High | n.s. | Low |
Cell growth assays
Cells (1.0×10³/100 µl/well) were seeded
in 96-well cell culture plates (TPP; Sigma-Aldrich; Merck KGaA) in
triplicate. The viable cells were measured 1 day, 4 and 7 days
after cell seeding using the CellTiter-Glo 3D Cell Viability Assay,
according to the manufacturer's protocol (Promega Corp.). The
luminescence was measured using a plate reader (PerkinElmer, Inc.,
Waltham, MA, USA).
Animals
Seven-week-old male severe combined immune-
deficient (SCID) mice (C.B-17/lcr-scid/scid Jcl) were
provided by CLEA Japan, Inc. (Tokyo, Japan). All animals were
housed in a specific pathogen-free environment under controlled
conditions (temperature, 20–26°C; humidity, 30–70%; light/dark
cycle, 12/12 h) and were allowed to acclimatize and recover from
shipping-related stress for more than 5 days prior to the study.
Chlorinated water and irradiated food were provided ad
libitum. The health of the mice was monitored by daily
observation. The humane endpoints were deterioration of general
conditions and sacrifice in the event of a body weight loss
exceeding 20%. All animal experiments were performed at Chugai
Pharmaceutical Co., Ltd. The experiments were reviewed and approved
by the Chugai Pharmaceutical Co., Ltd., Institutional Animal Care
and Use Committee.
Orthotopic inoculation and tissue
sampling
The mice were inoculated with 3×10⁴
cells, suspended in 20 µl of RPMI-1640 medium containing 50%
Matrigel (Corning Inc., Corning, NY, USA). Transplantation was
carried out using a method based on previous studies (14,20,21).
Briefly, the animals were anesthetized under 2.5% isoflurane
inhalation anesthesia. Then a surgical incision was made in the
medial abdomen and the stomach was exposed. Next 20 µl of cells
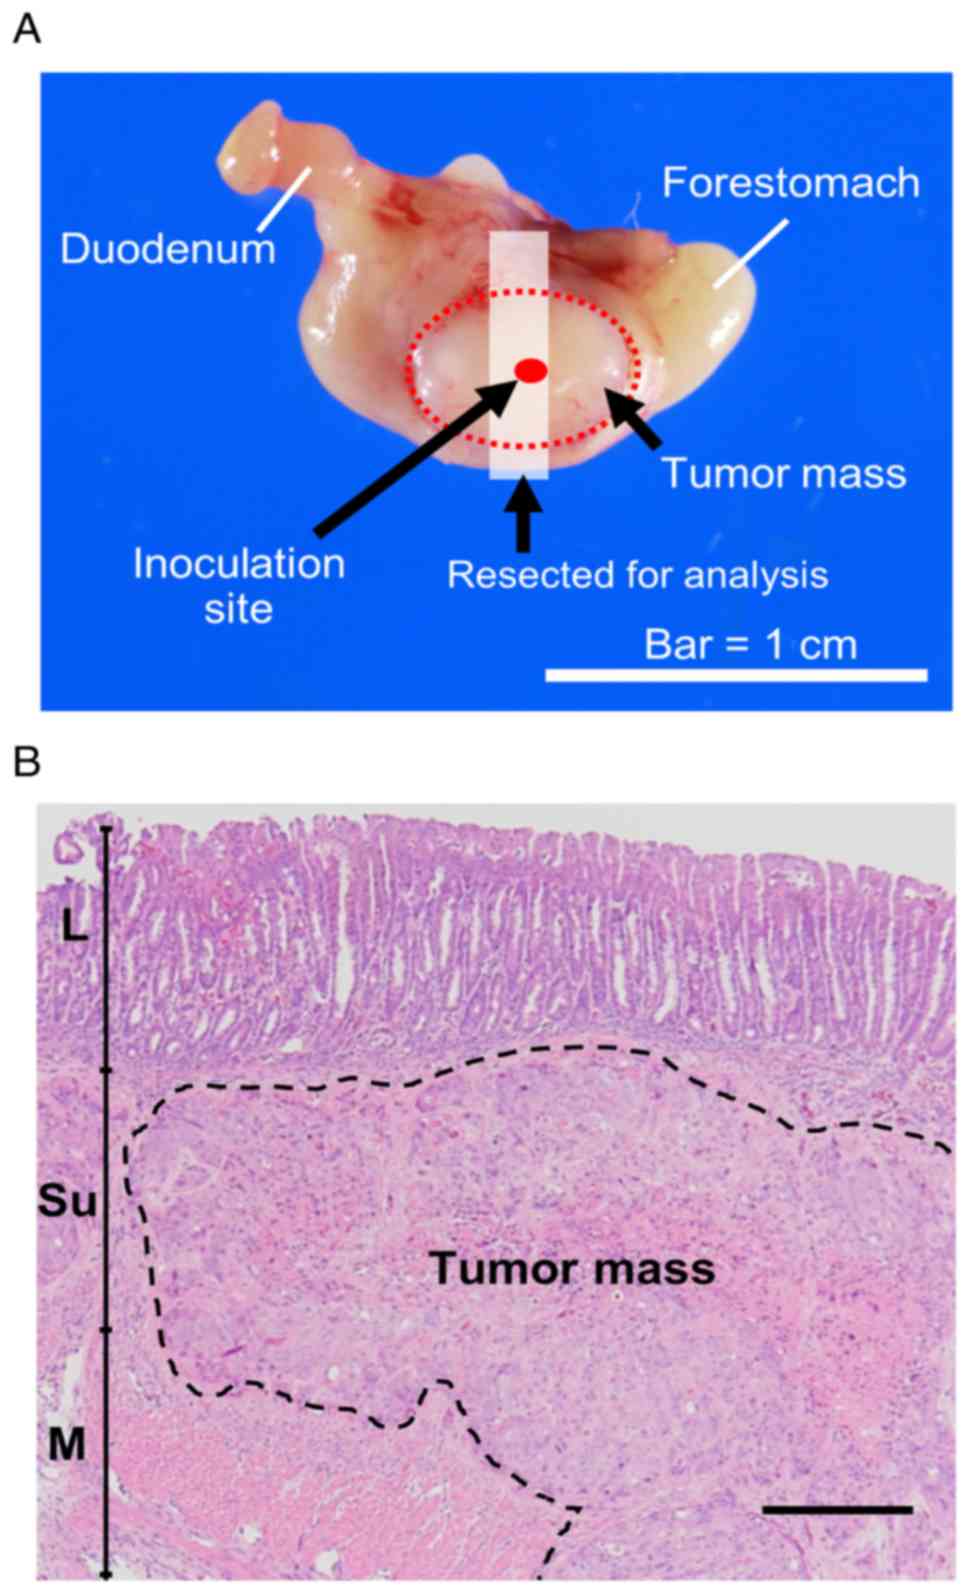
suspended in 50% Matrigel were inoculated into the serosa of the
ventral stomach (Fig. 1A). Finally,
the stomach was returned to the original position, and the incision
was closed. Inoculation was defined as successful when cells had
been injected into the intended area with no major leakage outside
of the stomach wall. For the wild-type (WT) and mutant groups, the
procedure was performed until there were 5 mice for each group.
With the mock group, 8 mice were included as controls. The total
number of mice used in the study was 42 (Mock, 8; WT, 10; Y42C, 12;
Y42S, 12), and the success rate for the inoculation procedure was
55% (23/42 mice: Mock, 8/8; WT, 5/10, Y42C, 5/12; Y42S, 5/12). The
average body weight of each group was Mock, 25.9±0.5 g; WT,
25.0±1.1 g; Y42C, 26.2±1.0 g; Y42S, 24.8±1.4 g. The largest
diameter of the tumors measured from the serosal side of the
stomach was 1.0 cm. There was no difference in diameter between
groups. The tumors were observed as single nodules with no multiple
tumors. The tumors were sampled at 4 weeks after inoculation. At
necropsy the animals were sacrificed under isoflurane inhalation
anesthesia by exsanguination from the abdominal artery and grossly
examined. Histopathologically, the tumors were engrafted as an
extension from the submucosa to the muscular layer (Fig. 1B). The tumors subjected to
histopathology and transcriptome sequencing are listed in Table SI.
RNA preparation and transcriptome
sequencing
The tumor tissues were collected in Biomasher III
(Fujifilm Wako Pure Chemical Corp., Osaka, Japan). We added TRIzol
reagent (Thermo Fisher Scientific, Inc.) into the tube and mashed
the tissues with a pestle. The tissue lysate was obtained after
centrifugation (12,000 × g for 2 min). Total RNA was extracted
using the RNeasy mini kit (Qiagen, Hilden, Germany). Total RNA
(1.7–2.0 µg) was used to prepare a transcriptome sequencing library
for each tumor sample using TruSeq stranded mRNA Library Prep kit
(Illumina, San Diego, CA, USA) following the manufacturer's
directions. The libraries were sequenced in 100 bp paired-end reads
on a HiSeq2500 sequencer (Illumina). Six libraries were loaded into
the single lane of an Illumina flow cell, producing more than 50
million paired-end reads for each sample. Sequenced reads were
mapped to all RefSeq transcripts of human (hg38 coordinates) and
mouse (mm 10 coordinates) using bowtie 1.1.2 (22) allowing up to one mismatch, and reads
mapped to both species or to multiple genes were discarded. The
remaining reads were used to estimate the gene expression profile
of human cancer cells and mouse stroma cells according to the
methods as previously described (18). Gene expression values were normalized
for cancer cells and stromal cells independently so that the sum of
the expression values below the 95th percentile would be 300,000.
Samples with human (cancer) reads <5% or >95% were removed
for subsequent analysis (Table
S1).
Unsupervised clustering of gene
expression profiles
After gene-wise Z-score transformation, hierarchical
clustering was performed using a Euclidean distance metric on the
expression of the highly and variably expressed genes across all
samples (mean normalized expression >3.0 and coefficient of
variation >30%) using the ComplexHeatmap Bioconductor package
(23).
Differential expression analysis
The DESeq2 R package (24) was used for cancer cells and stromal
cells independently to detect genes that were expressed
differentially between the two conditions. Raw count detected by
CASTIN algorithm was used as the input for the DESeq2 software.
Adjusted P-values were used to detect differentially expressed
genes and log2 fold change shrinkage was used to rank genes for
Gene Set Enrichment Analysis (GSEA).
GSEA analysis
GSEA (25,26) was used to identify gene sets that were
altered between two conditions. After sorting the genes based on
the log2 fold change, we applied a pre-ranked GSEA with the
javaGSEA desktop application (http://software.broadinstitute.org/gsea/downloads.jsp).
As gene sets, we used hallmark gene sets in The Molecular Signature
Database or genes significantly upregulated or downregulated in the
presence of a ROCK inhibitor (Y-27632) in human keratinocytes
(Table SIIA and B) (27).
Pathological sample preparation
The tumor tissues were sampled and fixed in 4%
paraformaldehyde at 4°C for 24 h and embedded into paraffin using
the AMeX method (28,29). Thin sections were prepared at a
thickness of 3–4 µm, and hematoxylin and eosin stains and Sirius
red stains were performed by routine methods for histopathological
evaluation. Additional slides were used for immunohistochemistry
for CD31 and F4/80. The primary antibodies were rabbit polyclonal
antibody to CD31 (1:100 dilution; cat. no. ab28364; Abcam,
Cambridge, UK), and rat monoclonal antibody to mouse macrophage
F4/80 antigen (1:100 dilution; clone BM8; BMA Biomedicals, Augst,
Switzerland). Briefly, after deparaffinization, the slides were
treated for antigen retrieval by autoclave heating at 120°C for 10
min for CD31, and proteinase K (Dako; Agilent Technologies) for
F4/80. Then endogenous peroxidase was quenched with 1%
H2O2 in methanol, followed by blocking with
skim milk (Thermo Fisher Scientific, Inc.). The primary antibodies
were incubated with the slides at 4°C overnight. Finally, the
secondary antibodies (LSAB2, Agilent Technologies, or
N-Histofine® simple stain mouse Rat MAX-PO; Nichirei
Biosciences Inc., Tokyo, Japan) were applied and the reactions were
visualized by 3,3′-diaminobenzidine. The slides were counterstained
with hematoxylin and coverslipped for reading under a light
microscope.
Histological evaluation
The slides were read and reviewed by 2 certified
pathologists, and the scoring criteria were determined by
discussion between the pathologists. Furthermore, scoring was
carried out based on this criteria by the following methods. The
ratio of the area of small nests to total tumor area was evaluated
by image analysis on virtual slides scanned using the Leica Aperio
ScanScope AT2 (Leica Biosystems, Wetzlar, Germany) and analyzed
with the Aperio Image Scope software (version 12.3.2.7001; Leica
Biosystems). To score CD31, the density of positive vascular
structures per site at ×20 magnification was evaluated by the
following criteria: 0, not observed; 1, >0–6 per site; 2,
>6–9 per site; 3, 10 or more. For F4/80, the density of positive
cells within the tumor mass was evaluated according to the
following criteria: 0, not observed; 1, scattered; 2, diffuse; 3,
focally dense. Additionally, the histopathological findings in the
invasive front of the tumor mass were scored. Each main finding
(fibrosis, inflammatory cell infiltration, necrosis of tumor cells)
was graded according to the following criteria: 0, not observed; 1,
occasionally observed; 2, moderately observed; 3, frequently
observed. Then the sum of the 3 findings for each animal was
calculated and designated as the histology score.
Statistical analysis
The statistical analysis was performed using the JMP
statistical software program (version 11; SAS Institute, Cary, NC,
USA). Analysis for the ratio of small nest area was conducted by
one-way analysis of variance (ANOVA) followed by a Dunnett's
multiple comparison post hoc test. The comparisons of the
histologic scores were assessed with non-parametric Steel's test.
P<0.05 was considered to indicate a statistically significant
difference.
Results
RHOA mutants were found to be enriched
in distinctly differential pathways when compared to mock/WT and
showed inhibition of ROCK signaling in vivo
To determine the effects of RHOA mutations
in vivo, we introduced WT, Y42C, and Y42S RHOA into
the MKN74 gastric cancer cell line, which originally has
WT-RHOA. To evaluate the expression profile of cells that
had been inoculated into the mouse stomach, the RNA of each tumor
tissue was eluted and sequenced to obtain tumor (human) and host
(mouse) transcriptome data simultaneously. Unsupervised
hierarchical clustering for human expression data showed that it
was clearly divided into two groups: The Y42C/Y42S group and the
mock/WT group (Fig. 2A). We also
performed unsupervised hierarchical clustering for mouse expression
data, but as the groups were allocated to various clusters,
differences in expression profiles between groups could not be
identified (Fig. 2B). Additionally,
the level of expressional change in stroma (mouse) was much lower
than that in the tumor (human) (Fig.
2C). Next we compared the expression of endothelial
(Cd31), macrophage (Adgre1, Cd68, Itgax, Mrc1), and
fibroblast (Col1A1, Thy1, Acta2, S100a4) markers, but there
was no difference between the groups (data not shown). From this
expression profile we judged that further analysis should be
focused on the expression profile of tumor cells.
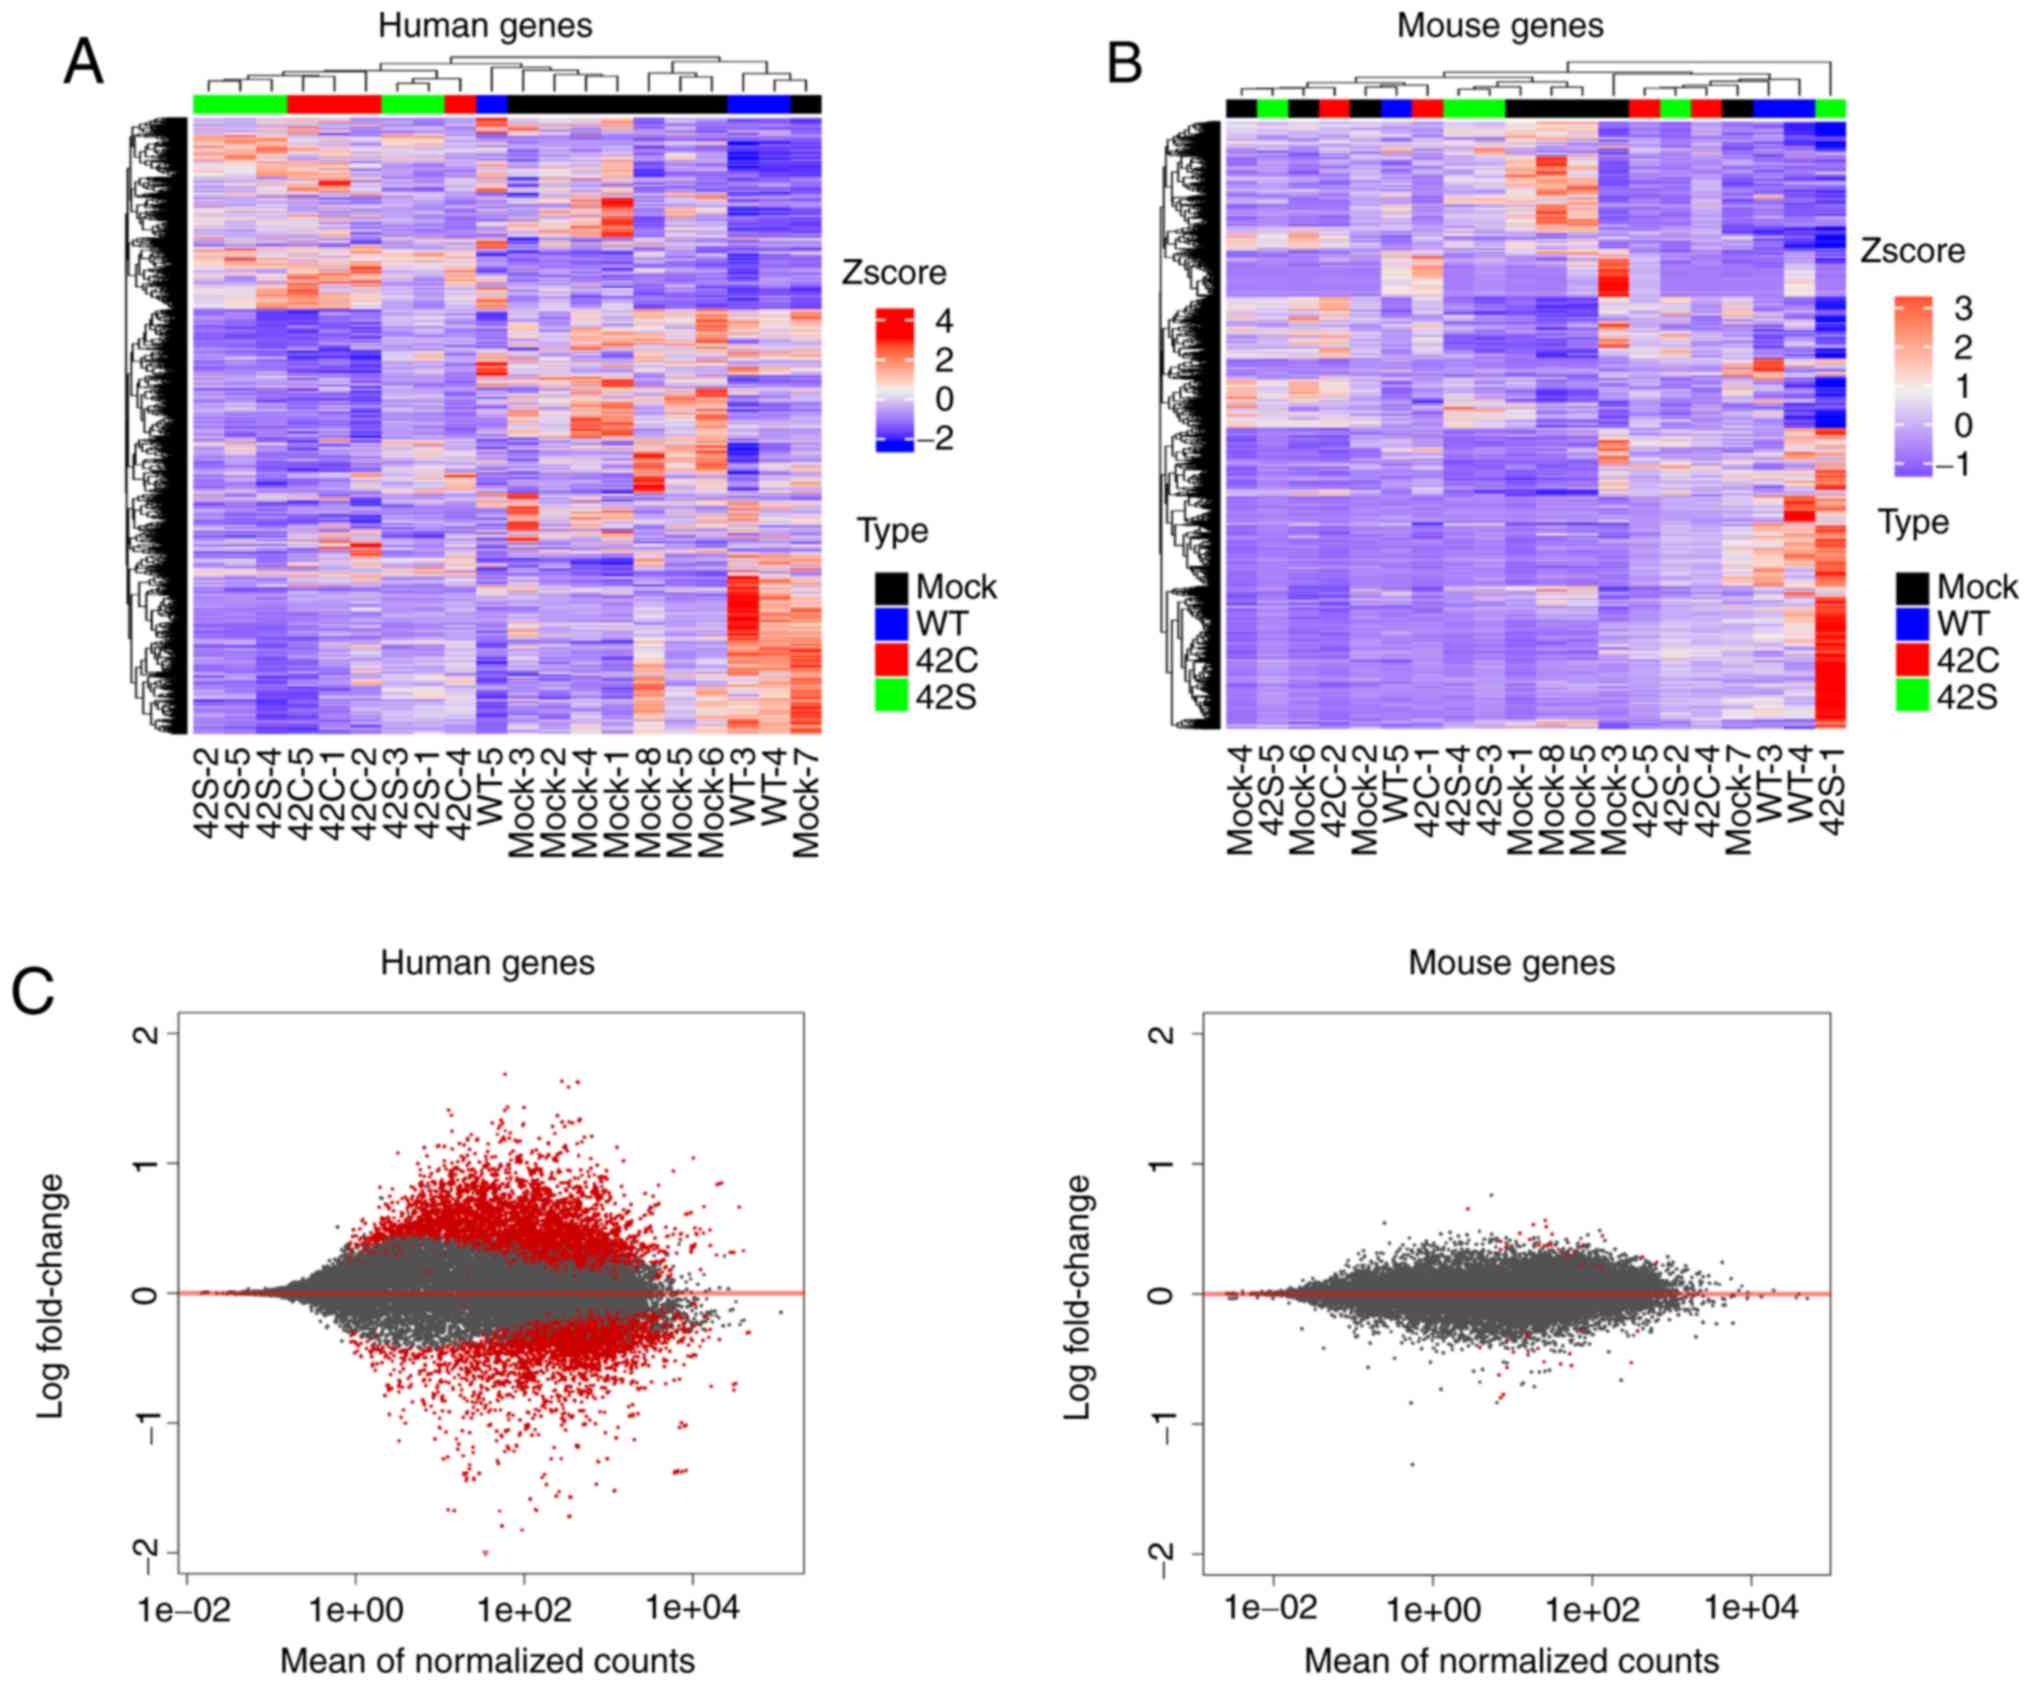 | Figure 2.Transcriptome analysis of orthotopic
inoculated tumors. Hierarchical clustering of the differentially
expressed human genes (A) and mouse genes (B) across all samples is
shown vertically for genes and horizontally for the tumor samples.
Samples that are mock, wild-type (WT), Y42C, and Y42S are indicated
in black, blue, red, and green, respectively. In the matrix table,
red indicates high expression and blue indicates low expression
profiles. (C) MA plots of altered gene expression between the
Y42C/Y42S group and mock/WT group in human genes (tumor, left
panel) and mouse genes (stroma, right panel). Each dot represents a
transcript. The x-axis shows normalized counts and the y-axis shows
the expressional change in log scale. Transcripts with an adjusted
P-value <0.1 are shown in red. |
To understand the state of tumor cells in mutant and
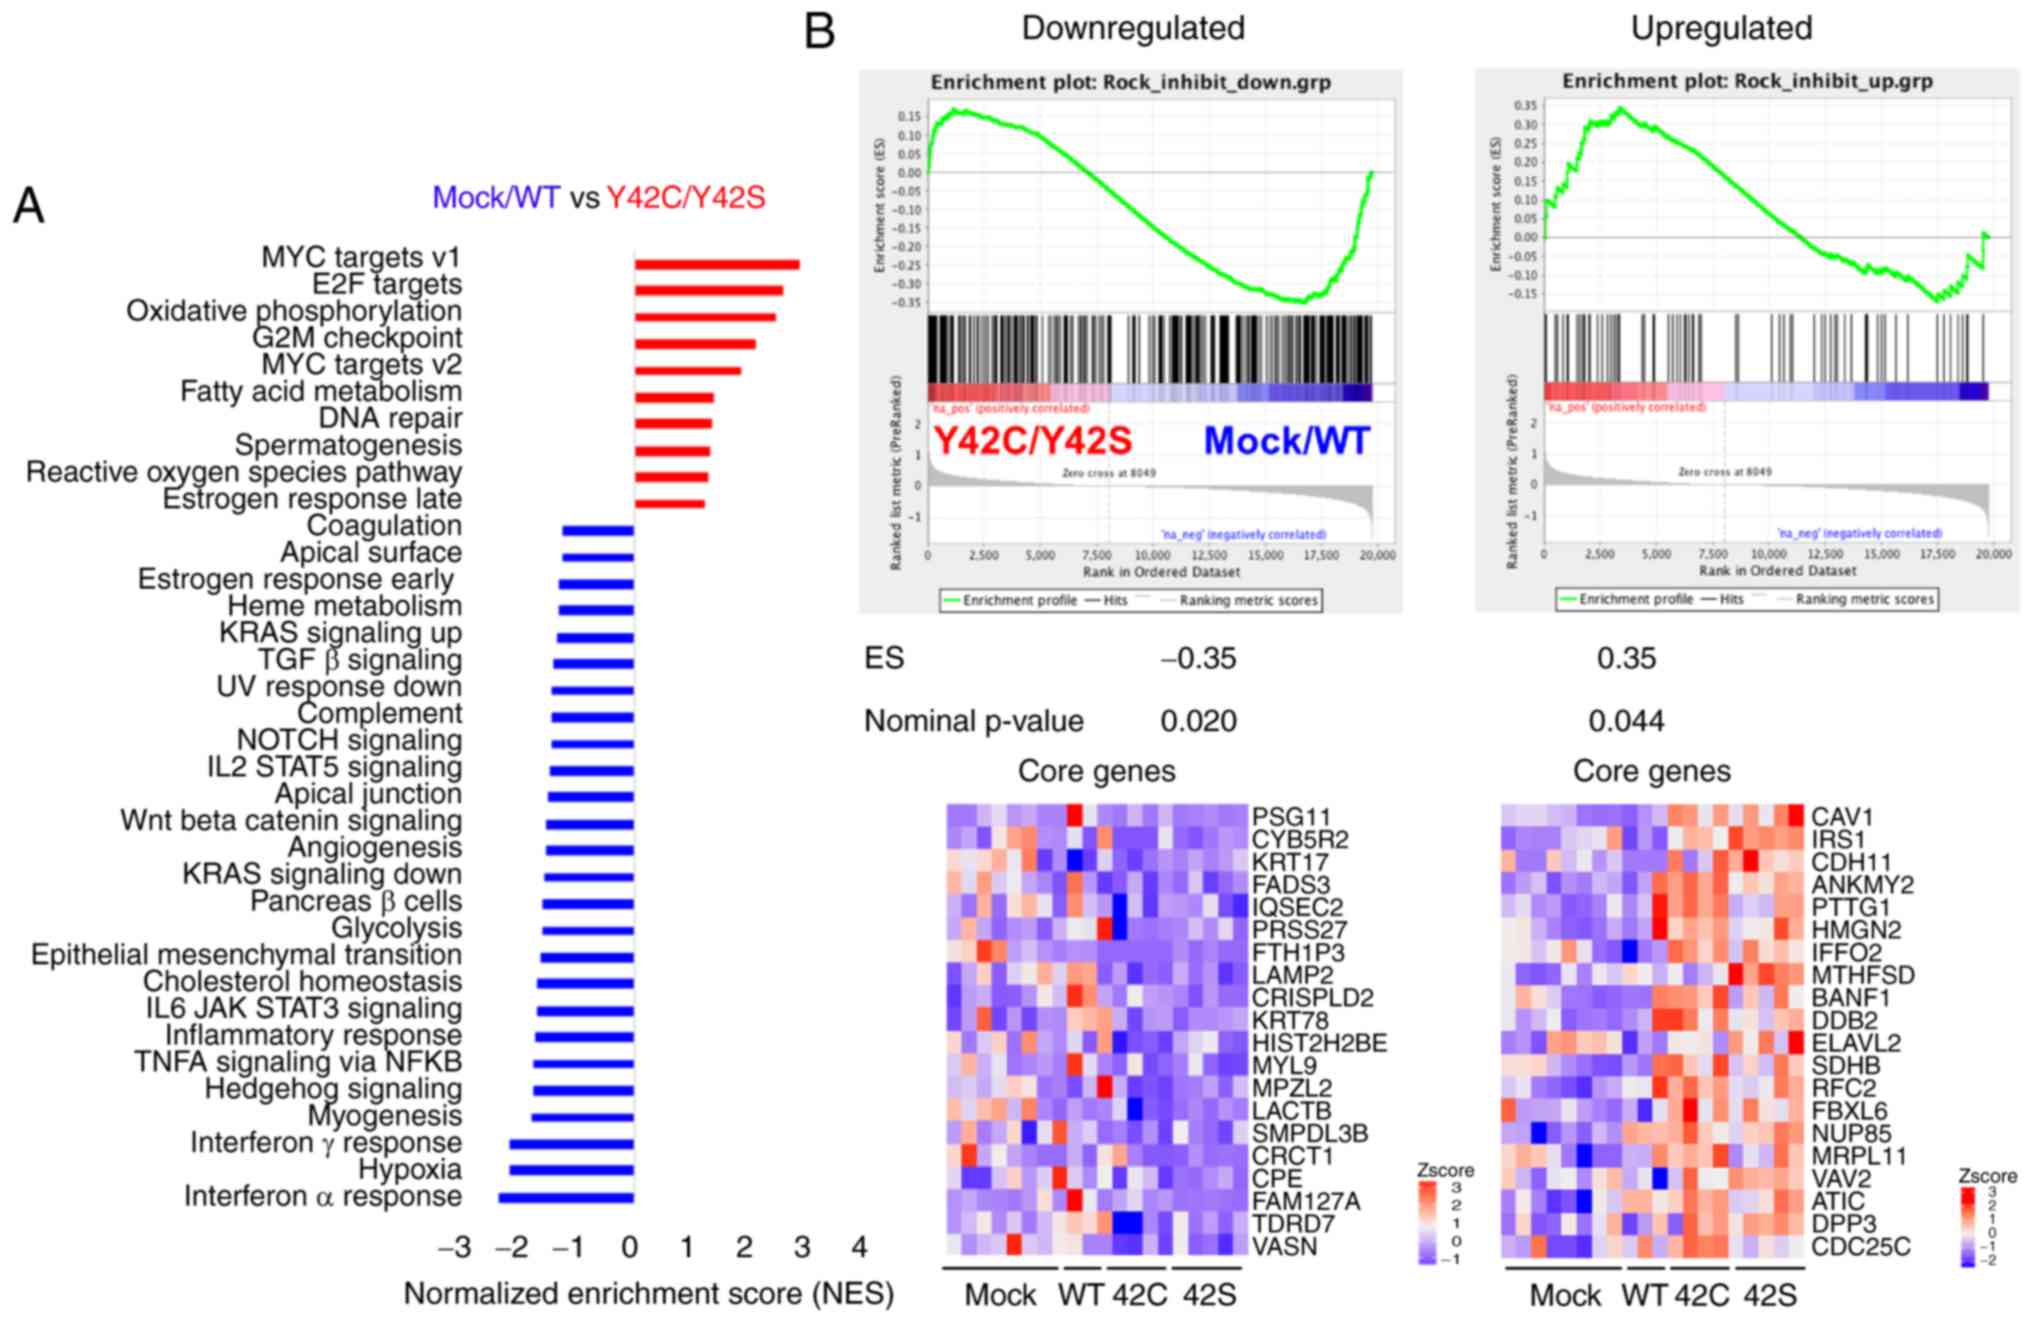
non-mutant groups, we performed GSEA (25,26).
Pathways related to hypoxia and inflammation such as interferon
α/γ, TNFα, IL6_JAK_STAT3, and to inflammatory response were
enriched in the mock/WT group (Figs.
3A and S2A). On the other hand,
Myc, E2F, oxidative phosphorylation, and G2M checkpoint pathways,
which are related to cell cycle or cell metabolism, were enriched
in the Y42C/Y42S group (Figs. 3A and
S2B). In addition, we confirmed the
ROCK signaling status in the tumor cells. To evaluate the
activation status of ROCK signaling, we performed a GSEA analysis
with a ROCK inhibitor-related gene set, which was selected from
published data (Table SIIA and B)
(27). As a result, genes
downregulated after ROCK inhibitor treatment were significantly
enriched in the mock/WT group, whereas the upregulated genes were
enriched in the Y42C/Y42S group (Figs.
3B and S3). These results
indicated that ROCK signaling was inhibited in RHOA mutants
in vivo as well as in vitro.
Mutated RHOA contributes to a pattern
of small tumor nest growth, and to changes in stromal cells
In the orthotopic model, the size of the tumor
cannot be compared accurately because the size is affected by the
area of inoculation. Because of this we compared the expression of
Ki-67 but found that there was no difference between the WT group
and mutant groups. Thus, we conducted a detailed histopathological
analysis and compared the morphologic features of the tumor with
the RNA expression profiles. Morphologically, mock and WT tumors
consisted mainly of large tumor nests, but in contrast, the mutant
tumors consisted mainly of small tumor nests that were
circumscribed by fine collagen fibers (Fig. 4A and B). This was further confirmed by
morphometric analysis of the area for each type of tumor nest. The
ratio of small tumor nest to total tumor nest area in Y42C and Y42S
was significantly higher than in mock or WT (Fig. 4C). The average ratio of small tumor
nests was 0.09 in mock, 0.17 in WT, 0.46 in Y42C, and 0.46 in Y42S.
Thus we found that the mutant tumors had a distinctly different
growth pattern compared to the mock or WT tumors.
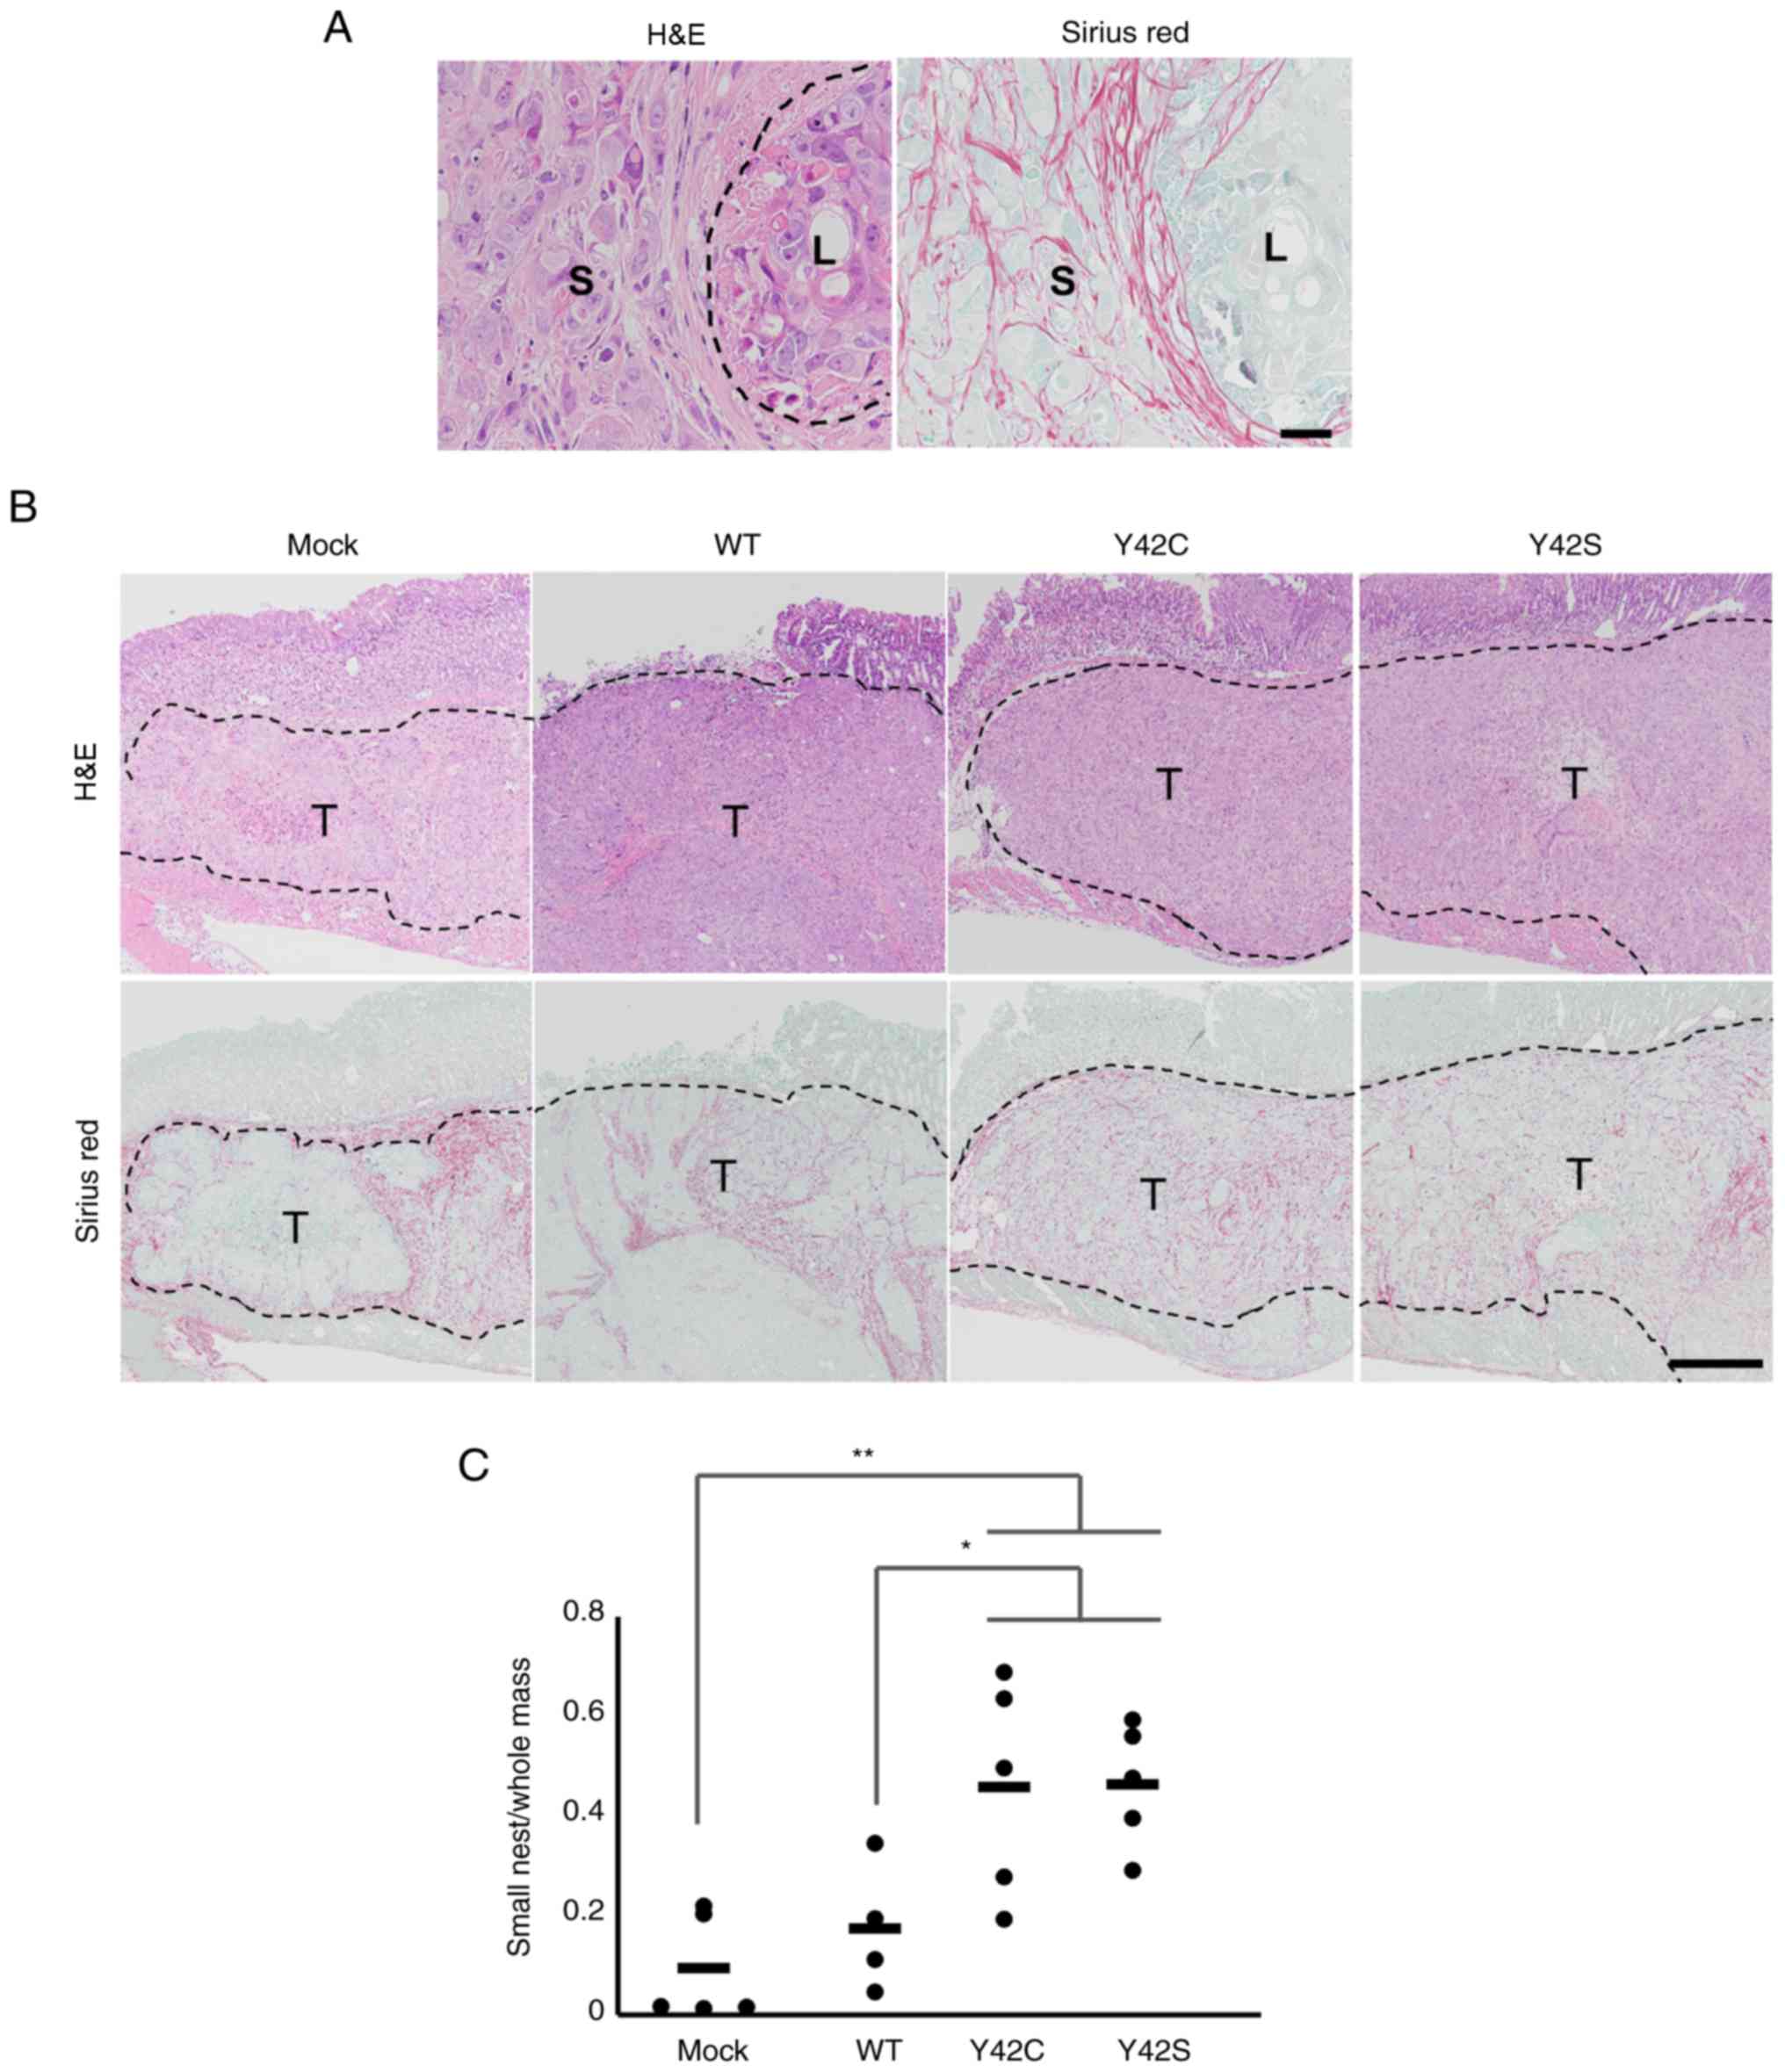 | Figure 4.Histopathological evaluation of the
formation of small tumor nests. (A) Representative images of small
(S) and large (L) tumor nest areas. H&E, hematoxylin and eosin
stain (left), and Sirius red stain (right). Scale bar, 100 µm. (B)
Representative images of the tissue sections in mock, WT and
RHOA mutants. The tumor nests are circumscribed by collagen
fibers. T, tumor area. Scale bar, 1 mm. H&E, hematoxylin and
eosin stain (upper row), and Sirius red stain (bottom row). (C) The
ratio of small tumor nest area to total tumor area. Each dot
represents the ratio in a tumor tissue section from 1 animal. The
bars show the average for each group. *P<0.05, **P<0.01,
one-way analysis of variance followed by a Dunnett's test. WT,
wild-type; RHOA, Ras homolog family member A. |
We speculated that the difference in the amount of
small tumor nests was related to a difference in tumor-stromal
interaction, and because the hypoxia signature was enriched in
mock/WT but not in RHOA mutants, we focused on tumor
angiogenesis.
In order to determine the involvement of
angiogenesis, we evaluated the number of CD31-positive blood
vessels by immunohistochemical analysis (Fig. 5A) and found that there were higher
numbers in Y42C and Y42S than that in the mock and WT. The average
scores for the number of blood vessels per site were 1.8 in Y42C,
2.6 in Y42S, 0.8 in mock, and 1.0 in WT. Tumor angiogenesis is
reported to be induced by tumor associated macrophages (30,31), thus
next we evaluated macrophage (Mφ) infiltration into tumors by
immunohistochemical analysis of F4/80 (Fig. 5B). We found that in the mock and WT
tumors, the positive cells tended to be located around the tumor
mass, but in mutant tumors, the macrophages tended to diffusely
infiltrate the tumor mass. This was further confirmed by scoring of
the positive cells infiltrating into the tumor mass. The average
scores of macrophage infiltration into the tumor mass were 2.4 in
Y42C and 2.6 in Y42S, which were higher than those in the mock
(0.4) and WT (1.0) tumors. These results indicated that RHOA
mutations contributed to tumor angiogenesis and the infiltration of
macrophages.
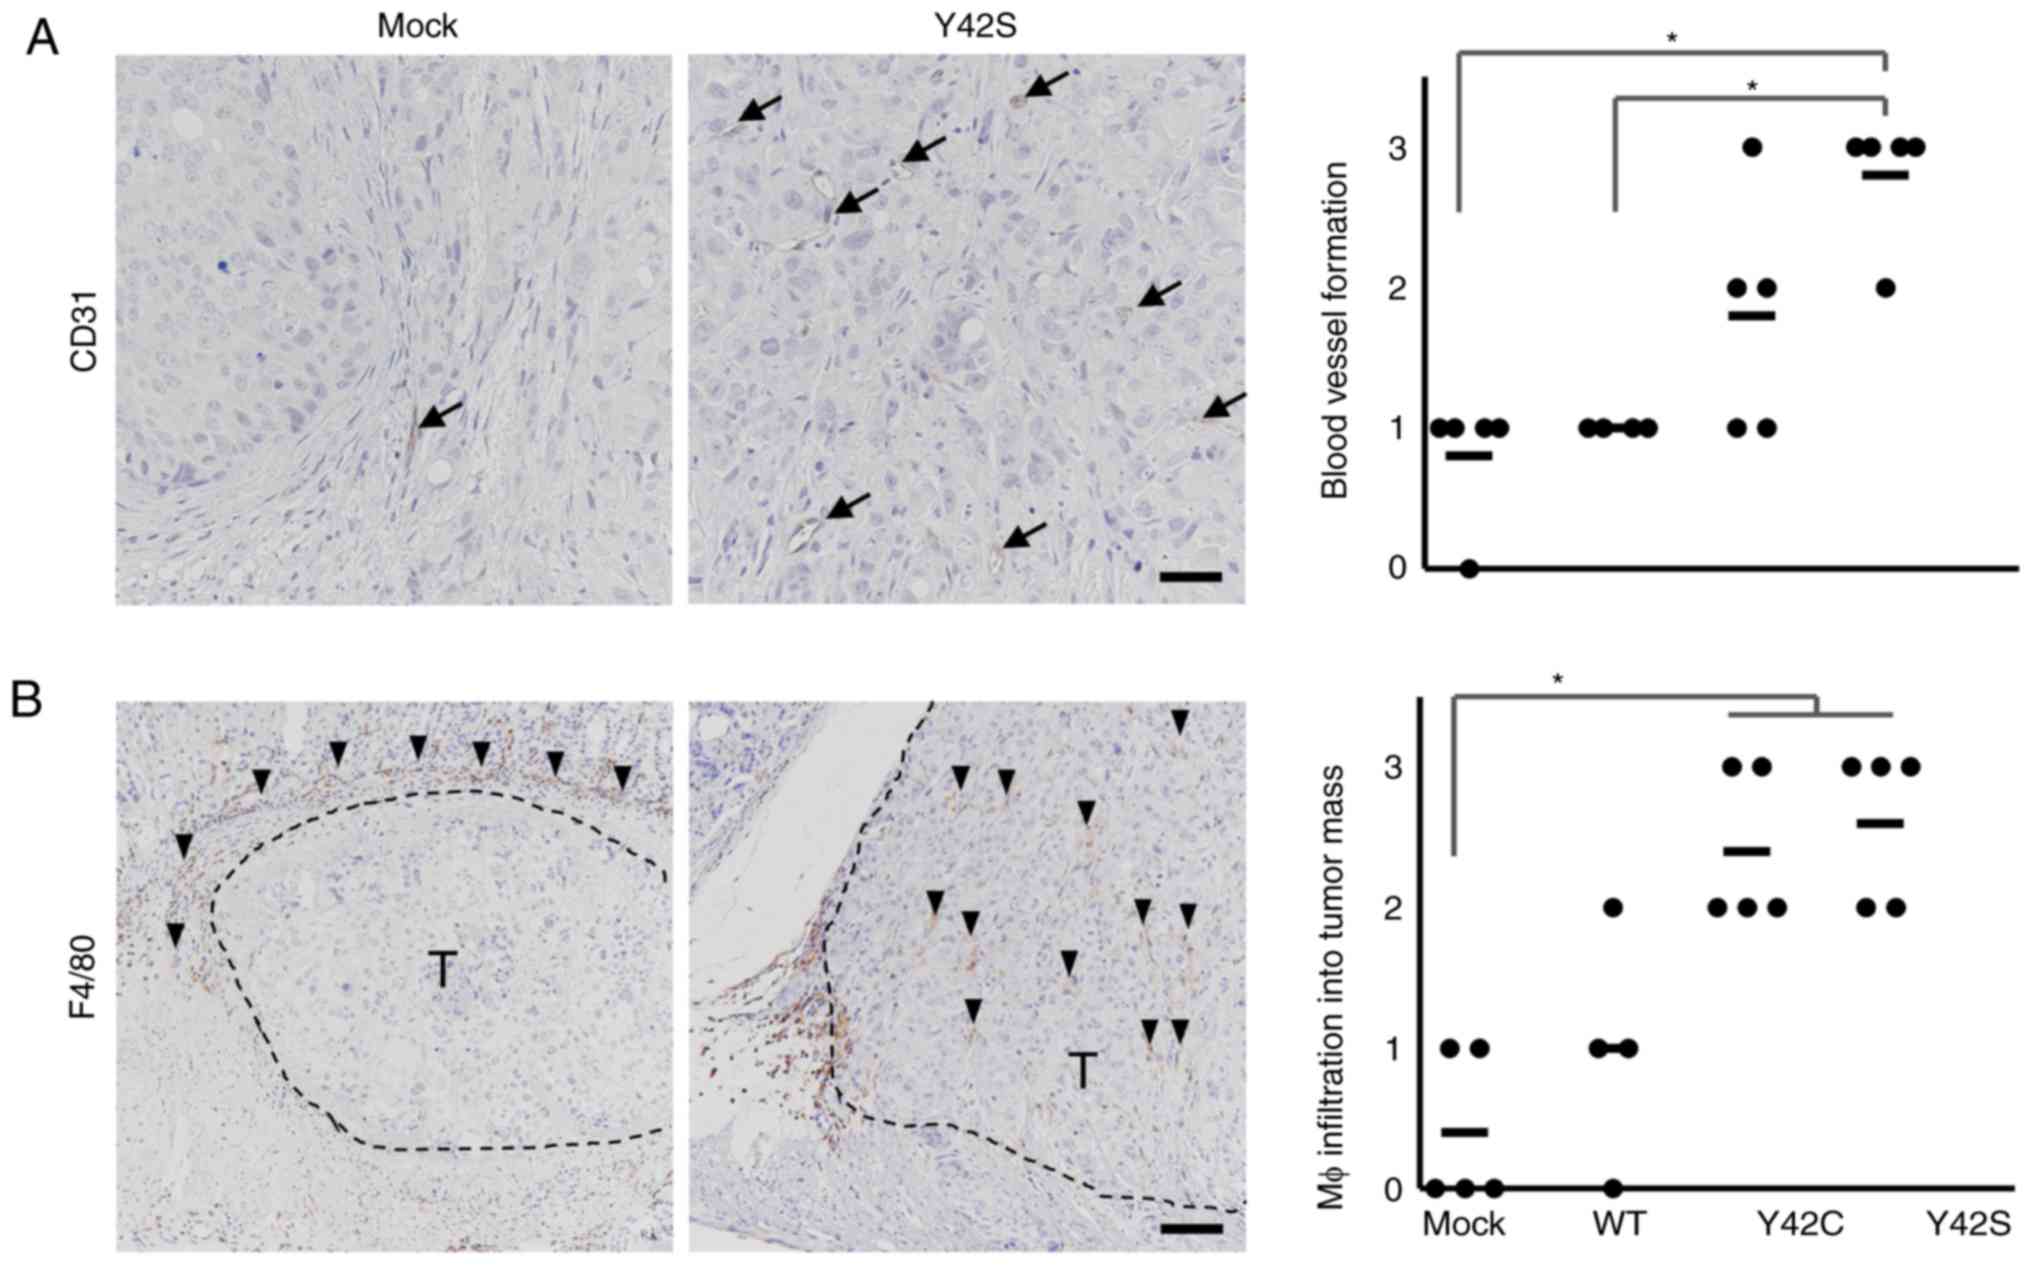 | Figure 5.Immunohistochemical analysis of
stromal components. Representative images of immunohistochemical
staining for endothelial cells (A, CD31, arrows; scale bar, 100 µm)
and macrophages (Mφ) (B, F4/80, arrowheads; scale bar, 200 µm) are
shown. T, tumor area. Scoring criteria for CD31 (×20
magnification): 0, not observed; 1, >0–6 per site; 2, >6–9
per site; 3, 10 or more per site. Scoring criteria for F4/80: 0,
not observed; 1, scattered; 2, diffuse; 3, focally dense. In the
corresponding histology scores, each dot stands for the score in a
tumor tissue section from 1 animal. The bars show the average for
each group. *P<0.05, difference between mutant group and control
group was assessed with nonparametric Steel's test. WT,
wild-type. |
Reduced host reaction in the invasive
front of RHOA mutant tumors
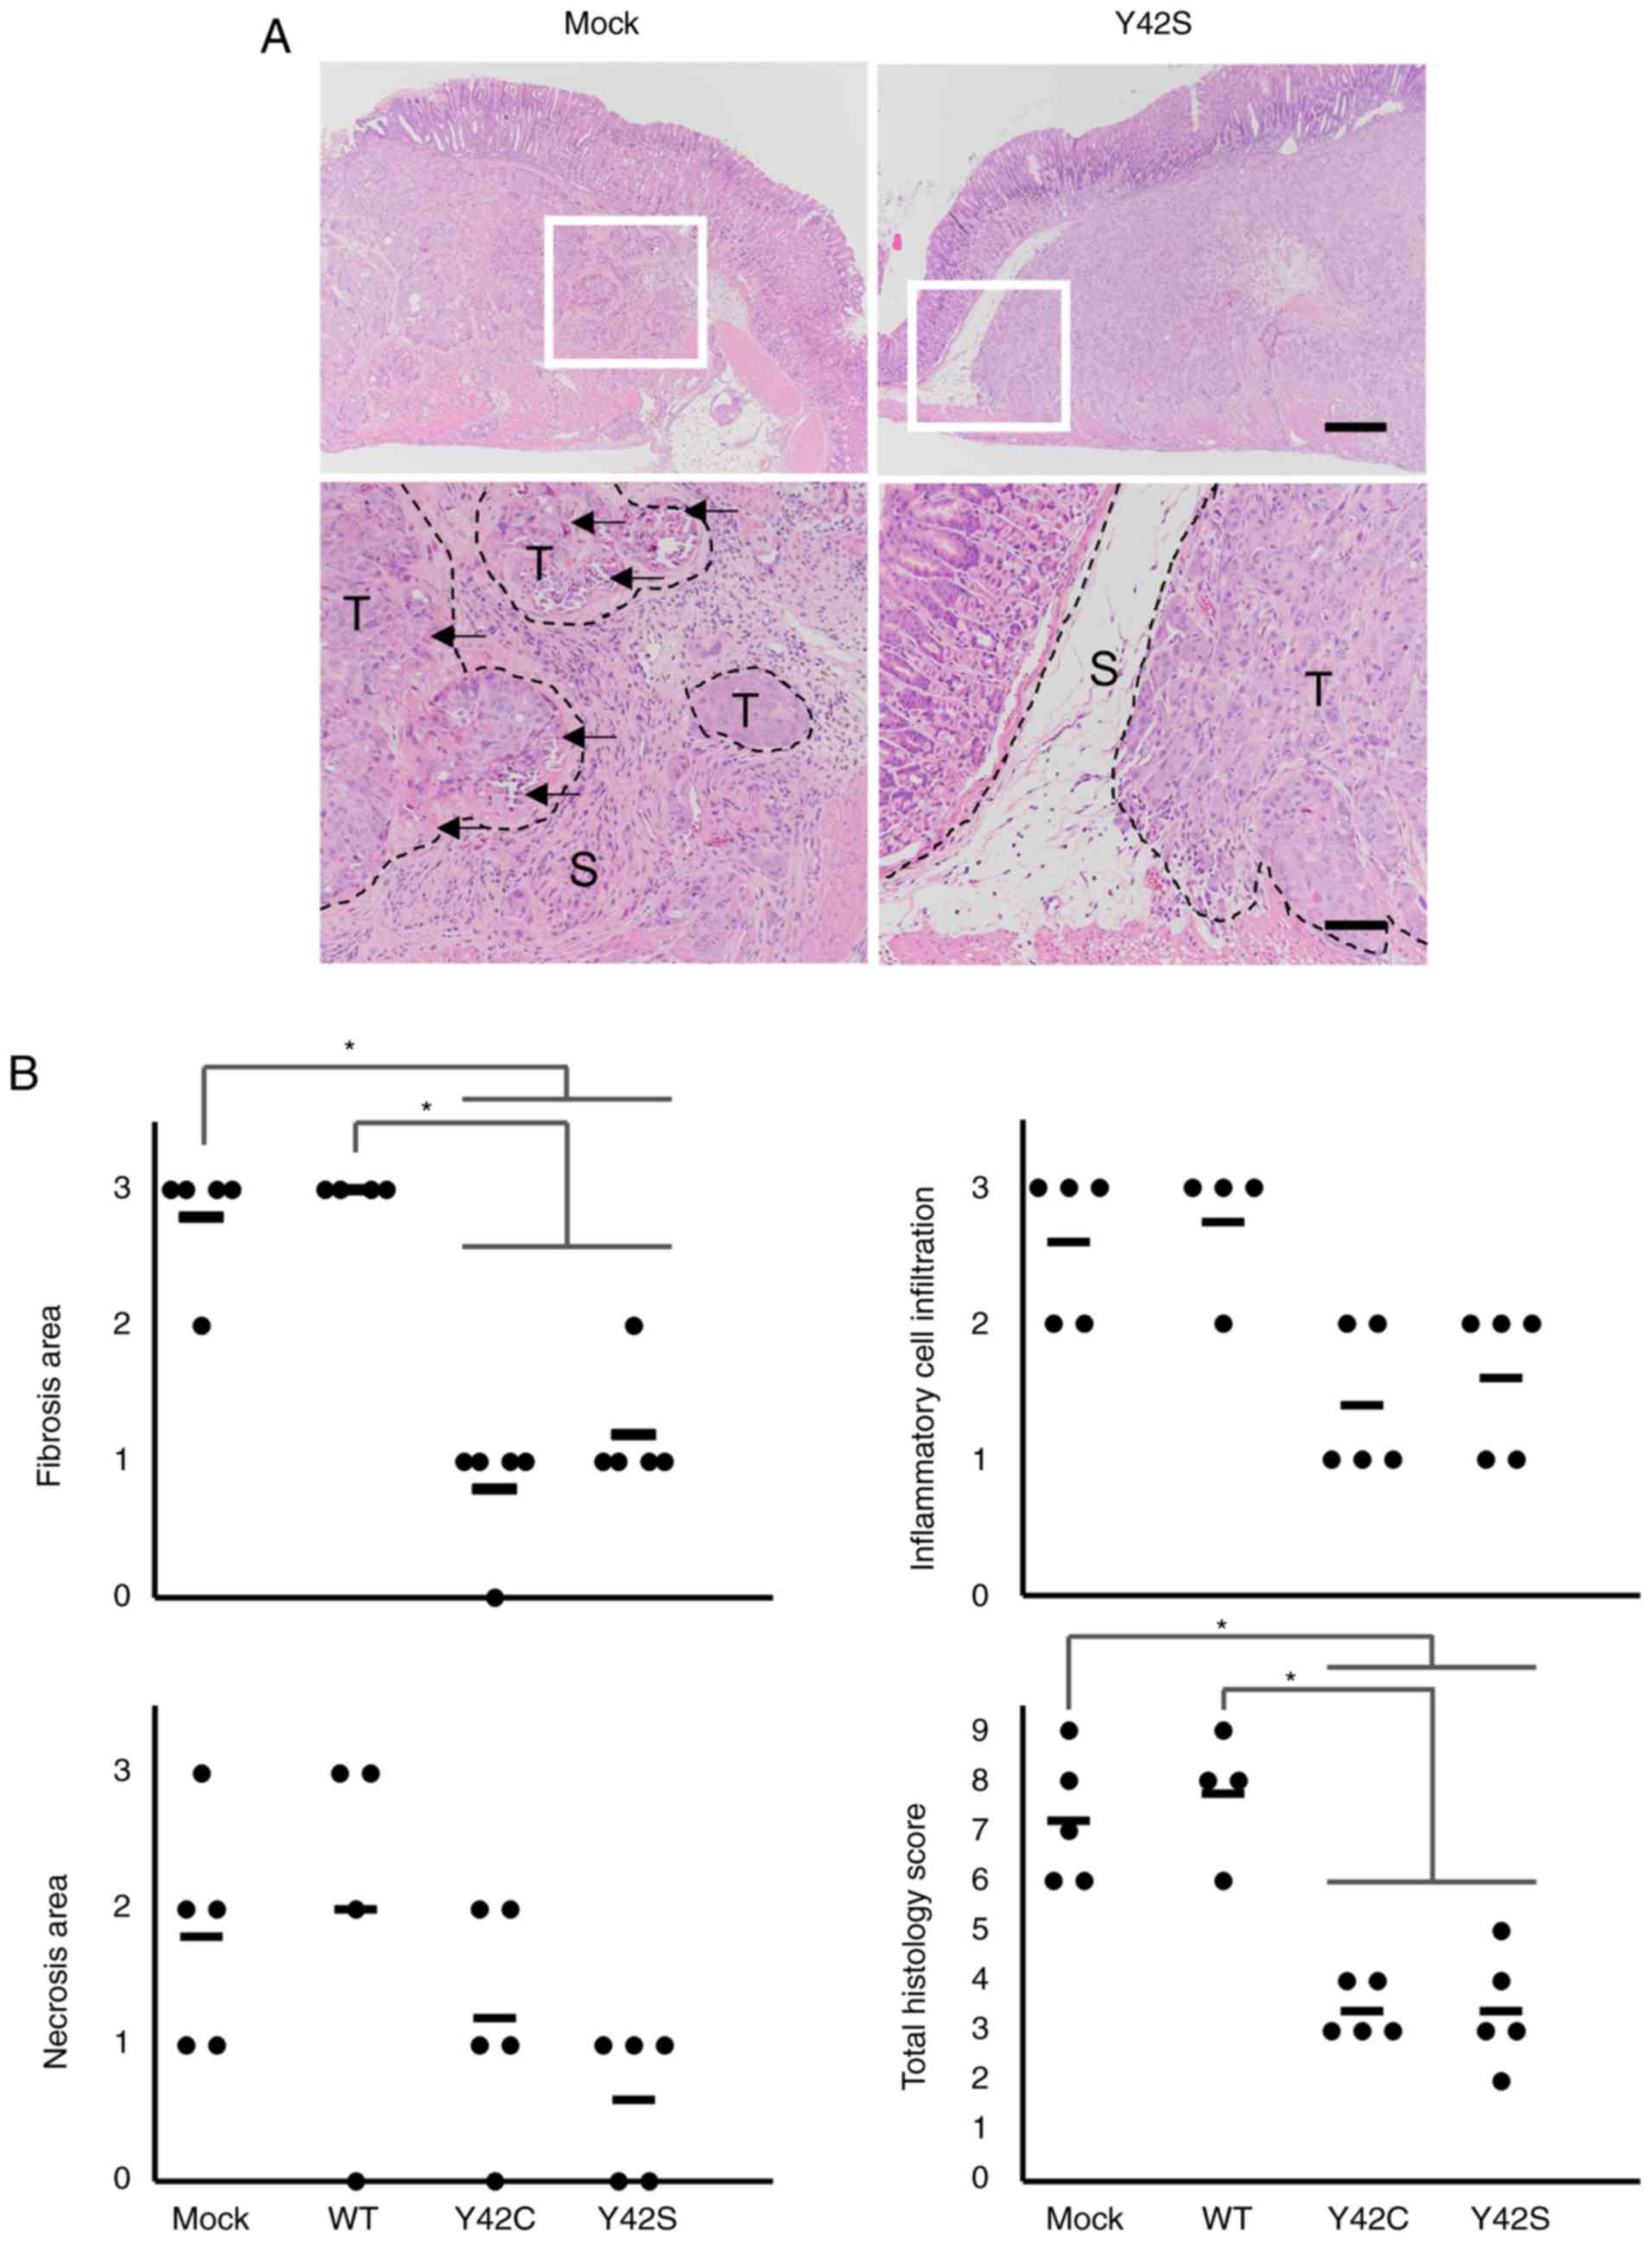
Next we focused on the invasive front of the tumor
mass (Fig. 6A). In the invasive front
of the mock and WT tumors, there was a desmoplastic reaction or
fibrosis accompanied by inflammatory cell infiltration. Along with
these findings, necrosis of tumor cells was increased. In contrast,
the host reaction was notably weaker in the mutant tumors. To
further clarify the difference in host reaction, the findings were
scored and statistically analyzed. We found that the total
histology scores in the Y42C and Y42S tumors were significantly
lower than scores in the mock/WT tumors (Fig. 6B). The average total histology score
of each group was 3.4 in Y42C, 3.4 in Y42S, 7.2 in mock, and 7.8 in
WT. These results indicate that RHOA-mutant cancer cells
have the ability to invade the surrounding tissue without causing a
strong antitumor reaction.
Discussion
In the present study, we revealed the transcriptome
and histological changes that occurred when RHOA mutations
were introduced into MKN74 cells. Tumors in the RHOA mutant
groups were composed mainly of small tumor nests compared to those
in the non-mutant groups. A distinct feature of clinical DGC is
that tumor cells exist within the stroma as single cells or small
cell clusters. Our current results suggest that RHOA
mutations at least in part contribute to this poorly cohesive
growth pattern, although as non-mutated clinical DGC also exhibits
this feature, there may be other factors involved.
Another notable morphological finding in the present
study was that, in contrast to mock and WT tumors,
RHOA-mutated tumors had little host reaction in the invasive
front of the tumor. We previously reported that in clinical DGC,
RHOA-mutated tumors showed an intramucosal permeative growth
pattern in the mucosa, which is characterized by infiltration of
tumor nests between the normal pits or glands with no recognizable
margin, indicating that there is little stromal reaction against
the tumor. This contrasted with the expansive pattern of
destructive invasion and a relatively well-defined margin seen in
non-mutated tumors (7). The lack of
host reaction in the RHOA-mutant tumors of the present study
was thought to reflect the distinctive growth pattern found in the
mucosa of clinical RHOA-mutated DGC. Together with the
effects on the size of the tumor nests, our results suggest that
RHOA mutations are likely to have a direct role in the
development of the morphology that is distinctive of clinical
DGC.
Since the hypoxic signature in mock/WT tumors was
more enriched than that noted in the mutant tumors, we considered
the involvement of angiogenesis and found that the RHOA
mutants had higher levels of blood vessel formation and
infiltration of macrophages into the tumor mass. Angiogenesis is
closely related to infiltration of macrophages (32–34).
Additionally, Yin et al reported that a high density of
macrophages was correlated with DGC (35). Therefore, these results suggest that
RHOA mutants affect tumor angiogenesis induced by
macrophages in the tumor mass, and that the tumor microenvironment
may be closely related to the growth pattern of DGC.
In our previous in vitro study, we found that
mutant RHOA inhibited ROCK signaling in a dominant negative
manner, which caused the actin cytoskeleton to become loose and led
to a change in cell-cell interactions (10). Such changes may be related to the
growth pattern of small nests in vivo. ROCK inhibition is
also known to be related to anoikis resistance (36), which may have a role in the
maintenance of the small nest pattern. The lack of strong host
reaction in the RHOA-mutated tumors may also be related to
these mechanisms; however, since much is still unknown, further
studies are necessary to elucidate the molecular mechanism of the
features in vivo.
The dramatic difference in host reaction between
RHOA mutants and mock/WT suggests that RHOA mutations
affect cells such as fibroblasts, endothelial cells, and immune
cells in mouse stroma. However, the level of expressional change in
the stroma was much lower than that in the tumor (Fig. 2C), and the mouse expression profiles
did not reveal any difference between RHOA mutants and
mock/WT tumors. This discrepancy between the histopathology results
and the RNA expression profile may have occurred because we
evaluated the expression in the whole tumor tissue. As there are
several cell components in the tissue surrounding the tumor mass,
local changes such as those at the invasion front were thought to
be difficult to discriminate. To overcome this issue, we are trying
to profile the expression at the single cell level instead of in
bulk. Since several reports show detailed cross-talk between tumor
and components of the tumor microenvironment (37–39), we
anticipate that single cell RNA sequencing will more precisely
reveal the interaction between the tumor and its microenvironment
and the molecular mechanisms involved.
In summary, our results from an orthotopic model in
the stomach have provided the first direct evidence concerning the
effects of mutated RHOA in vivo. Since the features of this
xenograft model allow insights into the biology in human clinical
cancer, these results will accelerate the understanding of how
RHOA mutations contribute to the disease biology of DGC and
may promote the development of future therapeutic strategies.
Supplementary Material
Supporting Data
Acknowledgements
The authors would like to thank Mr. R. Nakamura, Ms.
M. Kinoshita and Mr. T. Saito from Chugai Research Institute for
Medical Science Co., Ltd. (Kanagawa, Japan) and Dr J. Shinozuka
from Chugai Pharmaceutical Co., Ltd. (Kanagawa, Japan) for the
excellent technical assistance in the in vivo
experiments.
Funding
The present study was partly supported by the
Practical Research for Innovative Cancer Control program from the
Japan Agency for Medical Research and Development (AMED
17ck0106359h0001) (to HA and SI).
Availability of data and materials
The datasets used during the present study are
available from the corresponding author on reasonable request.
Authors' contributions
TN, KN and EF designed the study. EF collected,
analyzed and interpreted the pathological data. DK collected the
data and performed data analysis. YK, CI and MM performed the in
vivo experiments. TN, KN and EF drafted the manuscript. HA, SI
and MS were involved in the conception of the study, supervised the
study design, and also provided advice for the interpretation of
the experimental data. All authors read and approved the final
manuscript and agree to be accountable for all aspects of the
research in ensuring that the accuracy or integrity of any part of
the work are appropriately investigated and resolved.
Ethics approval and consent to
participate
All animal experiments were performed at Chugai
Pharmaceutical Co., Ltd. The experiments were reviewed and approved
by the Chugai Pharmaceutical Co., Ltd., Institutional Animal Care
and Use Committee.
Patient consent for publication
Not applicable.
Competing interests
TN, KN, EF and MS are employees of Forerunner Pharma
Research Co., Ltd. EF and MS are also employees of Chugai
Pharmaceutical Co., Ltd.
References
|
1
|
Ma J, Shen H, Kapesa L and Zeng S: Lauren
classification and individualized chemotherapy in gastric cancer.
Oncol Lett. 11:2959–2964. 2016. View Article : Google Scholar : PubMed/NCBI
|
|
2
|
Chen YC, Fang WL, Wang RF, Liu CA, Yang
MH, Lo SS, Wu CW, Li AF, Shyr YM and Huang KH: Clinicopathological
variation of lauren classification in gastric cancer. Pathol Oncol
Res. 22:197–202. 2016. View Article : Google Scholar : PubMed/NCBI
|
|
3
|
Chiaravalli AM, Klersy C, Vanoli A,
Ferretti A, Capella C and Solcia E: Histotype-based prognostic
classification of gastric cancer. World J Gastroenterol.
18:896–904. 2012. View Article : Google Scholar : PubMed/NCBI
|
|
4
|
Kakiuchi M, Nishizawa T, Ueda H, Gotoh K,
Tanaka A, Hayashi A, Yamamoto S, Tatsuno K, Katoh H, Watanabe Y, et
al: Recurrent gain-of-function mutations of RHOA in diffuse-type
gastric carcinoma. Nat Genet. 46:583–587. 2014. View Article : Google Scholar : PubMed/NCBI
|
|
5
|
Wang K, Yuen ST, Xu J, Lee SP, Yan HH, Shi
ST, Siu HC, Deng S, Chu KM, Law S, et al: Whole-genome sequencing
and comprehensive molecular profiling identify new driver mutations
in gastric cancer. Nat Genet. 46:573–582. 2014. View Article : Google Scholar : PubMed/NCBI
|
|
6
|
Cancer Genome Atlas Research Network, .
Comprehensive molecular characterization of gastric adenocarcinoma.
Nature. 513:202–209. 2014. View Article : Google Scholar : PubMed/NCBI
|
|
7
|
Ushiku T, Ishikawa S, Kakiuchi M, Tanaka
A, Katoh H, Aburatani H, Lauwers GY and Fukayama M: RHOA mutation
in diffuse-type gastric cancer: A comparative clinicopathology
analysis of 87 cases. Gastric Cancer. 19:403–411. 2016. View Article : Google Scholar : PubMed/NCBI
|
|
8
|
Stankiewicz TR and Linseman DA: Rho family
GTPases: Key players in neuronal development, neuronal survival,
and neurodegeneration. Front Cell Neurosci. 8:3142014. View Article : Google Scholar : PubMed/NCBI
|
|
9
|
Jaffe AB and Hall A: Rho GTPases:
Biochemistry and biology. Annu Rev Cell Dev Biol. 21:247–269. 2005.
View Article : Google Scholar : PubMed/NCBI
|
|
10
|
Nishizawa T, Nakano K, Harada A, Kakiuchi
M, Funahashi SI, Suzuki M, Ishikawa S and Aburatani H: DGC-specific
RHOA mutations maintained cancer cell survival and promoted cell
migration via ROCK inactivation. Oncotarget. 9:23198–23207. 2018.
View Article : Google Scholar : PubMed/NCBI
|
|
11
|
Céspedes MV, Casanova I, Parreño M and
Mangues R: Mouse models in oncogenesis and cancer therapy. Clin
Transl Oncol. 8:318–329. 2006. View Article : Google Scholar : PubMed/NCBI
|
|
12
|
Bibby MC: Orthotopic models of cancer for
preclinical drug evaluation: Advantages and disadvantages. Eur J
Cancer. 40:852–857. 2004. View Article : Google Scholar : PubMed/NCBI
|
|
13
|
Killion JJ, Radinsky R and Fidler IJ:
Orthotopic models are necessary to predict therapy of
transplantable tumors in mice. Cancer Metastasis Rev. 17:279–284.
1999. View Article : Google Scholar
|
|
14
|
Nakano K, Nishizawa T, Komura D, Fujii E,
Monnai M, Kato A, Funahashi SI, Ishikawa S and Suzuki M: Difference
in morphology and interactome profiles between orthotopic and
subcutaneous gastric cancer xenograft models. J Toxicol Pathol.
31:293–300. 2018. View Article : Google Scholar : PubMed/NCBI
|
|
15
|
Junttila MR and de Sauvage FJ: Influence
of tumour micro- environment heterogeneity on therapeutic response.
Nature. 501:346–354. 2013. View Article : Google Scholar : PubMed/NCBI
|
|
16
|
Makalowski W, Zhang J and Boguski MS:
Comparative analysis of 1196 orthologous mouse and human
full-length mRNA and protein sequences. Genome Res. 6:846–857.
1996. View Article : Google Scholar : PubMed/NCBI
|
|
17
|
Bainer R, Frankenberger C, Rabe D, An G,
Gilad Y and Rosner MR: Gene expression in local stroma reflects
breast tumor states and predicts patient outcome. Sci Rep.
6:392402016. View Article : Google Scholar : PubMed/NCBI
|
|
18
|
Komura D, Isagawa T, Kishi K, Suzuki R,
Sato R, Tanaka M, Katoh H, Yamamoto S, Tatsuno K, Fukayama M, et
al: CASTIN: A system for comprehensive analysis of cancer-stromal
interactome. BMC Genomics. 17:8992016. View Article : Google Scholar : PubMed/NCBI
|
|
19
|
Motoyama T, Hojo H and Watanabe H:
Comparison of seven cell lines derived from human gastric
carcinomas. Acta Pathol Jpn. 36:65–83. 1986.PubMed/NCBI
|
|
20
|
Busuttil RA, Liu DS, Di Costanzo N,
Schröder J, Mitchell C and Boussioutas A: An orthotopic mouse model
of gastric cancer invasion and metastasis. Sci Rep. 8:8252018.
View Article : Google Scholar : PubMed/NCBI
|
|
21
|
Yanagihara K, Takigahira M, Tanaka H,
Komatsu T, Fukumoto H, Koizumi F, Nishio K, Ochiya T, Ino Y and
Hirohashi S: Development and biological analysis of peritoneal
metastasis mouse models for human scirrhous stomach cancer. Cancer
Sci. 96:323–332. 2005. View Article : Google Scholar : PubMed/NCBI
|
|
22
|
Gu Z, Eils R and Schlesner M: Complex
heatmaps reveal patterns and correlations in multidimensional
genomic data. Bioinformatics. 32:2847–2849. 2016. View Article : Google Scholar : PubMed/NCBI
|
|
23
|
Langmead B, Trapnell C, Pop M and Salzberg
SL: Ultrafast and memory-efficient alignment of short DNA sequences
to the human genome. Genome Biol. 10:R252009. View Article : Google Scholar : PubMed/NCBI
|
|
24
|
Love MI, Huber W and Anders S: Moderated
estimation of fold change and dispersion for RNA-seq data with
DESeq2. Genome Biol. 15:5502014. View Article : Google Scholar : PubMed/NCBI
|
|
25
|
Subramanian A, Tamayo P, Mootha VK,
Mukherjee S, Ebert BL, Gillette MA, Paulovich A, Pomeroy SL, Golub
TR, Lander ES and Mesirov JP: Gene set enrichment analysis: A
knowledge-based approach for interpreting genome-wide expression
profiles. Proc Natl Acad Sci USA. 102:15545–15550. 2005. View Article : Google Scholar : PubMed/NCBI
|
|
26
|
Mootha VK, Lindgren CM, Eriksson KF,
Subramanian A, Sihag S, Lehar J, Puigserver P, Carlsson E,
Ridderstråle M, Laurila E, et al: PGC-1alpha-responsive genes
involved in oxidative phosphorylation are coordinately
downregulated in human diabetes. Nat Genet. 34:267–273. 2003.
View Article : Google Scholar : PubMed/NCBI
|
|
27
|
Chapman S, McDermott DH, Shen K, Jang MK
and McBride AA: The effect of Rho kinase inhibition on long-term
keratinocyte proliferation is rapid and conditional. Stem Cell Res
Ther. 5:602014. View Article : Google Scholar : PubMed/NCBI
|
|
28
|
Suzuki M, Katsuyama K, Adachi K, Ogawa Y,
Yorozu K, Fujii E, Misawa Y and Sugimoto T: Combination of fixation
using PLP fixative and embedding in paraffin by the AMeX method is
useful for histochemical studies in assessment of immunotoxicity. J
Toxicol Sci. 27:165–172. 2002. View Article : Google Scholar : PubMed/NCBI
|
|
29
|
Sato Y, Mukai K, Watanabe S, Goto M and
Shimosato Y: The AMeX method. A simplified technique of tissue
processing and paraffin embedding with improved preservation of
antigens for immunostaining. Am J Pathol. 125:431–435.
1986.PubMed/NCBI
|
|
30
|
Corliss BA, Azimi MS, Munson JM, Peirce SM
and Murfee WL: Macrophages: An inflammatory link between
angiogenesis and lymphangiogenesis. Microcirculation. 23:95–121.
2016. View Article : Google Scholar : PubMed/NCBI
|
|
31
|
Squadrito ML and De Palma M: Macrophage
regulation of tumor angiogenesis: Implications for cancer therapy.
Mol Aspects Med. 32:123–145. 2011. View Article : Google Scholar : PubMed/NCBI
|
|
32
|
Madeddu C, Gramignano G, Kotsonis P, Coghe
F, Atzeni V, Scartozzi M and Macciò A: Microenvironmental M1
tumor-associated macrophage polarization influences cancer-related
anemia in advanced ovarian cancer: Key role of interleukin-6.
Haematologica. 103:e388–e391. 2018. View Article : Google Scholar : PubMed/NCBI
|
|
33
|
Mantovani A and Allavena P: The
interaction of anticancer therapies with tumor-associated
macrophages. J Exp Med. 212:435–445. 2015. View Article : Google Scholar : PubMed/NCBI
|
|
34
|
Quatromoni JG and Eruslanov E:
Tumor-associated macrophages: Function, phenotype, and link to
prognosis in human lung cancer. Am J Transl Res. 4:376–389.
2012.PubMed/NCBI
|
|
35
|
Yin S, Huang J, Li Z, Zhang J, Luo J, Lu C
and Xu H and Xu H: The prognostic and clinicopathological
significance of tumor-associated macrophages in patients with
gastric cancer: A meta-analysis. PLoS One. 12:e01700422017.
View Article : Google Scholar : PubMed/NCBI
|
|
36
|
Ohgushi M, Matsumura M, Eiraku M, Murakami
K, Aramaki T, Nishiyama A, Muguruma K, Nakano T, Suga H, Ueno M, et
al: Molecular pathway and cell state responsible for
dissociation-induced apoptosis in human pluripotent stem cells.
Cell Stem Cell. 7:225–239. 2010. View Article : Google Scholar : PubMed/NCBI
|
|
37
|
Chung W, Eum HH, Lee HO, Lee KM, Lee HB,
Kim KT, Ryu HS, Kim S, Lee JE, Park YH, et al: Single-cell RNA-seq
enables comprehensive tumour and immune cell profiling in primary
breast cancer. Nat Commun. 8:150812017. View Article : Google Scholar : PubMed/NCBI
|
|
38
|
Azizi E, Carr AJ, Plitas G, Cornish AE,
Konopacki C, Prabhakaran S, Nainys J, Wu K, Kiseliovas V, Setty M,
et al: Single-cell map of diverse immune phenotypes in the breast
tumor microenvironment. Cell. 174:1293–1308.e36. 2018. View Article : Google Scholar : PubMed/NCBI
|
|
39
|
Lambrechts D, Wauters E, Boeckx B, Aibar
S, Nittner D, Burton O, Bassez A, Decaluwé H, Pircher A, Van den
Eynde K, et al: Phenotype molding of stromal cells in the lung
tumor microenvironment. Nat Med. 24:1277–1289. 2018. View Article : Google Scholar : PubMed/NCBI
|