Introduction
Cancer stem cells (CSCs) are characterized by the
potential to self-renew, high tumorigenicity in nude mice and the
ability to efficiently reconstitute all tumor subpopulations and
original tumor histology (1–3). CSCs are suggested to be responsible for
cancer development, as well as recurrence, disease progression,
cancer aggressiveness, metastatic spread and resistance to
chemotherapy, targeted therapies and radiotherapy. CSCs are also
expected to be more resistant to all types of therapies than
differentiated tumor cells (4,5). In renal
cell cancer (RCC), CSCs are characterized by expression of cell
surface markers including CD105 (6,7), CD44
(8), or C-X-C chemokine receptor type
4 (CXCR-4) (9), as well as high
expression of aldehyde dehydrogenase (ALDH1) (8,10). We
recently showed that CD105+ subpopulations of cells may
be found in multiple RCC cell lines, including metastatic
tumor-derived ACHN and Caki-1 cell lines cultured in
RPMI-1640/GlutaMax medium (11). High
CD105 protein expression was also found in ACHN and Caki-1 cells
cultured in DMEM-HG (12) and these
CD105+ subpopulations are likely to represent RCC-CSCs.
At the same time, sphere and colony formation assays may be used
for the functional identification of CSCs (13,14).
Although the number of CSCs is underestimated by standard
experimental methods in RCC (2), the
number of CSCs is increased in 3D culture including spheres
(15). In fact in sphere-promoting
culture conditions [serum-free, fibroblast growth factor (FGF),
epidermal growth factor (EGF) and B27-enriched DMEM medium], ACHN
cells form large 3D aggregates that fuse over time (16). The first aim of the present study was
to develop a metastatic RCC cell line-based 3D culture model
enriched in CSCs which was defined as CD105-expression promoting
conditions. Optimal media supporting the CSC phenotype in
metastatic RCC were to be selected. Extracellular matrix (ECM)
further promoting cell growth was to be incorporated in this model.
The optimized culture system (specifically selected cell line with
media and ECM type) will be therefore referred to as the biomimic
culture.
The second aim of the study was to investigate the
usefulness of metastatic RCC 3D spheroids as a platform for
effective in vitro anticancer drug screening. Our study was
triggered by the fact that recently we demonstrated that RCC-CSCs
are also potential therapeutic targets and are in fact targeted by
tyrosine kinase inhibitors (TKIs) (e.g. sunitinib) (17–19). At
the same time the first attempts to develop anticancer drugs
targeting CSCs were carried out in an acute lymphoblastic leukaemia
model (20), and subsequently in
glioblastoma multiforme (21) by
other research groups. The first group of drugs tested on CSCs,
that are not classical cytostatics, the nonsteroidal
anti-inflammatory drugs (NSAIDs), were tested in a colon cancer
model. In preliminary research it was shown that NSAIDs effectively
eliminate cancer cells from colon crypts, especially cells that
have aberrant WNT signaling and represent the stem population
(22). Moreover,
N-[3,4-dimethoxycinnamoyl]-anthranilic acid (tranilast, INN, brand
name Rizaben®; Kissei Pharmaceuticals, Japan) was tested
in a breast cancer model. It was proven that this
H1-receptor antagonist decreases the number of
mammospheres that are formed by stem cells, decreases the number of
colonies (in a colony forming assay), and decreases the expression
of surface markers and has a direct anti-proliferative effect on
CSCs (23). On the one hand,
3D/spheroid/sphere tests may provide in vitro tests with a
higher predictive value of in vivo activity. At the same
time, drug screens on 3D cultures, enriched in CSCs, can lead to
development of novel effective treatments targeted to the
elimination of these cells. Currently only a few trials are being
run with specific CSC-toxic compounds (ClinicalTrials.gov) in solid tumors. Resveratrol is
being tested in colon cancer (targeting Wnt signaling); or GDC-0449
and BMS-833923 in other tumors (targeting Hedgehog). Altogether
there are approximately 10 trials that are being conducted to
target CSCs, and only one drug is being tested in RCC. In the RCC
targeted trial, CSC Notch signaling is targeted by RO4929097
(University Health Network, Toronto, Canada; no. NCT01141569)
(24). Furthermore, TKI and mTOR
kinase inhibitor pre-clinical and clinical trials in RCC did not
include CSC analysis (25–27), as an appropriate model was not
available. Therefore, the present study was designed with an aim to
develop a new anti-RCC-CSC drug testing model and to investigate
selected drug activities to prove its utility in the evaluation of
different types of compounds (TKI, cytostatic, small-molecule). We
believe that anti-CSC targeted therapies in RCC, and other solid
tumors, represent a new direction for basic science exploration and
potential subsequent clinical investigation in order to provide
effective, advanced cancer care (28). We also believe that sunitinib is a
benchmark TKI compound that may be used for drug testing model
validation, as its activity has clearly been described in clinical
trials, as well as in molecular reports. Sunitinib (SU11248) is a
multi-targeted inhibitor of tyrosine kinases including vascular
endothelial growth factor receptor (VEGFR)1, VEGFR2 and VEGFR3,
platelet-derived growth factor receptor β (PDGFR-β), stem cell
growth factor receptor (SCFR-c-KIT), fms-like tyrosine kinase 3
(Flt3) and 73 kinases in addition to its main targets (29,30).
Sunitinib inhibits cancer growth primarily through an
anti-angiogenic mechanism by inhibiting endothelial cell
proliferation and also halting their motility and inhibiting cancer
stem cell endothelial differentiation (31,32).
Sunitinib also inhibits the growth of cancer cells that is
stimulated by VEGF, SCF, or PDGF and induces cancer cell apoptosis
(33,34). Most recently, the elucidated
mechanisms of sunitinib action include targeting of CSCs, as we
have shown in our previous research (32,35).
Recent reports have suggested the direct effect of sunitinib on
CSCs in vivo and in vitro, which further supports our
model selection. In xenograft RCC models, sunitinib was shown to
generate resistance to its own therapeutic mechanism due to
induction of hypoxia in the tumor. On the other hand, in prostate
cancer xenograft studies, sunitinib reduced tumor hypoxia and
angiogenesis, with a radiosensitizing effect on stem-like cells
(36). At the same time, in renal
cancer xenografts, the number of CD133/CXCR4 co-expressing CSCs was
found to be higher under hypoxia, in peri-necrotic tumor areas, and
their tumorigenic potential was increased, while their sensitivity
to sunitinib was decreased (37).
Moreover, nuclear factor (NF)-κB/interleukin-6 (IL-6) activation
was found to be responsible for p21-activated kinase 1
(PAK1)-mediated stem-like phenotype following sunitinib treatment
in RCC (38). It is also worth
emphasizing that sunitinib suppresses the proliferation, migration,
apoptosis resistance, tumor angiogenesis and growth of
triple-negative breast cancers but increases the percentage of
breast cancer stem cells in tumors (39), which is in agreement with the fact
that sunitinib was recently shown in preclinical models to increase
invasive and metastatic properties of breast cancer cells (40). Surprisingly, recently, several groups
have reported that antibiotics, including those routinely used in
cell culture, can interfere with the sphere-forming abilities of
cancer cells, and therefore their impact on CSCs may be expected
(41,42). Selective toxic effects on CSCs have
been reported for azithromycin, chloramphenicol and doxycycline
(41). In light of these CSC-related
data, we aimed to verify the effect of sunitinib, as well as the
aforementioned antibiotics, on RCC cells in our novel
3D-extracellular matrix (ECM) supported cell culture model. As a
control we decided to use the cytotoxic drug epirubicin [Epi;
DNA-intercalating topoisomerase II inhibitor (43)] and to compare its effects on 3D
culture with sunitinib [Su; tyrosine kinase inhibitor (TKI)
anticancer activity in RCC (44)] to
verify the anticancer cell specificity of selected in vitro
treatments in the developed novel cell culture system.
In summary, the present study was designed to
evaluate the effect of various 3D culture conditions on RCC cell
pathophysiology, including promotion of a CSC phenotype defined by
putative marker CD105 expression. Our objectives were to
characterize gene expression and RCC cell proliferation changes in
3D culture-promoting conditions as compared to traditional
monolayer 2D growth. We also aimed to describe the susceptibility
of RCC cells grown in 3D to TKIs and chemotherapeutics in order to
evaluate the applicability of our biomimic 3D RCC culture model for
anticancer drug testing. We believe that to facilitate TKI testing
in vivo in the future, the biomimic culture model is
required for more relevant drug in vitro pre-screening. This
culture model is needed in order to decrease the number of
molecules ineffectively tested in in vivo animal
experiments. The 3D cell culture model resembles micrometastases by
complex spatial cell-cell interactions, intratumoral hypoxia in
spheroids, and enrichment with cells presenting stem cell phenotype
as we have shown for papillary RCC previously (45). Therefore, we believe that complex cell
cultures, in defined media with ECM support, facilitate drug
activity analysis and provide more relevant data, that are more
likely to be replicated later in in vivo models. In general,
the first goal of the present study was to provide such a biomimic
model for the metastatic RCC field. The second goal of this study
was to analyze the biological characteristics of RCC cells in this
models including their drug sensitivity.
Materials and methods
Cell culture
Established human RCC cell lines were purchased from
ATCC: Caki-1 (human kidney, epithelial, derived from skin
metastasis; ATCC® HTB-46™) and ACHN (human kidney,
epithelial, derived from pleural effusion metastasis;
ATCC® CRL-1611™) (46).
For initial passages, cells were cultured in
penicillin/streptomycin (P/S; cat. no. L0022; Biowest) containing
medium (RPMI-1640; L0498; Biowest) supplemented with 10% FBS (cat.
no. A3160802; Gibco/Thermo Fisher Scientific, Inc.) to prepare
early stocks; cells used for the experiments were not older than
the 10th passage since purchase. Prior to the present study, the
cells were passaged at least twice in antibiotic-free medium and
then cultured in RPMI-1640 medium supplemented with 10% FBS (2D
medium) until 80% confluence, and then detached with Accutase (cat.
no. L0950; Biowest) to obtain single-cell suspensions, washed 2
times with serum-free and antibiotic-free DMEM (product code,
L0501; Biowest) to remove remaining FBS and used in experiments.
All cell lines cultured in the laboratory were screened for
Mycoplasma contamination on a regular basis with Mycoplasma
Detection Kit (cat. no. PP-401L; Jena Bioscience) and only negative
passages were used for the presented experiments.
Extracellular matrix (ECM) coating
testing
Laminin Corning™ BioCoat™ (cat. no. 08-774-84;
Thermo Fisher Scientific, Inc.), Poly-D-lysine Corning™ BioCoat™
(cat. no. 08-775-30; Thermo Fisher Scientific, Inc.) and
Poly-D-lysine + Laminin Corning™ BioCoat™ (cat. no. 08-774-169;
Thermo Fisher Scientific, Inc.) in 24-well format were used for
extracellular matrix dependence testing.
Stem cell medium testing
RPMI-1640 from Biowest (cat. no. L0501) was used as
a reference control medium. NutriStem™ XF/FF Culture Medium for
Human iPS and ES Cells (cat. no. 01-0005; Stemgent), StemXVivo
Serum-Free Tumorsphere Media + StemXVivo EMT Inducing Media
Supplement (cat. no. CCM012 and CCM017; R&D Systems) were used
for 3D spheroid formation induction.
3D cell culture
For 3D structure formation, Caki-1 cells were
cultured in laminin-coated (Lam; cat. no. 354412; Corning) and ACHN
cells in poly-D-lysine-coated (PDL; cat. no. 354619; Corning)
24-well plates in StemXvivo or Nutristem (cat. no. 01-0005;
Stemgent) media. A total of 10,000 cells per well in 1 ml of medium
were seeded and cultured for 3 days to allow sphere formation.
Then, drug treatment was applied as it was previously shown that a
different response to each drug can be observed depending on
whether the treatment was on a monolayer culture or directly to
spheres (47); tested drugs were
added in 100 µl of serum-free DMEM and after 3 additional days of
culture, the cells were isolated for downstream assays.
Alternatively, drugs were added 6 h after seeding and the cells
were cultured for a total of 6 days. The 3D culture models employed
are a subject of Polish patent application no. P.420002. Parallel
2D culture control was performed in standard tissue culture-treated
plates (TC; cat. no. 10062-896; VWR) and RPMI supplemented with 10%
FBS with culture time and drug treatment as above.
Microscopic observations
Cells were visualized using an inverted microscope
Olympus CKX41 with camera UC30 and Olympus Entry Cell Sense 1.8.1.
software (Olympus, Tokyo, Japan). The numbers of 3D structures
formed were counted on the whole surface of the well.
Drug treatment
Stock concentrations of drugs were prepared in
sterile PBS (pH=7.2; cat. no. 404.200; Bioshop) or DMSO (cat. no.
EMR385100; EuroClone) as in Table I.
For IC50 determination, a serial dilution of the drugs
was prepared in serum-free DMEM in the range of 0.1–500 µg/ml or
0.01–50 µM final (in cell culture) concentrations, with DMEM not
exceeding 10% of the total culture volume. As diluents, both PBS
and DMSO did not alter the cell viability in the used
concentrations in preliminary studies, and they were used in
maximum concentrations only and served as controls.
Penicillin/streptomycin solution was added to a final concentration
used in standard culture (streptomycin, 100 µg/ml; penicillin, 100
U/ml).
 | Table I.Preparation of the tested agents. |
Table I.
Preparation of the tested agents.
| Drug | Stock
concentration | Diluent |
|---|
| Epirubicin
(5909990796373, Accord) | 3 mM | PBS |
| Sunitinib (PZ0012,
Sigma-Aldrich/Merck KGaA) | 10 mM | DMSO |
| Azithromycin
(PZ0007, Sigma-Aldrich/Merck KGaA) | 20 mg/ml | DMSO |
| Chloramphenicol
(C3175, Sigma-Aldrich/Merck KGaA) | 50 mg/ml | PBS |
| Doxycycline (D9891,
Sigma-Aldrich/Merck KGaA) | 20 mg/ml | PBS |
IC50 determination
Cells were seeded as above, in a 96-well format;
2,500 cells per well either in 100 µl of RPMI supplemented with 10%
FBS (2D culture medium) or StemXvivo medium (cat. no. CCM004,
R&D Systems; 3D-promoting medium as established in preliminary
studies). After three days of culture, the drug dilutions described
above were added, in triplicate in a volume of 10 µl to the wells.
After an additional 3 days of culture, Alamar Blue reagent (cat.
no. DAL1100; Molecular Probes/Thermo Fisher Scientific, Inc.) was
added to the final concentration of 10% and incubated for 3 h (for
adherent cultures; RPMI) or 24 h (for 3D cultures; StemXvivo
medium). Absorbance was measured in a plate spectrophotometer
(MultscanGO; Thermo Fisher Scientific, Inc.) at 570 and 600 nm, and
the percentage of Alamar Blue reduction was calculated according to
the manufacturer's instructions. Cell viability is represented as a
change in Alamar Blue reduction in comparison to the untreated
cells (% of control).
Cell isolation
Cells were cultured as described above and
aggregates were collected from wells, washed with PBS and incubated
for 10 min with Accutase solution to obtain single-cell
suspensions. Then, the cells were washed and re-suspended in
different buffers (depending on the assay) and used in further
analyses.
Cell viability
Cells were suspended in 0.2 ml of serum-free DMEM
and viability was measured with the Muse® Count &
Viability Assay Kit (cat. no. MCH100102; Merck KGaA) according to
the manufacturer's instructions. Briefly, 50 µl of cell suspension
was mixed with 450 µl of viability stain and incubated for 5 min.
Then, 2,000 cells were acquired on the Muse Cell Analyzer (cat. no.
0500-3115; Merck KGaA) and the percentage of live and dead cells
was calculated.
Cell cycle analysis
Cells were pelleted to remove PBS, suspended by
vortexing and pipetting and then 1 ml of 70% ice-cold ethanol
(113964200; Chempur) was slowly added. Cells were incubated at
−20°C for at least 3 h. Before analysis, alcohol was removed
completely by two PBS washes and then 100 µl of Muse®
Cell Cycle Reagent (The Muse® Cell Cycle Kit, cat. no.
MCH100106; Merck KGaA) was added for 30 min. For acquisition,
additionally 150 µl of PBS was added. At least 2,500 cells were
acquired on the Muse Cell Analyzer (cat. no. 0500-3115; Merck KGaA)
and analyzed for the percentage of cells in G0/G1, S and G2 phases,
based on DNA content.
RNA isolation
Total RNA was isolated with Cells-to-Ct kit (cat.
no. AM1728; Ambion); a total of 5,000 cells were suspended to
remove excess PBS and 50 µl of DNAse containing Lysis buffer was
pipetted to the sample. After a 5-min incubation, the reaction was
stopped by gently mixing in 5 µl of stop solution. The resulting
RNA isolates were stored at −80°C and then used for reverse
transcription using the above mentioned kit. cDNA was obtained by
adding 2X RT Buffer and 20X RT Enzyme mix to 10 µl of RNA isolates;
reaction was adjusted to 25 µl with water and run for 60 min at
37°C, followed by 5 min inactivation at 95°C in a LifeECO thermal
cycler (cat. no. BYQ6078; Bioer). Resulting cDNA was stored at
−20°C and used in gene expression analysis.
Gene expression analysis
Real-time PCR was performed using the Applied
Biosystems™ TaqMan™ Gene Expression Master Mix (cat. no. 4369010;
Thermo Fisher Scientific, Inc.) with multiplex TaqMan primer/probe
sets (Thermo Fisher Scientific, Inc.; listed in Table II) in 20 µl reactions in triplicate
with 2 µl of 2X diluted cDNA reaction as a template. Two gene
TaqMan sets were used in each reaction; compatibility of the kits
was confirmed before experiments and only kits that gave the same
signal when run in single or double reactions were used in the
study. Also, -RT (minus reverse transcription) controls were
performed to confirm no product on genomic DNA. Reactions were run
in 8-well strips on LightCycler® 96 machine (cat. no.
05815916001; Roche). Data were calculated with using the
2(−ΔC(q)) method (48),
with normalization to geometrical mean expression of PPIA
(peptidylprolyl isomerase A) and GUSB (beta-glucuronidase)
as housekeeping gene controls (49).
| Table II.List of paired TaqMan assays. |
Table II.
List of paired TaqMan assays.
| Gene (FAM
stain) | Assay ID | Gene (VIC
stain) | Assay ID |
|---|
| HIF1 | Hs00153153_m1 | HIF2 | Hs01026149_m1 |
| VEGF | Hs00900055_m1 | PAX2 | Hs01565576_m1 |
| VHL | Hs00184451_m1 | CDH2 | Hs00983056_m1 |
| CDH1 | Hs01023894_m1 | C-MET | Hs01565576_m1 |
| CD133 | Hs01009257_m1 | NANOG | Hs04399610_g1 |
| NESTIN | Hs04187831_g1 | CD105 | Hs00923996_m1 |
| SOX2 | Hs01053049_s1 | OCT4 | Hs04260367_gH |
| PPIA | Hs01565699_g1 | GUSB | Hs00939627_m1 |
Statistical analysis
All experiments were performed in at least three
biological repetitions, and one representative study is shown.
Results are presented as means ± SD from duplicates or triplicates
(3 wells). Differences between groups were determined using
Mann-Whitney U test and considered significant if P<0.05 and
marked with the symbol *on the respective graphs. For gene
expression analysis non-parametric Kruskal-Wallis test was used and
P-values are presented in Table III
and on graphs or in the text.
| Table III.P-values of Mann-Whitney test for the
comparisons between each 3D culture condition with 2D control for
the gene expression analysisa. |
Table III.
P-values of Mann-Whitney test for the
comparisons between each 3D culture condition with 2D control for
the gene expression analysisa.
|
| 2D vs.
NutriStem | 2D vs.
StemXvivo |
|---|
|
|
|
|
|---|
| Gene name | ACHN cells | Caki-1 cells | ACHN cells | Caki-1 cells |
|---|
| OCT4 | 0.081 | 0.081 | 0.081 | 0.081 |
| CD105 | 0.081 | 0.190 | 0.081 | 0.081 |
| CD133 | 0.081 | 0.081 | 0.081 | 0.081 |
| CDH1 | 0.081 | 0.081 | 0.081 | 0.081 |
| HIF1 | 0.081 | 0.077 | 0.081 | 0.077 |
| HIF2 | 0.081 | 0.139 | 0.081 | 0.139 |
| MET | 0.081 | 0.139 | 0.081 | 0.081 |
| CDH2 | 0.081 | 0.081 | 0.081 | 0.081 |
| NESTIN | 0.081 | 0.081 | 0.081 | 0.663 |
| PAX2 | 0.081 | ND | 0.081 | ND |
| SOX2 | 0.063 | 0.081 | 0.081 | 0.081 |
| VEGF | 0.081 | 0.081 | 0.081 | 0.081 |
Results
The mesenchymal phenotype is induced
in 3D RCC spheroids
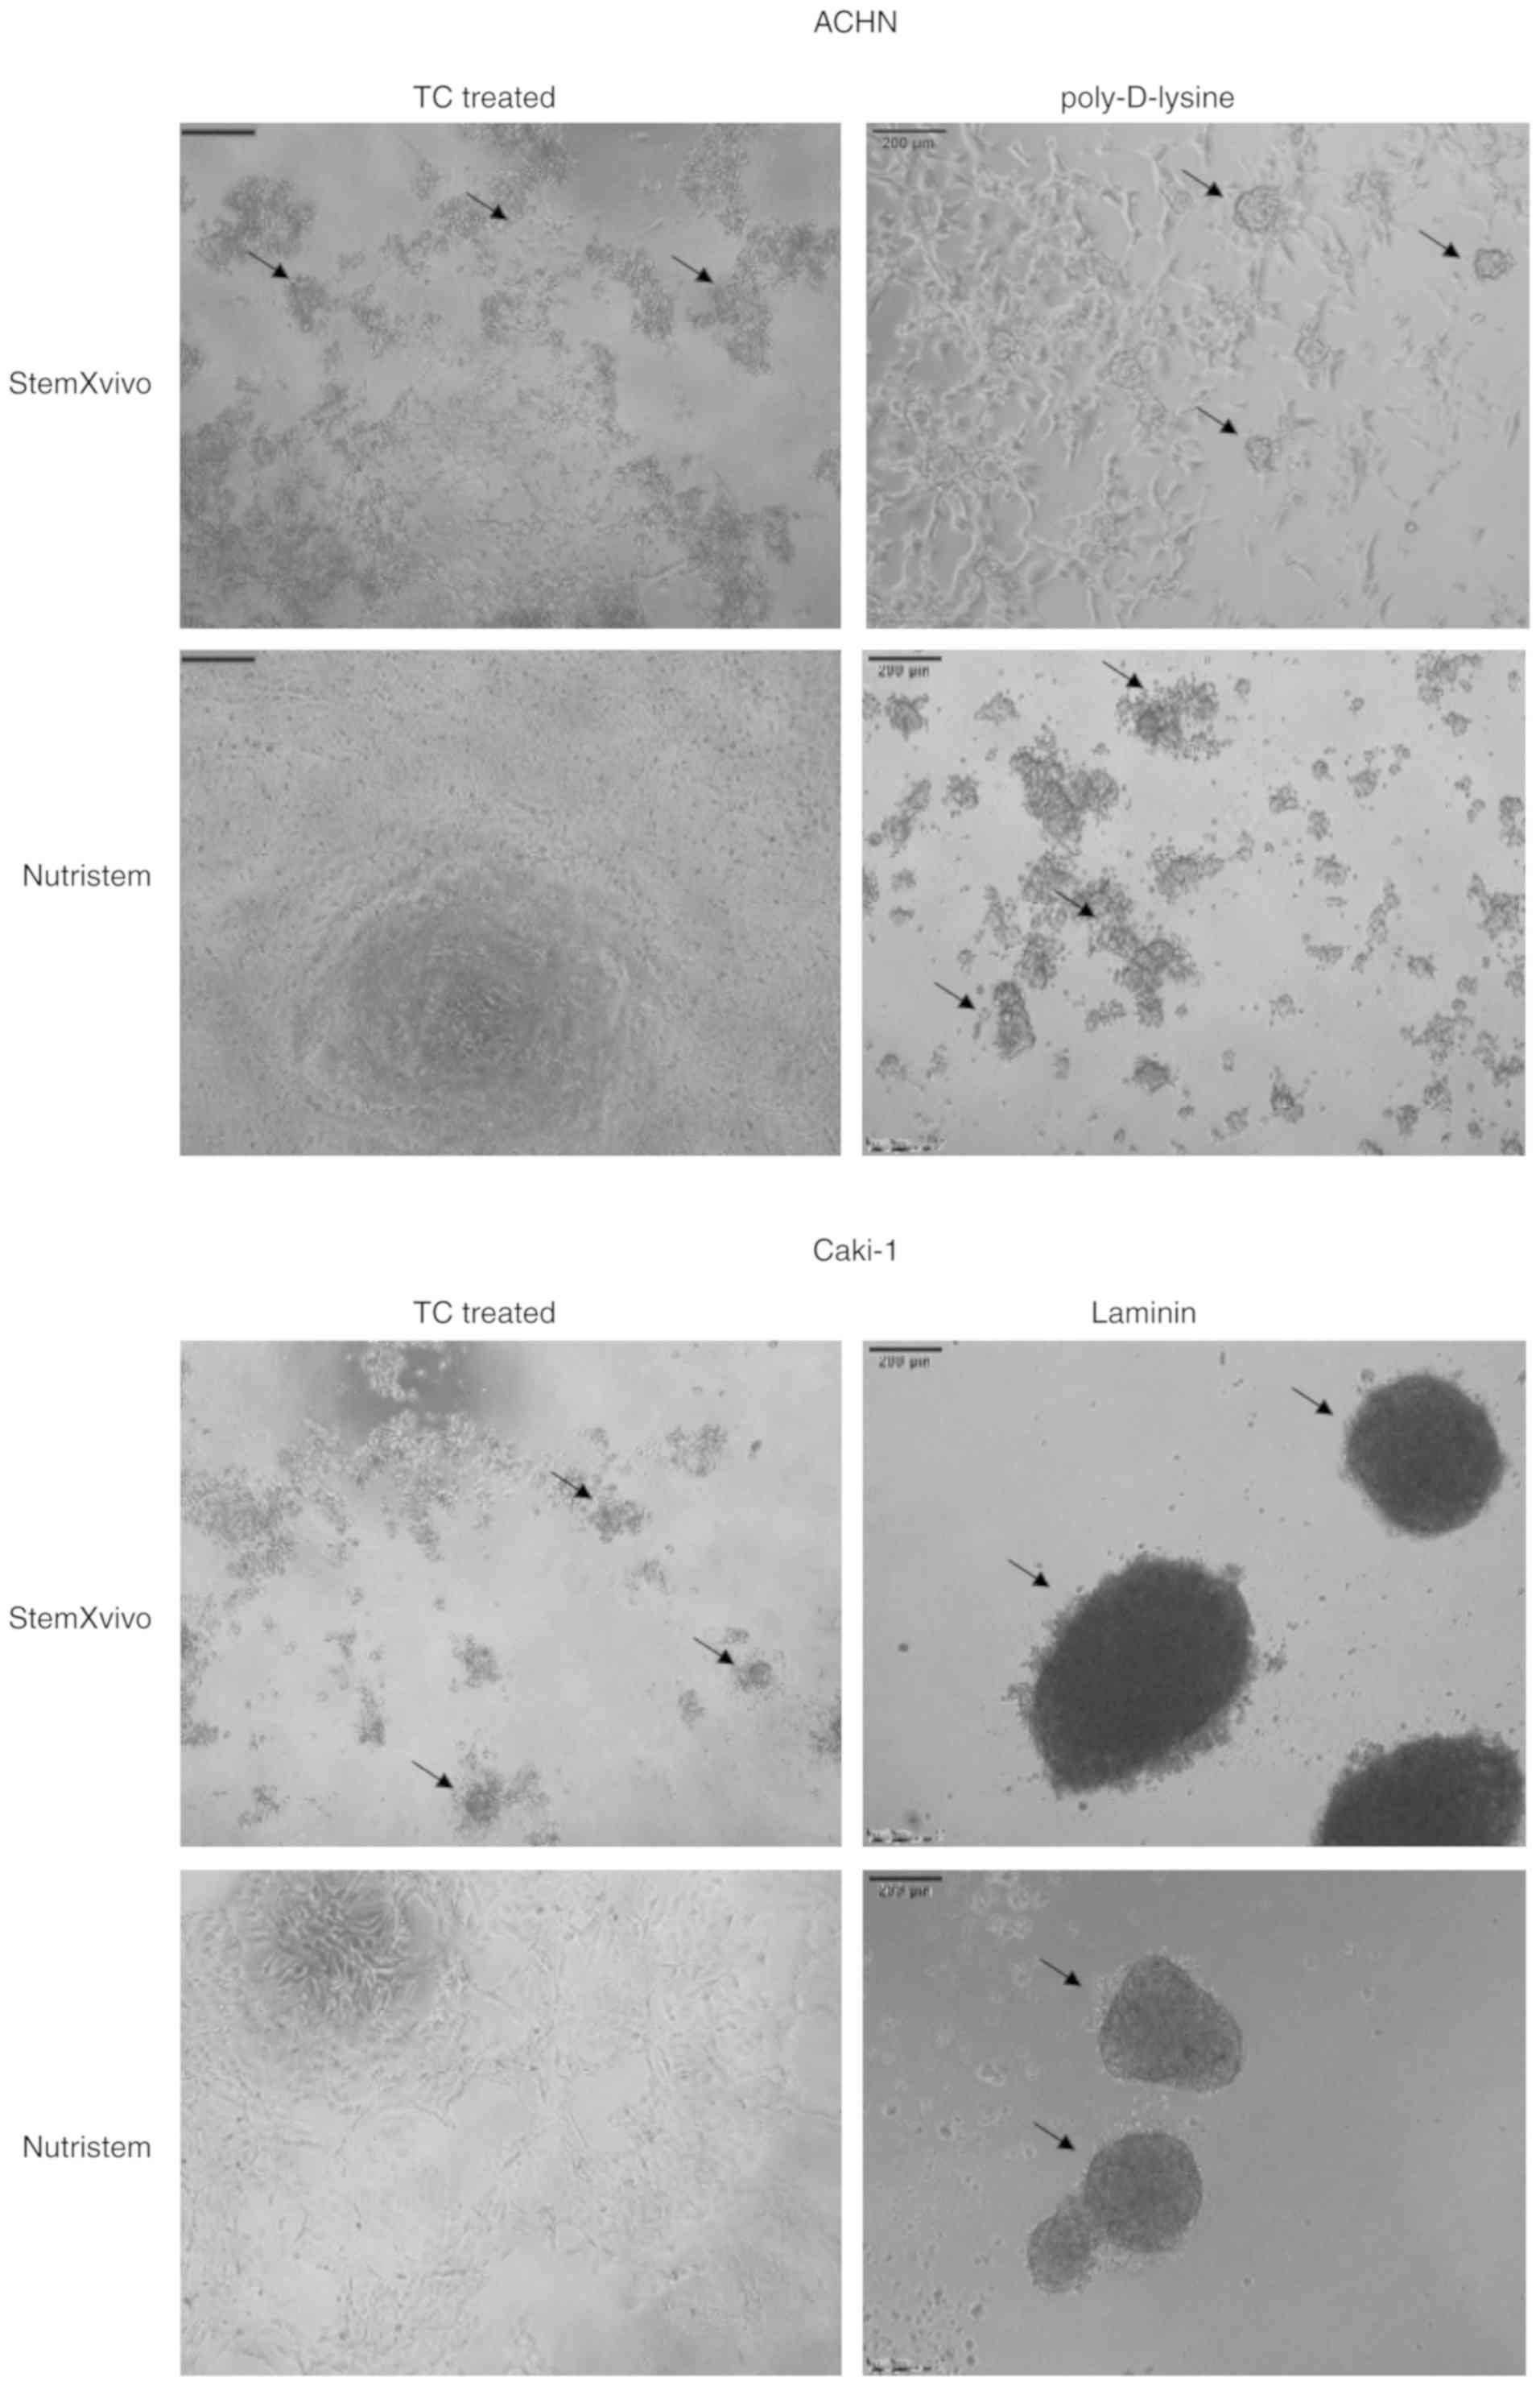
In our preliminary part of the study, we performed a
screening to select the optimal culture conditions promoting
formation of 3D spheroids by metastatic RCC cell lines, ACHN and
Caki-1. We established that culture conditions of StemXVivo or
Nutristem media on poly-D-lysine-coated plates for ACHN and
laminin-coated plates for Caki-1 cells were the most efficient in
promoting the 3D growth of cells [Fig.
1 and (50)].
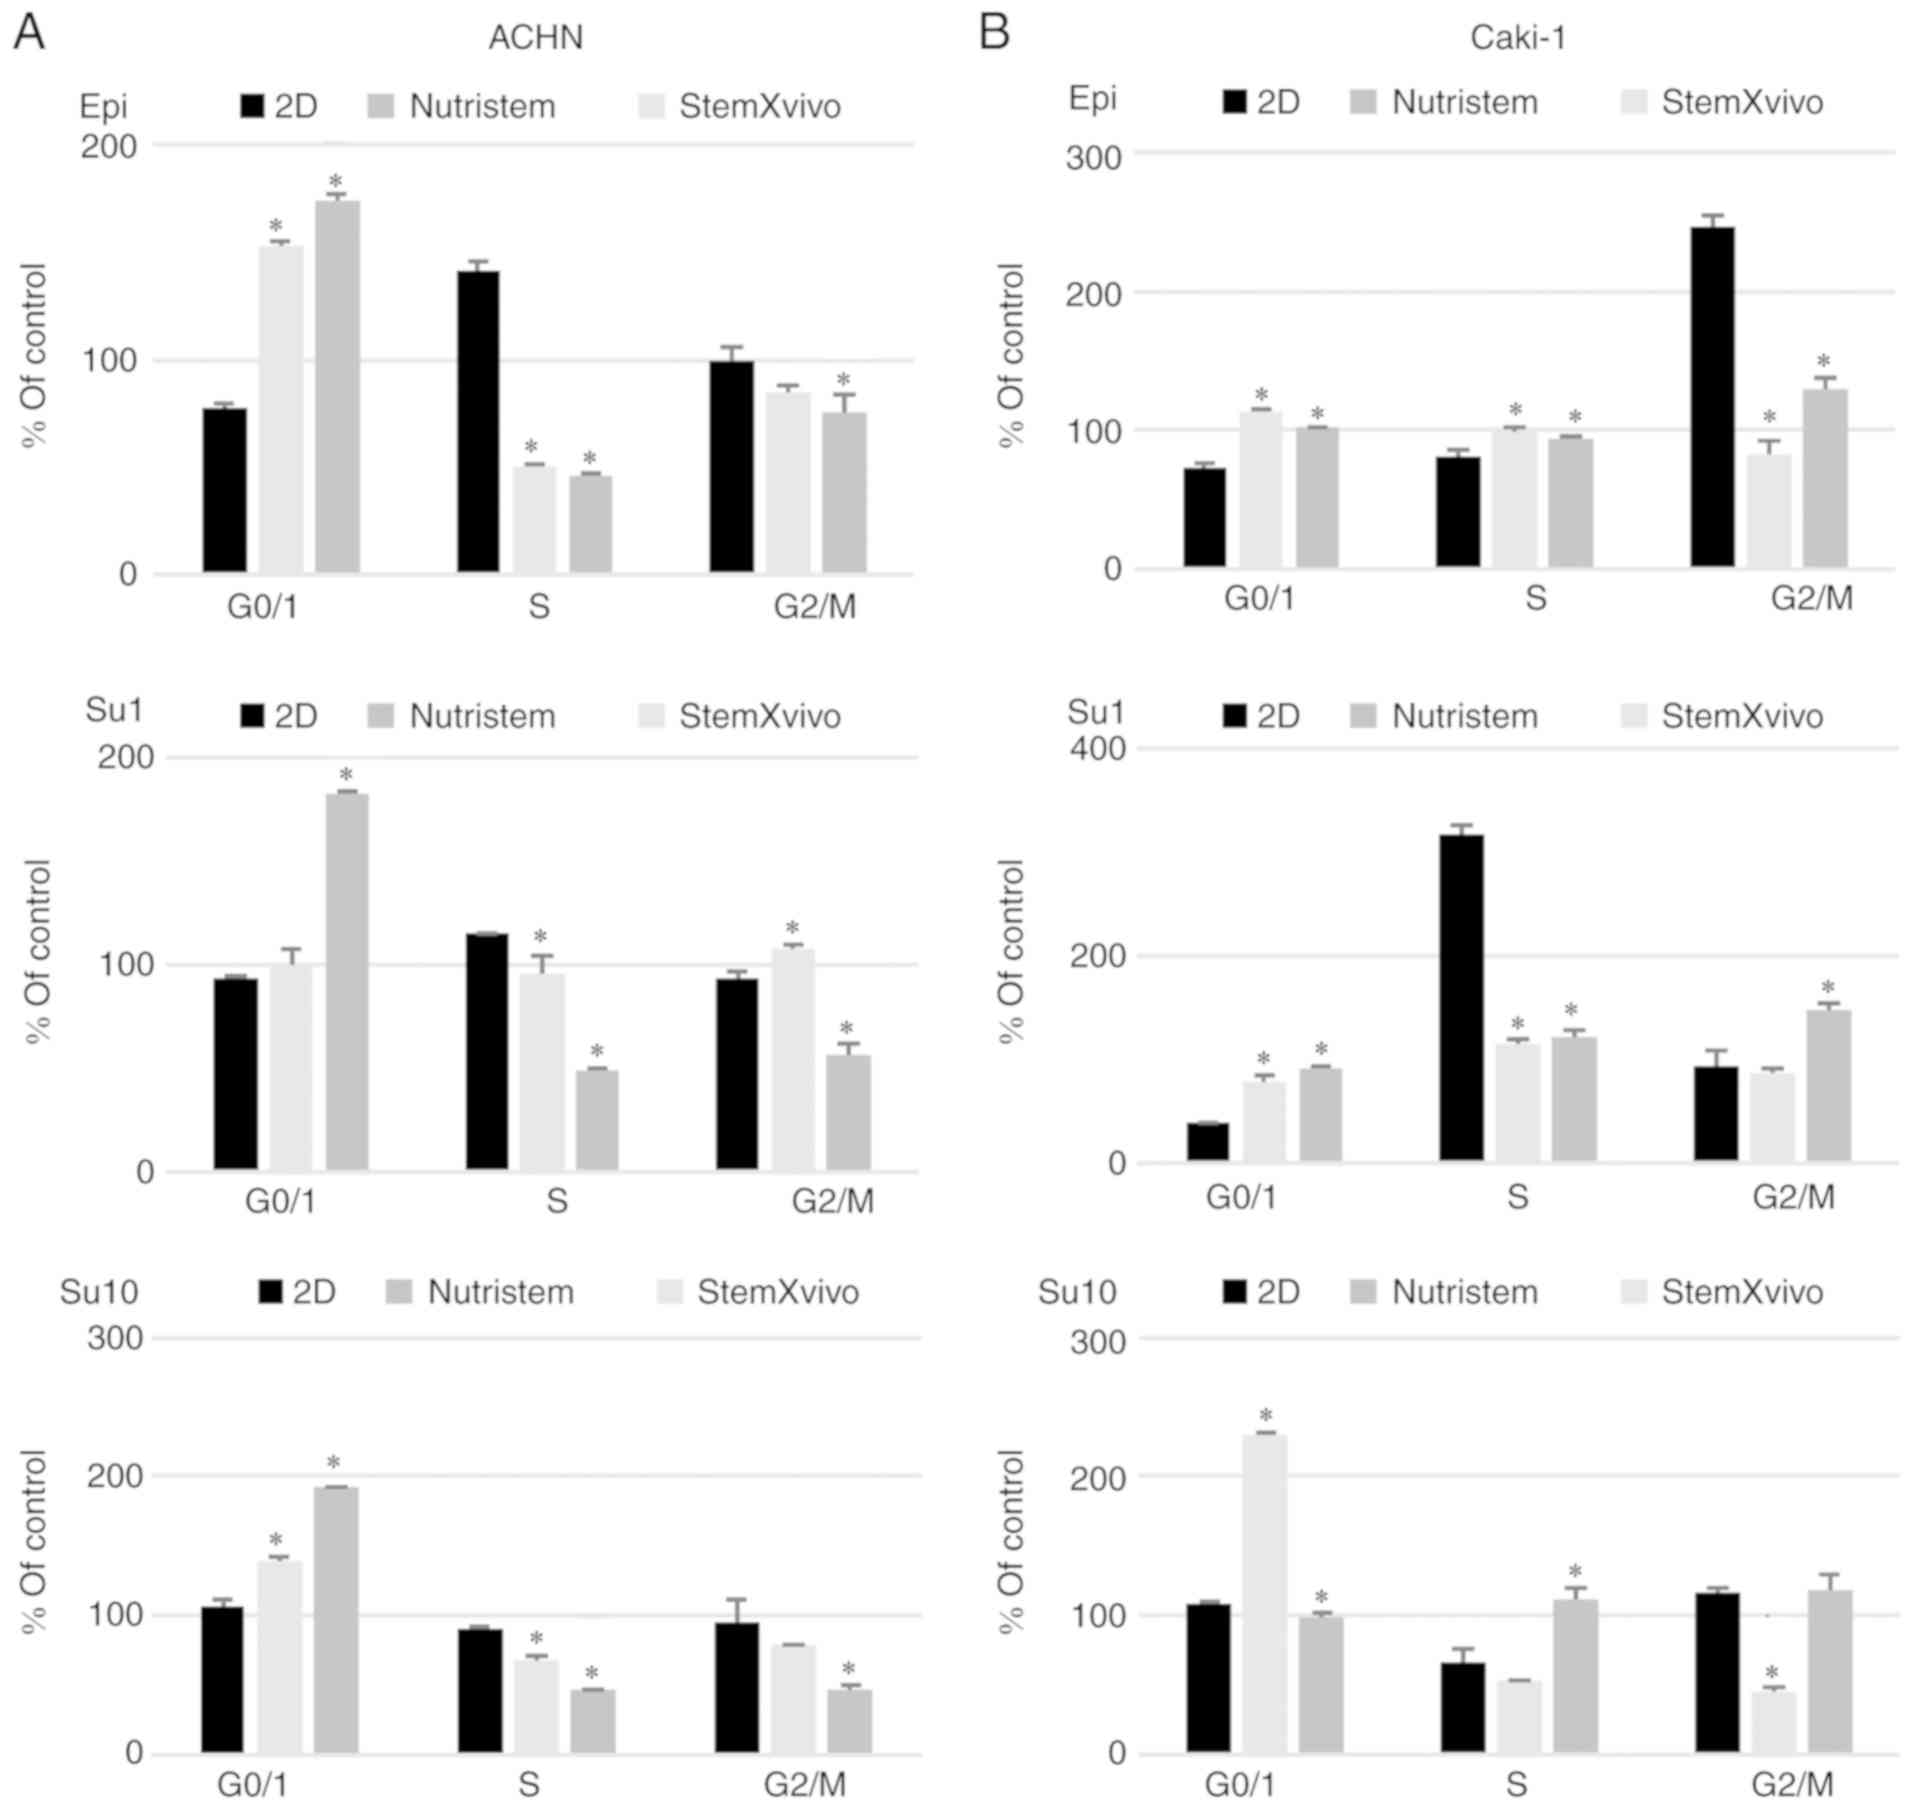
In optimal 3D spheroid-rich conditions
(StemXVivo/poly-D-lysine combination) ACHN cells formed small
spheroids with remaining adherent cells of an epithelial phenotype
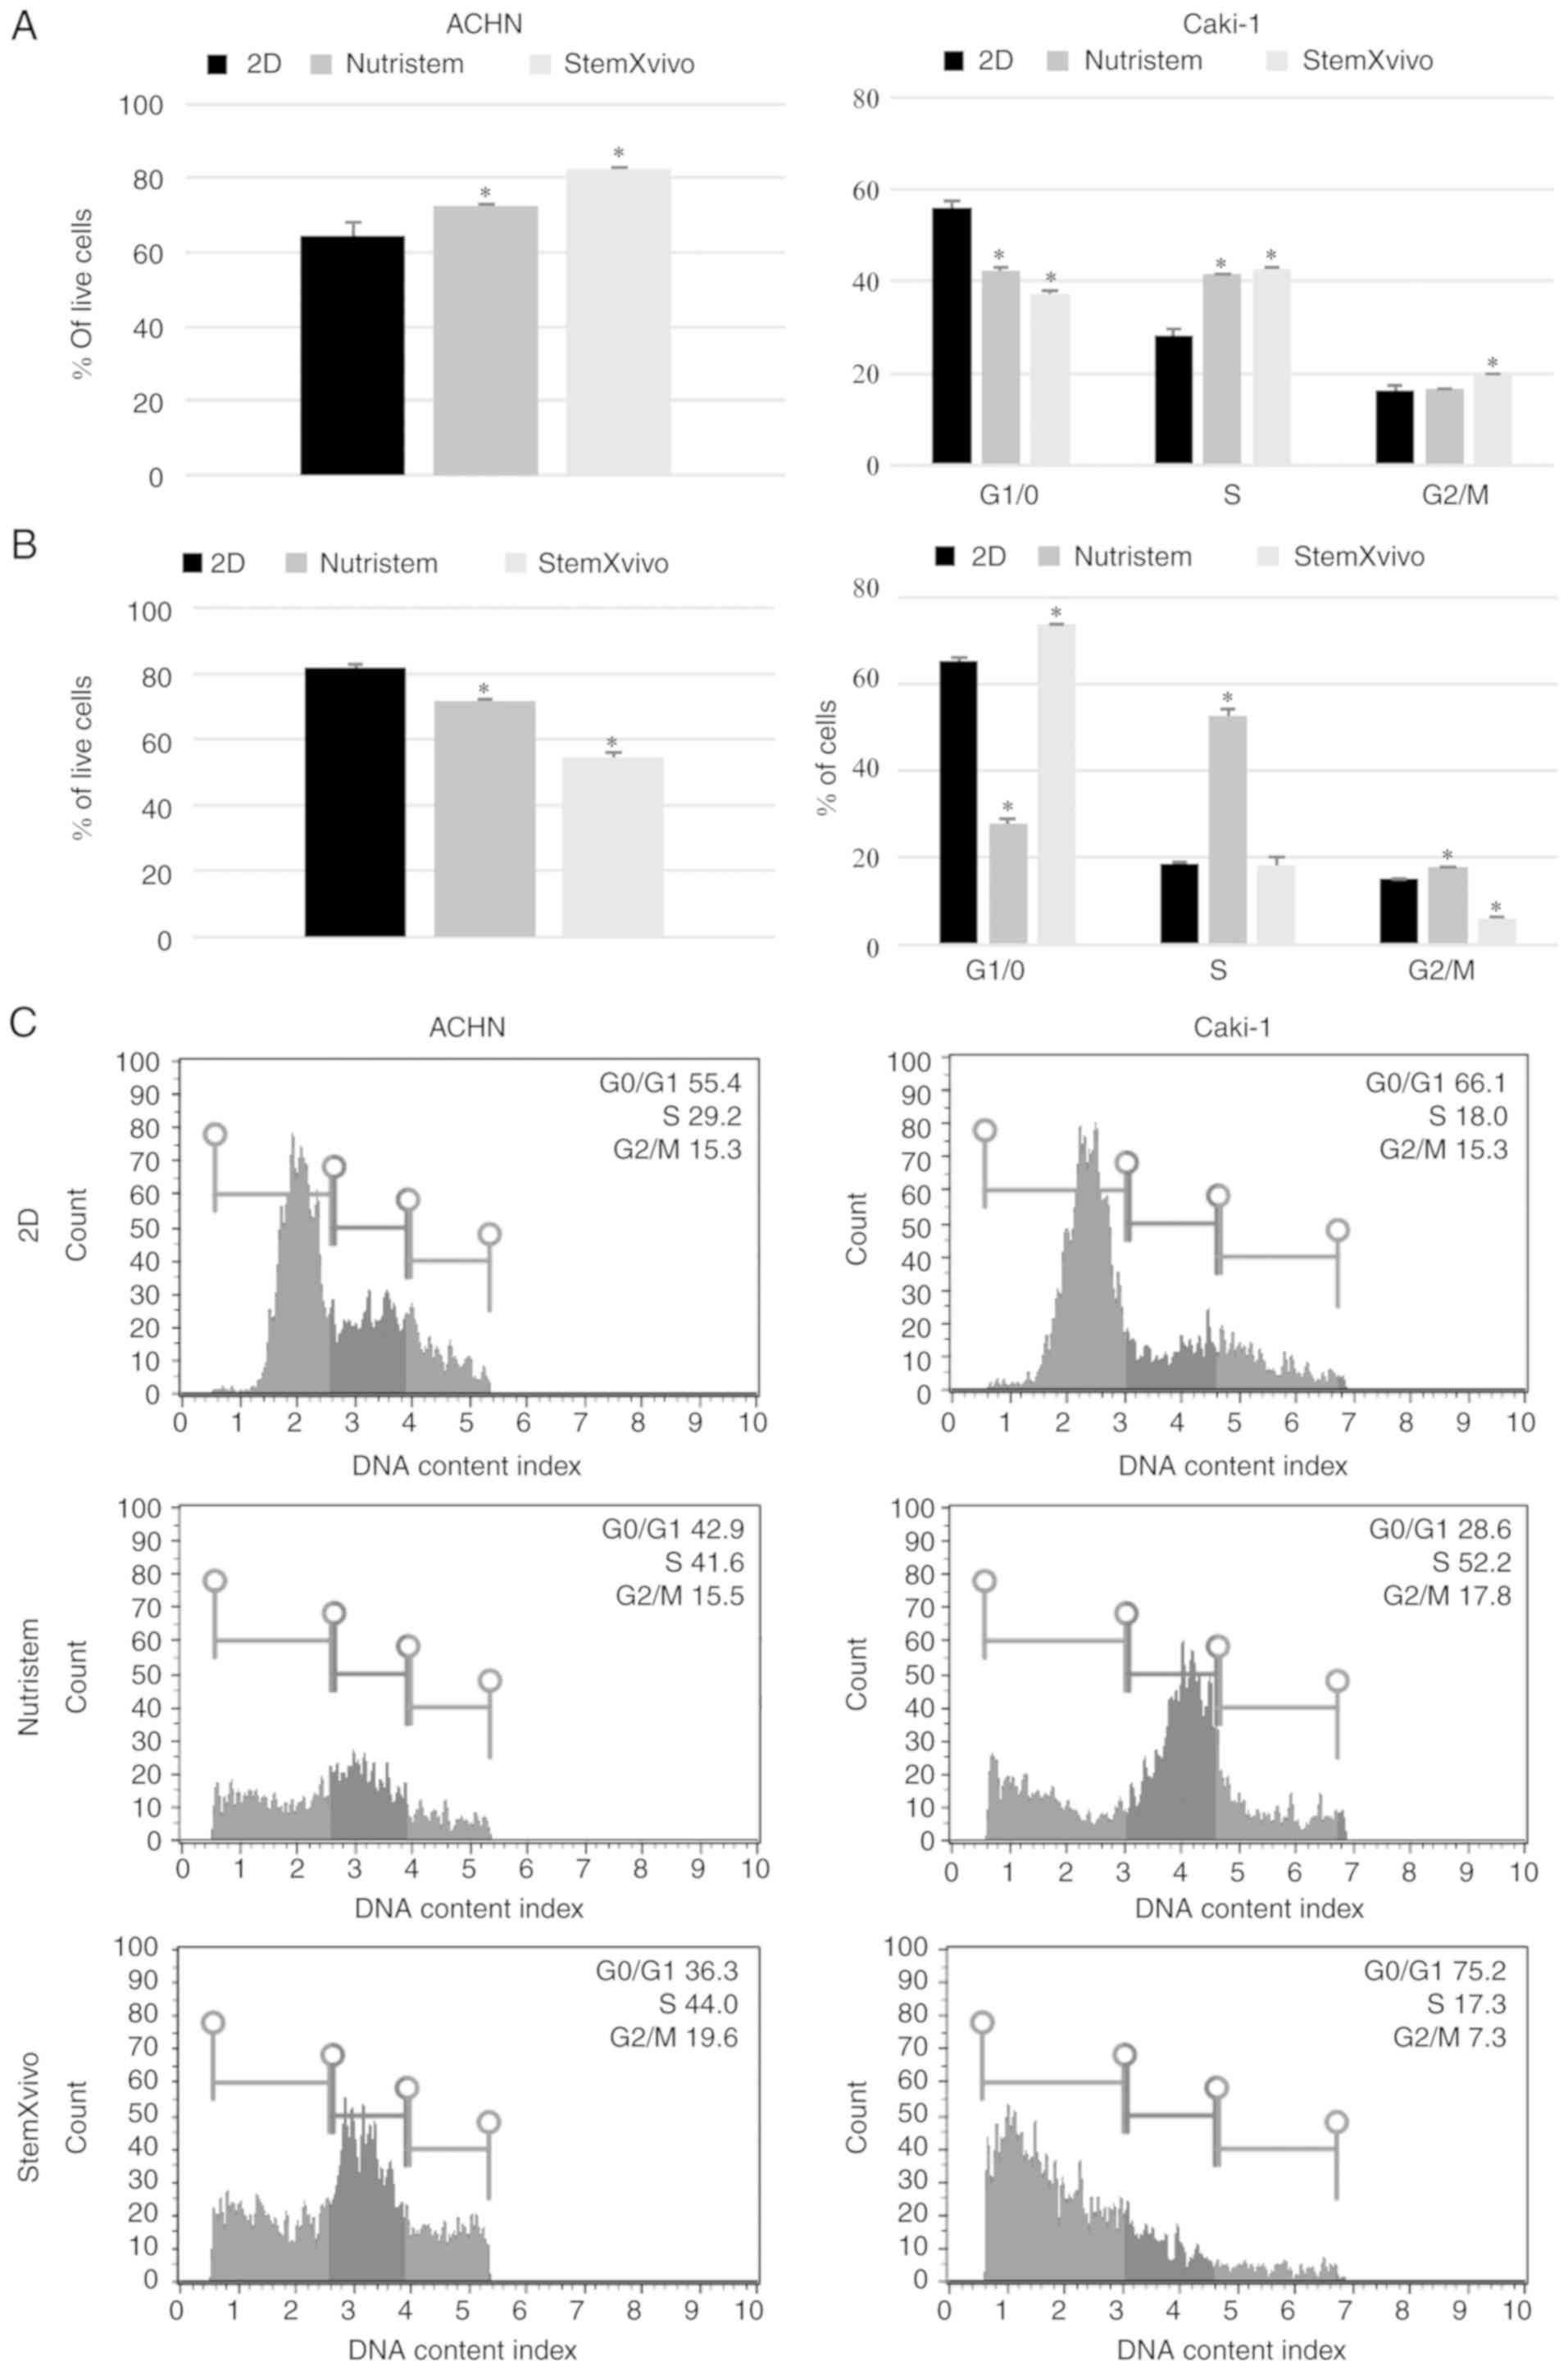
(Fig. 1). Such culture conditions
significantly increased the viability of the cells and promoted
their proliferation as defined by an increased percentage of cells
in the S and G2 phases (Fig. 2A). The
levels of expression of most stem-related genes tended to be
increased in comparison to these levels in the 2D culture (P=0.081,
Fig. 3A; SOX2 was not detected
in this sample), but both CDH1 and CDH2 were
overexpressed together with VEGF. In optimal 3D
spheroid-rich conditions (StemXVivo/laminin combination), Caki-1
cells formed large dark structures (Fig.
1) which were later characterized by significantly reduced cell
viability (Fig. 2B). Also a reduced
percentage of proliferating cells (G2) was observed with a
simultaneous G0/G1 phase shift (Fig.
2B). At the same time these cells exhibited the gene expression
pattern characteristic of EMT, a decrease in CDH1 and
increase in CDH2; however, most stem-related genes, apart
from SOX2 and CD105, were downregulated in these
cells in comparison to the 2D culture (Fig. 3B). In addition, the levels of
VHL and NANOG gene expression were determined;
however, they were not detected in the tested cell lines under
these conditions.
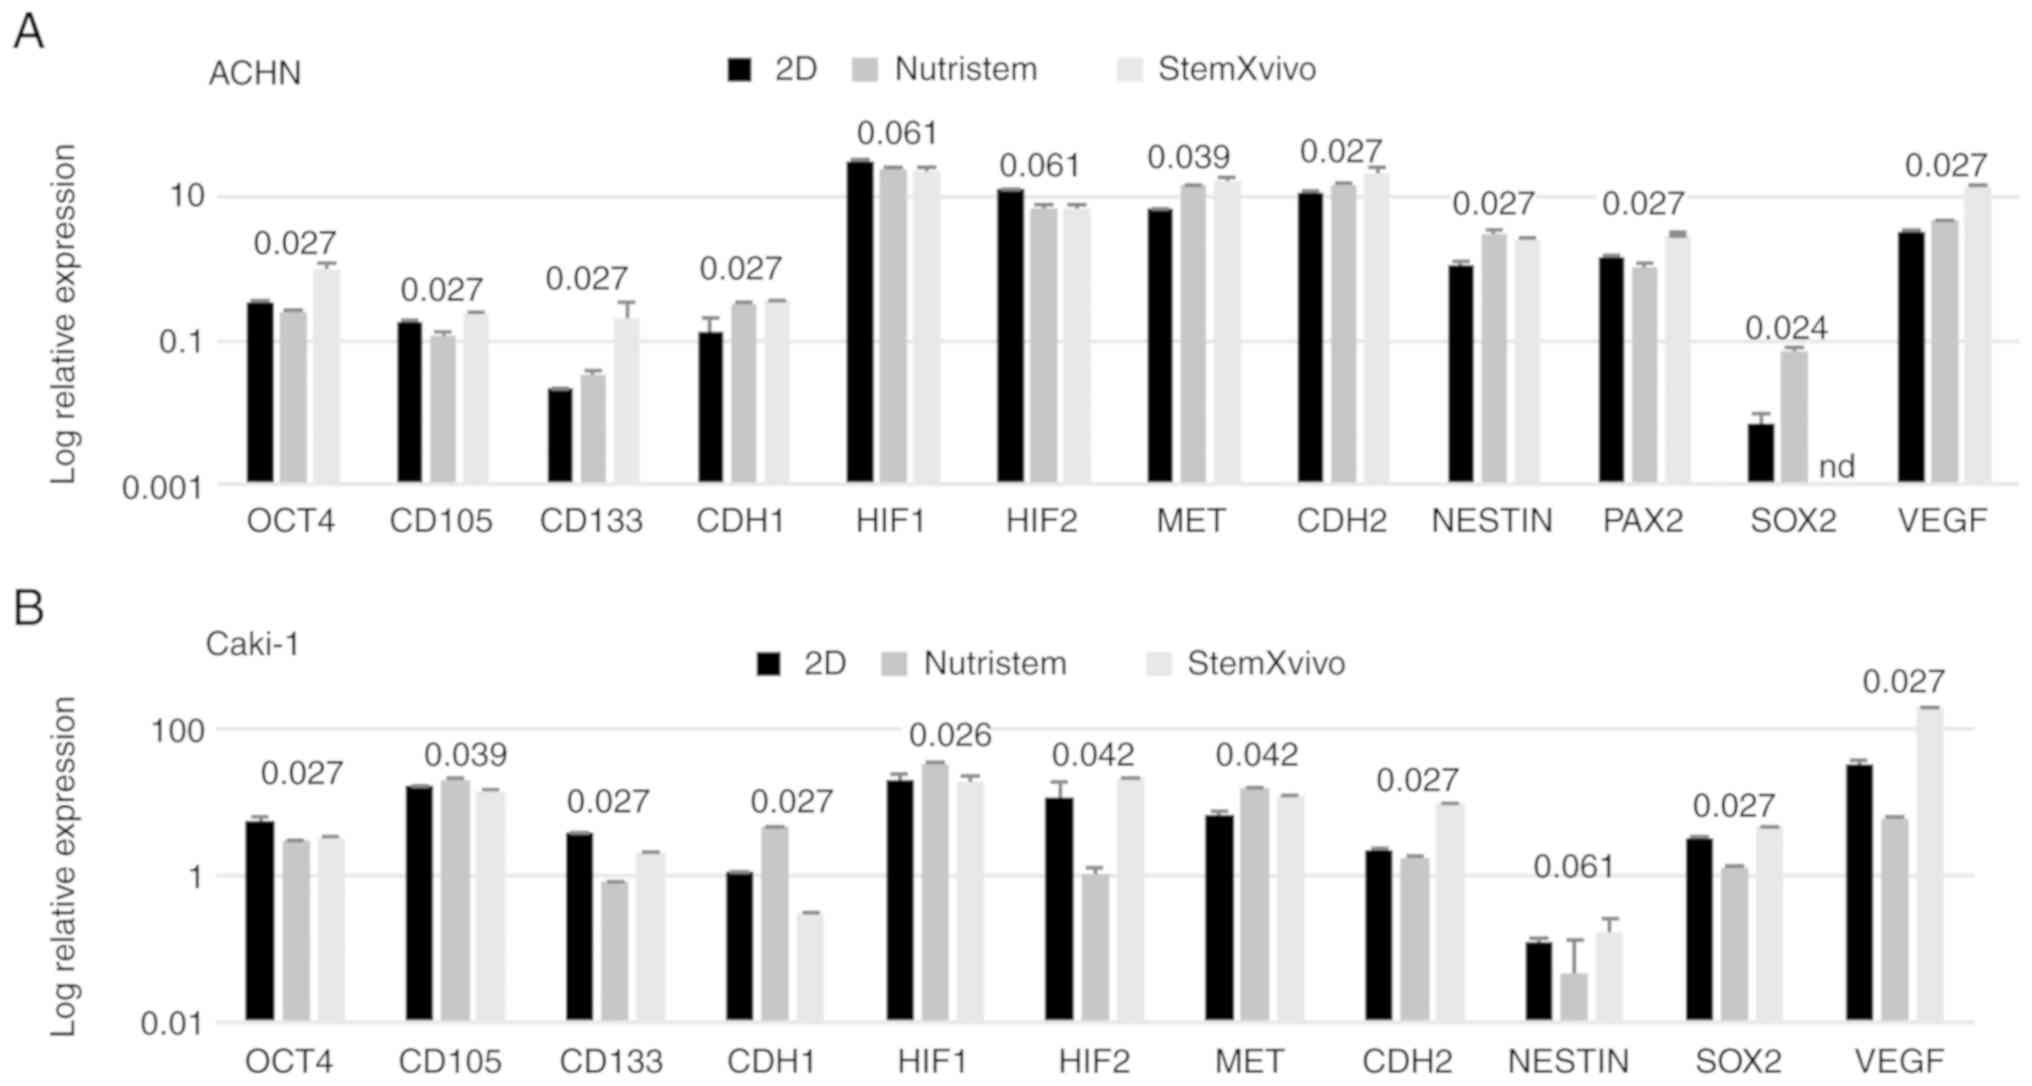 | Figure 3.Effect of 3D structure formation on
gene expression (log relative expression) as determined using
real-time PCR in (A) ACHN cells cultured on poly-D-lysine-coated
surface in 3D media and standard monolayer or (B) Caki-1 cells
cultured on laminin-coated surface in 3D media and standard
monolayer. P-values using the Kruskal-Wallis test are presented
over the graphs for each gene. P-values <0.05 are in bold print;
n=2 wells. OCT4 or POU5F1, POU class 5 homeobox 1;
CD105 or ENG, endoglin; CD133 or PROM1,
prominin 1; CDH1, cadherin 1; HIF1, hypoxia-inducible
factor 1-alpha; HIF2, hypoxia-inducible factor 2-alpha;
MET, MET proto-oncogene, receptor tyrosine kinase;
CDH2, cadherin 2; NESTIN, nestin; PAX2, paired
box 2; SOX2, SRY-box 2; VEGF, vascular endothelial
growth factor. |
Growth factor deprivation does not
promote a pluripotent phenotype of 3D RCC spheroids
Growth factor deprivation (Nutristem medium) on the
poly-D-lysine surface promoted CDH1 overexpression in ACHN
cells. These cells formed small, heterogeneous cell aggregates with
high viability and characterized by accumulation in the S phase of
the cell cycle (Figs. 1 and 2A). In the formed 3D structures, RCC
stem-related genes (CD105, OCT4) displayed decreased
expression while other genes (SOX2, CD133, NESTIN) were
overexpressed in comparison to the 2D-cultured cells. c-MET,
CDH2 and VEGF were overexpressed in these cells
(Fig. 3A).
In contrast, Caki-1 growth in Nutristem medium upon
attachment to laminin resulted in downregulation of the expression
of various stem-related genes, CD133 and SOX2
(Fig. 3B), that were upregulated in
ACHN. In optimal 3D spheroid-rich conditions (Nutristem/laminin),
Caki-1 cells formed uniform spheroids with smooth edges (Fig. 1), but the viability of cells in
spheroids was slightly reduced when compared to cells in the
standard 2D monolayer culture (Fig.
2B). Under these conditions, HIF1 was overexpressed
while VEGF expression was decreased (Fig. 3B), and an increased percentage of
cells in the S and G2 phases (Fig.
2B) was noted.
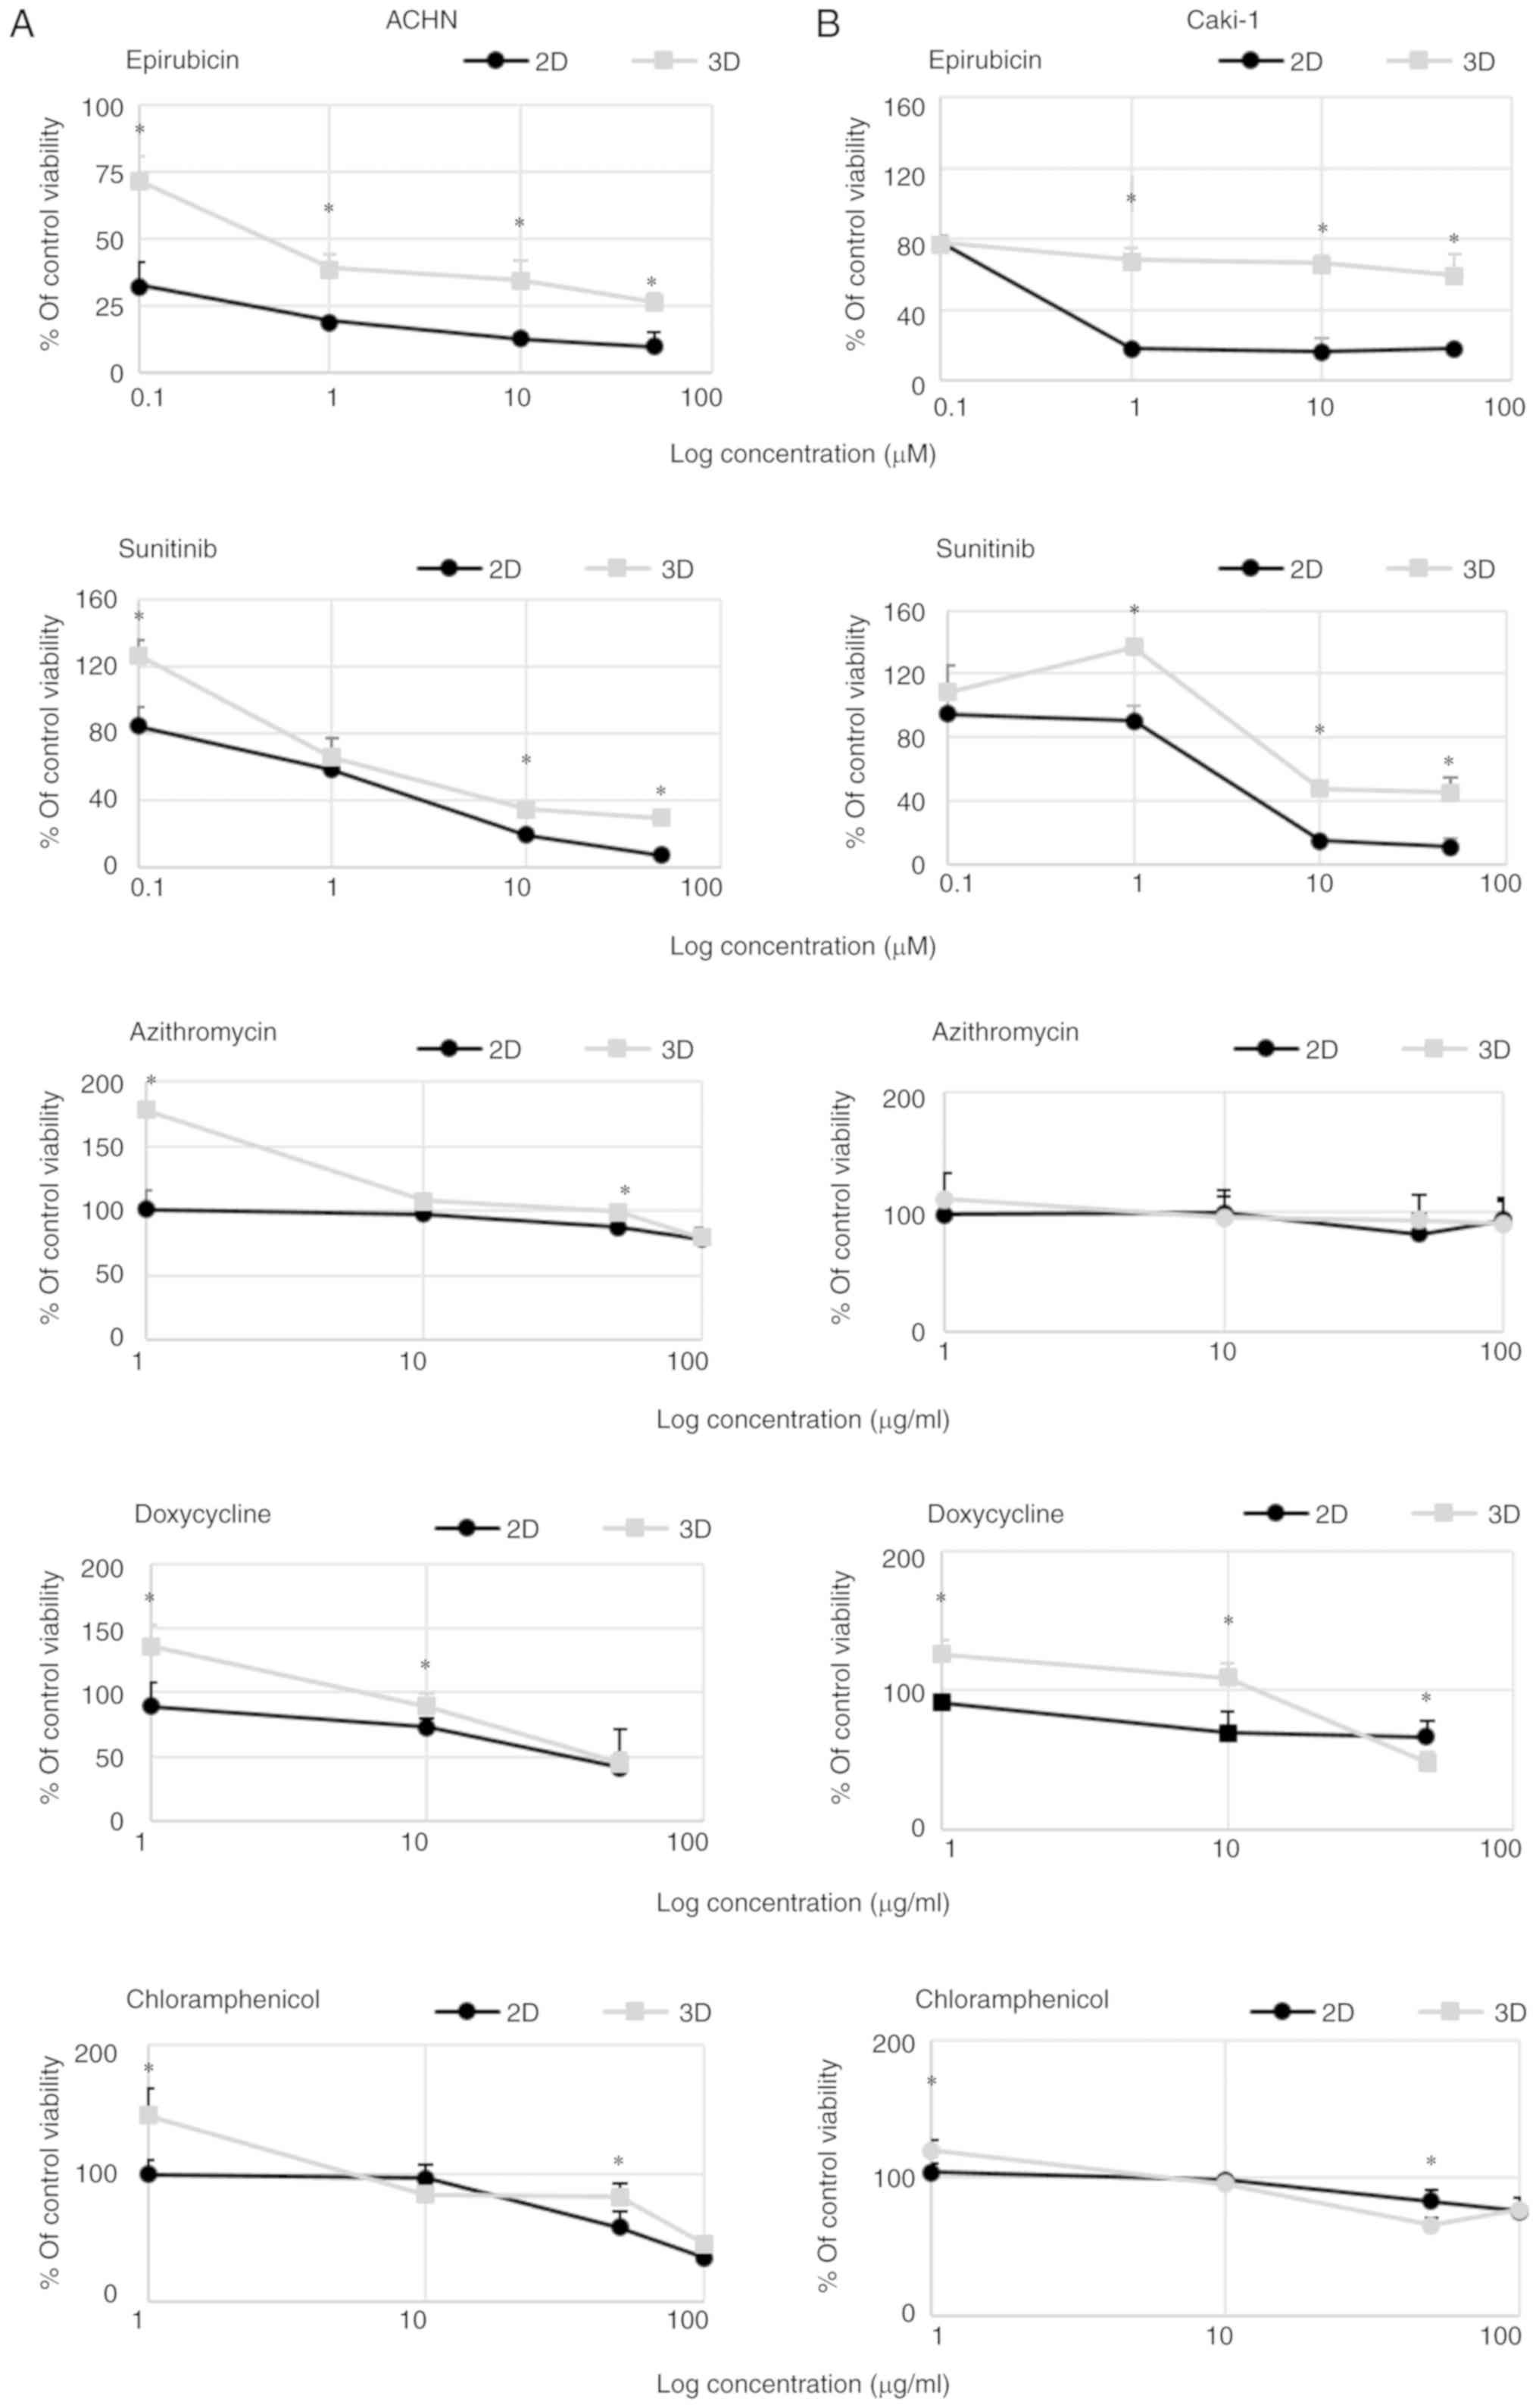
3D growth affects RCC cell drug
susceptibility
3D growth affected RCC cell susceptibility to TKIs
and antibiotics in the tested model. Cells were more resistant to
sunitinib and epirubicin in 3D than in 2D culture (Fig. 4). In 3D cell culture conditions, the
IC50 values for sunitinib were >5.5- and 2.4-fold
higher in comparison to the 2D culture for ACHN and Caki-1 cells,
respectively. Moreover, low concentration of sunitinib caused a
mild increase in 3D cell growth of the tested cells. The
differences in the IC50 values were even higher for
epirubicin; spheroids formed by Caki-1 cells were resistant to
>80 times higher concentration of the drug, while in the case of
ACHN cells the difference was 180-fold in comparison to the
monolayer (Table IV).
| Table IV.The calculated values of
IC50 (µM) for epirubicin and sunitinib in the tested
cell lines. |
Table IV.
The calculated values of
IC50 (µM) for epirubicin and sunitinib in the tested
cell lines.
| Cell line | Drug | 2D | 3D |
|---|
| ACHN | Epirubicin | 0.005 | 0.9 |
|
| Sunitinib | 4.7 | 25.9 |
| Caki-1 | Epirubicin | 0.9 | 75.1 |
|
| Sunitinib | 17.0 | 40.3 |
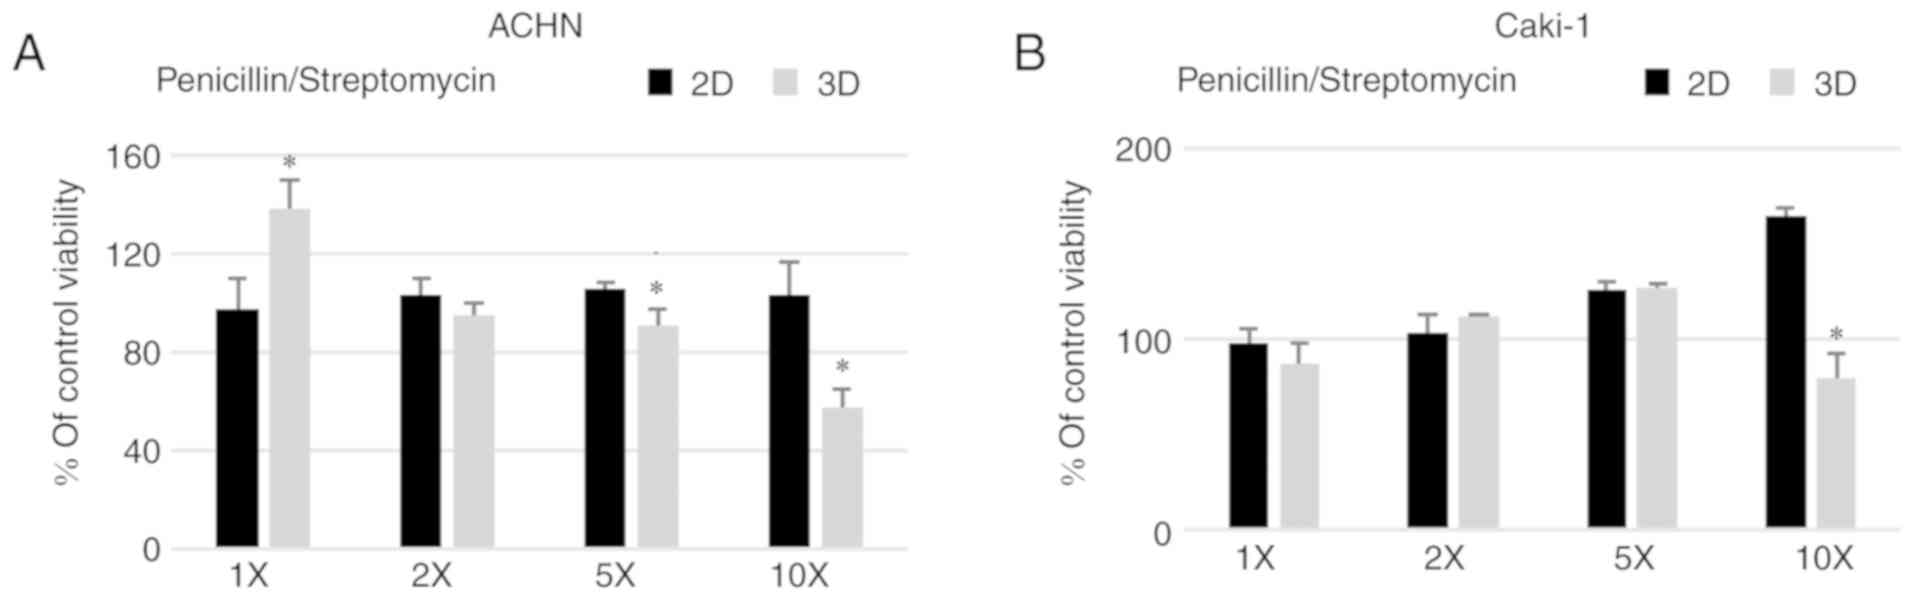
A standard concentration of penicillin/streptomycin
(100 U/ml, 100 µg/ml, respectively) routinely used in cell culture
did not affect the formation of 3D structures in the metastatic RCC
cell lines (Fig. 5) with a similar
observation in the case of the primary 786-O cell line (data not
shown). On the contrary, penicillin/streptomycin enhanced 293 cell
sphere formation (data not shown). However, when the antibiotic
solution was added at a higher concentration, 5 or 10 times (5X and
10X) more than used in standard culture, the viability of the cells
grown in 3D conditions was reduced for both ACHN and Caki-1 cell
lines. Azithromycin had a non-significant effect on the growth of
cells in 2D and 3D in the tested concentration range (Fig. 4) but surprisingly it increased the
number of spheres formed by ACHN cells (Fig. 6C). RCC cells showed some
susceptibility to chloramphenicol; however, it was not dependent on
culture conditions. In both cell lines, 2D culture condition
sensitized the cells to doxycycline (Fig.
4).
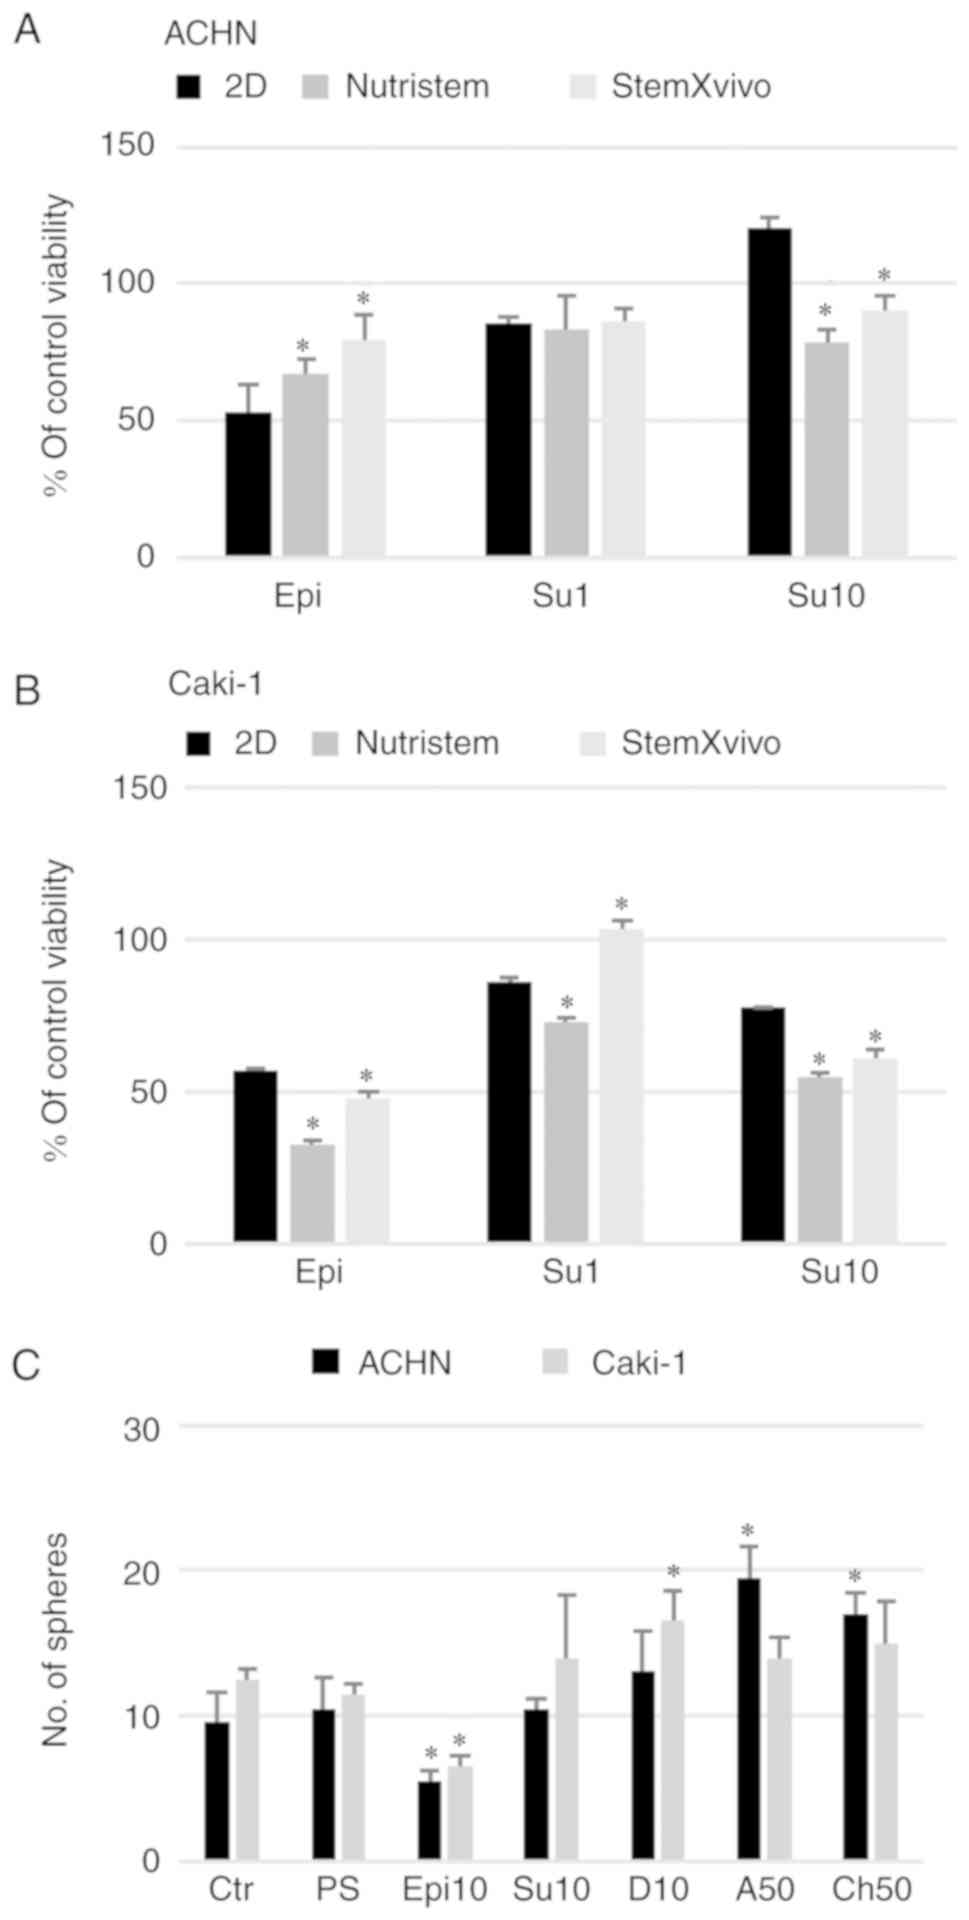 | Figure 6.Effect of 3D structure formation on
the cell reaction to in vitro drug treatment (viability).
(A) ACHN cells cultured on poly-D-lysine-coated surface in 3D media
and standard monolayer or (B) Caki-1 cells cultured on
laminin-coated surface in 3D media and standard monolayer.
*P<0.05 vs. 2D; using Mann-Whitney U test. y-axis represents %
viability of the control, untreated cells. Epi, epirubicin at 1 µM;
Su1, sunitinib at 1 µM; Su10, sunitinib at 10 µM. (C) Effect of the
selected doses of the tested drugs on the sphere morphology and
number. *P<0.05, 2D vs. 3D; using Mann-Whitney U test. Ctr,
control; PS, Penicillin/Streptomycin; Epi10, epirubicin at 10 µM;
Su10, sunitinib at 10 µM; D10, doxycycline at 10 µM; A50,
azithromycin at 50 µM; Ch50, chloramphenicol at 50 µM. n=3
wells. |
3D growth affects RCC cell
susceptibility to chemotherapy and tyrosine kinase inhibitor
Sunitinib had a direct pro-apoptotic effect on RCC
cells, although it was less potent than the control drug,
epirubicin (Fig. 6). ACHN cells
cultured in monolayer were sensitive to epirubicin (Epi, 1 µM) and
low-dose sunitinib (Su1, 1 µM; Fig.
6A). However, a higher concentration of the drug (Su10, 10 µM)
in this model promoted the survival of cells isolated from
spheroids. A lower number of spheres was observed only after
epirubicin addition (Fig. 6C).
Moreover, in the StemXvivo ACHN cell culture, addition of sunitinib
at a low concentration to formed 3D spheres was toxic and halted
cells in the G0/G1 phase (Fig. 7A).
3D structures formed by ACHN cells also had enhanced resistance to
epirubicin (Fig. 6A). These cells
were also resistant to S phase arrest found in 2D conditions and
accumulated in the G0/G1 phase (Fig.
7A) and had downregulated CSC-related genes in response to
epirubicin (data not shown). In Caki-1 cells that had already
compromised viability in the 3D structures (Fig. 2B), epirubicin further reduced the
percentage of live cells; the addition of the drug to formed 3D
structures had a strong cytotoxic effect. The percentage of live
cells recovered from spheres after epirubicin treatment was lower
than that noted in the monolayer culture (Fig. 6B) although in the Alamar Blue assay 3D
cultures were more resistant to the drug (Fig. 4B). At the same time, there was no
effect of Epi on the cell cycle; the cells were protected from a G2
arrest (observed in the monolayer culture), especially in Nutristem
medium where simultaneously a slight increase in the G0/G1
contribution was observed (Fig. 7B).
Caki-1 cells in the monolayer were sensitive to sunitinib in a
dose-dependent manner (Fig. 6B) as
observed previously (Fig. 4B) with S
phase arrest at a low dose only. At the higher concentration in
response to Su, the cells accumulated rather in the G2 phase, as it
was observed for Epi treatment. In the case of the 3D culture, only
the StemXvivo variant maintained an enhanced resistance to Su (at
the lower tested concentration) observed in the initial experiment;
simultaneously these cells accumulated in the G2 phase of the cell
cycle. In growth factor deprivation medium (Nutristem medium), 10
µM sunitinib and epirubicin affected the cell cycle by retaining
cells in the G0/G1 phase (Fig.
7B).
Discussion
In the present study, using bio-mimic 3D renal cell
carcinoma (RCC) cell culture systems, we aimed to investigate the
drug susceptibility of cells in a model more relevant to in
vivo conditions (45) in terms of
cell-cell interactions, cancer stem cell subpopulation presence and
intratumoral hypoxia (51,52). We previously demonstrated that
tyrosine kinase inhibitors (TKIs) are directly active against RCC
stem cells (35). We also
demonstrated that metastatic RCC cell lines (ACHN and Caki-1) had
higher colony-forming ability in comparison to primary RCC cell
lines (53), and that the ACHN cell
line cultured under sphere formation induction conditions [b27 1X,
epidermal growth factor (20 ng/ml) and basic fibroblast growth
factor (25 ng/ml)] harbored a stem-like subpopulation (16). In the present study, we continued to
describe specific factors influencing RCC and RCC-CSC 3D growth and
verification of the altered drug susceptibility of RCC cells grown
in 3D and molecular changes evoked by these growth conditions. We
previously demonstrated that RCC-CSCs from primary tumors are
targeted by TKIs (35) and here we
described how metastatic tumor-derived cells behave under TKI
treatment and how 3D growth alters drug susceptibility in RCC. With
this we aimed to develop a system for future novel drug testing
that would be more relevant for pre-clinical research than the
standard 2D RPMI-based culture.
In the first step, optimal RCC cell 3D growth
conditions and characteristics of resultant spheroids were
described. In our model, StemXVivo or Nutristem media on
poly-D-lysine-coated plates for ACHN and laminin-coated plates for
Caki-1 were the most efficient conditions for promoting 3D growth
of cells and these sets should be used in further studies. As
epithelial mesenchymal transition (EMT) is an important step for
cancer cells to acquire metastatic capability and malignant tumor
progression, mesenchymal stem cell-inducing medium (StemXvivo) was
used to activate cells. EMT is characterized by a phenotypic
switch-acquisition of a fibroblast-like morphology, reducing cell
polarity and cell-to-cell contacts (54). In accordance with this, we
demonstrated reduced expression of the gene encoding E-cadherin
(CDH1) epithelial marker and upregulation of the gene
encoding N-cadherin (CDH2) mesenchymal marker in Caki-1
cells in mesenchymal medium on a laminin surface, which is the most
important characteristic of cancer cells undergoing EMT. Moreover,
anchorage-dependent cells cultured in low or serum-free media need
cell-adhesive molecules for adequate cell attachment and spreading.
These molecules are cell-specific and this was also confirmed for
RCC. Optimal spheroid growth was shown for ACHN cells cultured on a
poly-D-lysine-coated surface and Caki-1 cells cultured on laminin.
Previously it was shown that association of laminin may serve as a
stimulatory scaffold to support 3D growth and in melanoma stem
cells it was found to upregulate the genes encoding Nestin and
vascular endothelial growth factor receptor-1 (VEGFR-1). Laminin
also promoted melanoma cell mitogenesis, growth and migration and
as we report here this is also true for RCC cells (55). Moreover, under growth factor
deprivation conditions (Nutristem medium) when attached to laminin
the viability of cells in spheroids was reduced when compared to
the standard 2D culture (Fig. 5B),
suggesting the presence of necrotic areas inside these structures.
In vivo, overexpression of HIF1 in these cells
(Fig. 3B) may be related to reduced
pO2 inside spheroids measured by electron paramagnetic
resonance (EPR) as previously observed (56). In this previous study, the authors
observed that the smallest spheroid had the smallest hypoxic zone.
Hypoxia inside the tumor mass is widely observed in vivo
(57–60), therefore the developed 3D model can
indeed present a more biologically relevant alternative to standard
monolayer cultures. Moreover, decreased expression of stem-related
genes and the increase in the expression of the CDH1 gene
encoding E-cadherin may indicate a low level of aggressiveness of
the Nutristem/laminin model. In contrast, our results suggest that
the StemXvivo/laminin culture variant of Caki-1 cells represents a
potentially CSC-rich RCC culture. It was observed that individual
cells were detaching from these spheres-cell shedding; this may
suggest increased metastatic potential of these cells (61).
Although the presented culture conditions induced
the formation of 3D structures by the tested cell lines, structures
were heterogeneous with a limited number of CSCs within. Mostly,
formation of the 3D structures coincided with an increase in the S
phase of the cell cycle, but the expression of CSC-related genes
was variable as defined by expression of stem transcription factors
(OCT4, SOX2, NES) and RCC CSC putative markers (CD105,
CD133).
Additionally, in one culture variant (Caki-1 cells
on laminin surface and Nutristem medium) an increase in HIF1
expression occurred together with VEGF downregulation. In
the other Caki-1 culture variant (StemXvivo medium), we observed
the indication of EMT as CDH1 expression decreased with
simultaneous upregulation of CDH2 while the expression of
CSC-related genes, apart from NESTIN and SOX2, was
decreased. This may be due to unaltered expression of the
HIF1/2 genes which were shown to regulate the transcription
factors responsible for cell pluripotency (62–64). We
believe that the CSC gene expression pattern also changed as a
consequence of long-term incubation while with sphere growth
heterogeneity of cells increased as has been shown in other models
(65–68). We also believe similarly that dynamic
changes in pO2-mediated HIF expression are responsible
for the observed results in prolonged 3D cultures (69,70).
Secondly, our research also aimed to verify the
possibility to target CSCs in renal cancer by an antibiotic
treatment that was reported to be effective in other cancers
(41). Standard concentration of
penicillin and streptomycin did not alter the spheroid forming
ability of the tested RCC cells and was found to be safe for 3D
experiments while it affects 3D growth at high concentrations.
However, this may not apply to different cancers or even other, not
assayed, RCC cell lines (41).
Penicillin-streptomycin enhanced Caki-1 2D cell growth as observed
previously for colon cancer cell lines (42), but its mechanism requires further
analysis. The tested RCC cell lines were also insensitive to
azithromycin, both the 2D and the sphere-forming population. In
contrast, doxycycline was cytotoxic to RCC cells and spheroids with
CSCs being more resistant than 2D cultured cells. Doxycycline
targets mitochondria, due to homology of bacterial and
mitochondrial ribosomes (71) and it
may be that differential resistance to the drug characteristic for
the 3D structures is a consequence of altered glycolytic metabolism
(72). However, unresponsiveness to
the other tested mitochondrial-targeting antibiotics remains to be
explained. Tetracyclines including doxycycline also inhibit the
activity of metalloproteinases (MMPs) which were shown to be
important players in tumor progression (73), also in the case of RCC (74–76) and
cells in spheroids are expected to express higher levels of MMPs
(77). The mechanism of the cytotoxic
effect of doxycycline against RCC cells needs to be elucidated.
In the final step, we analyzed the effects of
cytotoxic and targeted drugs, epirubicin or sunitinib, on the RCC
cells grown in spheroid cultures. Sunitinib was also tested as it
was repeatedly reported that despite its antiangiogenic activity,
this molecule also possesses a direct antitumor effect in
vitro inducing apoptosis of RCC cells (44,78) in
clinically relevant intratumoral concentrations (79). In our experiments, sunitinib exerted a
visible anti-RCC activity at a concentration as low as 0.4 µM
against cells cultured in the monolayer (Fig. 4). Cell proliferation was inhibited by
sunitinib both in a mesenchymal phenotype (StemXvivo culture) and
growth factor deprivation (Nutristem) conditions, which confirms
its activity against CSCs (35).
Higher concentrations of the drug were needed to effectively
inhibit cells in 3D than those grown in 2D and the metastatic ACHN
cell line was more susceptible (lower IC50 values). This
is consistent with data reported for various in vitro cancer
models (80–82). Moreover, increased resistance to
cytotoxic drugs is suggested to result from the presence of CSCs in
3D cultures (83). Changes induced by
the employed 3D culture conditions altered the RCC cell reaction to
drugs. However, cells which were forming 3D structures were more
resistant to the drug only when initially their viability was
enhanced by the spheroid formation-promoting media. Since cell
lines showed a consistent resistance to the drug in 3D spheroids
(Fig. 4) we hypothesize that the drug
resistance mechanism is activated in the CSC population (84). In accordance with this, ACHN spheroids
in StemXVivo medium upon sunitinib treatment accumulated in the
G0/G1 phase, which indicates that cell quiescence may be
responsible for CSC drug resistance (85,86). On
the contrary, a different mechanism seems to underlie Caki-1
resistance. Caki-1 spheroid-derived cells were found to shift to
the G2/M cell cycle phase upon sunitinib treatment. We believe that
this is a result of sunitinib inducing the cells to re-enter the
cell cycle, from a population of G0/1 untreated cells, and as a
result enhanced growth in 3D in response to the treatment.
The mechanism of epirubicin cellular toxicity was
shown previously to be cell line dependent (87). Concordantly in our study, the Caki-1
cell line was more resistant to epirubicin than ACHN cells
(Table IV). Furthermore, ACHN and
Caki-1 cell growth in a monolayer was arrested by the drug in the S
or G2 phase, respectively. The addition of epirubicin to
3D-cultured cells modified the cell cycle distribution. In
particular, epirubicin-resistant ACHN cells accumulated in the
G0/G1 phase which was previously associated with enhanced cell
resistance (88). On the other hand,
Caki-1 spheroid cells, which had reduced viability after epirubicin
treatment in comparison to 2D culture, showed weak changes in the
cell cycle with a small number of cells undergoing G2 arrest. This
may be due to the lower contribution of spheroid-forming cells in
the ACHN cell line, as opposed to Caki-1; there were remaining
adherent cells in the culture (Fig.
1) which may have mediated a less pronounced effect on cell
growth. This confirms previous research showing that cancer
stem-like cells from tumor spheres are more resistant to epirubicin
(89).
In the present study, we developed feasible and
consistent methods for culturing RCC spheroids for two different
cell lines using specific media and a surface coating stimulation
method. We characterized in detail the necessary growth conditions
for these cell lines as well as the growth viability over the
duration of the spheroid growth. Our results revealed that the
formation of spheres or 3D structures partially results from CSC
phenotype induction upon epithelial-mesenchymal transition (EMT).
We screened four types of 3D cultures that induced a different cell
morphology and altered cell characteristics. Although 3D-grown
cells tended to be more drug-resistant than those cultured in a
standard monolayer, this phenomenon was dependent on the adopted
protocol of cell viability measurement (Alamar Blue assay during
culture or direct viability of cells isolated from spheres).
Therefore, the results obtained from the 3D cultured cells need to
be analyzed with caution in respect to cell specificity. Our model
may also be of interest to understand issues related to hypoxia and
growth necrosis in tumor spheroids. 3D spheroids are a useful model
to determine the morphological growth characteristics of cell lines
which are not found in routine 2D culture methods. 3D culture
methods may provide a better alternative to study the process of
epithelial-mesenchymal transition. Spheroids may be used as assays
for stem cell activity and cancer cell self-renewal and RCC
tumorigenesis and therefore represent a novel model for exploring
RCC pathobiology. Due to the more complex architecture they may be
more relevant to the in vivo tumor drug response.
Acknowledgements
The authors thank Mr. Paweł Krasowski for the
administrative support of the research projects and Professor M.
Rękas, Scientific Director of the Military Institute of Medicine
for the continued support of the research.
Funding
The study was supported by the National Centre for
Research and Development (NCBR, Poland) LIDER grant no.
Lider/031/625/L-4/12/NCBR/2013. The cost of publication was
supported by Military Institute of Medicine statutory scientific
funding.
Availability of data and materials
Raw data is available upon E-mail request from KKB
(kbrodaczewska@wim.mil.pl;
ORCID: 0000-0003-2374-3600) and ZFB (lom@wim.mil.pl; ORCID:
0000-0002-1454-5437) or Science Department of the Military
Institute of Medicine (Wojskowy Instytut Medyczny, Pion Nauki
01-141 Warszawa 44, ul. Szaserów 128, pionnauki@wim.mil.pl; nauka@wim.mil.pl; http://www.wim.mil.pl/nauka).
Authors' contributions
AMC designed the study, was responsible for
acquisition of funding, developed the research conception, design
and methodology, participated in data analysis and interpretation
of data and manuscript drafting and revision. KKB, ZBF and KMO
developed the research methods, participated in acquisition of data
and manuscript writing including revisions. CS supervised revised
it critically for important intellectual content; CP developed the
concept and methods of the study, provided selected reagents. EB
interpreted the data, edited and revised the manuscript. All
authors approved the final manuscript and agree to be accountable
for all aspects of the research in ensuring that the accuracy or
integrity of any part of the work are appropriately investigated
and resolved.
Ethics approval and consent to
participate
Not applicable.
Patient consent for publication
Not applicable.
Competing interests
The authors declare that they have no competing
interests.
References
|
1
|
Meyerrose TE, Herrbrich P, Hess DA and
Nolta JA: Immune-deficient mouse models for analysis of human stem
cells. BioTechniques. 35:1262–1272. 2003. View Article : Google Scholar : PubMed/NCBI
|
|
2
|
Gedye C, Sirskyj D, Lobo NC, Meens J,
Hyatt E, Robinette M, Fleshner N, Hamilton RJ, Kulkarni G, Zlotta
A, et al: Cancer stem cells are underestimated by standard
experimental methods in clear cell renal cell carcinoma. Sci Rep.
6:252202016. View Article : Google Scholar : PubMed/NCBI
|
|
3
|
Grotenhuis BA, Wijnhoven BP and van
Lanschot JJ: Cancer stem cells and their potential implications for
the treatment of solid tumors. J Surg Oncol. 106:209–215. 2012.
View Article : Google Scholar : PubMed/NCBI
|
|
4
|
Buczek M, Escudier B, Bartnik E, Szczylik
C and Czarnecka A: Resistance to tyrosine kinase inhibitors in
clear cell renal cell carcinoma: From the patient's bed to
molecular mechanisms. Biochim Biophys Acta. 1845:31–41.
2014.PubMed/NCBI
|
|
5
|
Bielecka ZF, Czarnecka AM, Solarek W,
Kornakiewicz A and Szczylik C: Mechanisms of acquired resistance to
tyrosine kinase inhibitors in clear-cell renal cell carcinoma
(ccRCC). Curr Signal Transduct Ther. 8:218–228. 2014. View Article : Google Scholar : PubMed/NCBI
|
|
6
|
Bussolati B, Bruno S, Grange C, Ferrando U
and Camussi G: Identification of a tumor-initiating stem cell
population in human renal carcinomas. FASEB J. 22:3696–3705. 2008.
View Article : Google Scholar : PubMed/NCBI
|
|
7
|
Czarnecka A, Matak D, Solarek W, Khan M
and Szczylik C: Hypoxia response regulates clear cell renal cell
carcinoma tumor initiating cells. BJU Int. 112:1–17. 2013.
|
|
8
|
Debeb BG, Zhang X, Krishnamurthy S, Gao H,
Cohen E, Li L, Rodriguez AA, Landis MD, Lucci A, Ueno NT, et al:
Characterizing cancer cells with cancer stem cell-like features in
293T human embryonic kidney cells. Mol Cancer. 9:1802010.
View Article : Google Scholar : PubMed/NCBI
|
|
9
|
Gassenmaier M, Chen D, Buchner A, Henkel
L, Schiemann M, Mack B, Schendel DJ, Zimmermann W and Pohla H: CXC
chemokine receptor 4 is essential for maintenance of renal cell
carcinoma-initiating cells and predicts metastasis. Stem Cells.
31:1467–1476. 2013. View Article : Google Scholar : PubMed/NCBI
|
|
10
|
Ueda K, Ogasawara S, Akiba J, Nakayama M,
Todoroki K, Ueda K, Sanada S, Suekane S, Noguchi M, Matsuoka K and
Yano H: Aldehyde dehydrogenase 1 identifies cells with cancer stem
cell-like properties in a human renal cell carcinoma cell line.
PLoS One. 8:e754632013. View Article : Google Scholar : PubMed/NCBI
|
|
11
|
Khan MI, Czarnecka AM, Lewicki S,
Helbrecht I, Brodaczewska K, Koch I, Zdanowski R, Król M and
Szczylik C: Comparative gene expression profiling of primary and
metastatic renal cell carcinoma stem cell-like cancer cells. PLoS
One. 11:e01657182016. View Article : Google Scholar : PubMed/NCBI
|
|
12
|
Hu J, Guan W, Liu P, Dai J, Tang K, Xiao
H, Qian Y, Sharrow AC, Ye Z, Wu L and Xu H: Endoglin is essential
for the maintenance of self-renewal and chemoresistance in renal
cancer stem cells. Stem Cell Reports. 9:464–477. 2017. View Article : Google Scholar : PubMed/NCBI
|
|
13
|
Beaver CM, Ahmed A and Masters JR:
Clonogenicity: Holoclones and meroclones contain stem cells. PLoS
One. 9:e898342014. View Article : Google Scholar : PubMed/NCBI
|
|
14
|
Rappa G, Mercapide J, Anzanello F,
Prasmickaite L, Xi Y, Ju J, Fodstad O and Lorico A: Growth of
cancer cell lines under stem cell-like conditions has the potential
to unveil therapeutic targets. Exp Cell Res. 314:2110–2122. 2008.
View Article : Google Scholar : PubMed/NCBI
|
|
15
|
Lichner Z, Saleh C, Subramaniam V,
Seivwright A, Prud'homme GJ and Yousef GM: miR-17 inhibition
enhances the formation of kidney cancer spheres with stem
cell/tumor initiating cell properties. Oncotarget. 6:5567–5581.
2015. View Article : Google Scholar : PubMed/NCBI
|
|
16
|
Matak D, Brodaczewska KK, Szczylik C, Koch
I, Myszczyszyn A, Lipiec M, Lewicki S, Szymanski L, Zdanowski R and
Czarnecka AM: Functional significance of CD105-positive cells in
papillary renal cell carcinoma. BMC Cancer. 17:212017. View Article : Google Scholar : PubMed/NCBI
|
|
17
|
Matak D, Szymanski L, Szczylik C,
Sledziewski R, Lian F, Bartnik E, Sobocinska A and Czarnecka AM:
Biology of renal tumour cancer stem cells applied in medicine.
Contemp Oncol (Pozn). 19:A44–A51. 2015.PubMed/NCBI
|
|
18
|
Czarnecka AM and Szczylik C: Renal cell
carcinoma cancer stem cells as therapeutic targets. Curr Sign Trans
Ther. 8:203–209. 2013. View Article : Google Scholar
|
|
19
|
Peired AJ, Sisti A and Romagnani P: Renal
cancer stem cells: Characterization and targeted therapies. Stem
Cells Int. 2016:83426252016. View Article : Google Scholar : PubMed/NCBI
|
|
20
|
Bomken S, Fiser K, Heidenreich O and
Vormoor J: Understanding the cancer stem cell. Br J Cancer.
103:439–445. 2011. View Article : Google Scholar
|
|
21
|
Nakano I and Chiocca EA: Finding drugs
against CD133+ glioma subpopulations. J Neurosurg. 114:648–650.
2011. View Article : Google Scholar : PubMed/NCBI
|
|
22
|
Qiu W, Wang X, Leibowitz B, Liu H, Barker
N, Okada H, Oue N, Yasui W, Clevers H, Schoen RE, et al:
Chemoprevention by nonsteroidal anti-inflammatory drugs eliminates
oncogenic intestinal stem cells via SMAC-dependent apoptosis. Proc
Natl Acad Sci USA. 107:20027–20032. 2010. View Article : Google Scholar : PubMed/NCBI
|
|
23
|
Prud'homme GJ, Glinka Y, Toulina A, Ace O,
Subramaniam V and Jothy S: Breast cancer stem-like cells are
inhibited by a non-toxic aryl hydrocarbon receptor agonist. PLoS
One. 5:e138312010. View Article : Google Scholar : PubMed/NCBI
|
|
24
|
Morrison R, Schleicher SM, Sun Y, Niermann
KJ, Kim S, Spratt DE, Chung CH and Lu B: Targeting the mechanisms
of resistance to chemotherapy and radiotherapy with the cancer stem
cell hypothesis. J Oncol. 2011:9418762011. View Article : Google Scholar : PubMed/NCBI
|
|
25
|
Escudier B, Eisen T, Stadler WM, Szczylik
C, Oudard S, Siebels M, Negrier S, Chevreau C, Solska E, Desai AA,
et al: Sorafenib in advanced clear-cell renal-cell carcinoma. N
Engl J Med. 356:125–134. 2007. View Article : Google Scholar : PubMed/NCBI
|
|
26
|
Motzer RJ, Hutson TE, Tomczak P,
Michaelson MD, Bukowski RM, Rixe O, Oudard S, Negrier S, Szczylik
C, Kim ST, et al: Sunitinib versus interferon alfa in metastatic
renal-cell carcinoma. N Engl J Med. 356:115–124. 2007. View Article : Google Scholar : PubMed/NCBI
|
|
27
|
Sternberg CN, Davis ID, Mardiak J,
Szczylik C, Lee E, Wagstaff J, Barrios CH, Salman P, Gladkov OA,
Kavina A, et al: Pazopanib in locally advanced or metastatic renal
cell carcinoma: Results of a randomized phase III trial. J Clin
Oncol. 28:1061–1068. 2011. View Article : Google Scholar
|
|
28
|
Yuan ZX, Mo J, Zhao G, Shu G, Fu HL and
Zhao W: Targeting strategies for renal cell carcinoma: From renal
cancer cells to renal cancer stem cells. Front Pharmacol.
7:4232016. View Article : Google Scholar : PubMed/NCBI
|
|
29
|
Roskoski R Jr: Sunitinib: A VEGF and PDGF
receptor protein kinase and angiogenesis inhibitor. Biochem Biophys
Res Commun. 356:323–328. 2007. View Article : Google Scholar : PubMed/NCBI
|
|
30
|
Karaman MW, Herrgard S, Treiber DK,
Gallant P, Atteridge CE, Campbell BT, Chan KW, Ciceri P, Davis MI,
Edeen PT, et al: A quantitative analysis of kinase inhibitor
selectivity. Nat Biotechnol. 26:127–132. 2008. View Article : Google Scholar : PubMed/NCBI
|
|
31
|
Huang D, Ding Y, Li Y, Luo WM, Zhang ZF,
Snider J, Vandenbeldt K, Qian CN and the BT: Sunitinib acts
primarily on tumor endothelium rather than tumor cells to inhibit
the growth of renal cell carcinoma. Cancer Res. 70:1053–1062. 2010.
View Article : Google Scholar : PubMed/NCBI
|
|
32
|
Brossa A, Grange C, Mancuso L, Annaratone
L, Satolli MA, Mazzone M, Camussi G and Bussolati B: Sunitinib but
not VEGF blockade inhibits cancer stem cell endothelial
differentiation. Oncotarget. 6:11295–11309. 2015. View Article : Google Scholar : PubMed/NCBI
|
|
33
|
Potapova O, Laird AD, Nannini MA, Barone
A, Li G, Moss KG, Cherrington JM and Mendel DB: Contribution of
individual targets to the antitumor efficacy of the multitargeted
receptor tyrosine kinase inhibitor SU11248. Mol Cancer Ther.
5:1280–1289. 2006. View Article : Google Scholar : PubMed/NCBI
|
|
34
|
Abrams TJ, Murray LJ, Pesenti E, Holway
VW, Colombo T, Lee LB, Cherrington JM and Pryer NK: Preclinical
evaluation of the tyrosine kinase inhibitor SU11248 as a single
agent and in combination with ‘standard of care’ therapeutic agents
for the treatment of breast cancer. Mol Cancer Ther. 2:1011–1021.
2003.PubMed/NCBI
|
|
35
|
Czarnecka AM, Solarek W, Kornakiewicz A
and Szczylik C: Tyrosine kinase inhibitors target cancer stem cells
in renal cell cancer. Oncol Rep. 35:1433–1442. 2016. View Article : Google Scholar : PubMed/NCBI
|
|
36
|
Diaz R, Nguewa PA, Redrado M, Manrique I
and Calvo A: Sunitinib reduces tumor hypoxia and angiogenesis, and
radiosensitizes prostate cancer stem-like cells. Prostate.
75:1137–1149. 2015. View Article : Google Scholar : PubMed/NCBI
|
|
37
|
Varna M, Gapihan G, Feugeas JP, Ratajczak
P, Tan S, Ferreira I, Leboeuf C, Setterblad N, Duval A, Verine J,
et al: Stem cells increase in numbers in perinecrotic areas in
human renal cancer. Clin Cancer Res. 21:916–924. 2015. View Article : Google Scholar : PubMed/NCBI
|
|
38
|
Zhu Y, Liu H, Xu L, An H, Liu W, Liu Y,
Lin Z and Xu J: p21-activated kinase 1 determines stem-like
phenotype and sunitinib resistance via NF-kappaB/IL-6 activation in
renal cell carcinoma. Cell Death Dis. 6:e16372015. View Article : Google Scholar : PubMed/NCBI
|
|
39
|
Chinchar E, Makey KL, Gibson J, Chen F,
Cole SA, Megason GC, Vijayakumar S, Miele L and Gu JW: Sunitinib
significantly suppresses the proliferation, migration, apoptosis
resistance, tumor angiogenesis and growth of triple-negative breast
cancers but increases breast cancer stem cells. Vasc Cell.
6:122014. View Article : Google Scholar : PubMed/NCBI
|
|
40
|
Conley SJ, Gheordunescu E, Kakarala P,
Newman B, Korkaya H, Heath AN, Clouthier SG and Wicha MS:
Antiangiogenic agents increase breast cancer stem cells via the
generation of tumor hypoxia. Proc Natl Acad Sci USA. 109:2784–2789.
2012. View Article : Google Scholar : PubMed/NCBI
|
|
41
|
Lamb R, Ozsvari B, Lisanti CL, Tanowitz
HB, Howell A, Martinez-Outschoorn UE, Sotgia F and Lisanti MP:
Antibiotics that target mitochondria effectively eradicate cancer
stem cells, across multiple tumor types: Treating cancer like an
infectious disease. Oncotarget. 6:4569–4584. 2015. View Article : Google Scholar : PubMed/NCBI
|
|
42
|
Relier S, Yazdani L, Ayad O, Choquet A,
Bourgaux JF, Prudhomme M, Pannequin J, Macari F and David A:
Antibiotics inhibit sphere-forming ability in suspension culture.
Cancer Cell Int. 16:62016. View Article : Google Scholar : PubMed/NCBI
|
|
43
|
Mays AN, Osheroff N, Xiao Y, Wiemels JL,
Felix CA, Byl JA, Saravanamuttu K, Peniket A, Corser R, Chang C, et
al: Evidence for direct involvement of epirubicin in the formation
of chromosomal translocations in t(15;17) therapy-related acute
promyelocytic leukemia. Blood. 115:326–330. 2010. View Article : Google Scholar : PubMed/NCBI
|
|
44
|
Jiang XL, Zhang Y, Luo CL and Wu XH:
Targeting renal cell carcinoma with gambogic acid in combination
with sunitinib in vitro and in vivo. Asian Pac J Cancer Prev.
13:6463–6468. 2012. View Article : Google Scholar : PubMed/NCBI
|
|
45
|
Bielecka ZF, Maliszewska-Olejniczak K,
Safir IJ, Szczylik C and Czarnecka AM: Three-dimensional cell
culture model utilization in cancer stem cell research. Biol Rev
Camb Philos Soc. 92:1505–1520. 2017. View Article : Google Scholar : PubMed/NCBI
|
|
46
|
Brodaczewska KK, Szczylik C, Fiedorowicz
M, Porta C and Czarnecka AM: Choosing the right cell line for renal
cell cancer research. Mol Cancer. 15:832016. View Article : Google Scholar : PubMed/NCBI
|
|
47
|
Kim S and Alexander CM: Tumorsphere assay
provides more accurate prediction of in vivo responses to
chemotherapeutics. Biotechnol Lett. 36:481–488. 2014. View Article : Google Scholar : PubMed/NCBI
|
|
48
|
Livak KJ and Schmittgen TD: Analysis of
relative gene expression data using real-time quantitative PCR and
the 2(-Delta Delta C(T)) method. Methods. 25:402–408. 2001.
View Article : Google Scholar : PubMed/NCBI
|
|
49
|
Wierzbicki PM, Klacz J, Rybarczyk A,
Slebioda T, Stanislawowski M, Wronska A, Kowalczyk A, Matuszewski M
and Kmiec Z: Identification of a suitable qPCR reference gene in
metastatic clear cell renal cell carcinoma. Tumour Biol.
35:12473–12487. 2014. View Article : Google Scholar : PubMed/NCBI
|
|
50
|
Maliszewska-Olejniczak K, Brodaczewska KK,
Bielecka ZF and Czarnecka AM: Three-dimensional cell culture model
utilization in renal carcinoma cancer stem cell research. Methods
Mol Biol. 1817:47–66. 2018. View Article : Google Scholar : PubMed/NCBI
|
|
51
|
Kaminska K, Szczylik C, Bielecka ZF,
Bartnik E, Porta C, Lian F and Czarnecka AM: The role of the
cell-cell interactions in cancer progression. J Cell Mol Med.
19:283–296. 2015. View Article : Google Scholar : PubMed/NCBI
|
|
52
|
Myszczyszyn A, Czarnecka AM, Matak D,
Szymanski L, Lian F, Kornakiewicz A, Bartnik E, Kukwa W, Kieda C
and Szczylik C: The role of hypoxia and cancer stem cells in renal
cell carcinoma pathogenesis. Stem Cell Rev. 11:919–943. 2015.
View Article : Google Scholar :
|
|
53
|
Khan MI, Debski KJ, Dabrowski M, Czarnecka
AM and Szczylik C: Gene set enrichment analysis and ingenuity
pathway analysis of metastatic clear cell renal cell carcinoma cell
line. Am J Physiol Renal Physiol. 311:F424–F436. 2016. View Article : Google Scholar : PubMed/NCBI
|
|
54
|
Zhou N, Lu F, Liu C, Xu K, Huang J, Yu D
and Bi L: IL-8 induces the epithelial-mesenchymal transition of
renal cell carcinoma cells through the activation of AKT signaling.
Oncol Lett. 12:1915–1920. 2016. View Article : Google Scholar : PubMed/NCBI
|
|
55
|
Larson AR, Lee CW, Lezcano C, Zhan Q,
Huang J, Fischer AH and Murphy GF: Melanoma spheroid formation
involves laminin-associated vasculogenic mimicry. Am J Pathol.
184:71–78. 2014. View Article : Google Scholar : PubMed/NCBI
|
|
56
|
Langan LM, Dodd NJ, Owen SF, Purcell WM,
Jackson SK and Jha AN: Direct Measurements of Oxygen Gradients in
Spheroid Culture System Using Electron Parametric Resonance
Oximetry. PLoS One. 11:e01494922016. View Article : Google Scholar : PubMed/NCBI
|
|
57
|
Zheng X, Wang X, Mao H, Wu W, Liu B and
Jiang X: Hypoxia-specific ultrasensitive detection of tumours and
cancer cells. Nat Commun. 6:58342015. View Article : Google Scholar : PubMed/NCBI
|
|
58
|
Lal A, Peters H, St Croix B, Haroon ZA,
Dewhirst MW, Strausberg RL, Kaanders JH, van der Kogel AJ and
Riggins GJ: Transcriptional response to hypoxia in human tumors. J
Natl Cancer Inst. 93:1337–1343. 2019. View Article : Google Scholar
|
|
59
|
McKenna1 DJ, Errington R and Pors K:
Current challenges and opportunities in treating hypoxic prostate
tumors. J Cancer Metastasis Treat. 4:112018. View Article : Google Scholar
|
|
60
|
Ponte KF, Berro DH, Collet S, Constans JM,
Emery E, Valable S and Guillamo JS: In vivo relationship between
hypoxia and angiogenesis in human glioblastoma: A multimodal
imaging study. J Nucl Med. 58:1574–1579. 2017. View Article : Google Scholar : PubMed/NCBI
|
|
61
|
Gunther S, Ruhe C, Derikito MG, Bose G,
Sauer H and Wartenberg M: Polyphenols prevent cell shedding from
mouse mammary cancer spheroids and inhibit cancer cell invasion in
confrontation cultures derived from embryonic stem cells. Cancer
Lett. 250:25–35. 2007. View Article : Google Scholar : PubMed/NCBI
|
|
62
|
Moreno-Manzano V, Rodriguez-Jimenez FJ,
Acena-Bonilla JL, Fustero-Lardíes S, Erceg S, Dopazo J, Montaner D,
Stojkovic M and Sánchez-Puelles JM: FM19G11, a new
hypoxia-inducible factor (HIF) modulator, affects stem cell
differentiation status. J Biol Chem. 285:1333–1342. 2010.
View Article : Google Scholar : PubMed/NCBI
|
|
63
|
Covello KL, Kehler J, Yu H, Gordan JD,
Arsham AM, Hu CJ, Labosky PA, Simon MC and Keith B: HIF-2alpha
regulates Oct-4: Effects of hypoxia on stem cell function,
embryonic development, and tumor growth. Genes Dev. 20:557–570.
2006. View Article : Google Scholar : PubMed/NCBI
|
|
64
|
Mathieu J, Zhang Z, Zhou W, Wang AJ,
Heddleston JM, Pinna CM, Hubaud A, Stadler B, Choi M, Bar M, et al:
HIF induces human embryonic stem cell markers in cancer cells.
Cancer Res. 71:4640–4652. 2011. View Article : Google Scholar : PubMed/NCBI
|
|
65
|
Min SO, Lee SW, Bak SY and Kim KS: Ideal
sphere-forming culture conditions to maintain pluripotency in a
hepatocellular carcinoma cell lines. Cancer Cell Int. 15:952015.
View Article : Google Scholar : PubMed/NCBI
|
|
66
|
Gupta PB, Fillmore CM, Jiang G, Shapira
SD, Tao K, Kuperwasser C and Lander ES: Stochastic state
transitions give rise to phenotypic equilibrium in populations of
cancer cells. Cell. 146:633–644. 2011. View Article : Google Scholar : PubMed/NCBI
|
|
67
|
Chen YC, Cheng YH, Ingram P and Yoon E:
Single cell proteolytic assays to investigate cancer clonal
heterogeneity and cell dynamics using an efficient cell loading
scheme. Sci Rep. 6:271542016. View Article : Google Scholar : PubMed/NCBI
|
|
68
|
Pece S, Tosoni D, Confalonieri S, Mazzarol
G, Vecchi M, Ronzoni S, Bernard L, Viale G, Pelicci PG and Di Fiore
PP: Biological and Molecular Heterogeneity of Breast Cancers
Correlates with Their Cancer Stem Cell Content. Cell. 140:62–73.
2010. View Article : Google Scholar : PubMed/NCBI
|
|
69
|
Nguyen LK, Cavadas MA, Scholz CC,
Fitzpatrick SF, Bruning U, Cummins EP, Tambuwala MM, Manresa MC,
Kholodenko BN, Taylor CT and Cheong A: A dynamic model of the
hypoxia-inducible factor 1α (HIF-1α) network. J Cell Sci.
126:1454–1463. 2013. View Article : Google Scholar : PubMed/NCBI
|
|
70
|
Lafleur VN, Richard S and Richard DE:
Transcriptional repression of hypoxia-inducible factor-1 (HIF-1) by
the protein arginine methyltransferase PRMT1. Mol Biol Cell.
25:925–935. 2014. View Article : Google Scholar : PubMed/NCBI
|
|
71
|
Wang X, Ryu D, Houtkooper RH and Auwerx J:
Antibiotic use and abuse: a threat to mitochondria and chloroplasts
with impact on research, health, and environment. Bioessays.
37:1045–1053. 2015. View Article : Google Scholar : PubMed/NCBI
|
|
72
|
Sancho P, Barneda D and Heeschen C:
Hallmarks of cancer stem cell metabolism. Br J Cancer.
114:1305–1312. 2016. View Article : Google Scholar : PubMed/NCBI
|
|
73
|
Gialeli C, Theocharis AD and Karamanos NK:
Roles of matrix metalloproteinases in cancer progression and their
pharmacological targeting. Febs J. 278:16–27. 2011. View Article : Google Scholar : PubMed/NCBI
|
|
74
|
Sumi T, Nakatani T, Yoshida H, Hyun Y,
Yasui T, Matsumoto Y, Nakagawa E, Sugimura K, Kawashima H and
Ishiko O: Expression of matrix metalloproteinases 7 and 2 in human
renal cell carcinoma. Oncol Rep. 10:567–570. 2003.PubMed/NCBI
|
|
75
|
Lin YW, Lee LM, Lee WJ, Chu CY, Tan P,
Yang YC, Chen WY, Yang SF, Hsiao M and Chien MH: Melatonin inhibits
MMP-9 transactivation and renal cell carcinoma metastasis by
suppressing Akt-MAPKs pathway and NF-κB DNA-binding activity. J
Pineal Res. 60:277–290. 2017. View Article : Google Scholar
|
|
76
|
Roomi MW, Ivanov V, Kalinovsky T,
Niedzwiecki A and Rath M: Modulation of human renal cell carcinoma
786-0 MMP-2 and MMP-9 activity by inhibitors and inducers in vitro.
Med Oncol. 23:245–250. 2006. View Article : Google Scholar : PubMed/NCBI
|
|
77
|
Shrivastava S, Steele R, Sowadski M,
Crawford SE, Varvares M and Ray RB: Identification of molecular
signature of head and neck cancer stem-like cells. Sci Rep.
5:78192015. View Article : Google Scholar : PubMed/NCBI
|
|
78
|
Xin H, Zhang C, Herrmann A, Du Y, Figlin R
and Yu H: Sunitinib inhibition of Stat3 induces renal cell
carcinoma tumor cell apoptosis and reduces immunosuppressive cells.
Cancer Res. 69:2506–2513. 2009. View Article : Google Scholar : PubMed/NCBI
|
|
79
|
Gotink KJ, Broxterman HJ, Labots M, de
Haas RR, Dekker H, Honeywell RJ, Rudek MA, Beerepoot LV, Musters
RJ, Jansen G, et al: Lysosomal sequestration of sunitinib: A novel
mechanism of drug resistance. Clin Cancer Res. 17:7337–7346. 2011.
View Article : Google Scholar : PubMed/NCBI
|
|
80
|
Liu H, Wang H, Li C, Zhang T, Meng X,
Zhang Y and Qian H: Spheres from cervical cancer cells display
stemness and cancer drug resistance. Oncol Lett. 12:2184–2188.
2016. View Article : Google Scholar : PubMed/NCBI
|
|
81
|
Sun FF, Hu YH, Xiong LP, Tu XY, Zhao JH,
Chen SS, Song J and Ye XQ: Enhanced expression of stem cell markers
and drug resistance in sphere-forming non-small cell lung cancer
cells. Int J Clin Exp Pathol. 8:6287–6300. 2015.PubMed/NCBI
|
|
82
|
Chen SF, Chang YC, Nieh S, Liu CL, Yang CY
and Lin YS: Nonadhesive culture system as a model of rapid sphere
formation with cancer stem cell properties. PLoS One. 7:e318642012.
View Article : Google Scholar : PubMed/NCBI
|
|
83
|
Harper LJ, Costea DE, Gammon L, Fazil B,
Biddle A and Mackenzie IC: Normal and malignant epithelial cells
with stem-like properties have an extended G2 cell cycle phase that
is associated with apoptotic resistance. BMC Cancer. 10:1662010.
View Article : Google Scholar : PubMed/NCBI
|
|
84
|
Fernandez-Fuente G, Mollinedo P, Grande L,
Vazquez-Barquero A and Fernandez-Luna JL: Culture dimensionality
influences the resistance of glioblastoma stem-like cells to
multikinase inhibitors. Mol Cancer Ther. 13:1664–1672. 2014.
View Article : Google Scholar : PubMed/NCBI
|
|
85
|
Chen W, Dong J, Haiech J, Kilhoffer MC and
Zeniou M: Cancer stem cell quiescence and plasticity as major
challenges in cancer therapy. Stem Cells Int. 2016:17409362016.
View Article : Google Scholar : PubMed/NCBI
|
|
86
|
Moore N and Lyle S: Quiescent,
slow-cycling stem cell populations in cancer: A review of the
evidence and discussion of significance. J Oncol. 2011:3960762011.
View Article : Google Scholar : PubMed/NCBI
|
|
87
|
Hedenfalk IA, Baldetorp B, Borg A and
Oredsson SM: Activated cell cycle checkpoints in epirubicin-treated
breast cancer cells studied by BrdUrd-flow cytometry. Cytometry.
29:321–327. 1997. View Article : Google Scholar : PubMed/NCBI
|
|
88
|
Grabarczyk P, Nahse V, Delin M, Przybylski
G, Depke M, Hildebrandt P, Völker U and Schmidt CA: Increased
expression of bcl11b leads to chemoresistance accompanied by G1
accumulation. PLoS One. 5(pii): e125322010. View Article : Google Scholar : PubMed/NCBI
|
|
89
|
Wang L, Guo H, Lin C, Yang L and Wang X:
Enrichment and characterization of cancer stemlike cells from a
cervical cancer cell line. Mol Med Rep. 9:2117–2123. 2014.
View Article : Google Scholar : PubMed/NCBI
|