Introduction
Hepatocellular carcinoma (HCC) is one of the most
commonly diagnosed cancers and the fourth most common cause of
cancer-related deaths in the world (1). More than 466,100 people are diagnosed
with liver cancer, and approximately 422,100 individuals succumb to
liver cancer annually in China (2).
Although multimodal therapies have been used to treat HCC in the
past several decades, the therapeutic outcomes of HCC are still
unsatisfactory due to post-surgical recurrence and treatment
resistance. Moreover, although numerous genes and signaling
pathways participating in the initiation and evolution of HCC have
been extensively discussed, the mechanisms underlying HCC
development and progression remain unclear. Recently, microarray
technology coupled with bioinformatics tools has been used to
identify the novel genes related to cancer progression, diagnosis
and prognosis. The major public databases such as The Cancer Genome
Atlas (TCGA), ONCOMINE, and Gene Expression Omnibus (GEO) are
powerful tools used to screen the differentially expressed genes
(DEGs) generated from microarray data corresponding to the
carcinogenesis and progression of HCC (3–7). These
tools can assist in the comprehension of the mechanisms behind the
occurrence and progression of HCC, and identify novel targets for
the diagnosis and prognosis of HCC. Thus, bioinformatics analysis
is a feasible and valuable method to screen DEGs from microarray
data and identify the core genes related to HCC progression and
prognosis.
In the present study, several mRNA microarray
datasets (GSE46408, GSE65372, and GSE84402) were selected from the
GEO database, in order to identify the genes correlated to HCC
progression and prognosis. Using the online tool GEO2R, DEGs
between HCC and non-cancerous liver tissues were obtained. Gene
Ontology (GO) annotation and Kyoto Encyclopedia of Genes and
Genomes (KEGG) pathway enrichment analyses were conducted to
further provide an overview of the function of the screened DEGs. A
protein-protein interaction network (PPIN) was constructed to
determine the hub genes associated with HCC. Survival analyses of
the screened hub genes were carried out using cBioPortal,
Kaplan-Meier plotter and Gene Expression Profiling Interactive
Analysis (GEPIA). The expression levels of the identified hub genes
were validated based on GEPIA, ONCOMINE, UCSC Xena browser and
Human Protein Atlas (HPA) online databases.
Materials and methods
Microarray data source
To obtain the mRNA expression datasets of HCC, the
following keywords: ‘Hepatocellular carcinoma’ and ‘Homo
sapiens’[porgn: txid9606]’, and ‘Expression profiling by array’
were searched against the GEO database. After a systematic review,
three GSE profiles (GSE46408, GSE65372, and GSE84402) were selected
and downloaded. GSE46408, GSE65372 and GSE84402 were based on
GPL4133 (Agilent-014850 Whole Human Genome Microarray 4×44K G4112),
GPL14951 (Illumina HumanHT-12 WG-DASL V4.0 R2 expression beadchip)
and GPL570 [(HG-U133_Plus_2) Affymetrix Human Genome U133 Plus 2.0
Array], respectively. The array data for GSE46408, GSE65372 and
GSE84402 consisted of 6 HCC patients vs. 6 controls, 17 HCC
patients vs. 15 controls and 14 HCC patients vs. 14 controls,
respectively. All data were freely accessible, and the present
study did not involve any human or animal experimentation.
DEG identification
GEO2R was adopted to identify the DEGs between HCC
and non-cancerous liver tissues. The log-fold change (FC) in
expression and adjusted P-values (adj. P) were determined. The adj.
P using the Benjamini-Hochberg method with default values were
applied to correct the potential false-positive results. Genes that
met the specific cut-off criteria of adj. P<0.05 and
|logFC|>1.0 were regarded as DEGs. The intersecting genes were
examined using the Venn diagram web tool. Visual hierarchical
cluster analysis was also conducted to display the volcano plot of
DEGs.
GO annotation and KEGG pathway
enrichment analyses of DEGs
To reveal the functions of DEGs, Enrichr database
was used to conduct GO annotation and KEGG pathway enrichment
analyses (8). The GO terms were
comprised of the following three divisions: biological process
(BP), cellular component (CC) and molecular function (MF). Adj.
P<0.05 was regarded as statistically significant.
Construction of PPIN and screening of
hub genes
Search Tool for the Retrieval of Interacting Genes
(STRING) (9) is a database used for
analyzing the functional protein association networks. The screened
DEGs had previously been submitted to the STRING database. All PPI
pairs with a combined score of >0.4 were extracted. High-degree
nodes appear crucial for ensuring the stability of the overall
network. The degree of all nodes was calculated by Cytoscape
(v3.6.1) plugin cytoHubba (10). In
this experiment, the genes with the top 10 highest degree values
were considered as hub genes.
Validation of hub genes
To validate the mRNA expression level of the
screened hub genes in HCC vs. non-tumor liver tissues, ONCOMINE
microarray database (https://www.oncomine.org) was used (11). Gene rank is the median rank for one
target gene over all analyses. The threshold was defined as P=0.05,
a 2-fold change and top 10% gene rank. The hierarchical clustering
analysis of hub genes in primary liver cancer (TCGA Liver Cancer,
n=438) was performed by UCSC Xena browser. The GEPIA database,
containing data from 9,736 tumors and 8,587 controls (12), was employed to visualize the mRNA
expression of each hub gene in liver hepatocellular carcinoma
(LIHC) and non-cancerous liver samples. The protein expression
levels of the 10 hub genes in human normal and HCC tissues were
determined using the Human Protein Atlas (HPA), a website that
contains immunohistochemistry-based expression data for
approximately 20 most common types of cancers, 12 individual tumors
in each cancer type (13).
Genetic alterations of hub genes
The LIHC (TCGA, Provisional) dataset, including the
data of 442 samples, was selected for the analyses of the genetic
alterations in hub genes using cBioPortal. This portal allows for
the visualization, analysis and downloading of a large-scale cancer
genomic dataset (14). The genomic
alterations included gene mutations, copy number variations
(GISTIC), mRNA expression z-scores (RNA Seq V2 RSEM) with a z-score
threshold of ±2.0 and protein expression z-scores. In accordance
with the online instructions of cBioPortal, the analyses on
disease-free survival (DFS), progression-free survival (PFS) and
overall survival (OS) were carried out.
Survival analyses for hub genes
Kaplan-Meier plotter is widely applied to explore
the roles of 54,675 genes in OS based on 10,461 tumor samples from
GEO, European Genome-phenome Archive and TCGA datasets including
364 patients with liver cancer. The relationship between OS and hub
genes expressed in patients with liver cancer was evaluated by the
Kaplan-Meier survival analysis (15).
Moreover, the association between DFS and the genes expressed in
LIHC patients was determined using the online tool GEPIA. The lower
and upper 50% of gene expression were set as the standard for
analysis. In the present study, HCC patients were categorized into
2 groups based on the median expression values of hub genes.
Log-rank test results with P<0.01 were regarded as statistically
significant.
Results
DEG identification
Following GSE46408 dataset analysis, 1,417 DEGs were
successfully identified, including 1,066 upregulated and 351
downregulated genes. For the GSE65372 dataset, 985 DEGs involving
399 upregulated and 586 downregulated genes were observed. For the
GSE84402 dataset, 1,218 DEGs were identified, including 675
upregulated and 543 downregulated genes. Venn analysis was
conducted to examine the intersection among the DEG profiles. Among
them, 89 DEGs were identified from the three profile datasets.
Notably, 33 DEGs were markedly downregulated (Fig. 1A), while 56 DEGs were significantly
upregulated (Fig. 1B) in HCC tissues
compared to non-cancerous liver tissues (Table I). These 89 DEGs in GSE84402 were
plotted in Fig. 1C, where the red and
green dots represented the up and downregulated genes,
respectively.
 | Figure 1.Identification of common DEGs from
GSE46408, GSE65372 and GSE84402 datasets. Venn diagram of (A)
downregulated and (B) upregulated DEGs based on the three GEO
datasets. (C) Volcano plot of the 89 DEGs. Red, upregulation;
green, downregulation. The intersecting areas represent the
commonly altered DEGs. The t-test was used to analyze DEGs, with
the cut-off criteria of |logFC|>1.0 and adj. P<0.05. GSE46408
(6 HCC patients vs. 6 controls), GSE65372 (17 HCC patients vs. 15
controls), GSE84402 (14 HCC patients vs. 14 controls); DEG,
differentially expressed gene; GEO, Gene Expression Omnibus; logFC,
log-fold change; HCC, hepatocellular carcinoma. |
 | Table I.The common DEGs of three gene
expression profiles (adj. P-val. <0.05, |logFC|>1.0). |
Table I.
The common DEGs of three gene
expression profiles (adj. P-val. <0.05, |logFC|>1.0).
| Common DEGs | Gene symbol |
|---|
| Upregulated
DEGs | E2F8; TKT;
HSPB1; TPX2; IGF2BP3; CCNB1; KPNA2; SMYD3; EZH2; HIST1H3B; KIF18B;
CDC25C; ENAH; AURKA; FAM189B; KIF4A; SQLE; CENPN; ZWINT; CCNA2;
PBK; NUF2; PTTG1; CDCA5; CKS2; TRIM24; ECT2; ASPM; ATAD2; MND1;
CCNB2; MCM7; PRC1; CDT1; CENPW; CEP55; MCM4; KIF15; DLGAP5; CKAP2L;
NVL; FAM83D; CDCA2; HMMR; GPC3; CENPI; ORC6; CDKN2A; SGO2; CDKN3;
NCAPG; NEK2; CENPM; CENPF; NUSAP1; ESM1 |
| Downregulated
DEGs | CXCL14; CLEC1B;
CRHBP; IGFALS; DBH; MT1M; ECM1; FCN2; ASPA; KBTBD11; CLEC4M;
TMEM27; BMPER; GPM6A; ANGPTL1; DPT; SLC25A47; COLEC10; LYVE1;
CXCL12; NTF3; ANGPTL6; HHIP; FCN3; CCBE1; MASP1; MARCO; LCAT;
VIPR1; HAMP; PTH1R; ADGRG7; SYT9 |
GO annotation and KEGG pathway
enrichment analyses
To obtain a deeper insight into the biological roles
of these 89 DEGs, the Enrichr database (http://amp.pharm.mssm.edu/Enrichr/.) was employed to
conduct GO annotation and KEGG pathway enrichment analyses.
Fig. 2 lists the top 10 enriched GO
terms and KEGG pathways. GO BP analysis revealed that these 89 DEGs
were markedly enriched in the lectin pathway of complement
activation, kinetochore organization, spindle microtubule
attachment regulation to kinetochore and mitotic sister chromatid
segregation (Fig. 2A). For GO CC
analysis, the top four significantly enriched terms were
microtubule cytoskeleton, mitotic spindle, chromosome centromeric
region and spindle pole (Fig. 2B).
The top four significantly enriched MF terms included kinase
binding, kinesin binding, cyclin-dependent protein serine/threonine
kinase regulator activity and cyclin-dependent protein kinase
activity (Fig. 2C). In addition, the
top four markedly enriched pathways for these 89 DEGs were cell
cycle, oocyte meiosis, progesterone-mediated oocyte maturation and
p53 signaling pathway (Fig. 2D).
PPIN construction and hub gene
identification
The STRING database was adopted to determine the PPI
pairs among the 89 DEGs. As revealed in Fig. 3A, 89 nodes (genes) and 715 edges
(interactions) were established in the constructed PPIN (PPI
enrichment P-value=1.0e-16). The top ten hub genes were identified
based on their connectivity degree. The results revealed that
cyclin B1 (CCNB1) was the most crucial gene with the highest
connectivity degree=42, followed by cyclin A2 (CCNA2) at
degree=41, cyclin B2 (CCNB2) at degree=40, condensin complex
subunit 3 (NCAPG) at degree=40, PDZ binding kinase
(PBK) at degree=39, nucleolar and spindle-associated protein
1 (NUSAP1) at degree=39, Aurora kinase A (AURKA) at
degree=39, ZW10 interacting kinetochore protein (ZWINT) at
degree=39, protein regulator of cytokinesis 1 (PRC1) at
degree=38, and kinesin family member 4A (KIF4A) at degree=38
(Table II). The PPIN of the
identified ten hub genes were also constructed, which indicated a
strong interaction among each other (Fig.
3B). KEGG analysis revealed that the markedly enriched pathways
for the 10 hub genes were progesterone-mediated oocyte maturation,
the cell cycle, oocyte meiosis, cellular senescence, the p53
signaling pathway, the FOXO signaling pathway, human
immunodeficiency virus 1 infection, and human T-cell leukemia virus
1 infection (Fig. 3C). The mRNA
expression levels of these ten hub genes were markedly upregulated
in HCC tissues.
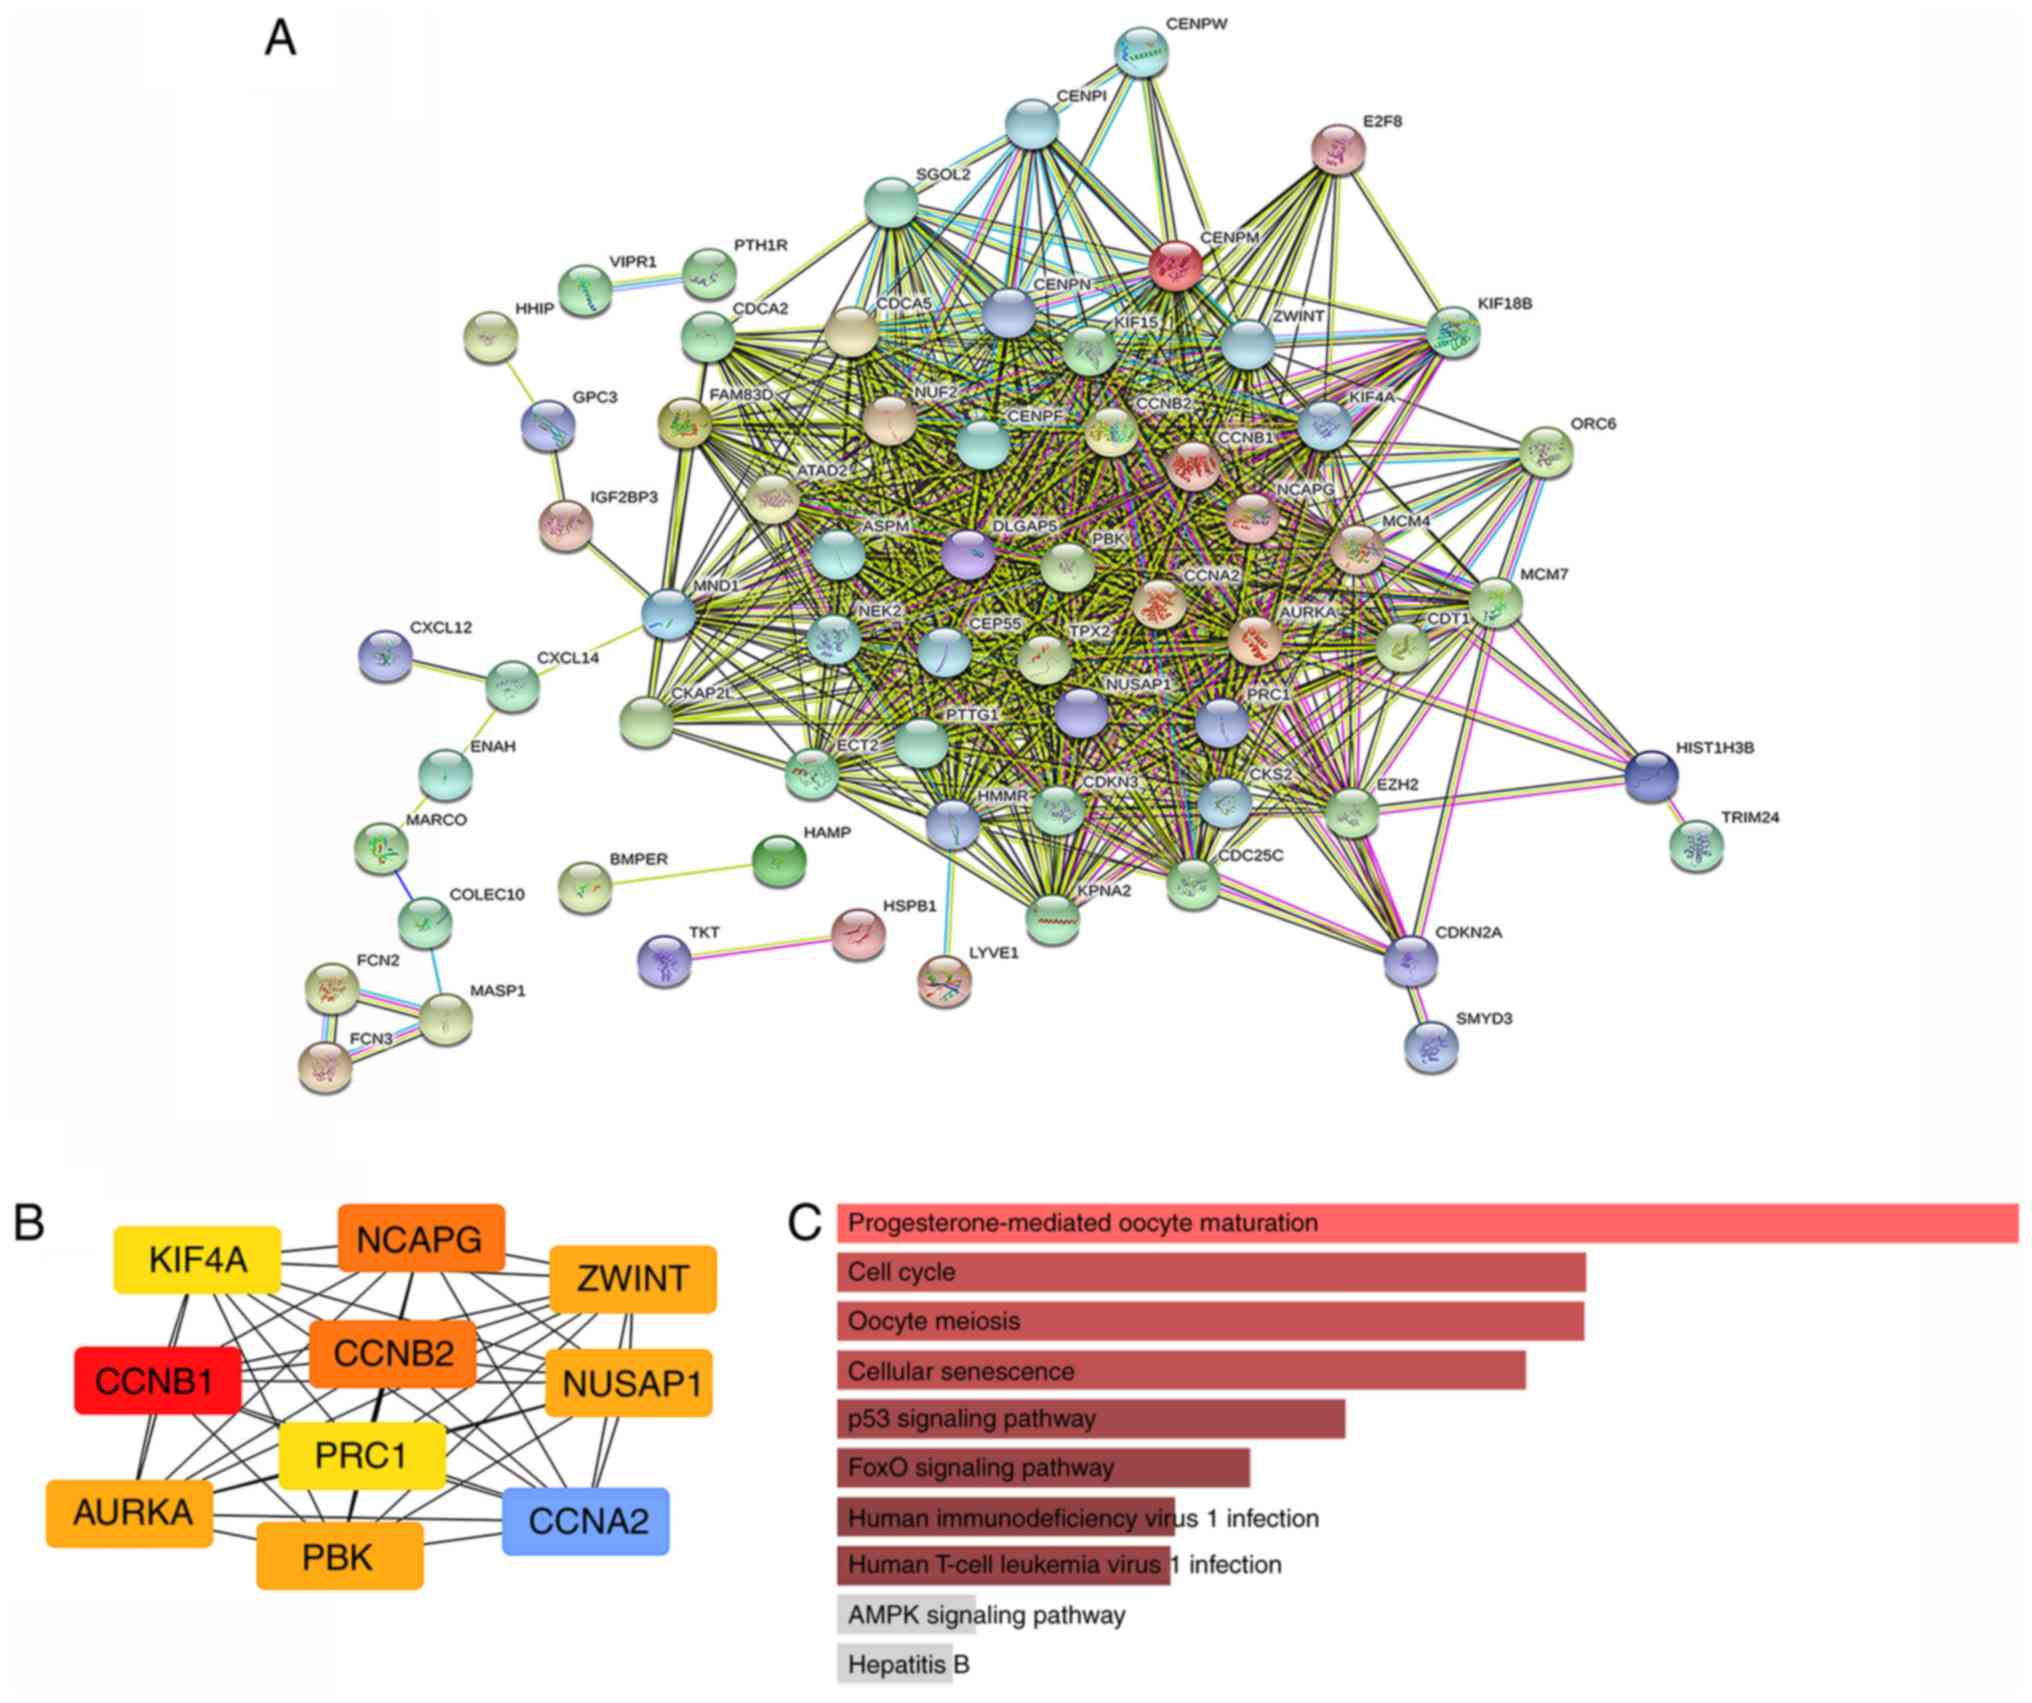 | Figure 3.PPIN and hub gene identification. (A)
PPIN was constructed by all the 89 DEGs using STRING database. (B)
The top 10 hub genes in the PPIN were screened by Cytoscape
(v3.6.1) plugin cytoHubba based on their connectivity degree. The
10 identified hub genes such as CCNB1, CCNA2, CCNB2, NCAPG, PBK,
NUSAP1, AURKA, ZWINT, PRC1 and KIF4A are displayed from
red (high degree value) to yellow (low degree value). (C) KEGG
pathway enrichment analysis of the 10 hub genes. PPIN,
protein-protein interaction network; DEG, differentially expressed
gene; STRING, search tool for the retrieval of interacting genes;
KEGG, Kyoto encyclopedia of genes and genomes. |
| Table II.Top ten hub genes with higher degree
of connectivity. |
Table II.
Top ten hub genes with higher degree
of connectivity.
| Gene symbol | Gene
description | Degree |
|---|
| CCNB1 | Cyclin B1 | 42 |
| CCNA2 | Cyclin A2 | 41 |
| CCNB2 | Cyclin B2 | 40 |
| NCAPG | Condensin complex
subunit 3 | 40 |
| PBK | PDZ binding
kinase | 39 |
| NUSAP1 | Nucleolar and
spindle associated protein 1 | 39 |
| AURKA | Aurora kinase
A | 39 |
| ZWINT | ZW10 interacting
kinetochore protein | 39 |
| PRC1 | Protein regulator
of cytokinesis 1 | 38 |
| KIF4A | Kinesin family
member 4A | 38 |
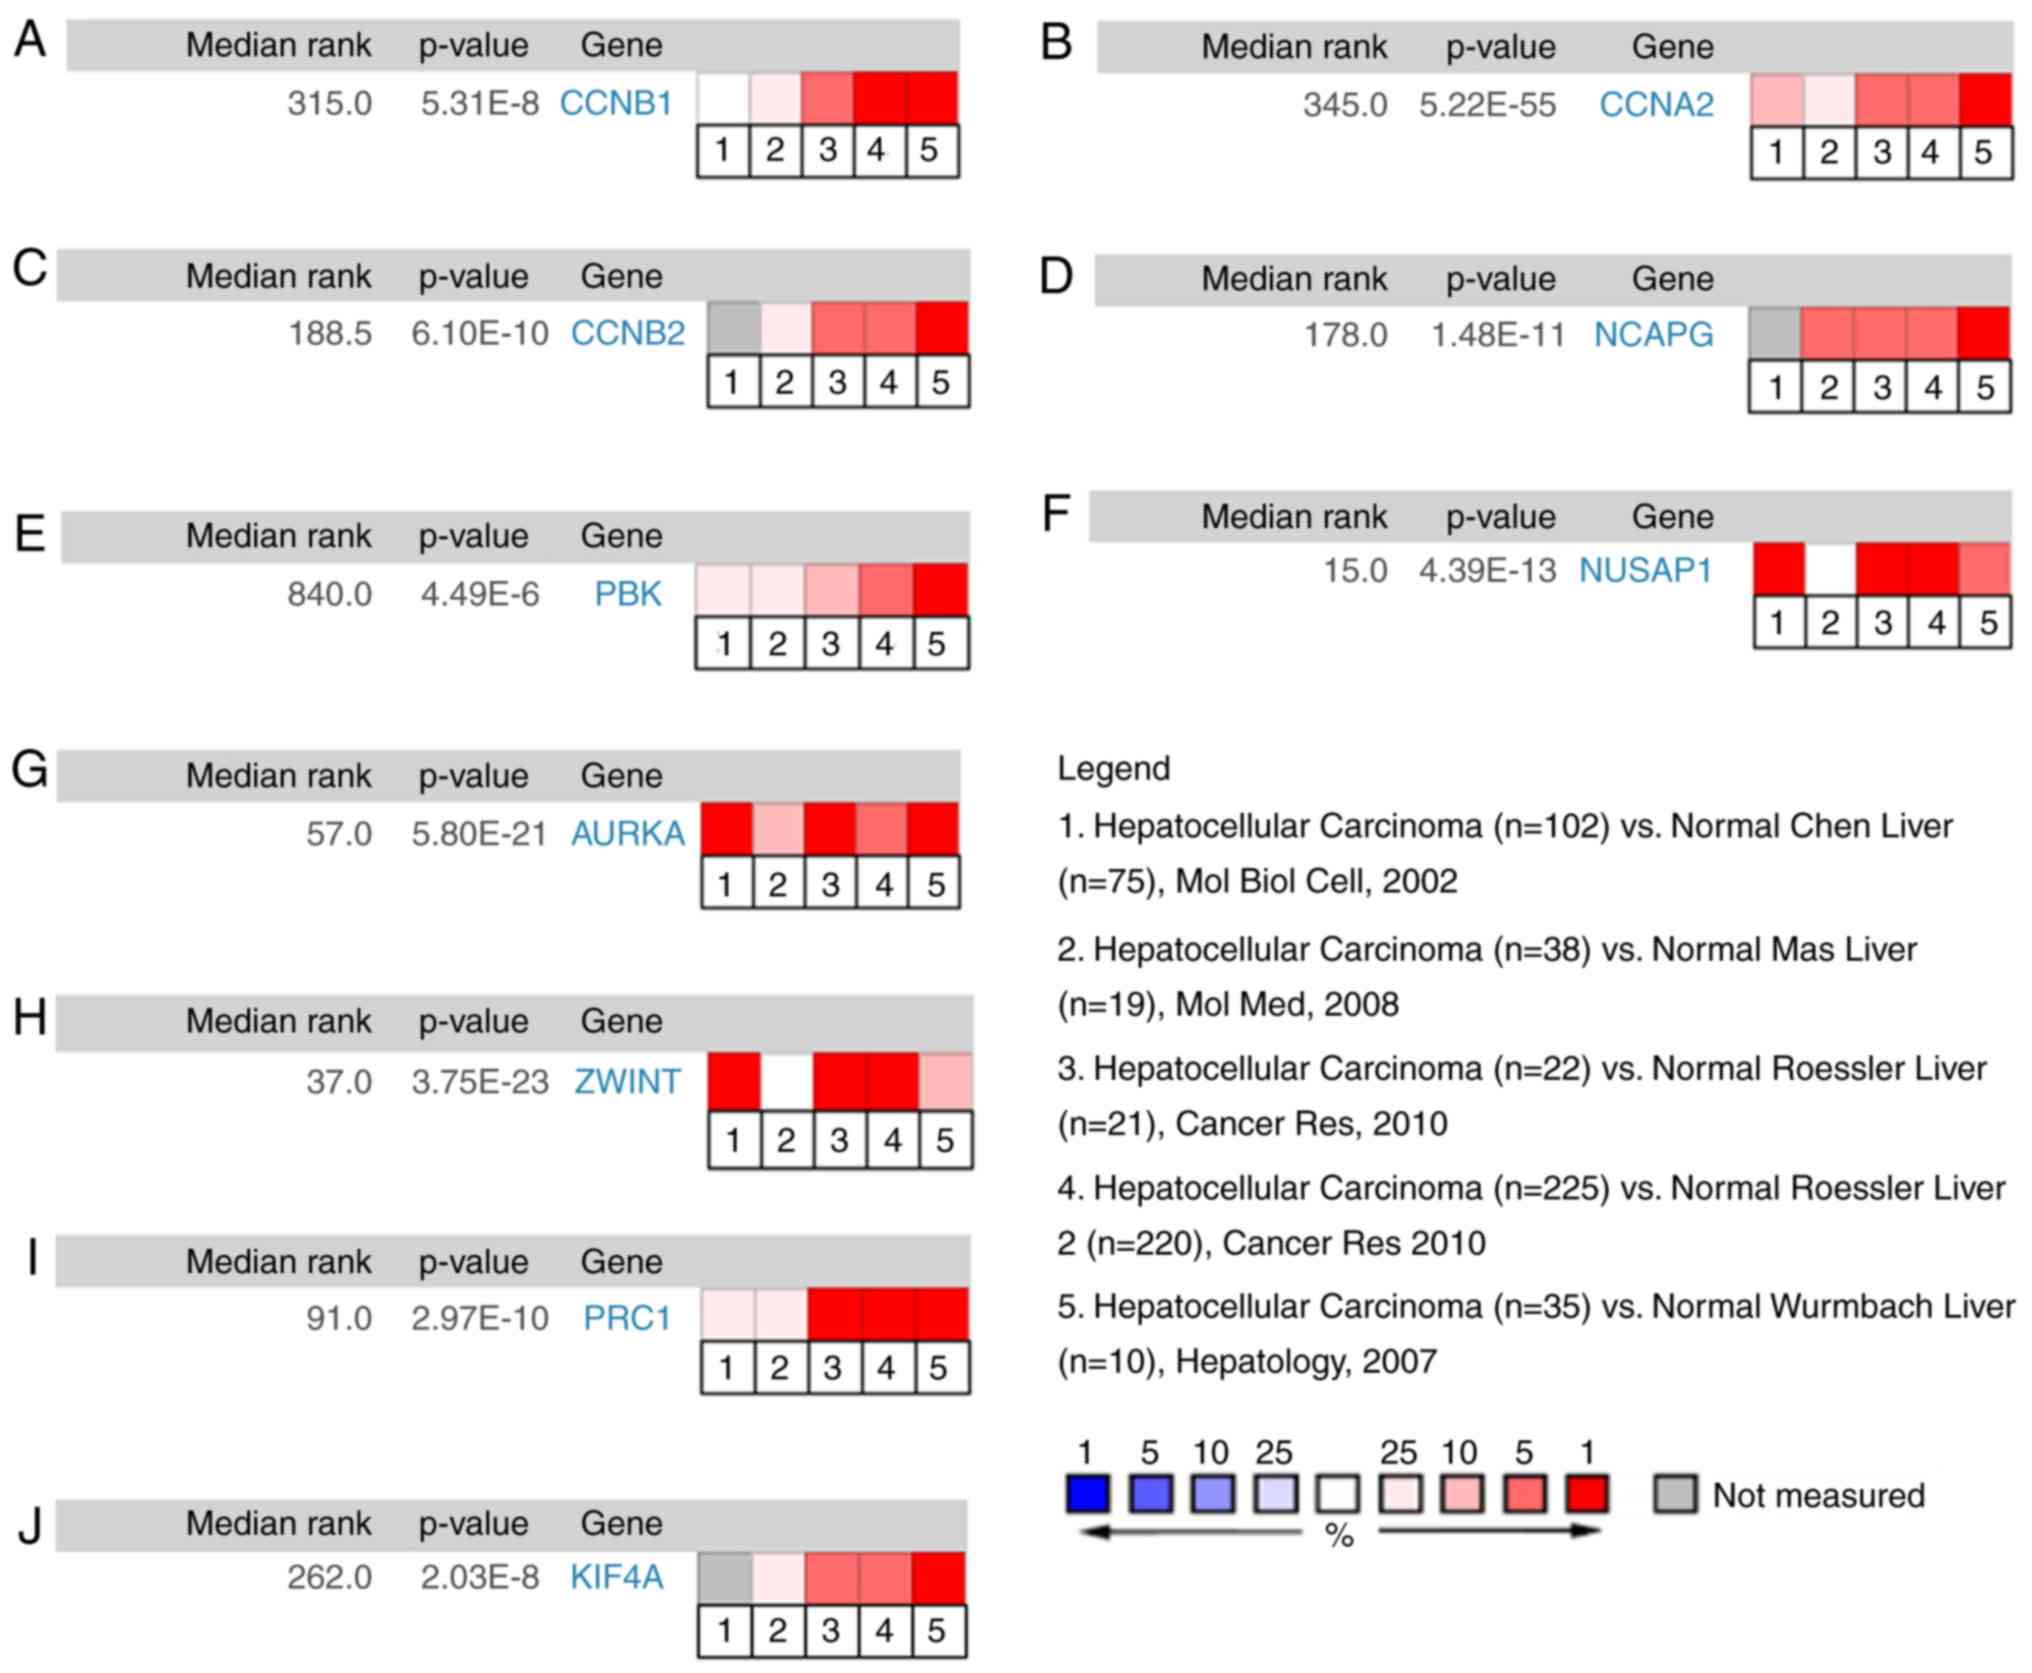
Validation of mRNA expression of the
top 10 hub genes in HCC
First, a meta-analysis on the mRNA expression levels
of CCNB1, CCNA2, CCNB2, NCAPG, PBK, NUSAP1, AURKA, ZWINT,
PRC1, and KIF4A between HCC and non-tumor liver tissues
was performed using the ONCOMINE database. As demonstrated in
Fig. 4, the mRNA expression levels of
(Fig. 4A) CCNB1, (Fig. 4B) CCNA2, (Fig. 4C) CCNB2, (Fig. 4D) NCAPG, (Fig. 4E) PBK, (Fig. 4F) NUSAP1, (Fig. 4G) AURKA, (Fig. 4H) ZWINT, (Fig. 4I) PRC1, and (Fig. 4J) KIF4A were markedly
upregulated in HCC tissues (P<0.05) compared to those in
non-cancerous liver tissues. Furthermore, the median rank of
NUSAP1 was the lowest (15)
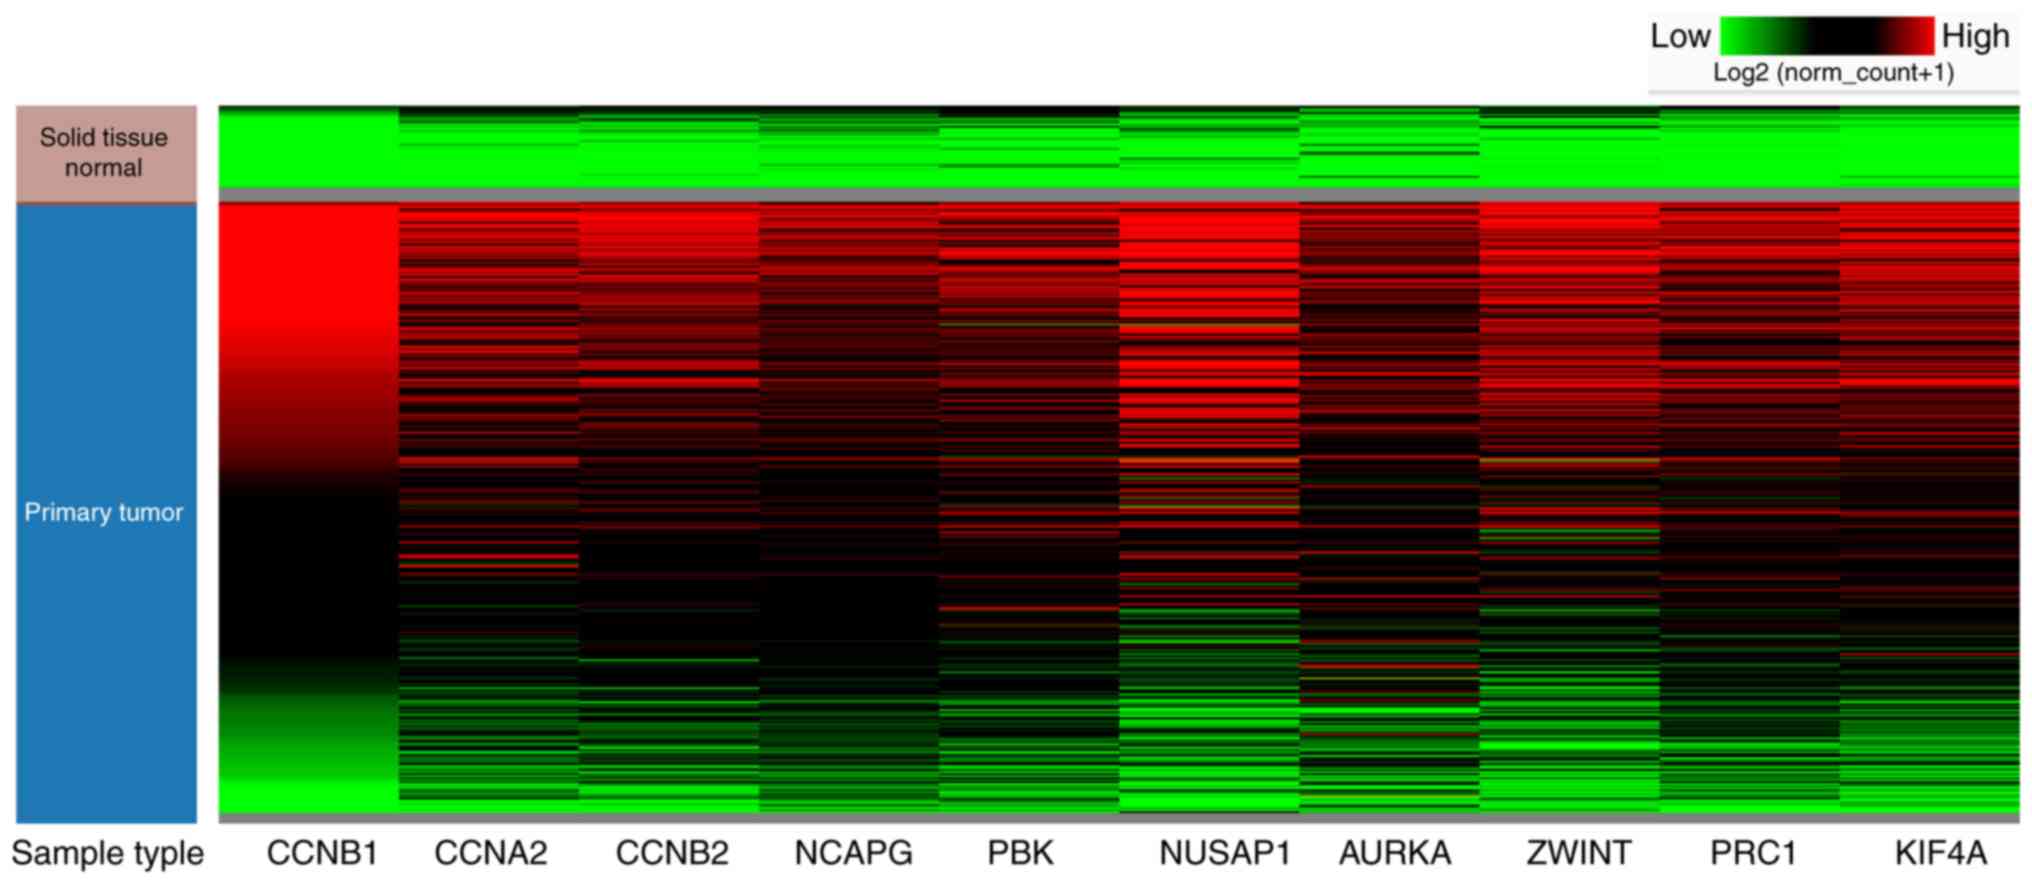
among the top 10 hub genes in HCC tissues (Fig. 4F). Hierarchical clustering analysis
with UCSC Xena Browser also revealed that the mRNA expression
levels of all the 10 hub genes were basically increased in primary
hepatic cancer tissues compared to non-tumor tissue samples
(Fig. 5). The results from the GEPIA
database also revealed that the mRNA expression levels of all the
10 hub genes were significantly higher (P<0.01) in HCC tissues
than those in normal liver tissues (Fig.
6). These findings were consistent with the obtained microarray
data.
 | Figure 6.Validation of the mRNA expression
levels of (A) CCNB1, (B) CCNA2, (C) CCNB2, (D)
NCAPG, (E) PBK, (F) NUSAP1, (G) AURKA,
(H) ZWINT, (I) PRC1, and (J) KIF4A in LIHC
tissues and normal liver tissues using GEPIA. These ten box plots
are based on 360 HCC samples (marked in red) and 160 normal samples
(marked in gray). *P<0.01 was considered statistically
significant. LIHC, liver hepatocellular carcinoma; HCC,
hepatocellular carcinoma. |
After examining the mRNA expression levels of the 10
hub genes in HCC, the protein expression levels of these hub genes
in HCC were explored using the HPA database. Notably, the protein
levels of (Fig. 7A) CCNB1, (Fig. 7B) CCNA2, (Fig. 7C) CCNB2, (Fig. 7D) NCAPG, (Fig. 7E) PBK, (Fig.
7F) NUSAP1, (Fig. 7G) AURKA and
(Fig. 7I) PRC1 were not expressed in
normal liver tissues, whereas medium and high expression levels of
these genes were observed in liver cancer tissues (Fig. 7A-G and I). Moreover, the low protein
expression levels of ZWINT and KIF4A were revealed in normal liver
tissues, while medium protein expression levels of these genes were
observed in liver cancer tissues (Fig. 7H
and J). In summary, the present results indicated that the
transcriptional and translational expression levels of the 10 hub
genes were overexpressed in patients with HCC.
 | Figure 7.Representative immunohistochemistry
images of (A) CCNB1, (B) CCNA2, (C) CCNB2, (D)
NCAPG, (E) PBK, (F) NUSAP1, (G) AURKA,
(H) ZWINT, (I) PRC1, and (J) KIF4A in HCC and
non-cancerous liver tissues derived from the HPA database. HCC,
hepatocellular carcinoma; HPA, Human Protein Atlas. |
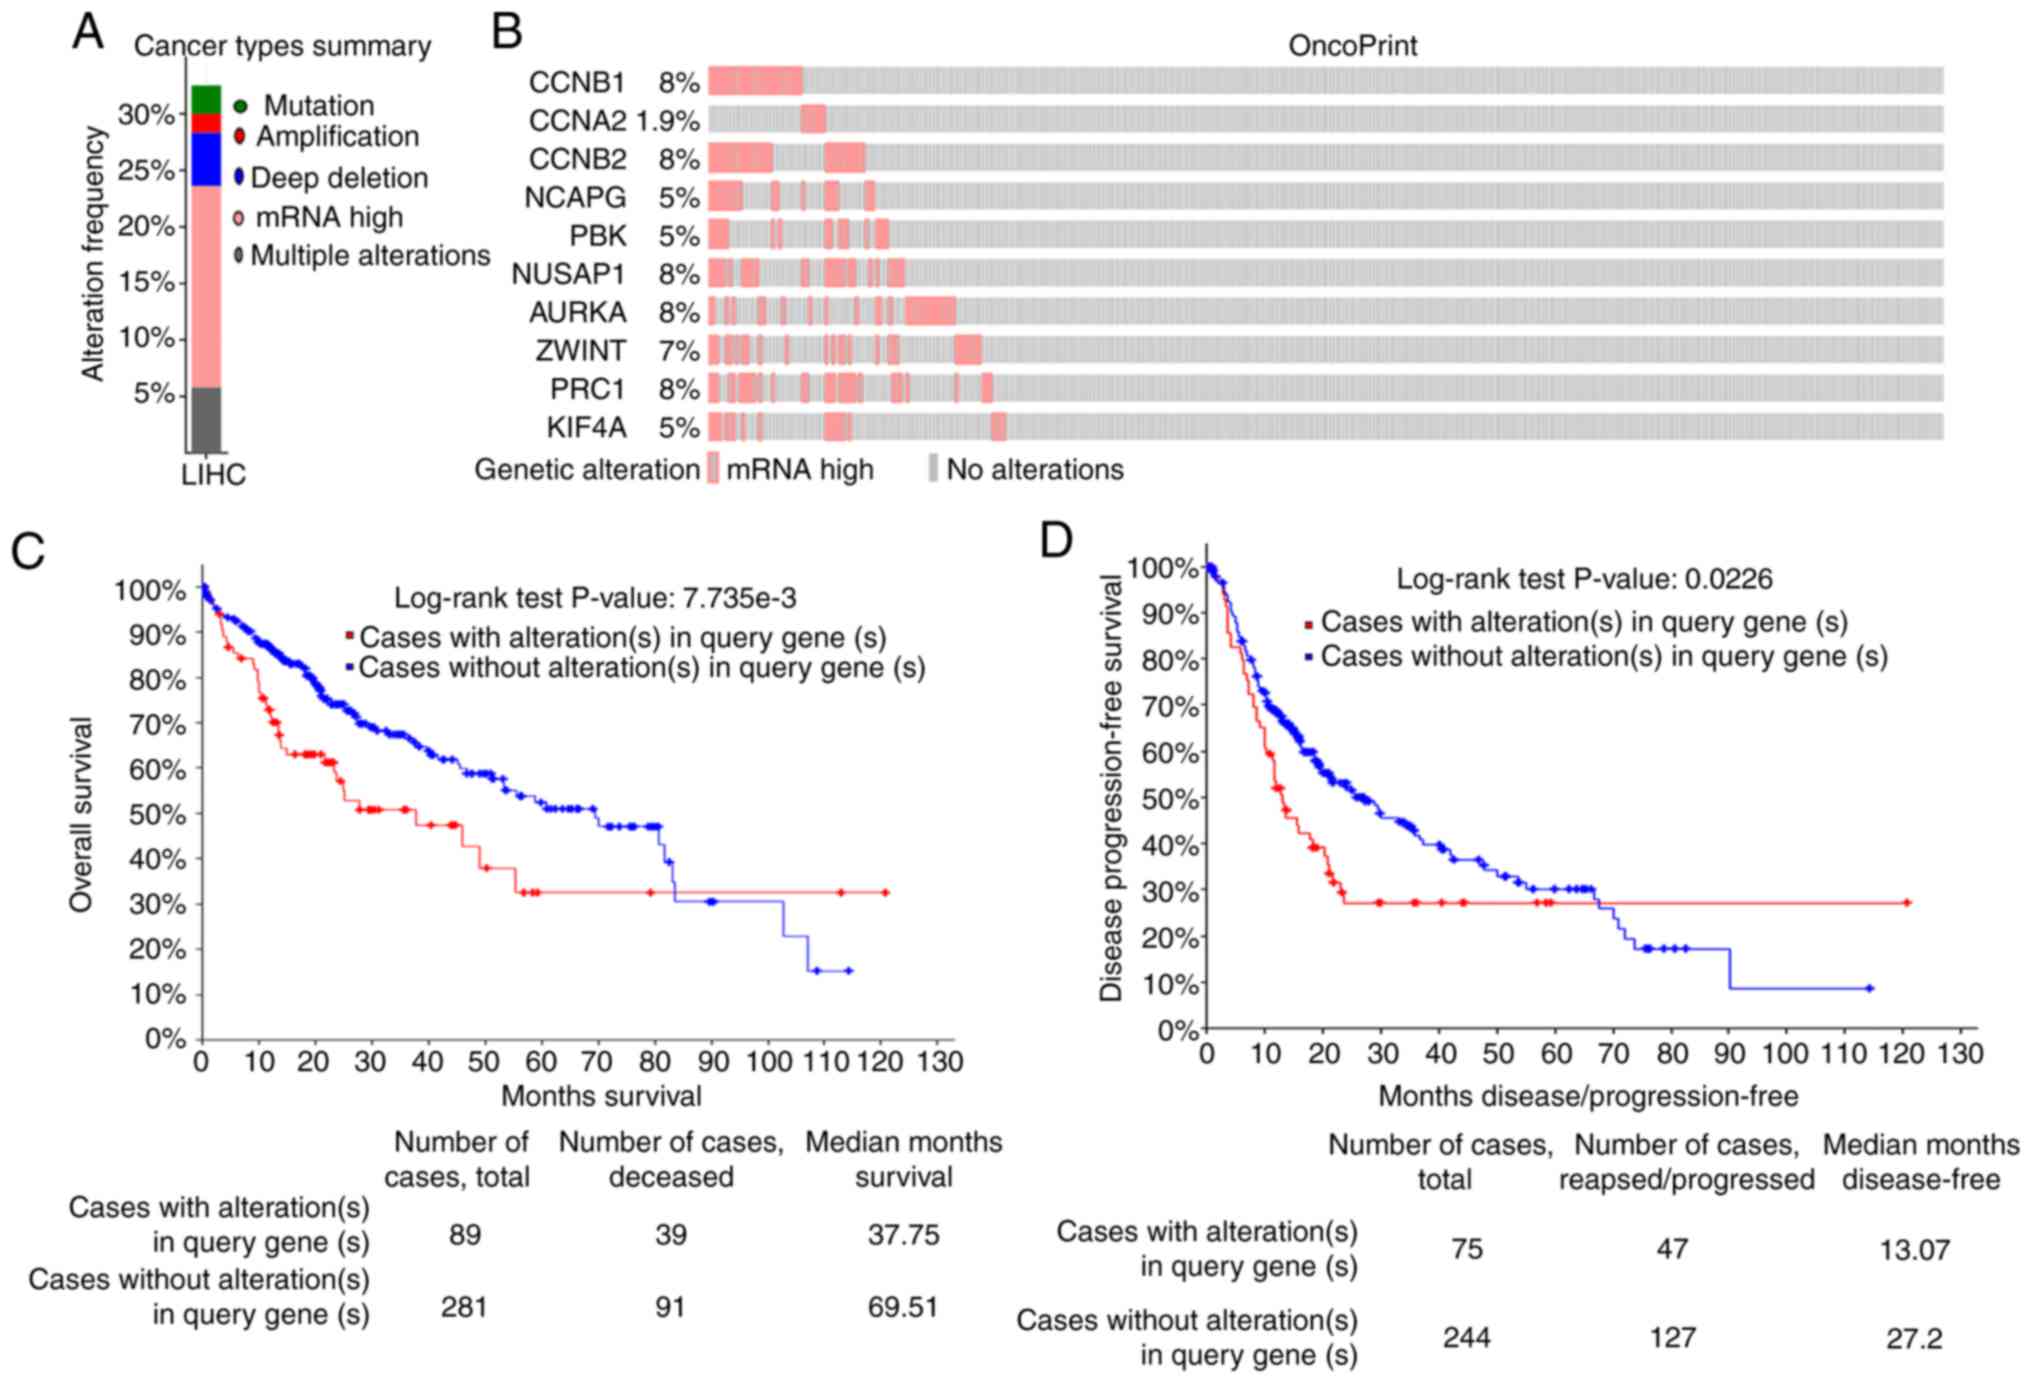
Alteration in the frequency and
prognostic values of hub genes
The frequencies of genetic alterations of the 10 hub
genes in LIHC were evaluated using the cBioPortal database.
Approximately 32.5% of LIHC clinical cases exhibited significant
alterations in the 10 hub genes (Fig.
8A). The mRNA upregulation was one of the most important single
factors for the altered 10 hub genes in 64 cases (17.78%) of LIHC.
The mRNA expression (RNA Seq V2 RSEM) of the top 10 hub genes in
LIHC was further analyzed. The results revealed that the percentage
change in the mRNA expression levels of CCNB1, CCNA2, CCNB2,
NCAPG, PBK, NUSAP1, AURKA, ZWINT, PRC1 and KIF4A in LIHC
were 8, 1.9, 8, 5, 5, 8, 8, 7, 8 and 5%, respectively (Fig. 8B). Through the cBioportal database,
the relationship between the changes in hub gene expression and
LIHC prognosis was examined. Kaplan-Meier plots were used to
compare DFS, PFS and OS in LIHC patients with or without
alterations in the mRNA expression levels of the top 10 hub genes.
As revealed in Fig. 8C, LIHC cases
with altered hub gene expression exhibited significantly worse OS
compared to those with unaltered hub gene expression (P=7.735e-3).
Similarly, LIHC cases with altered hub gene expression displayed
significantly worse DFS (P=0.0226) compared to those with unaltered
hub gene expression (Fig. 8D).
Survival analysis of the hub genes in
liver cancer
OS and DFS analyses of the 10 hub genes selected by
PPI were further conducted by Kaplan-Meier plotter, bioinformatics
analysis and the GEPIA database. As demonstrated in Fig. 9, the high expression levels of
CCNB1, CCNA2, CCNB2, NCAPG, PBK, NUSAP1, AURKA, ZWINT, PRC1
and KIF4A in patients with liver cancer were associated with
poor OS. The unfavorable DFS was also markedly observed in LIHC
patients with increased expression levels of the top ten hub genes
(Fig. 10).
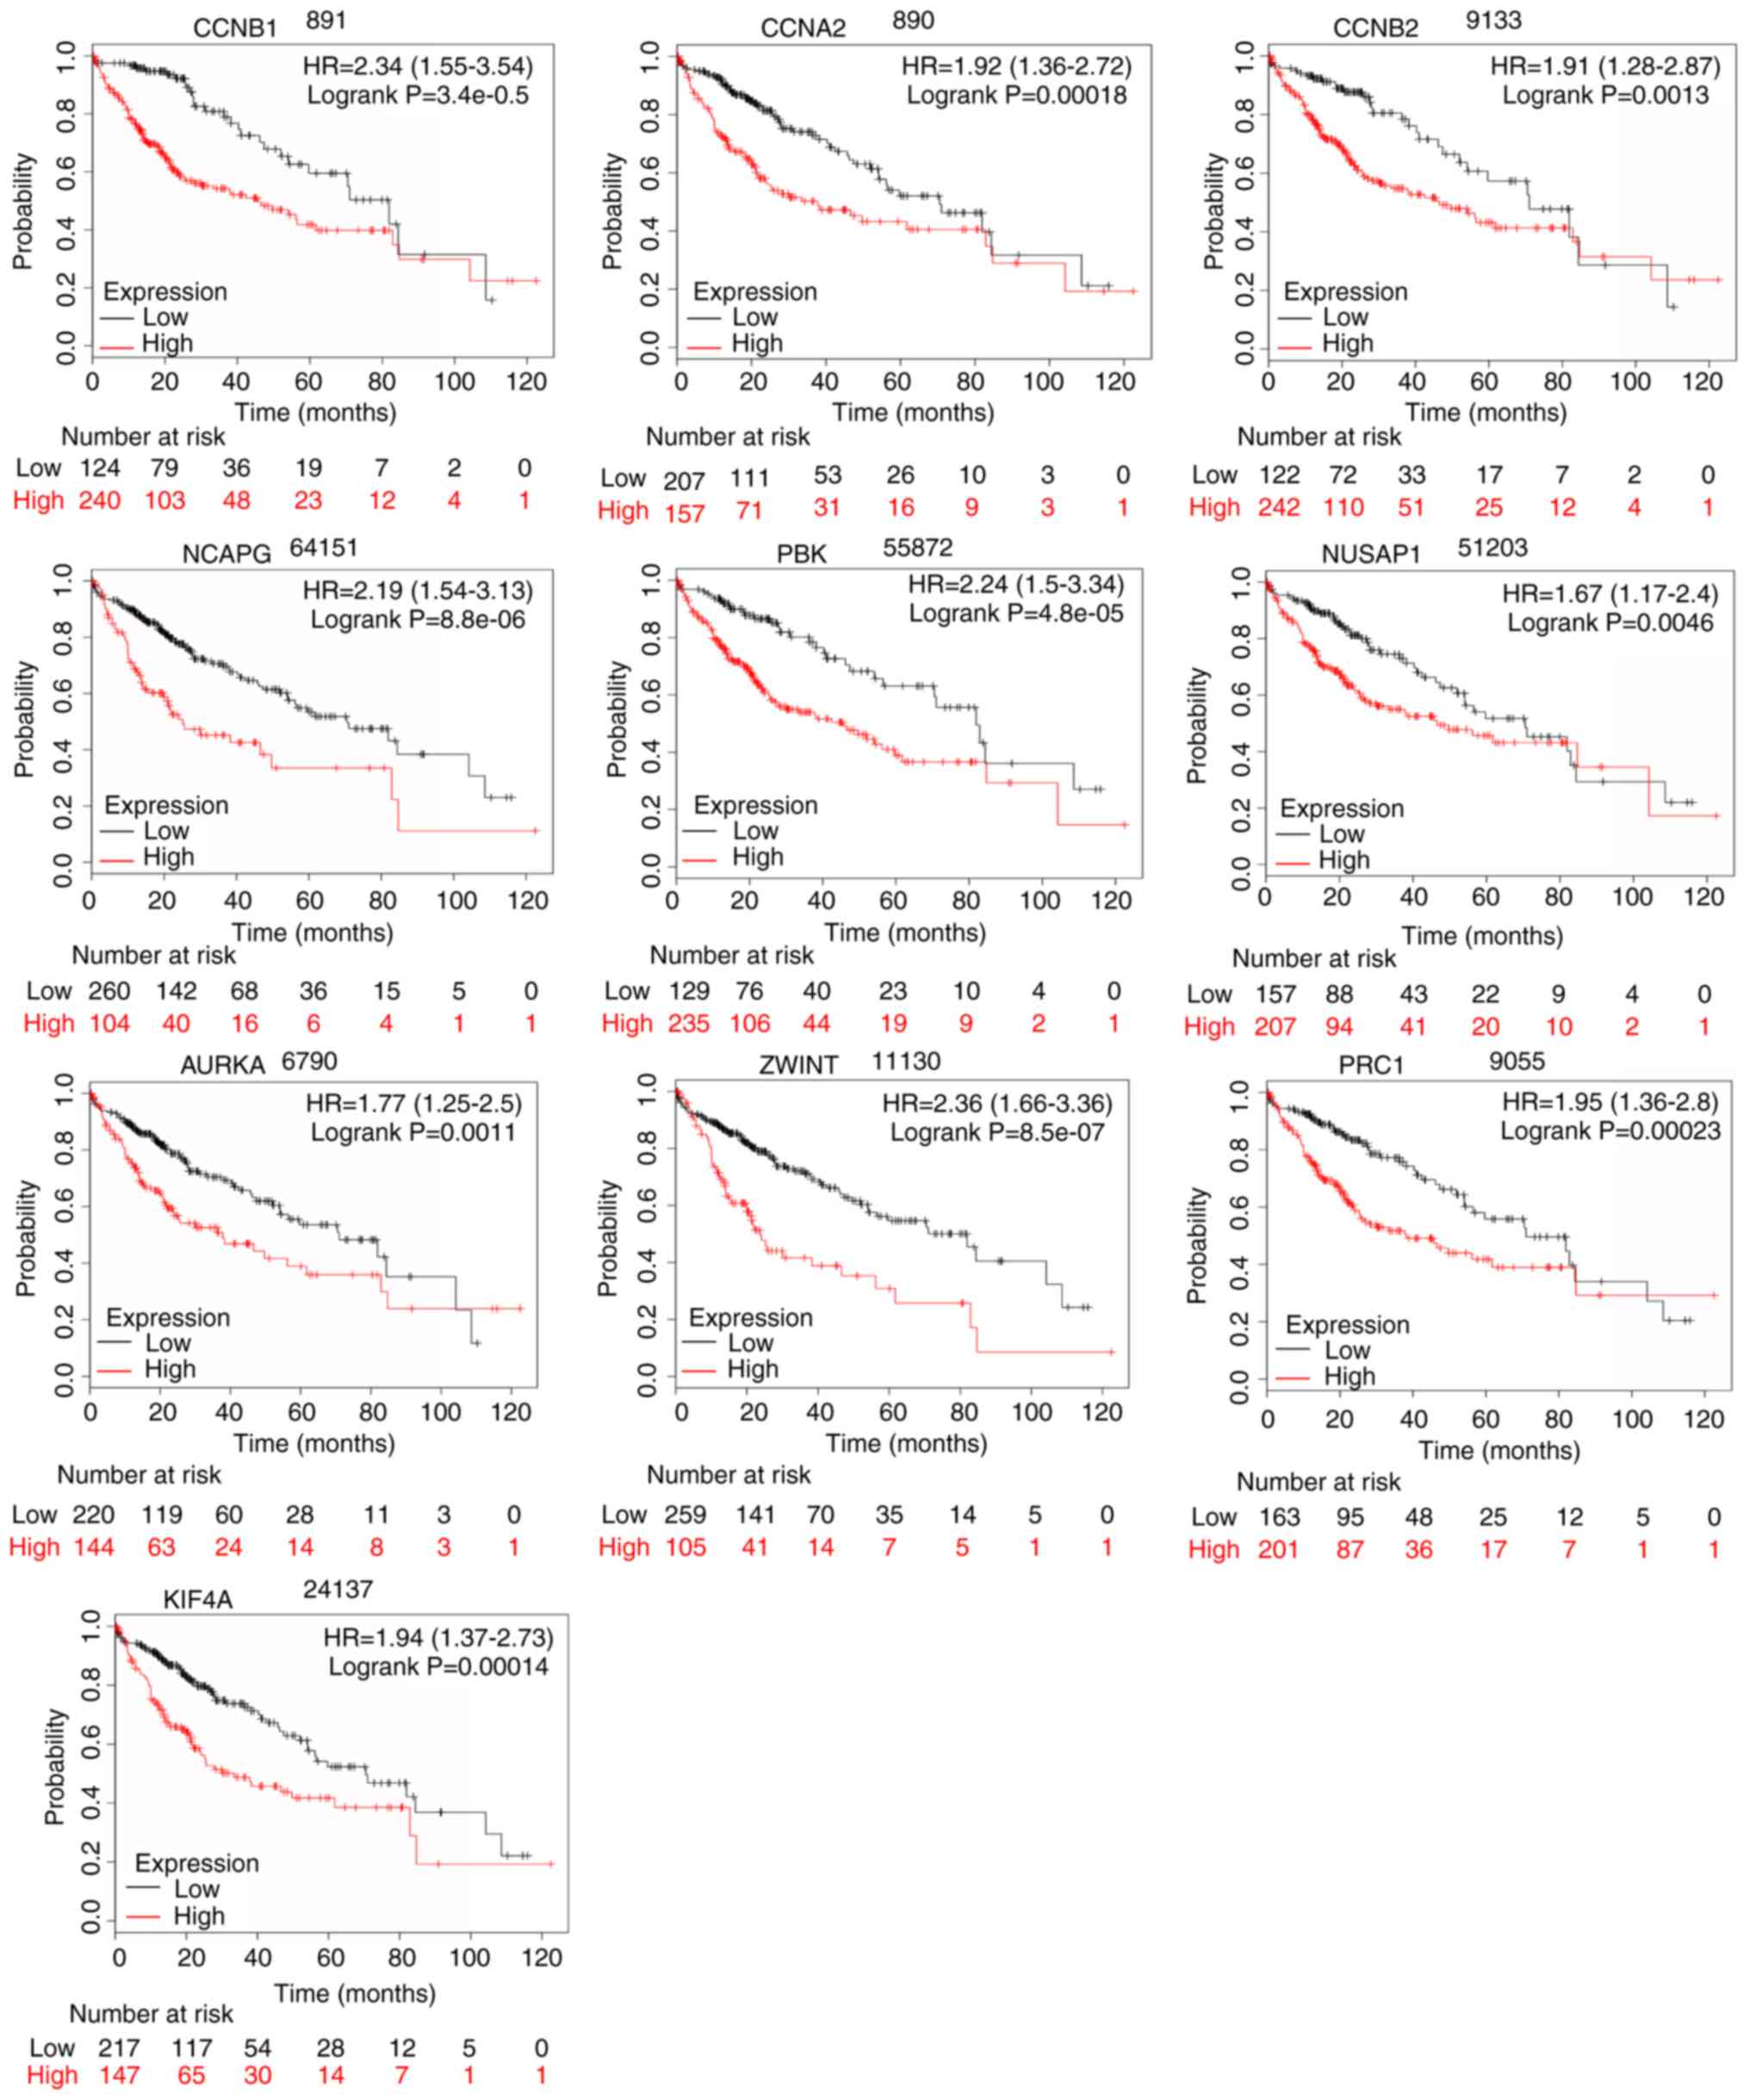 | Figure 9.OS of the 10 hub genes overexpressed
in patients with liver cancer was analyzed by Kaplan-Meier plotter.
Data are presented as the hazard ratio with a 95% confidence
interval. CCNB1, log-rank P=3.4e-05; CCNA2, log-rank P=0.00018;
CCNB2, log-rank P=0.0013; NCAPG, log-rank P=8.8e-06; PBK, log-rank
P=4.8e-05; NUSAP1, log-rank P=0.0046; AURKA, log-rank P=0.0011;
ZWINT, log-rank P=8.5e-07; PRC1, log-rank P=0.00023; and KIF4A,
log-rank P=0.00014. Log-rank P<0.01 was regarded as
statistically significant. OS, overall survival. |
 | Figure 10.DFS of the 10 hub genes overexpressed
in LIHC patients. Data are presented as the hazard ratio with a 95%
confidence interval. CCNB1, log-rank P=2.8e-06; CCNA2, log-rank
P=0.0037; CCNB2, log-rank P=0.0064; NCAPG, log-rank P=0.00246; PBK,
log-rank P=0.006; NUSAP1, log-rank P=7e-04; AURKA, log-rank
P=0.0012; ZWINT, log-rank P=7.8e-05; PRC1, log-rank P=0.00045; and
KIF4A, log-rank P=0.0011. Log-rank P<0.01 was considered
statistically significant. DFS, disease-free survival; LIHC, liver
hepatocellular carcinoma. |
Discussion
In the present experiments, bioinformatics analysis
was performed to identify the potential key genes correlated with
HCC. By comparing the three DEG profiles of HCC retrieved from the
GEO database, 56 upregulated and 33 downregulated DEGs were
successfully identified, respectively. Based on the degree of
connectivity in PPIN, the top ten hub genes were ranked, including
CCNB1, CCNA2, CCNB2, NCAPG, PBK, NUSAP1, AURKA, ZWINT, PRC1
and KIF4A. These identified hub genes were functioned as a
group, and may play a crucial role in HCC.
KEGG enrichment analysis revealed that the cell
cycle was the most significantly enriched pathway for these 89
DEGs. Cell-cycle deregulation is the major reason for the unlimited
proliferation of cancer cells. Cyclins belong to a family of
closely related proteins that drive the cell division cycle entry
and progression, repair DNA damage, and control cell death by
activating cyclin-dependent kinases (16). The up-regulation of cyclins causes
cell-cycle deregulation and uncontrolled cell growth (17), indicating that cyclins play a vital
role in the pathogenesis of cancer. CCNB1 (18,19),
CCNA2 (20,21) and CCNB2 (22) are the founding members of the cyclin
gene family, which regulate the proliferation, growth and apoptosis
of cells, and have been associated with cancer progression and
survival. CCNB1 (23,24), CCNA2 (20,25) and
CCNB2 (22,26) have been identified in various types of
tumors. Liu et al (3) revealed
that CCNB1 and CCNB2 are highly expressed in HCC
tissues compared to non-cancerous liver tissues. Based on the
microarray studies of human liver tumors, CCNA2 was also
overexpressed in human HCC tissues (27). The overexpression of CCNB1 (4,5,28,29) and
CCNB2 (4) was correlated with poor OS
and DFS in HCC patients by bioinformatics analysis. The results of
the present study demonstrated that the upregulated levels of CCNB1
and CCNB2 significantly contributed to unfavorable OS and DFS in
patients with HCC. In addition, it has been reported that CCNA2 is
associated with a decrease in OS for patients with HCC, based on
the survival and expression data from TCGA (30). In agreement, this study revealed that
HCC patients with a low CCNA2 expression level exhibited longer OS
and DFS compared to those with a high CCNA2 expression level.
NCAPG is the regulatory subunit of the condensin
complex, and its related pathways are the cell cycle, mitotic and
cell cycle chromosome condensation, which converts the interphase
chromatin into mitotic-like condense chromosomes during mitosis and
meiosis (31). Although the roles of
NCAPG in cancers have not been studied extensively, it can
potentially act as a novel oncogene for HCC progression.
NCAPG knockdown suppresses the growth and proliferation of
HCC cells (32,33), and inhibits the growth of HuH7 and
HCCLM3 tumor xenografts (32).
NCAPG was revealed to be overexpressed in HCC tissues, which
contributed to the recurrence and OS of HCC patients (32,33). The
overexpression of CCNB1 was revealed to exhibit a significant
positive correlation with NCAPG overexpression in HCC patients
(32). NCAPG has been identified as a
hub gene in HCC in several studies by bioinformatics analysis
(34–36). The findings of the present study
demonstrated that the increased expression of NCAPG could confer a
poor prognosis in HCC patients. Thus, NCAPG plays important roles
in HCC progression, and serves as a novel therapeutic target for
improving the treatment of HCC.
PBK is highly expressed in several cancers,
including prostate cancer (37),
breast cancer (38), gastric
carcinoma (39), and lung cancer
(40), and its overexpression may be
correlated with tumor progression and poor prognosis. Although the
clinical significance and biological role of PBK in HCC have not
yet been extensively studied, PBK is suggested to function as an
oncogene for HCC. First, Yue et al identified the
upregulation of PBK as a potential prognostic biomarker for HCC by
integrated GEO and TCGA datasets (41). Second, HCC patients with PBK
overexpression were revealed to be more susceptible to increased
tumor size, poor OS and DFS, occurrence of vascular invasion and
incidence lymph node metastasis (42). Third, previous in vivo and
in vitro data have demonstrated that PBK exerts an oncogenic
role in HCC by activating the β-catenin signaling pathway (42). These results supported the present
findings which revealed that the increased expression levels of PBK
were markedly associated to poor OS and DFS in HCC patients.
NUSAP1 is a microtubule-associated protein that
controls the cell cycle by promoting the aggregation of
microtubules (43). Its expression
levels are highly up-regulated in various tumor types, including
prostate (44), pancreatic (45) and invasive breast cancers (46). In HCC patients, the expression of
NUSAP1 was revealed to be upregulated, and its overexpression may
serve as a prognostic factor (47).
NUSAP1 knockdown could decrease the proliferation, migration and
survival of tumor cells in a human liver cancer xenograft model
(47). In this study, the present
findings also revealed that the increased expression of NUSAP1 was
correlated with poor OS and DFS in HCC patients.
AURKA is a mitotic serine/threonine kinase that is
associated with the regulation of mitosis, cell division and cell
cycle progression (48). The clinical
role of AURKA in HCC has been studied extensively. AURKA
overexpression has been detected in an HCC cell line (49) and HCC tissue samples (50,51). AURKA
overexpression has been closely associated with the aggressive
tumor characteristics (52), poor
outcome (51) and chemoresistance
(53) of HCC. The findings on AURKA
gene polymorphisms have indicated that AURKA can act as a
predictive biomarker for early-stage HCC (54). Another mechanistic study has revealed
that AURKA can promote HCC metastasis by modulating
epithelial-mesenchymal transition and cancer stem cell-like
features (51). In HCC cells, AURKA
at the transcriptional level was revealed to be regulated by c-Myc,
which contributes to HCC progression (55). The inhibition of AURKA by alisertib
(56), a compound that is currently
being tested in phase II/III clinical trials of patients with
hematological malignancies and solid tumors, can potentially reduce
viability and induce apoptosis in HCC cells (49). Zhou et al revealed the
overexpression of AURKA was negatively correlated with OS, based on
the survival and expression data from TCGA (36). The present study also indicated that
the increased expression levels of AURKA were associated with
unfavorable OS and DFS in HCC patients.
ZWINT belongs to a component of a kinetochore
complex, which can recruit ZW10 to kinetochores. The expression of
ZWINT has been revealed to be downregulated in HCC (57). However, other findings have suggested
that ZWINT mRNA and protein are overexpressed in HCC cell and
tissue samples. The increased expression of ZWINT in HCC tissues
was markedly correlated with tumor size and number, poor OS, and a
great tendency for tumor recurrence (58). Furthermore, the overexpression of
ZWINT increased the proliferation of HCC cells by modulating cell
cycle-related proteins (58). Using
bioinformatics analysis, the hub gene ZWINT was identified and
higher expression of ZWINT in HCC predicted poor prognosis in
several studies (34,35). The results of our studies also
indicated that ZWINT could exert oncogenic effects rather than
tumor inhibitory effects on HCC. However, these findings should be
further investigated.
PRC1 is a microtubule-associated protein that is
related to cell motion and microtubule dynamics. The expression
level of PRC1 in HCC tissue samples has been revealed to be higher
than that in non-tumor adjacent tissue samples (59). The increased expression of PRC1 in HCC
patients was correlated with the decreased survival rates of HCC
patients (59). PRC1 promoted early
HCC recurrence by activating the Wnt/beta-catenin signaling pathway
(60). Wang et al (61) reported that the high expression of
PRC1 exacerbates chemoresistance in HCC cells. Li et al
analyzed the HCC data from TCGA by weighted gene co-expression
network analysis and identified PRC1 as a novel biomarker for HCC
(34). The results of this study
indicated that the increased expression of PRC1 was a prognostic
indicator for DFS and OS in HCC patients.
KIF4A is a microtubule-based motor protein that
regulates the segregation of chromosomes and organization of
mitotic spindles during mitosis (62). KIF4A has been revealed to be highly
expressed in HCC cells and tissues (63), and its overexpression in HCC patients
indicates a poor prognosis (63,64). The
findings on an HCC cell model overexpressing KIF4A revealed that
KIF4A enhanced HCC cell survival and clonogenicity, by maintaining
mitotic progression and protecting against cell death (63). KIF4A knockdown markedly decreased the
proliferation and migration abilities of HCC-LM3 and PLC/PRF/5
(65). The hub gene KIF4A has been
identified to be involved in the development of HCC by
bioinformatics analysis (6). The
findings of this study indicated that the upregulated expression of
KIF4A could confer poor OS and DFS in HCC patients.
In summary, using three cohort profile datasets and
integrated bioinformatics analysis, 10 HCC-associated hub genes
were identified. The expression of the hub genes was revealed to be
increased in HCC, and the overexpression level predicted poor
prognosis. These results were consistent with previous studies
(4–7,34–36,41).
Further studies with larger sample sizes should be carried out to
validate the present findings. Additionally, experimental evidence
is warranted to investigate the functional roles of the identified
genes in HCC. Collectively, it is our sincere hope that this
present study will contribute to the discovery of novel diagnostic
and prognostic biomarkers as well as therapeutic targets for
HCC.
Acknowledgements
Not applicable.
Funding
The present study was supported by the research
funds from the National Natural Science Foundation of China (grant
no. 81801559), the Jiangsu Provincial Medical Youth Talent (grant
no. QNRC2016259), the Suzhou Youth Science and Education Project
(grant no. KJXW2016017).
Availability of data and materials
All data generated or analyzed during this study are
included in this published article.
Authors' contributions
All authors contributed to the study concept and
design, as well as the interpretation of the data. XS, RD, HG, MZ,
WZ, CM and JM acquired and analyzed the data. XS, RD, CM and JM
drafted the manuscript. CM and JM are responsible for the integrity
of the work as a whole. All authors read and approved the final
version of the manuscript.
Ethics approval and consent to
participate
Not applicable.
Patient consent for publication
Not applicable.
Competing interests
The authors declare that they have no competing
interests.
References
|
1
|
Bray F, Ferlay J, Soerjomataram I, Siegel
RL, Torre LA and Jemal A: Global cancer statistics 2018: GLOBOCAN
estimates of incidence and mortality worldwide for 36 cancers in
185 countries. CA Cancer J Clin. 68:394–424. 2018. View Article : Google Scholar : PubMed/NCBI
|
|
2
|
Chen W, Zheng R, Baade PD, Zhang S, Zeng
H, Bray F, Jemal A, Yu XQ and He J: Cancer statistics in China,
2015. CA Cancer J Clin. 66:115–132. 2016. View Article : Google Scholar : PubMed/NCBI
|
|
3
|
Liu S, Yao X, Zhang D, Sheng J, Wen X,
Wang Q, Chen G, Li Z, Du Z and Zhang X: Analysis of transcription
factor-related regulatory networks based on bioinformatics analysis
and validation in hepatocellular carcinoma. Biomed Res Int.
2018:14313962018. View Article : Google Scholar : PubMed/NCBI
|
|
4
|
Gao X, Wang X and Zhang S: Bioinformatics
identification of crucial genes and pathways associated with
hepatocellular carcinoma. Biosci Rep. 38:2018. View Article : Google Scholar
|
|
5
|
Zhuang L, Yang Z and Meng Z: Upregulation
of BUB1B, CCNB1, CDC7, CDC20, and MCM3 in tumor tissues predicted
worse overall survival and disease-free survival in hepatocellular
carcinoma patients. Biomed Res Int. 2018:78973462018. View Article : Google Scholar : PubMed/NCBI
|
|
6
|
Li N, Li L and Chen Y: The identification
of core gene expression signature in hepatocellular carcinoma. Oxid
Med Cell Longev. 2018:34783052018. View Article : Google Scholar : PubMed/NCBI
|
|
7
|
Zhu Q, Sun Y, Zhou Q, He Q and Qian H:
Identification of key genes and pathways by bioinformatics analysis
with TCGA RNA sequencing data in hepatocellular carcinoma. Mol Clin
Oncol. 9:597–606. 2018.PubMed/NCBI
|
|
8
|
Kuleshov MV, Jones MR, Rouillard AD,
Fernandez NF, Duan Q, Wang Z, Koplev S, Jenkins SL, Jagodnik KM,
Lachmann A, et al: Enrichr: A comprehensive gene set enrichment
analysis web server 2016 update. Nucleic Acids Res. 44:W90–W97.
2016. View Article : Google Scholar : PubMed/NCBI
|
|
9
|
Szklarczyk D, Morris JH, Cook H, Kuhn M,
Wyder S, Simonovic M, Santos A, Doncheva NT, Roth A, Bork P, et al:
The STRING database in 2017: Quality-controlled protein-protein
association networks, made broadly accessible. Nucleic Acids Res.
45:D362–D368. 2017. View Article : Google Scholar : PubMed/NCBI
|
|
10
|
Chin CH, Chen SH, Wu HH, Ho CW, Ko MT and
Lin CY: CytoHubba: Identifying hub objects and sub-networks from
complex interactome. BMC Syst Biol. 8 (Suppl 4):S112014. View Article : Google Scholar : PubMed/NCBI
|
|
11
|
Rhodes DR, Kalyana-Sundaram S, Mahavisno
V, Varambally R, Yu J, Briggs BB, Barrette TR, Anstet MJ,
Kincead-Beal C, Kulkarni P, et al: Oncomine 3.0: Genes, pathways,
and networks in a collection of 18,000 cancer gene expression
profiles. Neoplasia. 9:166–180. 2007. View Article : Google Scholar : PubMed/NCBI
|
|
12
|
Tang Z, Li C, Kang B, Gao G, Li C and
Zhang Z: GEPIA: A web server for cancer and normal gene expression
profiling and interactive analyses. Nucleic Acids Res. 45:W98–W102.
2017. View Article : Google Scholar : PubMed/NCBI
|
|
13
|
Asplund A, Edqvist PH, Schwenk JM and
Pontén F: Antibodies for profiling the human proteome-The Human
Protein Atlas as a resource for cancer research. Proteomics.
12:2067–2077. 2012. View Article : Google Scholar : PubMed/NCBI
|
|
14
|
Cerami E, Gao J, Dogrusoz U, Gross BE,
Sumer SO, Aksoy BA, Jacobsen A, Byrne CJ, Heuer ML, Larsson E, et
al: The cBio cancer genomics portal: An open platform for exploring
multidimensional cancer genomics data. Cancer Discov. 2:401–404.
2012. View Article : Google Scholar : PubMed/NCBI
|
|
15
|
Menyhárt O, Nagy Á and Győrffy B:
Determining consistent prognostic biomarkers of overall survival
and vascular invasion in hepatocellular carcinoma. R Soc Open Sci.
5:1810062018. View Article : Google Scholar : PubMed/NCBI
|
|
16
|
Hydbring P, Malumbres M and Sicinski P:
Non-canonical functions of cell cycle cyclins and cyclin-dependent
kinases. Nat Rev Mol Cell Biol. 17:280–292. 2016. View Article : Google Scholar : PubMed/NCBI
|
|
17
|
von Bergwelt-Baildon MS, Kondo E,
Klein-González N and Wendtner CM: The cyclins: A family of widely
expressed tumor antigens? Expert Rev Vaccines. 10:389–395. 2011.
View Article : Google Scholar : PubMed/NCBI
|
|
18
|
Ding K, Li W, Zou Z, Zou X and Wang C:
CCNB1 is a prognostic biomarker for ER+ breast cancer. Med
Hypotheses. 83:359–364. 2014. View Article : Google Scholar : PubMed/NCBI
|
|
19
|
Fang Y, Yu H, Liang X, Xu J and Cai X:
Chk1-induced CCNB1 overexpression promotes cell proliferation and
tumor growth in human colorectal cancer. Cancer Biol Ther.
15:1268–1279. 2014. View Article : Google Scholar : PubMed/NCBI
|
|
20
|
Dobashi Y, Shoji M, Jiang SX, Kobayashi M,
Kawakubo Y and Kameya T: Active cyclin A-CDK2 complex, a possible
critical factor for cell proliferation in human primary lung
carcinomas. Am J Pathol. 153:963–972. 1998. View Article : Google Scholar : PubMed/NCBI
|
|
21
|
Volm M, Koomägi R, Mattern J and Stammler
G: Cyclin A is associated with an unfavourable outcome in patients
with non-small-cell lung carcinomas. Br J Cancer. 75:1774–1778.
1997. View Article : Google Scholar : PubMed/NCBI
|
|
22
|
Kühling H, Alm P, Olsson H, Fernö M,
Baldetorp B, Parwaresch R and Rudolph P: Expression of cyclins E,
A, and B, and prognosis in lymph node-negative breast cancer. J
Pathol. 199:424–431. 2003. View Article : Google Scholar : PubMed/NCBI
|
|
23
|
Wang A, Yoshimi N, Ino N, Tanaka T and
Mori H: Overexpression of cyclin B1 in human colorectal cancers. J
Cancer Res Clin Oncol. 123:124–127. 1997. View Article : Google Scholar : PubMed/NCBI
|
|
24
|
Soria JC, Jang SJ, Khuri FR, Hassan K, Liu
D, Hong WK and Mao L: Overexpression of cyclin B1 in early-stage
non-small cell lung cancer and its clinical implication. Cancer
Res. 60:4000–4004. 2000.PubMed/NCBI
|
|
25
|
Handa K, Yamakawa M, Takeda H, Kimura S
and Takahashi T: Expression of cell cycle markers in colorectal
carcinoma: Superiority of cyclin A as an indicator of poor
prognosis. Int J Cancer. 84:225–233. 1999. View Article : Google Scholar : PubMed/NCBI
|
|
26
|
Hofmann HS, Hansen G, Burdach S, Bartling
B, Silber RE and Simm A: Discrimination of human lung neoplasm from
normal lung by two target genes. Am J Respir Crit Care Med.
170:516–519. 2004. View Article : Google Scholar : PubMed/NCBI
|
|
27
|
Andrisani OM, Studach L and Merle P: Gene
signatures in hepatocellular carcinoma (HCC). Semin Cancer Biol.
21:4–9. 2011. View Article : Google Scholar : PubMed/NCBI
|
|
28
|
Yin L, Chang C and Xu C: G2/M checkpoint
plays a vital role at the early stage of HCC by analysis of key
pathways and genes. Oncotarget. 8:76305–76317. 2017. View Article : Google Scholar : PubMed/NCBI
|
|
29
|
Chai N, Xie HH, Yin JP, Sa KD, Guo Y, Wang
M, Liu J, Zhang XF, Zhang X, Yin H, et al: FOXM1 promotes
proliferation in human hepatocellular carcinoma cells by
transcriptional activation of CCNB1. Biochem Biophys Res Commun.
500:924–929. 2018. View Article : Google Scholar : PubMed/NCBI
|
|
30
|
Chen QF, Xia JG, Li W, Shen LJ, Huang T
and Wu P: Examining the key genes and pathways in hepatocellular
carcinoma development from hepatitis B virus-positive cirrhosis.
Mol Med Rep. 18:4940–4950. 2018.PubMed/NCBI
|
|
31
|
Cohen Y, Gutwein O, Garach-Jehoshua O,
Bar-Haim A and Kornberg A: The proliferation arrest of primary
tumor cells out-of-niche is associated with widespread
downregulation of mitotic and transcriptional genes. Hematology.
19:286–292. 2014. View Article : Google Scholar : PubMed/NCBI
|
|
32
|
Zhang Q, Su R, Shan C, Gao C and Wu P:
Non-SMC condensin I complex, subunit G (NCAPG) is a novel mitotic
gene required for hepatocellular cancer cell proliferation and
migration. Oncol Res. 26:269–276. 2018. View Article : Google Scholar : PubMed/NCBI
|
|
33
|
Liu W, Liang B, Liu H, Huang Y, Yin X,
Zhou F, Yu X, Feng Q, Li E, Zou Z and Wu L: Overexpression of
non-SMC condensin I complex subunit G serves as a promising
prognostic marker and therapeutic target for hepatocellular
carcinoma. Int J Mol Med. 40:731–738. 2017. View Article : Google Scholar : PubMed/NCBI
|
|
34
|
Li B, Pu K and Wu X: Identifying novel
biomarkers in hepatocellular carcinoma by weighted gene
co-expression network analysis. J Cell Biochem. Feb 11–2019.(Epub
ahead of print).
|
|
35
|
Liu ZK, Zhang RY, Yong YL, Zhang ZY, Li C,
Chen ZN and Bian H: Identification of crucial genes based on
expression profiles of hepatocellular carcinomas by bioinformatics
analysis. PeerJ. 7:e74362019. View Article : Google Scholar : PubMed/NCBI
|
|
36
|
Zhou L, Du Y, Kong L, Zhang X and Chen Q:
Identification of molecular target genes and key pathways in
hepatocellular carcinoma by bioinformatics analysis. Onco Targets
Ther. 11:1861–1869. 2018. View Article : Google Scholar : PubMed/NCBI
|
|
37
|
Sun H, Zhang L, Shi C, Hu P, Yan W, Wang
Z, Duan Q, Lu F, Qin L, Lu T, et al: TOPK is highly expressed in
circulating tumor cells, enabling metastasis of prostate cancer.
Oncotarget. 6:12392–12404. 2015. View Article : Google Scholar : PubMed/NCBI
|
|
38
|
Park JH, Lin ML, Nishidate T, Nakamura Y
and Katagiri T: PDZ-binding kinase/T-LAK cell-originated protein
kinase, a putative cancer/testis antigen with an oncogenic activity
in breast cancer. Cancer Res. 66:9186–9195. 2006. View Article : Google Scholar : PubMed/NCBI
|
|
39
|
Ohashi T, Komatsu S, Ichikawa D, Miyamae
M, Okajima W, Imamura T, Kiuchi J, Kosuga T, Konishi H, Shiozaki A,
et al: Overexpression of PBK/TOPK relates to tumour malignant
potential and poor outcome of gastric carcinoma. Br J Cancer.
116:218–226. 2017. View Article : Google Scholar : PubMed/NCBI
|
|
40
|
Wei DC, Yeh YC, Hung JJ, Chou TY, Wu YC,
Lu PJ, Cheng HC, Hsu YL, Kuo YL, Chen KY and Lai JM: Overexpression
of T-LAK cell-originated protein kinase predicts poor prognosis in
patients with stage I lung adenocarcinoma. Cancer Sci. 103:731–738.
2012. View Article : Google Scholar : PubMed/NCBI
|
|
41
|
Yue C, Ren Y, Ge H, Liang C, Xu Y, Li G
and Wu J: Comprehensive analysis of potential prognostic genes for
the construction of a competing endogenous RNA regulatory network
in hepatocellular carcinoma. Onco Targets Ther. 12:561–576. 2019.
View Article : Google Scholar : PubMed/NCBI
|
|
42
|
Yang YF, Pan YH, Cao Y, Fu J, Yang X,
Zhang MF and Tian QH: PDZ binding kinase, regulated by FoxM1,
enhances malignant phenotype via activation of β-catenin signaling
in hepatocellular carcinoma. Oncotarget. 8:47195–47205.
2017.PubMed/NCBI
|
|
43
|
Raemaekers T, Ribbeck K, Beaudouin J,
Annaert W, Van Camp M, Stockmans I, Smets N, Bouillon R, Ellenberg
J and Carmeliet G: NuSAP, a novel microtubule-associated protein
involved in mitotic spindle organization. J Cell Biol.
162:1017–1029. 2003. View Article : Google Scholar : PubMed/NCBI
|
|
44
|
Gulzar ZG, McKenney JK and Brooks JD:
Increased expression of NuSAP in recurrent prostate cancer is
mediated by E2F1. Oncogene. 32:70–77. 2013. View Article : Google Scholar : PubMed/NCBI
|
|
45
|
Kokkinakis DM, Liu X and Neuner RD:
Modulation of cell cycle and gene expression in pancreatic tumor
cell lines by methionine deprivation (methionine stress):
Implications to the therapy of pancreatic adenocarcinoma. Mol
Cancer Ther. 4:1338–1348. 2005. View Article : Google Scholar : PubMed/NCBI
|
|
46
|
Zhang X, Pan Y, Fu H and Zhang J:
Nucleolar and spindle associated protein 1 (NUSAP1) inhibits cell
proliferation and enhances susceptibility to epirubicin in invasive
breast cancer cells by regulating cyclin D kinase (CDK1) and DLGAP5
expression. Med Sci Monit. 24:8553–8564. 2018. View Article : Google Scholar : PubMed/NCBI
|
|
47
|
Roy S, Hooiveld GJ, Seehawer M, Caruso S,
Heinzmann F, Schneider AT, Frank AK, Cardenas DV, Sonntag R, Luedde
M, et al: microRNA 193a-5p regulates levels of nucleolar- and
spindle-associated protein 1 to suppress hepatocarcinogenesis.
Gastroenterology. 155:1951.e26–1966.e26. 2018. View Article : Google Scholar
|
|
48
|
Vader G and Lens SM: The Aurora kinase
family in cell division and cancer. Biochim Biophys Acta.
1786:60–72. 2008.PubMed/NCBI
|
|
49
|
Li X, Xu W, Kang W, Wong SH, Wang M, Zhou
Y, Fang X, Zhang X, Yang H, Wong CH, et al: Genomic analysis of
liver cancer unveils novel driver genes and distinct prognostic
features. Theranostics. 8:1740–1751. 2018. View Article : Google Scholar : PubMed/NCBI
|
|
50
|
Simon EP, Freije CA, Farber BA, Lalazar G,
Darcy DG, Honeyman JN, Chiaroni-Clarke R, Dill BD, Molina H, Bhanot
UK, et al: Transcriptomic characterization of fibrolamellar
hepatocellular carcinoma. Proc Natl Acad Sci USA. 112:E5916–E5925.
2015. View Article : Google Scholar : PubMed/NCBI
|
|
51
|
Chen C, Song G, Xiang J, Zhang H, Zhao S
and Zhan Y: AURKA promotes cancer metastasis by regulating
epithelial-mesenchymal transition and cancer stem cell properties
in hepatocellular carcinoma. Biochem Biophys Res Commun.
486:514–520. 2017. View Article : Google Scholar : PubMed/NCBI
|
|
52
|
Jeng YM, Peng SY, Lin CY and Hsu HC:
Overexpression and amplification of Aurora-A in hepatocellular
carcinoma. Clin Cancer Res. 10:2065–2071. 2004. View Article : Google Scholar : PubMed/NCBI
|
|
53
|
Zhang K, Chen J, Chen D, Huang J, Feng B,
Han S, Chen Y, Song H, De W, Zhu Z, et al: Aurora-A promotes
chemoresistance in hepatocelluar carcinoma by targeting
NF-kappaB/microRNA-21/PTEN signaling pathway. Oncotarget.
5:12916–12935. 2014.PubMed/NCBI
|
|
54
|
Wang B, Hsu CJ, Chou CH, Lee HL, Chiang
WL, Su CM, Tsai HC, Yang SF and Tang CH: Variations in the AURKA
gene: Biomarkers for the development and progression of
hepatocellular carcinoma. Int J Med Sci. 15:170–175. 2018.
View Article : Google Scholar : PubMed/NCBI
|
|
55
|
Lu L, Han H, Tian Y, Li W, Zhang J, Feng M
and Li Y: Aurora kinase A mediates c-Myc's oncogenic effects in
hepatocellular carcinoma. Mol Carcinog. 54:1467–1479. 2015.
View Article : Google Scholar : PubMed/NCBI
|
|
56
|
Zhu Q, Luo M, Zhou C, Zhou Z, He Z, Yu X
and Zhou S: A proteomics-based investigation on the anticancer
activity of alisertib, an Aurora kinase A inhibitor, in
hepatocellular carcinoma Hep3B cells. Am J Transl Res. 9:3558–3572.
2017.PubMed/NCBI
|
|
57
|
Yang XY, Wu B, Ma SL, Yin L, Wu MC and Li
AJ: Decreased expression of ZWINT is associated with poor prognosis
in patients with HCC after surgery. Technol Cancer Res Treat.
17:15330338187941902018. View Article : Google Scholar : PubMed/NCBI
|
|
58
|
Ying H, Xu Z, Chen M, Zhou S, Liang X and
Cai X: Overexpression of Zwint predicts poor prognosis and promotes
the proliferation of hepatocellular carcinoma by regulating
cell-cycle-related proteins. Onco Targets Ther. 11:689–702. 2018.
View Article : Google Scholar : PubMed/NCBI
|
|
59
|
Liu X, Li Y, Meng L, Liu XY, Peng A, Chen
Y, Liu C, Chen H, Sun S, Miao X, et al: Reducing protein regulator
of cytokinesis 1 as a prospective therapy for hepatocellular
carcinoma. Cell Death Dis. 9:5342018. View Article : Google Scholar : PubMed/NCBI
|
|
60
|
Chen J, Rajasekaran M, Xia H, Zhang X,
Kong SN, Sekar K, Seshachalam VP, Deivasigamani A, Goh BK, Ooi LL,
et al: The microtubule-associated protein PRC1 promotes early
recurrence of hepatocellular carcinoma in association with the
Wnt/β-catenin signalling pathway. Gut. 65:1522–1534. 2016.
View Article : Google Scholar : PubMed/NCBI
|
|
61
|
Wang Y, Shi F, Xing GH, Xie P, Zhao N, Yin
YF, Sun SY, He J, Wang Y and Xuan SY: Protein regulator of
cytokinesis PRC1 confers chemoresistance and predicts an
unfavorable postoperative survival of hepatocellular carcinoma
patients. J Cancer. 8:801–808. 2017. View Article : Google Scholar : PubMed/NCBI
|
|
62
|
Wu G and Chen PL: Structural requirements
of chromokinesin Kif4A for its proper function in mitosis. Biochem
Biophys Res Commun. 372:454–458. 2008. View Article : Google Scholar : PubMed/NCBI
|
|
63
|
Huang Y, Wang H, Lian Y, Wu X, Zhou L,
Wang J, Deng M and Huang Y: Upregulation of kinesin family member
4A enhanced cell proliferation via activation of Akt signaling and
predicted a poor prognosis in hepatocellular carcinoma. Cell Death
Dis. 9:1412018. View Article : Google Scholar : PubMed/NCBI
|
|
64
|
Chen J, Li S, Zhou S, Cao S, Lou Y, Shen
H, Yin J and Li G: Kinesin superfamily protein expression and its
association with progression and prognosis in hepatocellular
carcinoma. J Cancer Res Ther. 13:651–659. 2017. View Article : Google Scholar : PubMed/NCBI
|
|
65
|
Hou G, Dong C, Dong Z, Liu G, Xu H, Chen
L, Liu L, Wang H and Zhou W: Upregulate KIF4A enhances
proliferation, invasion of hepatocellular carcinoma and indicates
poor prognosis across human cancer types. Sci Rep. 7:41482017.
View Article : Google Scholar : PubMed/NCBI
|