Introduction
Lung cancer ranks first among all malignant tumors
in regards to morbidity and mortality worldwide, with 2.1 million
new lung cancer cases and 1.8 million deaths expected worldwide in
2018 (1). Non-small cell lung
cancer (NSCLC) accounts for 85% of all lung cancer cases, and
targeted therapy and immunotherapy for NSCLC treatment are
developing rapidly (2,3). Accurate judgment and prognostic
assessment are important factors influencing the appropriate
treatment for each individual case. The current TNM staging system
has been tested over time and remains the most powerful prognostic
instrument for lung cancer (4).
However, due to the heterogeneity of the tumor itself and the
complexity of the pathogenesis, even patients with the same TNM
stage and treatment may exhibit various clinical outcomes (5). The current direction is to combine TNM
with other prognostic factors to create a comprehensive prognostic
indicator for NSCLC.
The tumor immune microenvironment (TIME) consists of
immune cells, mesenchymal cells, endothelial cells, inflammatory
mediators, and extracellular matrix (ECM) molecules (6,7). The
type, density and location of immune cells in TIME play an
important role in the development of the disease and have been
proposed to be valuable for the diagnosis and prognostic assessment
of tumors (8). Therefore,
immunological structures based on TIME should be used as a separate
component in the classification system (9). Immunological analysis of the TIME
(immunoscore) shows great promise for improved prognosis and
prediction of response to immunotherapy. Several reports have
demonstrated that immune scores and stromal scores calculated based
on the ESTIMATE algorithm could predict the infiltration of
non-tumor cells, by analyzing specific gene expression signature of
immune and stromal cells (10–13).
For the first time in the present study, using the
Gene Expression Omnibus (GEO) database of the NSCLC cohort and the
immune score derived from the ESTIMATE algorithm, we extracted a
genetic signature closely related to the TIME that predict the
prognosis of lung cancer patients. Then the CIBERSORT method was
used to quantify the relative levels of different immune cell types
in complex gene expression mixtures. Furthermore, the validity and
reliability of the gene signature were further verified. Our
findings suggest that the genetic signature closely related to TIME
is able to predict the prognosis of NSCLC patients, and provide
some reference for immunotherapy.
Materials and methods
Data source and processing
Gene-expression profiling data of NSCLC patients
were downloaded from Gene Expression Omnibus datasets (GEO;
GSE103584 and GSE31210) and The Cancer Genome Atlas (TCGA;
http://tcga-data.nci.nih.gov/tcga/).
Microarray analysis of 130 NSCLC patients in GSE103584 was based on
CancerSCAN panel (14). Dataset
GSE103584 was used as a training set for model construction, and
data in GSE31210 (15) and TCGA
were applied to verify the validity of the model.
ESTIMATE algorithm-derived immune
scores
Immune scores were calculated by applying the
ESTIMATE algorithm using gene expression data.
The algorithm was publicly available through the
SourceForge software repository (https://sourceforge.net/projects/estimateproject/)
(13). The algorithm was based on
single-sample gene set enrichment analysis and generates immune
score (indicating the infiltration of immune cells in tumor
tissue).
Differential gene screening related to
immune scores and enrichment analysis of differentially expressed
genes
The immune score for each sample in the training set
was calculated according to the ESTIMATE algorithm, and the best
cutoff value was generated using X-tile plots (16). Data analysis was performed using
packaging limma (17). The
relapse-free survival is defined as time from randomization to the
first reucurrence or death. The overall survival is defined as the
time from the initial confirmed diagnosis to the death of any
cause. Fold change >1.5 and adj. P<0.05 were set as the
cutoff value for screening differentially expressed genes. First,
the low immune score and high immune score samples were normalized
by the limma package, and then the differential genes were screened
to obtain 448 differentially expressed genes.
Functional enrichment analysis of the differential
genes was performed using Database for Annotation, Visualization
and Integrated Discovery (DAVID) (18) and GO categories were identified by
their biological processes (BP), molecular functions (MF) and
cellular components (CC). The DAVID database was also used for
pathway enrichment analysis with reference to the Kyoto
Encyclopedia of Gene and Genomic (KEGG) pathway. False discovery
rate (FDR) <0.05 was used as the cutoff.
Screening for prognosis-related genes
and building risk models
LASSO is a superior high-dimensional regression
classifier and was used to select the key genes influencing patient
outcomes (19). LASSO 1000
iterations were performed using the publicly available R package
glmnet (20). Multiple genomes
containing the optimal solution were received after multiple
dimensionality reduction. At the same time, for the stability and
accuracy of the results, a random sampling method of leave-one-out
cross-validation (LOOCV) was used to select a set of genes to
construct a prognostic model (19).
According to the selected genetic model, a risk
formula of risk score was constructed to evaluate the high-risk and
low-risk groups. The formula for obtaining the score is
Σiωiχi, where ωi and
χi are the coefficients and expressed value of each
gene. The risk score for each sample in the data in the training
set was calculated according to the formula, and the best cutoff
value was generated using X-tile plots (16). This threshold was set to classify
patients: Higher than the best cutoff for the low-risk group and
lower than the risk score for the high-risk group.
Estimating the composition of immune
cells
To estimate the immune cell composition in the
sample, the analytical platform CIBERSORT (https://cibersort.stanford.edu/) was used to quantify
the relative levels of distinct immune cell types within a complex
gene expression mixture (21). The
analysis was performed with an arrangement of 100 default
statistical parameters. The activation and quiescence state of the
same type of immune cells were analyzed as a whole. CIBERSORT's
deconvolution of gene expression data provides valuable information
about the composition of immune cells in a sample.
Validation of the validity and
reliability
Univariate survival analysis of the gene signature
was assessed by using survival in R language (P<0.05) (22). Then survival receiver operating
characteristic curve (ROC) was used to complete the area under the
curve (AUC) of gene signature and TNM classification (23). External data from GSE31210 and TCGA
were applied to verify the reliability of the gene signature's
impact on the prognosis of the patients.
The univariate and multivariate Cox proportional
hazard regression analyses were used to evaluate independent
prognostic factors associated with survival. Gene signature, age,
sex, smoking status, T stage T, N stage, histology, grade,
epidermal growth factor receptor (EGFR) mutation status and
adjuvant chemotherapy were employed as covariates. In addition, the
logistic regression analysis were used to analyze the association
between the clinical related factors and risk model of gene
signature construction.
Results
Correlation between immune score and
overall survival in patients with NSCLC
There were 13,035 gene expression profiles obtained
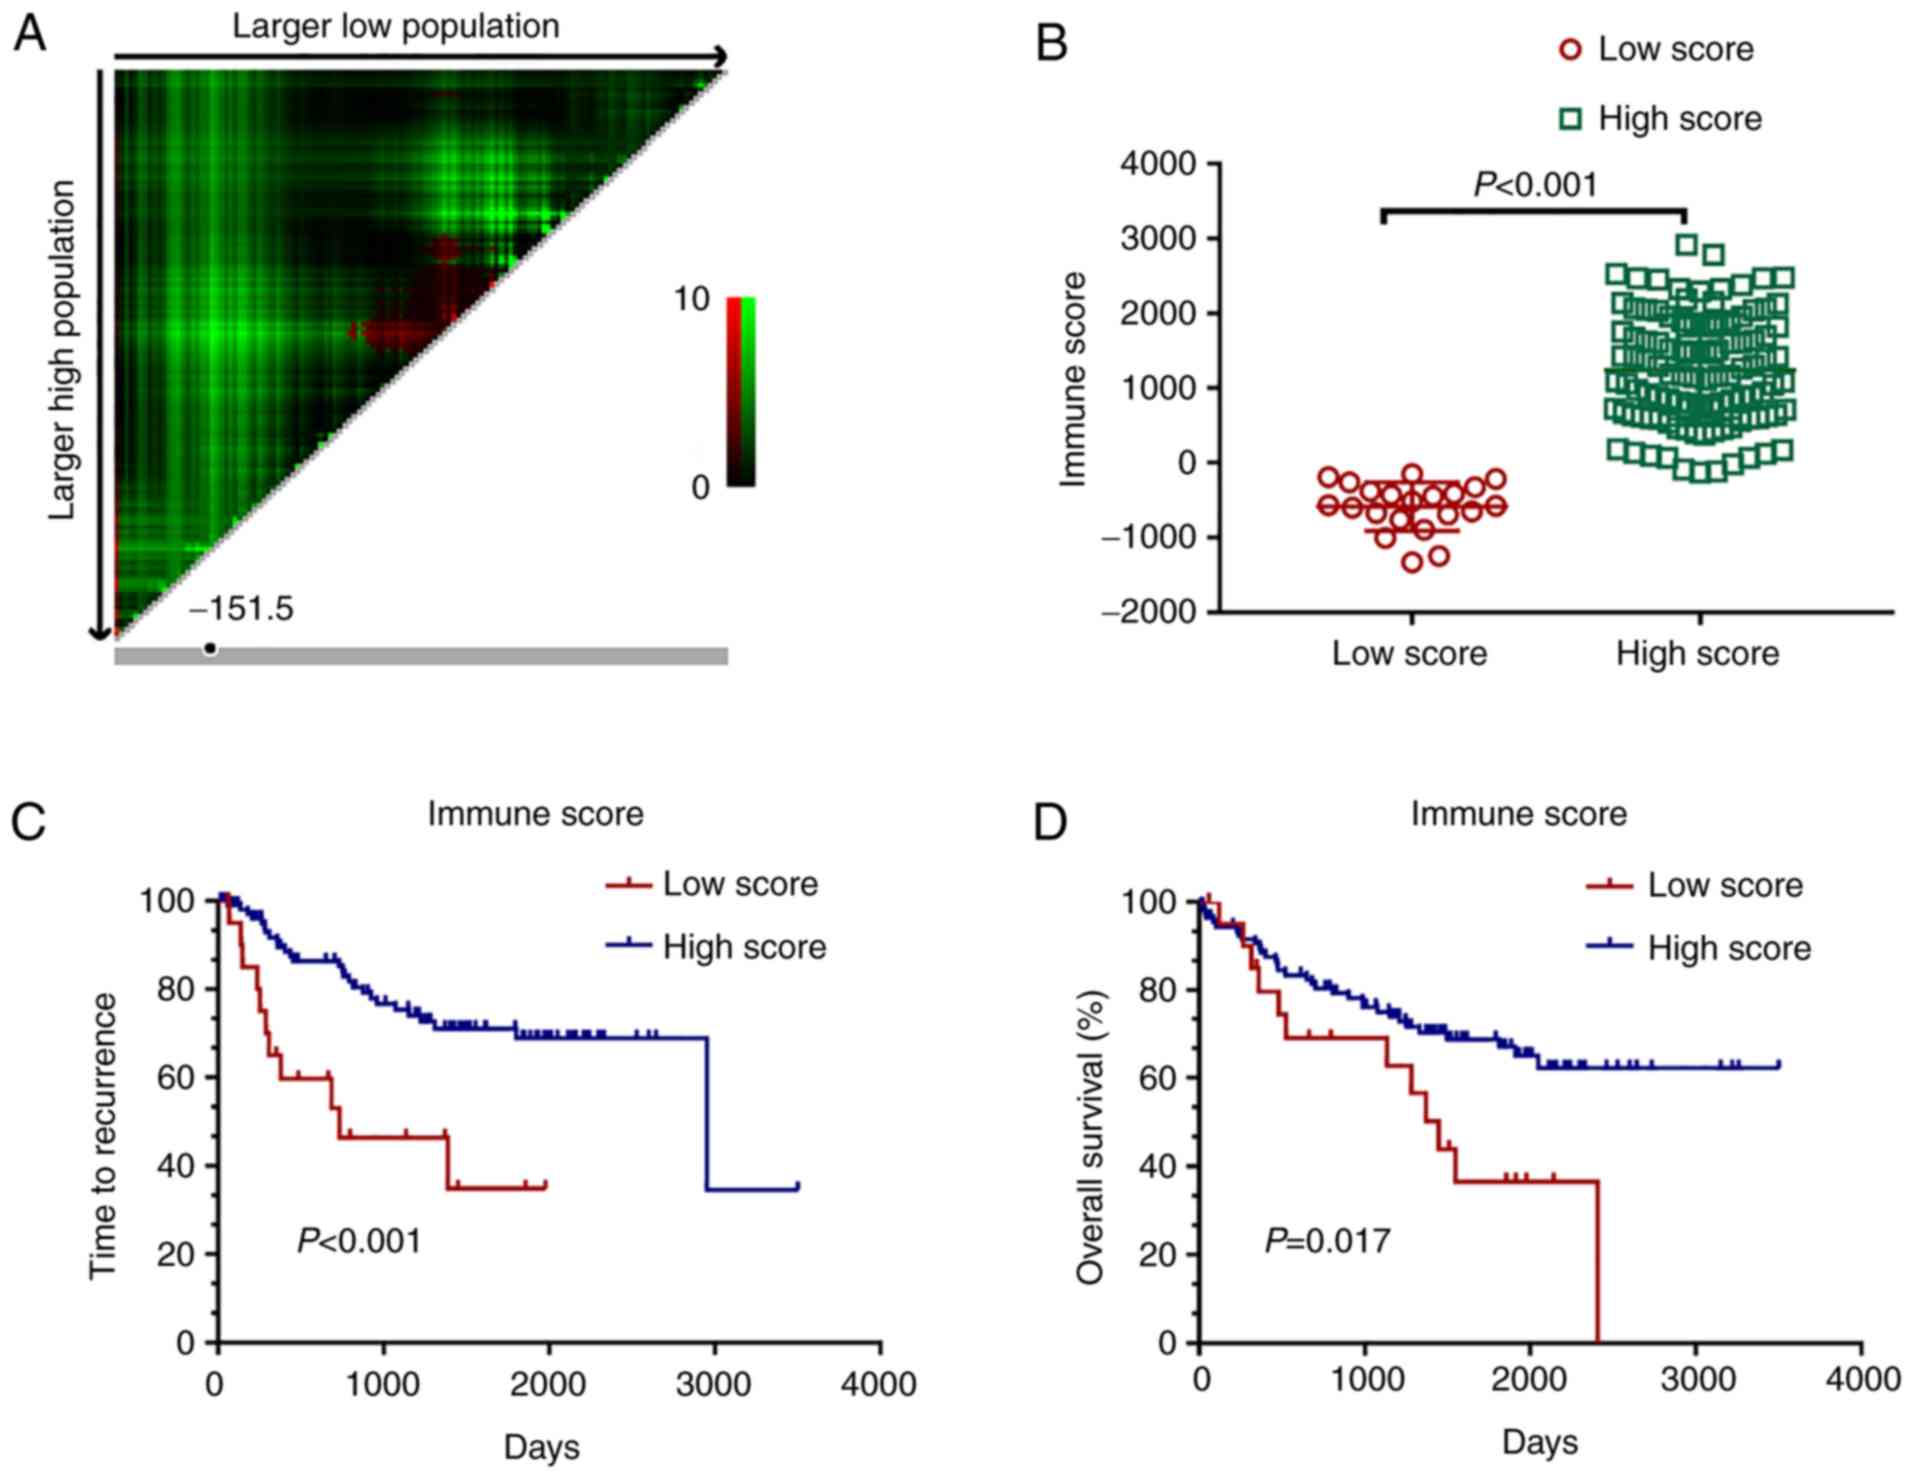
from 130 tumor samples in the dataset GSE103584 (Table SI). After normalizing the data of
130 samples, the immune score, stromal score, and estimate score
were calculated by immunocyte-related genes (Table SII). The 21 low immune score
samples and 109 high immune score samples were divided by X-tile
plots (Fig. 1A and B, P<0.001).
Kaplan-Meier survival curves showed that the relapse-free survival
of patients with the high score group of immune scores was longer
than that when compared with the patients in the low score group
(Fig. 1C, P<0.001).
Consistently, patients with high immune scores also showed longer
overall survival compared to the patients with low scores (Fig. 1D, P=0.017).
Differential gene screening related to
immune scores and enrichment analysis of the differential
genes
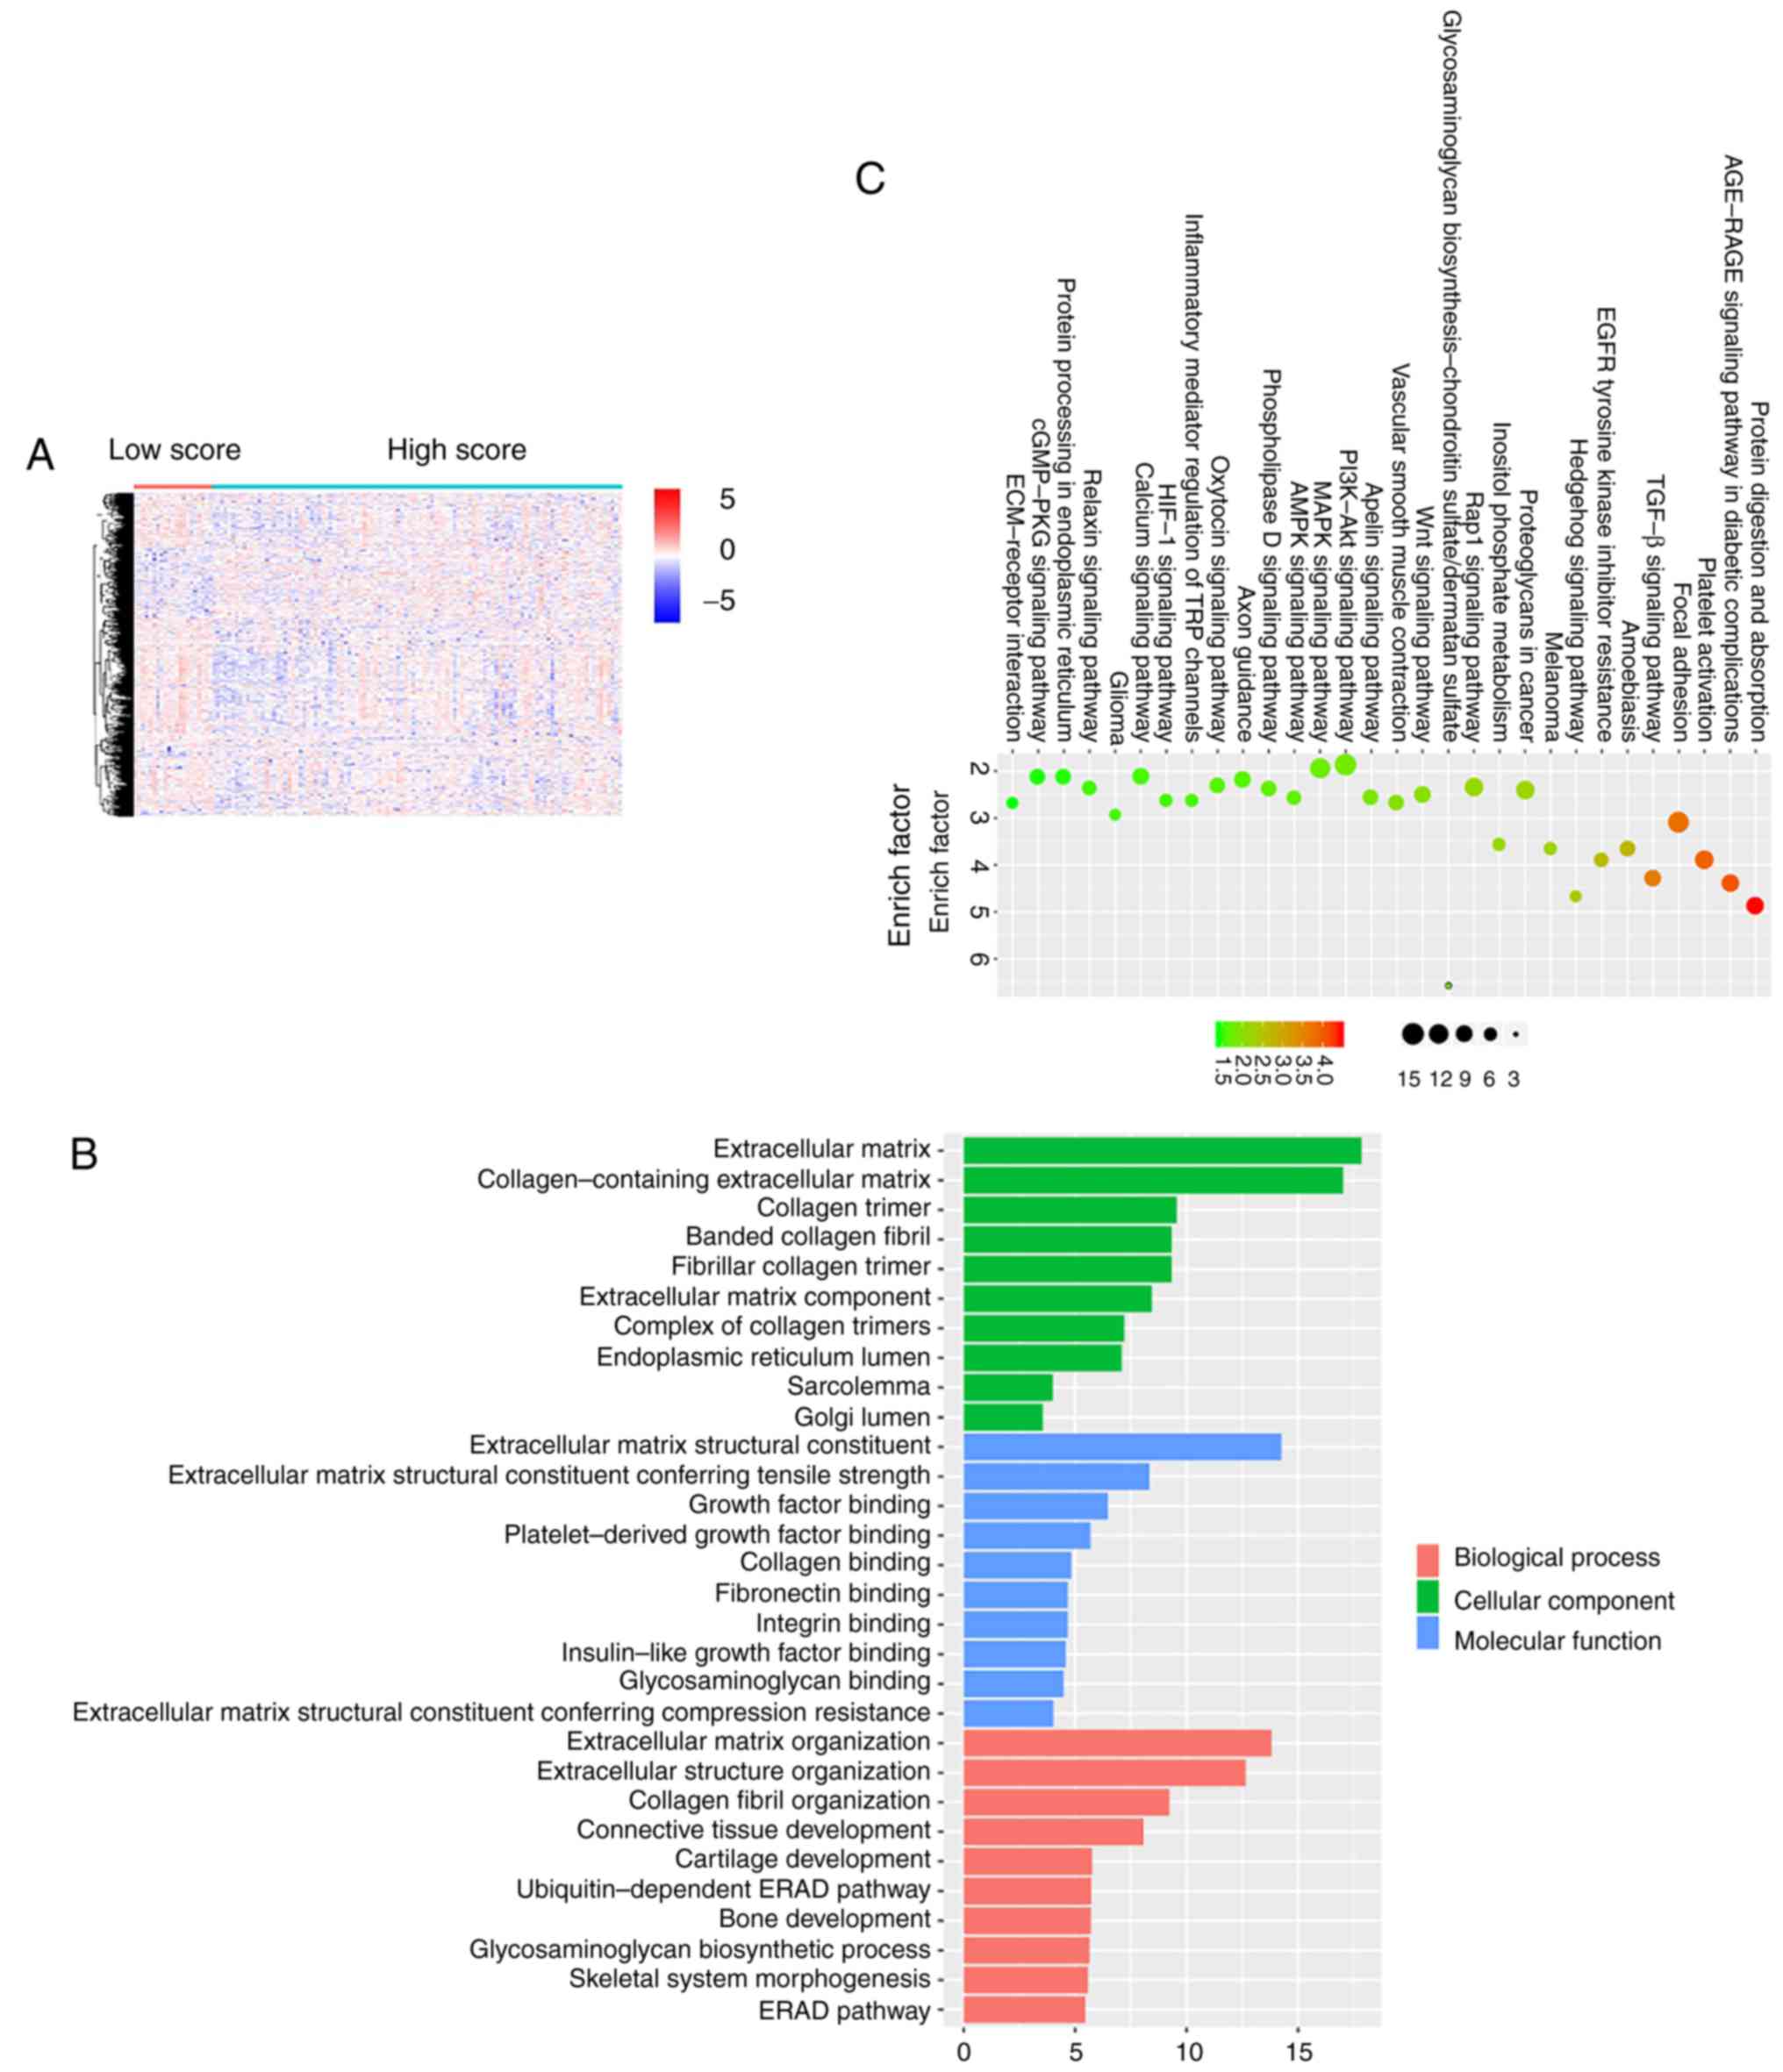
To reveal the correlation of gene expression
profiles with immune scores, we compared the gene microarray data
of all 130 cases obtained in the dataset GSE103584. The low immune
score and high immune score samples were normalized by the limma
package and 448 differential genes were extracted from the
comparison of high vs. low immune score groups. Heatmaps showed
distinct gene expression profiles of cases in the low vs. high low
immune score groups (Fig. 2A).
To analyze the potential functions of differential
genes, we performed functional enrichment analysis on 448
differentially expressed genes. The Gene Ontology (GO) terminology
was identified. The top 10 positions of the GO term for biological
processes, cellular component terms and molecular functions are
listed (Fig. 2B). The top GO terms
included ‘extracellular matrix organization’ and ‘extracellular
structure organization’ closely related to the immune
microenvironment of tumors. In addition, pathway enrichment
analysis with reference to KEGG mainly focused on ‘protein
digestion and absorption’, ‘AGE-RAGE signaling pathway in diabetic
complications’, ‘platelet activation and focal adhesion’ which also
had a relationship with immune response (Fig. 2C).
Screening genes associated with
prognosis and building risk models
We applied the LASSO Cox regression model to predict
and analyze the most valuable prognostic genes among the 448
differential genes in the 130 sample data. A random sampling method
of 10-cross validation was used to construct a prognostic model
containing 10 genes (Fig. 3A).
Through calculation and verification, it was found that the model
constructed by 10 genes had the lowest error rate (Fig. 3B). Fig.
3C shows the specific information and coefficients of the 10
genes.
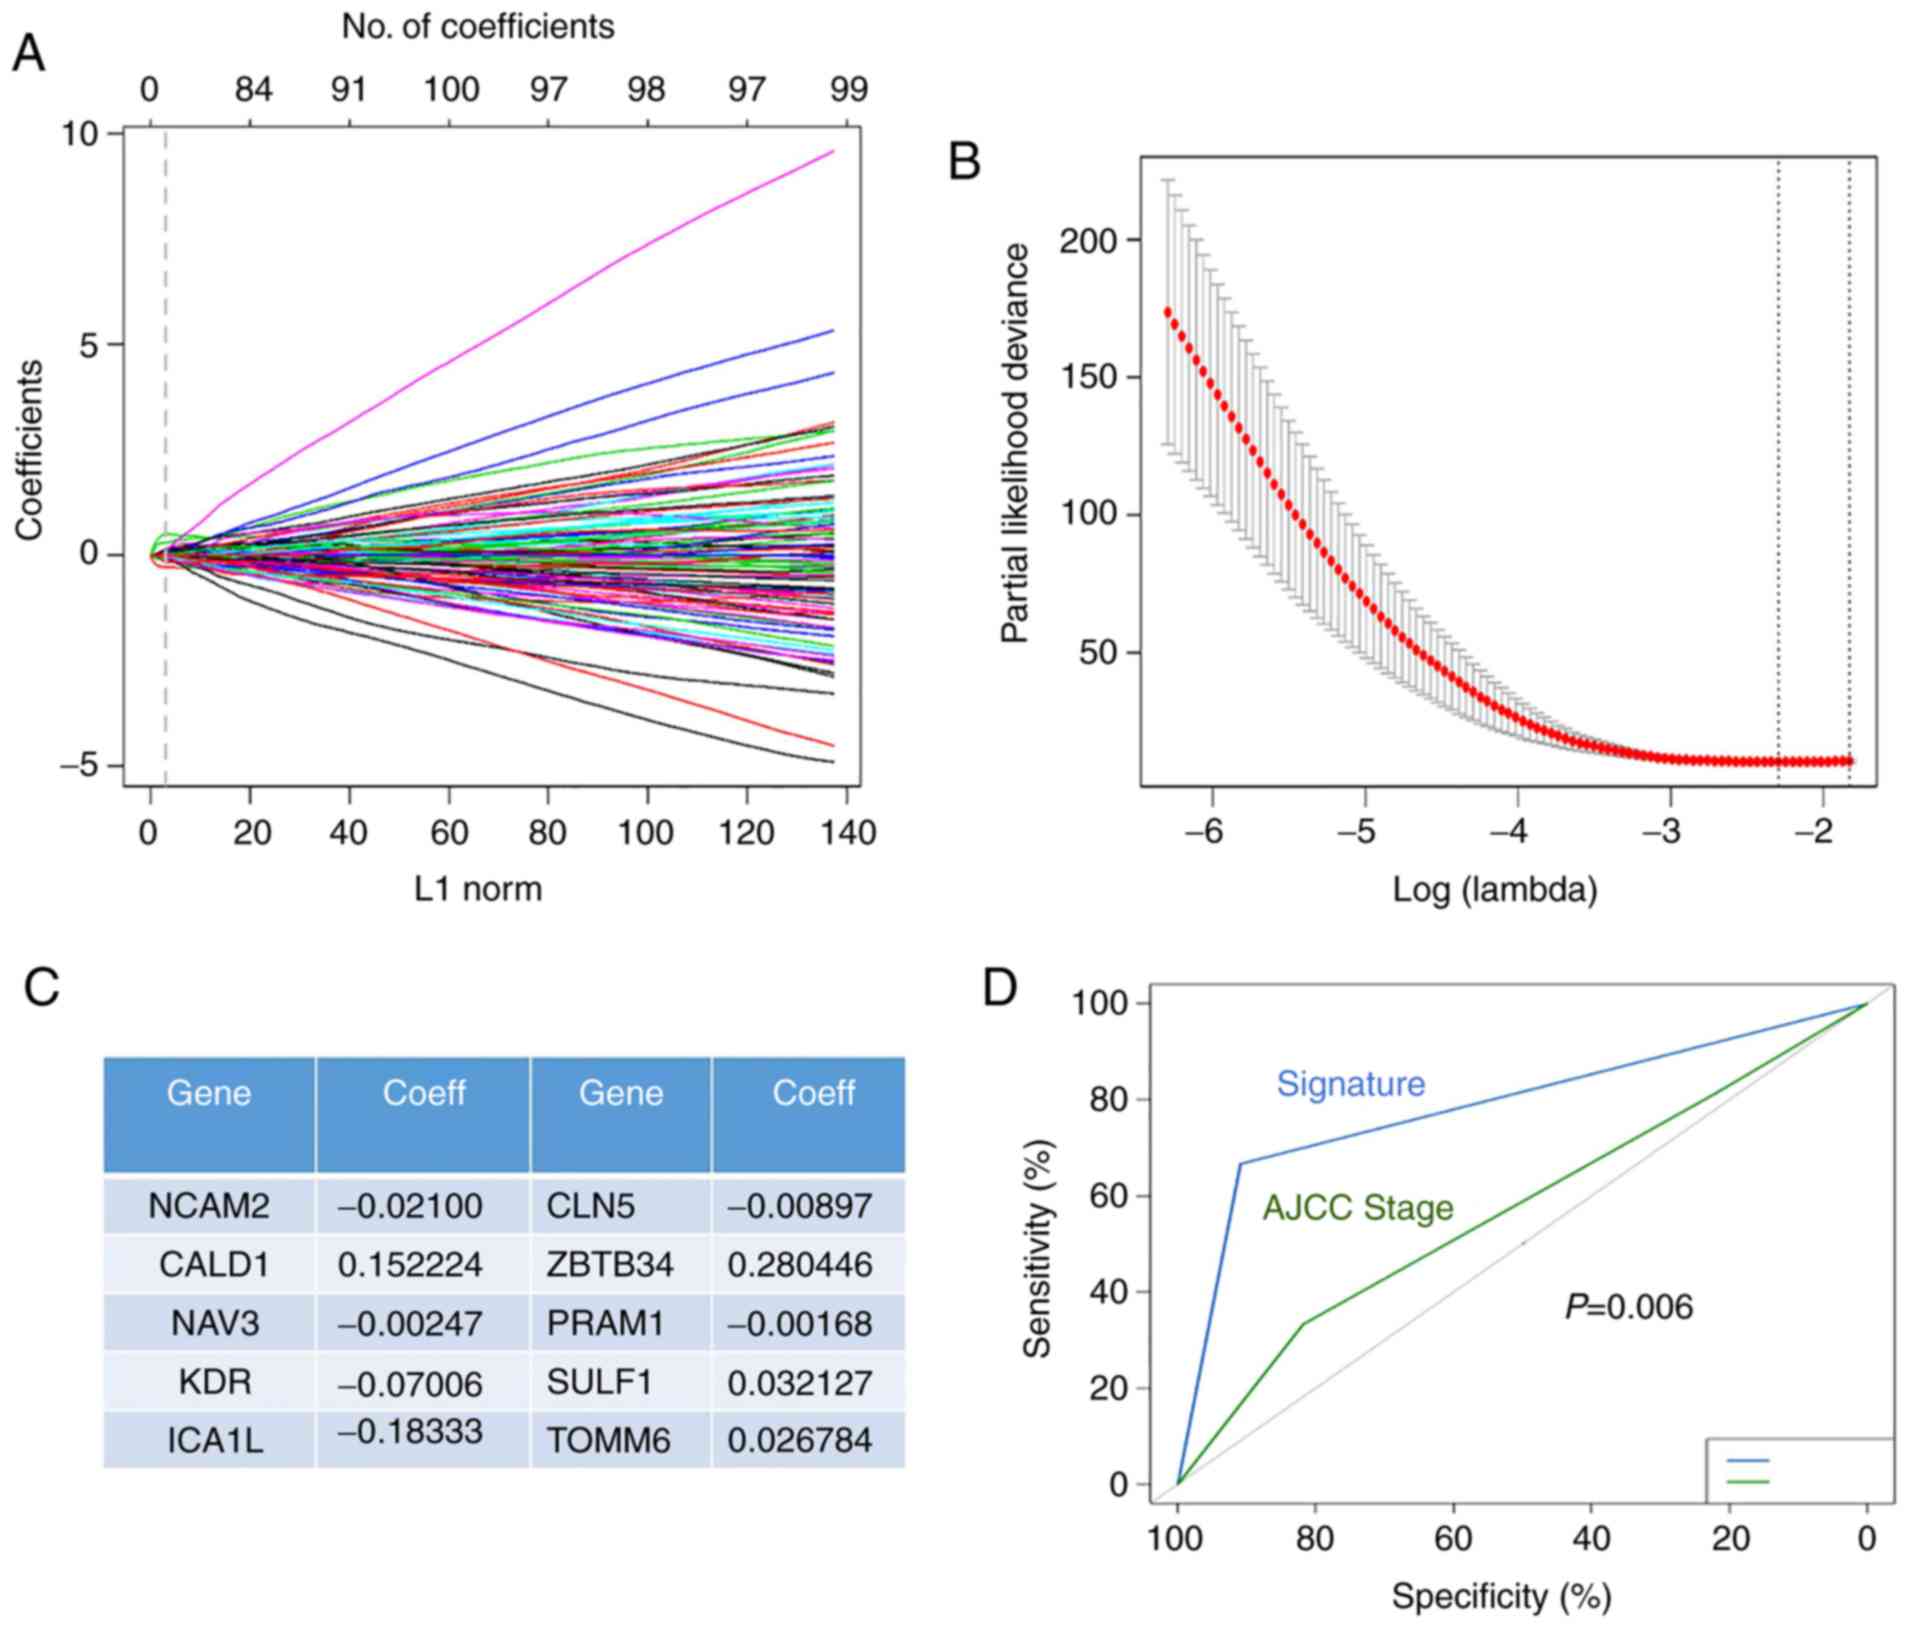 | Figure 3.Screening genes associated with
prognosis and building risk models. (A) Trend graph of LASSO
coefficients. The lines represent the coefficient of Lasso. L1 norm
represents the calculation method of random sampling method. (B)
Partial likehood deviation map. (C) The name and coefficient of the
10-gene signature closely related to TIME. The partial likelihood
represents the error rate chosen by random sampling. (D) ROC curves
of the risk model and TNM staging in the training set. TIME, tumor
immune microenvironment; LASSO, least absolute shrinkage and
selection operator; ROC, receiver operating characteristic;
NCAM2, neural cell adhesion molecule 2; NAV3, neuron
navigator 3; KDR, kinase insert domain receptor;
ICA1L, islet cell autoantigen 1-like; CLN5,
intracellular trafficking protein; ZBTB34, zinc finger and
BTB domain containing 34; PRAM1, PML-RARA regulated adaptor
molecule 1; TOMM6, translocase of outer mitochondrial
membrane 6; CALD1, caldesmon 1; SULF1, sulfatase
1. |
To further validate the accuracy of the risk
prediction model, we established a ROC plot of the signature model
and TNM stage. As shown in Fig. 3D,
we found that risk prediction models were more sensitive to
prognosis than the TNM stage (P=0.006).
Estimating the composition of immune
cells
We used CIBERSORT to estimate the immune cell
composition of the 130 samples and quantify the relative levels of
different cell types in a mixed cell population. All results were
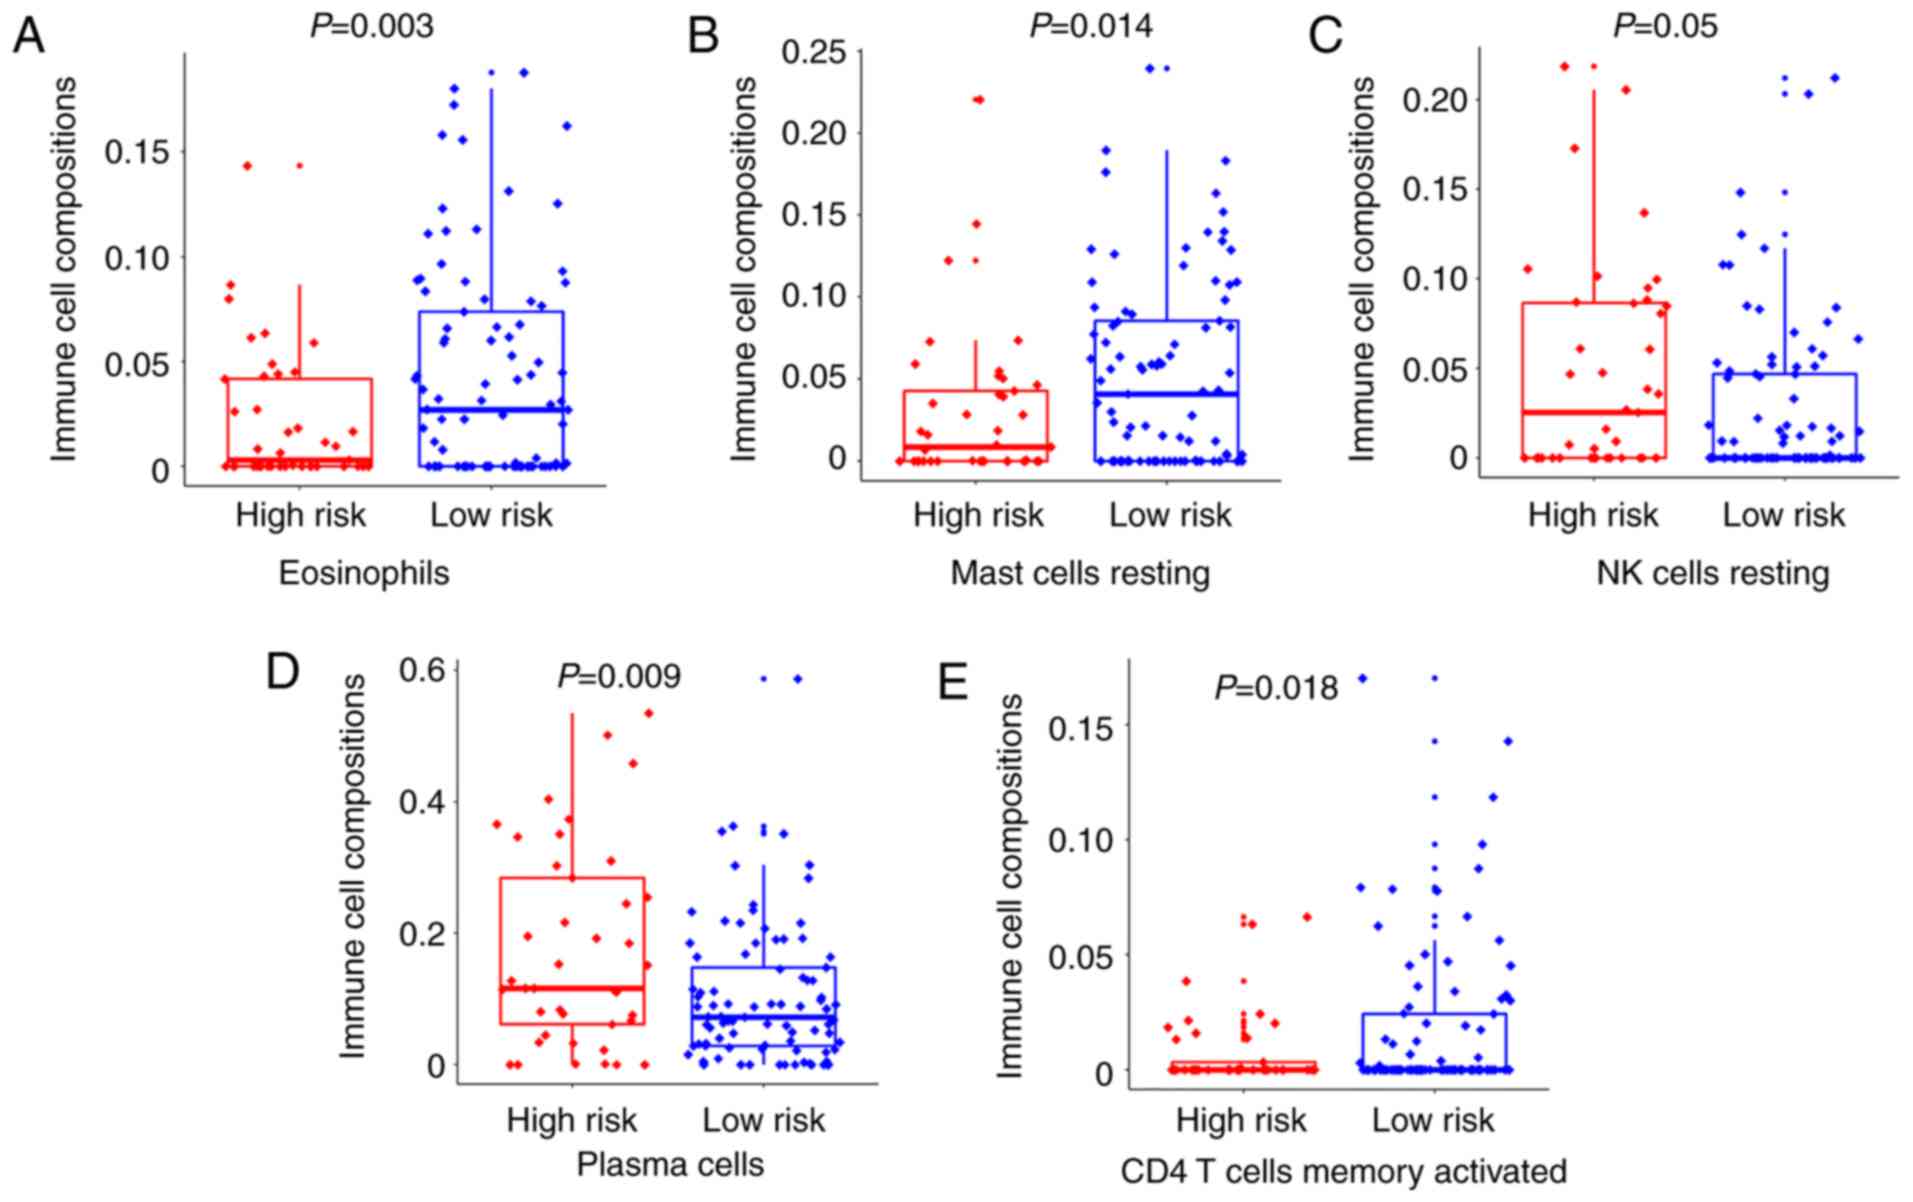
normalized relative proportions by cell type (Table SIII). As shown in Fig. 4A, B and E, we compared different
types of cells in the low-risk group and the high-risk group. It
was found that the ratio of eosinophils, mast cells resting and CD4
T cells memory activated in the low-risk group was higher than that
in the high-risk group, and the difference was statistically
significant (P=0.003, P=0.014 and P=0.018, respectively).
Inconsistently, the ratio of NK cells resting and plasma cells
activated in the low-risk group was lower than that in the
high-risk group (P=0.05 and P=0.009, respectively) (Fig. 4C and D). The results indicated that
activation and inhibition of various immune cells existed
simultaneously in the tumor microenvironment.
Validation of the validity and
reliability
Survival analysis in R language package was applied
to examine the effects of the 10-gene signature on the prognosis of
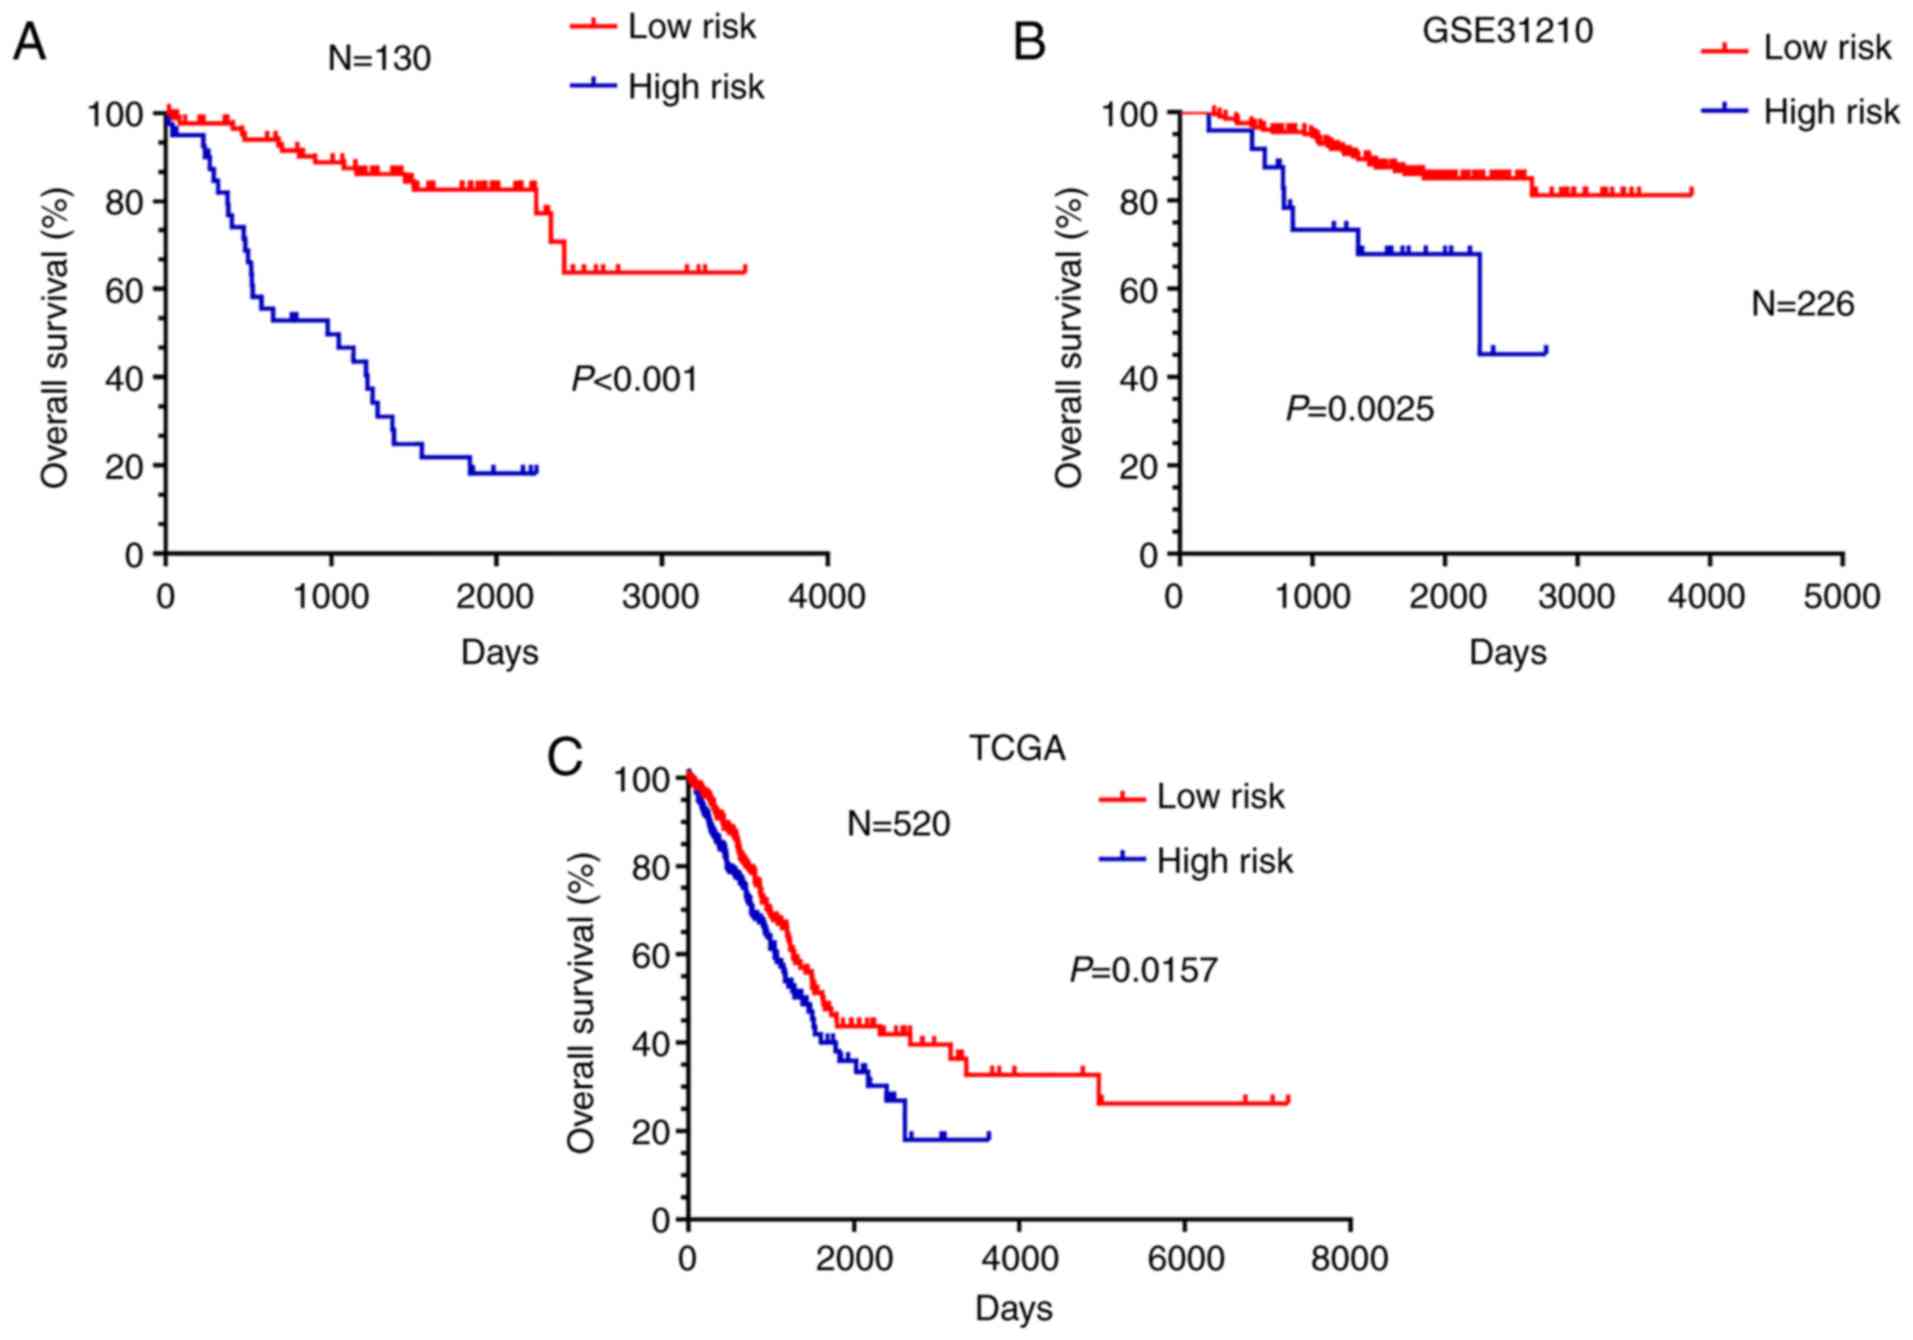
NSCLC patients. Kaplan-Meier survival curves for overall survival
were used to represent the survival probabilities of the high-risk
group and the low-risk group. The results showed that patients in
the high-risk group had shorter overall survival than patients in
the low-risk group (Fig. 5A,
P<0.001).
Furthermore, external data from GSE31210 and TCGA
were applied as a validating set to verify the validity and
reliability of the 10-gene signature impact on the prognosis of the
NSCLC patients. Kaplan-Meier survival showed that patients in the
high-risk group had shorter overall survival than patients in the
low-risk group (Fig. 5B, P=0.0025
and Fig. 5C, P=0.0157).
Correlation of the clinical
information
The correlation analysis between gene signature and
clinical pathological parameters in the training set (GSE103584) is
shown in Table I. The high-risk
group was found to be significantly associated with all clinical
pathological parameters. The univariate and multivariate Cox
proportional hazard regression analyses were used to evaluate
independent prognostic factors associated with survival. Gene
signature, age, sex, smoking status, T stage, N stage N, histology,
grade, EGFR mutation status and adjuvant chemotherapy were employed
as covariates. It was found that the risk model constructed by the
10-gene signature was an independent risk factor for prognosis
(Table II, P<0.001).
 | Table I.Correlation analysis between genetic
signature and clinical pathological parameters of the NSCLC
patients in the training set (GSE103584). |
Table I.
Correlation analysis between genetic
signature and clinical pathological parameters of the NSCLC
patients in the training set (GSE103584).
| Variables | Low risk n (%) | High risk n
(%) | P-value |
|---|
| Age (years) |
|
| <0.001 |
|
<65 | 29 (32.6) | 8 (19.5) |
|
|
>64 | 60 (67.4) | 33 (80.5) |
|
| Sex |
|
| <0.001 |
|
Female | 26 (29.2) | 8 (19.5) |
|
|
Male | 63 (70.8) | 33 (80.5) |
|
| Smoking status |
|
| <0.001 |
|
Yes | 75 (84.3) | 35 (85.4) |
|
| No | 14 (15.7) | 6 (14.6) |
|
| T stage |
|
| <0.001 |
|
T0-1 | 46 (51.7) | 12 (29.3) |
|
| T2 | 28 (31.5) | 21 (51.2) |
|
| T3 | 13 (14.6) | 3 (7.3) |
|
| T4 | 2 (2.2) | 5 (12.2) |
|
| N stage |
|
| <0.001 |
| N0 | 76 (85.4) | 28 (68.3) |
|
| N1 | 9 (10.1) | 3 (7.3) |
|
| N2 | 4 (4.5) | 10 (24.4) |
|
| Histology |
|
| <0.001 |
|
Adenocarcinoma | 67 (75.3) | 29 (70.7) |
|
|
Squamous | 21 (23.6) | 10 (24.4) |
|
|
Others | 1 (1.1) | 2 (4.9) |
|
| Grade |
|
| <0.001 |
| I | 17 (19.1) | 5 (12.2) |
|
| II | 44 (49.4) | 18 (43.9) |
|
|
III | 16 (20.0) | 11 (26.8) |
|
|
Other | 12 (13.5) | 7 (17.1) |
|
| EGFR status |
|
| <0.001 |
|
Yes | 17 (19.1) | 2 (4.9) |
|
| No | 49 (55.1) | 33 (80.5) |
|
|
Unknown | 23 (25.8) | 6 (14.6) |
|
| Adjuvant
therapy |
|
| <0.001 |
|
Yes | 66 (74.2) | 14 (34.1) |
|
| No | 23 (25.8) | 27 (65.9) |
|
| Table II.Univariate and multivariate Cox
proportional hazard regression analyses between the risk factors
and overall survival of NSCLC patients. |
Table II.
Univariate and multivariate Cox
proportional hazard regression analyses between the risk factors
and overall survival of NSCLC patients.
|
| Univariate
analysis | Multivariate
analysis |
|---|
|
|
|
|
|---|
| Variables | Wald
χ2 | P-value | HR (95% CI) | P-value |
|---|
| Age (years) | 0.253 | 0.615 |
| NI |
|
<65 |
|
|
|
|
|
>64 |
|
|
|
|
| Sex | 0.432 | 0.511 |
| NI |
|
Female |
|
|
|
|
|
Male |
|
|
|
|
| Smoking status | 0.443 | 0.506 |
| NI |
|
Yes |
|
|
|
|
| No |
|
|
|
|
| T stage | 2.545 | 0.467 |
| NI |
|
T0-1 |
|
|
|
|
| T2 |
|
|
|
|
| T3 |
|
|
|
|
| T4 |
|
|
|
|
| N stage | 4.706 | 0.095 |
| NI |
| N0 |
|
|
|
|
| N1 |
|
|
|
|
| N2 |
|
|
|
|
| Histology | 0.379 | 0.827 |
| NI |
|
Adenocarcinoma |
|
|
|
|
|
Squamous |
|
|
|
|
|
Others |
|
|
|
|
| Grade | 3.066 | 0.382 |
| NI |
| I |
|
|
|
|
| II |
|
|
|
|
|
III |
|
|
|
|
|
Other |
|
|
|
|
| EGFR status | 0.975 | 0.614 |
| NI |
|
Yes |
|
|
|
|
| No |
|
|
|
|
|
Unknown |
|
|
|
|
| Adjuvant
therapy | 0.766 | 0.381 |
| NI |
|
Yes |
|
|
|
|
| No |
|
|
|
|
| Gene signature | 26.149 | <0.001 |
| <0.001 |
| Low
risk |
|
| Reference |
|
| High
risk |
|
| 8.828
(3.831–20.342) | <0.001 |
In addition, logistic regression analysis was used
to analyze the association between the clinical related factors and
risk model of 10-gene signature construction. As shown in Table III, we analyzed the risk factors
for the risk model of the 10-gene signature construction. Age, sex,
smoking status, T stage, N stage, histology, grade, EGFR mutation
status and adjuvant chemotherapy were selected in the logistic
regression model. T stage, N stage and EGFR mutation status were
all independent risk factors in the multivariable analysis. The
results showed that the patients with Stage T2 and Stage T4 had a
significantly higher risk than those with Stage T0-1 (OR 3.822, 95%
CI 1.422–10.269, P=0.008; OR 19.671, 95% CI 2.304–167.949, P=0.006)
and the patients with Stage N2 had a significantly higher risk than
those with Stage N0 (OR 13.066, 95% CI 2.680–63.700 P=0.001). We
also found that the patients without EGFR mutations had a
significantly higher risk than those with EGFR mutations (OR
16.150, 95% CI 2.122–122.877, P=0.007).
| Table III.Logistic regression analysis between
the clinical related factors and risk model of genetic signature
construction (HR=1). |
Table III.
Logistic regression analysis between
the clinical related factors and risk model of genetic signature
construction (HR=1).
|
| Univariate
analysis | Multivariate
analysis |
|---|
|
|
|
|
|---|
| Variables | Wald
χ2 | P-value | OR (95% CI) | P-value |
|---|
| Age (years) | 1.010 | 0.315 |
| NI |
|
<65 |
|
|
|
|
|
>64 |
|
|
|
|
| Sex | 1.656 | 0.198 |
| NI |
|
Female |
|
|
|
|
|
Male |
|
|
|
|
| Smoking status | 0.478 | 0.490 |
| NI |
|
Yes |
|
|
|
|
| No |
|
|
|
|
| T stage | 10.720 | 0.013 |
| 0.009 |
|
T0-1 |
|
| Reference |
|
| T2 |
|
| 3.822
(1.422–10.269) | 0.008 |
| T3 |
|
| 1.218
(0.255–5.823) | 0.805 |
| T4 |
|
| 19.671
(2.304–167.949) | 0.006 |
| N stage | 8.652 | 0.013 |
| 0.006 |
| N0 |
|
| Reference |
|
| N1 |
|
| 1.042
(0.229–4.750) | 0.957 |
| N2 |
|
| 13.066
(2.680–63.700) | 0.001 |
| Histology | 0.102 | 0.950 |
| NI |
|
Adenocarcinoma |
|
|
|
|
|
Squamous |
|
|
|
|
|
Others |
|
|
|
|
| Grade | 0.867 | 0.833 |
| NI |
| I |
|
|
|
|
| II |
|
|
|
|
|
III |
|
|
|
|
|
Others |
|
|
|
|
| EGFR status | 7.980 | 0.018 |
| 0.010 |
|
Yes |
|
| Reference |
|
| No |
|
| 16.150
(2.122–122.877) | 0.007 |
|
Unknown |
|
| 5.985
(0.688–52.088) | 0.105 |
| Adjuvant
therapy | 2.033 | 0.154 |
| NI |
|
Yes |
|
|
|
|
| No |
|
|
|
|
Discussion
Malignant solid tumor tissues include not only tumor
cells, but also tumor-associated normal epithelial cells and
stromal cells, immune cells and vascular cells. Infiltrating immune
cells are an integral component of the tumor immune
microenvironment (TIME) and play an important role in increasing
the effectiveness of immunotherapy (24). This infiltrating immune cell
population is usually a heterogeneous mixture of immune cells,
including cell types associated with activity and inhibition
(25). Because of the need for
different types and subtypes of TIME to be identified in the
immunotherapy of tumors, their characteristics and differences must
be identified (26). In order to
ensure substantial progress, bioinformatic techniques are used to
assess the composition, functional status and cellular localization
of immune cells. Based on gene signature, a more precise
classification of patients based on their TIME will better predict
overall survival and response to immunotherapeutic agents.
Firstly, we utilized an ESTIMATE algorithm to
calculate immune scores and predict the level of infiltrating
immune cells by immunocyte-related genes. The 21 low immune score
samples and 109 high immune score samples were divided by X-tile
plots. Kaplan-Meier survival curves showed that relapse-free
survival and overall survival of patients in the high score group
of immune scores was longer than the patients in the low score
group. Next, 448 differential genes were extracted from the
comparison of high vs. low immune score groups and the top Gene
Ontology (GO) terms included extracellular matrix organization and
extracellular structure organization closely related to the immune
microenvironment of tumors. In addition, pathway enrichment
analysis with reference to KEGG mainly focused on ‘protein
digestion and absorption’, ‘AGE-RAGE signaling pathway in diabetic
complications’, ‘platelet activation and focal adhesion’ which also
had a relationship with immune response.
Furthermore, we applied the LASSO Cox regression
model to screen a 10-gene signature among the 448 differential
genes and found that risk prediction models constructed by 10 genes
were more sensitive to prognosis than TNM stage. That is the 10
differential gene signature including neural cell adhesion molecule
2 (NCAM2), caldesmon 1 (CALD1), neuron navigator 3
(NAV3), kinase insert domain receptor (KDR), islet
cell autoantigen 1-like (ICA1L), CLN5 intracellular
trafficking protein (CLN5), zinc finger and BTB domain
containing 34 (ZBTB34), PML-RARA regulated adaptor molecule
1 (PRAM1), sulfatase 1 (SULF1) and translocase of
outer mitochondrial membrane 6 (TOMM6) may influence the survival
time of NSCLC patients.
Moreover, survival analysis in R language pack was
applied to examine the effects of the 10-gene signature on the
prognosis of NSCLC patients. Kaplan-Meier survival curves for
overall survival showed that patients in the high-risk group had
shorter over survival than patients in the low-risk group. Then,
external data from GSE31210 and The Cancer Genome Atlas (TCGA) were
applied as a validating set to verify the validity and reliability
of the 10-gene signature impact on the prognosis of the patients.
Kaplan-Meier survival showed that indeed patients in the high-risk
group had shorter overall survival than patients in the low-risk
group.
We not only confirmed the stability and accuracy of
the 10-gene signature, but also found it was closely associated
with other clinical information. The univariate and multivariate
Cox proportional hazard regression analyses were used to evaluate
independent prognostic factors associated with survival. It was
found that the risk model constructed by the 10-gene signature was
an independent risk factor for prognosis (Table III). In addition, logistic
regression analysis was used to analyze the association between the
clinical related factors and risk model of 10-gene signature
construction. T stage, N stage and EGFR mutation status were all
independent risk factors in the multivariable analysis. The results
showed that the patients with Stage T2 and T4 had a significantly
higher risk than those with Stage T0-1 and the patients with Stage
N2 had a significantly higher risk than those with Stage N0. We
also found that the patients without EGFR mutations had a
significantly higher risk than those with EGFR mutations. These
results suggest that our characteristics may contribute to the
clinical management of NSCLC.
Finally, we used CIBERSORT to estimate the immune
cell composition of 130 samples and quantify the relative levels of
the different cell types in a mixed cell population and compared
the different types of cells in the low-risk group and the
high-risk group. Surprisingly, it was found that the ratio of
eosinophils, mast cells resting and CD4 T cells memory activated in
the low-risk group was higher than that in the high-risk group, and
the difference was statistically significant. Inconsistently, the
ratio of NK cells resting and plasma cells activated in the
low-risk group was lower than that in the high-risk group. The
results indicated that activation and inhibition of various immune
cells existed simultaneously in TIME. The 10-gene signature was
used to analyze the composition of immune cells helping to clarify
the role of TIME and increase our understanding of molecular
phenotype. The success of cancer immunotherapy has revolutionized
cancer treatment and has used TIME parameters (immune cell
composition and proportion) as predictive immunotherapy markers
(8). Detailed characterization of
the immune cell composition in tumors may be the basis for
determining the prognostic and predictive biomarkers of
immunotherapy (27,28). Therefore, incorporating TIME
parameters into a gene signature can be more conducive to
individualized treatment options (29). Studies have reported that the
expression levels of various proliferation-related genes are
related to the response to immune checkpoint inhibitors in NSCLC
(30). In addition, JAK1/2
mutations are associated with resistance to anti-PD-1/PD-L1
antibodies and MDM2/MDM4 and EGFR changes may be associated with
hyperprogression (31–33). Here, the 10-gene signature closely
related to TIME could predict the prognosis of lung cancer
patients, and provide some reference for immunotherapy.
Notably, among the 10-gene signature, only the gene
KDR is involved in tumor immunity and most of the genes
(NCAM2, CALD1, NAV3, PRAM-1 and SULF1) are closely related
to tumors and can be used as novel tumor biomarkers. There are also
two other genes (ICA1L, CLN5) that have been reported to
have related functions, but no reports exist on tumors and
immunity. The TOMM6 gene has not been reported. NCAM2
is a close homolog of the neuronal cell adhesion molecule NCAM1 and
stimulates neurite outgrowth through FGFR-dependent activation of
the Ras/MAPK pathway (34,35). Several studies have reported that
NCAM2 can be used as a new therapeutic target for cancer,
especially prostate cancer and breast cancer (36–38).
CALD1 is a novel target of the TEA domain family member
(39). Moreover, CALD1
encodes the caldesmon protein, which is a calmodulin-binding and
cytoskeleton-associated protein and regulates cell motility, such
as migration and invasion (40,41).
It has been suggested that CALD1 may indicate a general splicing
event associated with cancer (41,42)
and was also identified as a potential prognostic molecular marker
for bladder and colon cancer (43–45).
NAV3 is a novel cancer-associated gene
located at chromosome 12q21 and belongs to the ‘hill’ genes of
genomic landscaping associated with cancer (46). Accumulating evidence suggests that
the NAV3 gene is a key player in a variety of cancers, with
downregulation of NAV3 found in 40% of primary
neuroblastomas and adrenocortical carcinomas (47,48).
NAV3 mutations have been found in melanoma, pancreatic
cancer, breast cancer and colon cancer (49). We also found NAV3 gene copy
number changes (deletions/amplifications) in other cancer types of
epithelial origin (50) and
NAV3 gene allelic loss was found to be associated with
several subtypes of cutaneous T-cell lymphoma (51,52).
KDR, also known as VEGFR2, is expressed in
endothelial cells (ECs) to promote EC growth and survival, thereby
initiating angiogenesis (53).
Research has shown that T cell KDR is an important molecule in
immunity, and it was found that KDR was induced to be expressed in
activated CD4 and CD8 T cells in vitro (54). In addition, KDR was also
demonstrated to be expressed on T cells after interaction with
tumor necrosis factor (TNF)-activated ECs, and have a function in
transendothelial migration (55).
ICA1L is highly expressed in sperm cells and
is closely related to male infertility (56). CLN5 mutations cause
neurodegenerative diseases, and symptoms include mainly seizures,
visual failure, motor decline, and progressive cognitive
deterioration (57). ZBTB34
encodes a nuclear protein and functions as a potential
transcriptional repressor. The transcript of ZBTB34 appears in a
variety of adult tissues related to the immune, nervous, muscle and
endocrine systems suggesting that ZBTB34 is a ubiquitously
expressed protein that may function universally in transcriptional
regulation (58). PRAM-1 is an
intracellular adaptor molecule that is upregulated during the
induced granulocytic differentiation of promyelocytic leukemic
cells and during normal human myelopoiesis (59). PRAM-1 is involved in a signaling
pathway induced by retinoic acid in acute promyelocytic leukemia
(APL) cells (60). SULF1 plays a
key role in the pathogenesis of various types of human cancer, and
SULF1 protein is secreted to the cell surface to regulate the
sulfation of heparan sulfate proteoglycans (HSPGs) (61,62).
SULF1 was also found to be a novel prognostic marker and predictor
of lymph node metastasis in patients with gastric cancer (63). From the above results, we can
conclude that our gene signature not only identified new promising
biomarkers, but also may provide a direction for the study of TIME
mechanisms.
In summary, the present research has the following
novelty and innovation. First, multiple bioinformatic analysis
methods were used to extracted a 10-gene signature closely related
to TIME. Second, the risk model constructed by the 10-gene
signature was able to predict the prognosis of NSCLC patients and
was more sensitive for predicting prognosis than TNM stage. Third,
the 10-gene signature was found to be closely related to TIME
parameters (immune cell composition and proportion) and provides a
certain reference for the immunotherapy of NSCLC. Fourth, some
previously ignored genes in the 10-gene signature may become
potential novel markers for NSCLC. However, the present study also
has certain limitations. First, the study consisted solely of
bioinformatics research, and there was no validation of clinical
sample data. Second, the study only verified the validity and
reliability of the 10-gene signature impact on the overall survival
of the patients, but did not verify relapse-free survival. Third,
the sample size requires further expansion to verify the accuracy
of the 10-gene signature and truly clarify its clinical value.
Supplementary Material
Supporting Data
Supporting Data
Supporting Data
Acknowledgements
Not applicable.
Funding
This study was supported jointly by Special funds
for Taishan Scholars Project (grant. no. tsqn201812149), Academic
promotion programme of Shandong First Medical University
(2019RC004).
Availability of data and material
We declared that materials described in the
manuscript, including all relevant raw data, are freely available
to any scientist wishing to use them for non-commercial purposes,
without breaching participant confidentiality.
Authors' contributions
HW designed the project and proposed the research
concept. XL carried out the data search and downloading and
literature collection. CZ conducted the bioinformatic analysis and
CZ constructed the graphic images and data charts and performed the
statistical processing. JL wrote the manuscript. All authors read
and approved the manuscript and agree to be accountable for all
aspects of the research in ensuring that the accuracy or integrity
of any part of the work are appropriately investigated and
resolved.
Ethics approval and consent to
participate
This study was approved by the Ethics Committee of
Shandong Cancer Hospital and Institute and was consistent with the
Helsinki Declaration. This study was mainly based on the Gene
Expression Omnibus datasets (GEO; GSE103584,GSE31210) and The
Cancer Genome Atlas (TCGA, http://tcga-data.nci.nih.gov/tcga/). Personal privacy
information was not involved, thus informed consent was not
needed.
Patient consent for publication
Not applicable.
Competing interests
The authors declare that they have no competing
interests.
Glossary
Abbreviations
Abbreviations:
|
TIME
|
tumor immune microenvironment
|
|
TCGA
|
The Cancer Genome Atlas
|
|
GEO
|
Gene Expression Omnibus
|
|
NSCLC
|
non-small cell lung cancer
|
|
ESTIMATE
|
Estimation of Stromal and Immune cells
in Malignant Tumours using Expression data
|
|
LASSO
|
least absolute shrinkage and selection
operator
|
|
TNM
|
Tumor, Lymph Node and Metastasis
|
|
NK
|
natural killer
|
|
OS
|
overall survival
|
|
ECM
|
extracellular matrix
|
|
EGFR
|
epidermal growth factor receptor
|
|
GO
|
Gene Ontology
|
|
DAVID
|
Database for Annotation, Visualization
and Integrated Discovery
|
|
BP
|
biological processes
|
|
MF
|
molecular functions
|
|
CC
|
cellular components
|
|
KEGG
|
Kyoto Gene and Genomic
Encyclopedia
|
|
LOOCV
|
leave-one-out cross-validation
|
|
ROC
|
receiver operating characteristic
|
|
AUC
|
area under the curve
|
|
NCAM2
|
neural cell adhesion molecule 2
|
|
NAV3
|
neuron navigator 3
|
|
KDR
|
kinase insert domain receptor
|
|
ICA1L
|
islet cell autoantigen 1-like
|
|
CLN5
|
intracellular trafficking protein
|
|
ZBTB34
|
zinc finger and BTB domain containing
34
|
|
PRAM1
|
PML-RARA regulated adaptor molecule
1
|
|
TOMM6
|
translocase of outer mitochondrial
membrane 6
|
|
ICI
|
immune checkpoint inhibitors
|
|
MCs
|
mast cells
|
|
CTL
|
cytotoxic T lymphocytes
|
|
MM
|
malignant melanoma
|
References
|
1
|
Bray F, Ferlay J, Soerjomataram I, Siegel
RL, Torre LA and Jemal A: Global cancer statistics 2018: GLOBOCAN
estimates of incidence and mortality worldwide for 36 cancers in
185 countries. CA Cancer J Clin. 68:394–424. 2018. View Article : Google Scholar : PubMed/NCBI
|
|
2
|
Song P, Cui X, Bai L, Zhou X, Zhu X, Zhang
J, Jin F, Zhao J, Zhou C, Zhou Y, et al: Molecular characterization
of clinical responses to PD-1/PD-L1 inhibitors in non-small cell
lung cancer: Predictive value of multidimensional immunomarker
detection for the efficacy of PD-1 inhibitors in Chinese patients.
Thorac Cancer. 10:1303–1309. 2019. View Article : Google Scholar : PubMed/NCBI
|
|
3
|
Zhang C, Leighl NB, Wu YL and Zhong WZ:
Emerging therapies for non-small cell lung cancer. J Hematol Oncol.
12:452019. View Article : Google Scholar : PubMed/NCBI
|
|
4
|
Chansky K, Sculier JP, Crowley JJ, Giroux
D, Van Meerbeeck J and Goldstraw P; International Staging Committee
and Participating Institutions, : The international association for
the study of lung cancer staging project: Prognostic factors and
pathologic TNM stage in surgically managed non-small cell lung
cancer. J Thorac Oncol. 4:792–801. 2009. View Article : Google Scholar : PubMed/NCBI
|
|
5
|
Goldstraw P, Ball D, Jett JR, Le Chevalier
T, Lim E, Nicholson AG and Shepherd FA: Non-small-cell lung cancer.
Lancet. 378:1727–1740. 2011. View Article : Google Scholar : PubMed/NCBI
|
|
6
|
Hanahan D and Weinberg RA: The hallmarks
of cancer. Cell. 100:57–70. 2000. View Article : Google Scholar : PubMed/NCBI
|
|
7
|
Hanahan D and Coussens LM: Accessories to
the crime: Functions of cells recruited to the tumor
microenvironment. Cancer Cell. 21:309–322. 2012. View Article : Google Scholar : PubMed/NCBI
|
|
8
|
Stankovic B, Bjørhovde HA, Skarshaug R,
Aamodt H, Frafjord A, Müller E, Hammarström C, Beraki K, Bækkevold
ES, Woldbæk PR, et al: Immune cell composition in human non-small
cell lung cancer. Front Immunol. 9:31012019. View Article : Google Scholar : PubMed/NCBI
|
|
9
|
Galon J, Pagès F, Marincola FM, Angell HK,
Thurin M, Lugli A, Zlobec I, Berger A, Bifulco C, Botti G, et al:
Cancer classification using the immunoscore: A worldwide task
force. J Transl Med. 10:2052012. View Article : Google Scholar : PubMed/NCBI
|
|
10
|
Xiong Y, Liu L, Xia Y, Qi Y, Chen Y, Chen
L, Zhang P, Kong Y, Qu Y, Wang Z, et al: Tumor infiltrating mast
cells determine oncogenic HIF-2α-conferred immune evasion in clear
cell renal cell carcinoma. Cancer Immunol Immunother. 68:731–741.
2019. View Article : Google Scholar : PubMed/NCBI
|
|
11
|
Rohr-Udilova N, Klinglmüller F,
Schulte-Hermann R, Stift J, Herac M, Salzmann M, Finotello F,
Timelthaler G, Oberhuber G, Pinter M, et al: Deviations of the
immune cell landscape between healthy liver and hepatocellular
carcinoma. Sci Rep. 8:62202018. View Article : Google Scholar : PubMed/NCBI
|
|
12
|
Chen B, Khodadoust MS, Liu CL, Newman AM
and Alizadeh AA: Profiling tumor infiltrating immune cells with
CIBERSORT. Methods Mol Biol. 1711:243–259. 2018. View Article : Google Scholar : PubMed/NCBI
|
|
13
|
Yoshihara K, Shahmoradgoli M, Martínez E,
Vegesna R, Kim H, Torres-Garcia W, Treviño V, Shen H, Laird PW,
Levine DA, et al: Inferring tumour purity and stromal and immune
cell admixture from expression data. Nat Commun. 4:26122013.
View Article : Google Scholar : PubMed/NCBI
|
|
14
|
Bakr S, Gevaert O, Echegaray S, Ayers K,
Zhou M, Shafiq M, Zheng H, Benson JA, Zhang W, Leung ANC, et al: A
radiogenomic dataset of non-small cell lung cancer. Sci Data.
5:1802022018. View Article : Google Scholar : PubMed/NCBI
|
|
15
|
Okayama H, Kohno T, Ishii Y, Shimada Y,
Shiraishi K, Iwakawa R, Furuta K, Tsuta K, Shibata T, Yamamoto S,
et al: Identification of genes upregulated in ALK-positive and
EGFR/KRAS/ALK-negative lung adenocarcinomas. Cancer Res.
72:100–111. 2012. View Article : Google Scholar : PubMed/NCBI
|
|
16
|
Camp RL, Dolled-Filhart M and Rimm DL:
X-tile: A new bio-informatics tool for biomarker assessment and
outcome- based cut-point optimization. Clin Cancer Res.
10:7252–7259. 2004. View Article : Google Scholar : PubMed/NCBI
|
|
17
|
Ritchie ME, Phipson B, Wu D, Hu Y, Law CW,
Shi W and Smyth GK: Limma powers differential expression analyses
for RNA-sequencing and microarray studies. Nucleic Acids Res.
43:e472015. View Article : Google Scholar : PubMed/NCBI
|
|
18
|
Huang da W, Sherman BT and Lempicki RA:
Systematic and integrative analysis of large gene lists using DAVID
bioinformatics resources. Nat Protoc. 4:44–57. 2009. View Article : Google Scholar : PubMed/NCBI
|
|
19
|
Tibshirani R: The lasso method for
variable selection in the Cox model. Stat Med. 16:385–395. 1997.
View Article : Google Scholar : PubMed/NCBI
|
|
20
|
Friedman J, Hastie T and Tibshirani R:
Regularization paths for generalized linear models via coordinate
descent. J Stat Softw. 33:1–22. 2010. View Article : Google Scholar : PubMed/NCBI
|
|
21
|
Newman AM, Liu CL, Green MR, Gentles AJ,
Feng W, Xu Y, Hoang CD, Diehn M and Alizadeh AA: Robust enumeration
of cell subsets from tissue expression profiles. Nat Methods.
12:453–457. 2015. View Article : Google Scholar : PubMed/NCBI
|
|
22
|
O'Quigley J and Moreau T: Cox's regression
model: Computing a goodness of fit statistic. Comput Methods
Programs Biomed. 22:253–256. 1986. View Article : Google Scholar : PubMed/NCBI
|
|
23
|
Heagerty PJ, Lumley T and Pepe MS:
Time-dependent ROC curves for censored survival data and a
diagnostic marker. Biometrics. 56:337–344. 2000. View Article : Google Scholar : PubMed/NCBI
|
|
24
|
Fridman WH, Pagès F, Sautès-Fridman C and
Galon J: The immune contexture in human tumours: Impact on clinical
outcome. Nat Rev Cancer. 12:298–306. 2012. View Article : Google Scholar : PubMed/NCBI
|
|
25
|
Wojas-Krawczyk K, Kalinka E, Grenda A,
Krawczyk P and Milanowski J: Beyond PD-L1 markers for lung cancer
immunotherapy. Int J Mol Sci. 20:E19152019. View Article : Google Scholar : PubMed/NCBI
|
|
26
|
Binnewies M, Roberts EW, Kersten K, Chan
V, Fearon DF, Merad M, Coussens LM, Gabrilovich DI,
Ostrand-Rosenberg S, Hedrick CC, et al: Understanding the tumor
immune microenvironment (TIME) for effective therapy. Nat Med.
24:541–550. 2018. View Article : Google Scholar : PubMed/NCBI
|
|
27
|
Kilic A, Landreneau RJ, Luketich JD,
Pennathur A and Schuchert MJ: Density of tumor-infiltrating
lymphocytes correlates with disease recurrence and survival in
patients with large non-small-cell lung cancer tumors. J Surg Res.
167:207–210. 2011. View Article : Google Scholar : PubMed/NCBI
|
|
28
|
Horne ZD, Jack R, Gray ZT, Siegfried JM,
Wilson DO, Yousem SA, Nason KS, Landreneau RJ, Luketich JD and
Schuchert MJ: Increased levels of tumor-infiltrating lymphocytes
are associated with improved recurrence-free survival in stage 1A
non-small-cell lung cancer. J Surg Res. 171:1–5. 2011. View Article : Google Scholar : PubMed/NCBI
|
|
29
|
Domagala-Kulawik J: The role of the immune
system in non-small cell lung carcinoma and potential for
therapeutic intervention. Transl Lung Cancer Res. 4:177–190.
2015.PubMed/NCBI
|
|
30
|
Pabla S, Conroy JM, Nesline MK, Glenn ST,
Papanicolau-Sengos A, Burgher B, Hagen J, Giamo V, Andreas J, Lenzo
FL, et al: Proliferative potential and resistance to immune
checkpoint blockade in lung cancer patients. J Immunother Cancer.
7:272019. View Article : Google Scholar : PubMed/NCBI
|
|
31
|
Shin DS, Zaretsky JM, Escuin-Ordinas H,
Garcia-Diaz A, Hu-Lieskovan S, Kalbasi A, Grasso CS, Hugo W,
Sandoval S, Torrejon DY, et al: Primary resistance to PD-1 blockade
mediated by JAK1/2 mutations. Cancer Discov. 7:188–201. 2017.
View Article : Google Scholar : PubMed/NCBI
|
|
32
|
Kato S, Goodman A, Walavalkar V,
Barkauskas DA, Sharabi A and Kurzrock R: Hyperprogressors after
immunotherapy: Analysis of genomic alterations associated with
accelerated growth rate. Clin Cancer Res. 23:4242–4250. 2017.
View Article : Google Scholar : PubMed/NCBI
|
|
33
|
Champiat S, Dercle L, Ammari S, Massard C,
Hollebecque A, Postel-Vinay S, Chaput N, Eggermont A, Marabelle A,
Soria JC and Ferté C: Hyperprogressive disease is a new pattern of
progression in cancer patients treated by anti-PD-1/PD-L1. Clin
Cancer Res. 23:1920–1928. 2017. View Article : Google Scholar : PubMed/NCBI
|
|
34
|
Paoloni-Giacobino A, Chen H and
Antonarakis SE: Cloning of a novel human neural cell adhesion
molecule gene (NCAM2) that maps to chromosome region 21q21 and is
potentially involved in Down syndrome. Genomics. 43:43–51. 1997.
View Article : Google Scholar : PubMed/NCBI
|
|
35
|
Rasmussen KK, Falkesgaard MH, Winther M,
Roed NK, Quistgaard CL, Teisen MN, Edslev SM, Petersen DL,
Aljubouri A, Christensen C, et al: NCAM2 Fibronectin type-III
domains form a rigid structure that binds and activates the
Fibroblast Growth Factor Receptor. Sci Rep. 8:89572018. View Article : Google Scholar : PubMed/NCBI
|
|
36
|
Edwards S, Campbell C, Flohr P, Shipley J,
Giddings I, Te-Poele R, Dodson A, Foster C, Clark J, Jhavar S, et
al: Expression analysis onto microarrays of randomly selected cDNA
clones highlights HOXB13 as a marker of human prostate cancer. Br J
Cancer. 92:376–381. 2005. View Article : Google Scholar : PubMed/NCBI
|
|
37
|
Romanuik TL, Ueda T, Le N, Haile S, Yong
TM, Thomson T, Vessella RL and Sadar MD: Novel biomarkers for
prostate cancer including noncoding transcripts. Am J Pathol.
175:2264–2276. 2009. View Article : Google Scholar : PubMed/NCBI
|
|
38
|
von der Heyde S, Wagner S, Czerny A,
Nietert M, Ludewig F, Salinas-Riester G, Arlt D and Beißbarth T:
mRNA profiling reveals determinants of trastuzumab efficiency in
HER2-positive breast cancer. PLoS One. 10:e01178182015. View Article : Google Scholar : PubMed/NCBI
|
|
39
|
Lim B, Park JL, Kim HJ, Park YK, Kim JH,
Sohn HA, Noh SM, Song KS, Kim WH, Kim YS and Kim SY: Integrative
genomics analysis reveals the multilevel dysregulation and
oncogenic characteristics of TEAD4 in gastric cancer.
Carcinogenesis. 35:1020–1027. 2014. View Article : Google Scholar : PubMed/NCBI
|
|
40
|
Mayanagi T, Morita T, Hayashi K, Fukumoto
K and Sobue K: Glucocorticoid receptor-mediated expression of
caldesmon regulates cell migration via the reorganization of the
actin cytoskeleton. J Biol Chem. 283:31183–31196. 2008. View Article : Google Scholar : PubMed/NCBI
|
|
41
|
Thorsen K, Sørensen KD, Brems-Eskildsen
AS, Modin C, Gaustadnes M, Hein AM, Kruhøffer M, Laurberg S, Borre
M, Wang K, et al: Alternative splicing in colon, bladder, and
prostate cancer identified by exon array analysis. Mol Cell
Proteomics. 7:1214–1224. 2008. View Article : Google Scholar : PubMed/NCBI
|
|
42
|
Liu J, Li H, Shen S, Sun L, Yuan Y and
Xing C: Alternative splicing events implicated in carcinogenesis
and prognosis of colorectal cancer. J Cancer. 9:1754–1764. 2018.
View Article : Google Scholar : PubMed/NCBI
|
|
43
|
Liu Y, Wu X, Wang G, Hu S, Zhang Y and
Zhao S: CALD1, CNN1, and TAGLN identified as potential prognostic
molecular markers of bladder cancer by bioinformatics analysis.
Medicine (Baltimore). 98:e138472019. View Article : Google Scholar : PubMed/NCBI
|
|
44
|
Chauvin A, Wang CS, Geha S, Garde-Granger
P, Mathieu AA, Lacasse V and Boisvert FM: The response to
neoadjuvant chemoradiotherapy with 5-fluorouracil in locally
advanced rectal cancer patients: A predictive proteomic signature.
Clin Proteomics. 15:162018. View Article : Google Scholar : PubMed/NCBI
|
|
45
|
Yokota M, Kojima M, Higuchi Y, Nishizawa
Y, Kobayashi A, Ito M, Saito N and Ochiai A: Gene expression
profile in the activation of subperitoneal fibroblasts reflects
prognosis of patients with colon cancer. Int J Cancer.
138:1422–1431. 2016. View Article : Google Scholar : PubMed/NCBI
|
|
46
|
Wood LD, Parsons DW, Jones S, Lin J,
Sjöblom T, Leary RJ, Shen D, Boca SM, Barber T, Ptak J, et al: The
genomic landscapes of human breast and colorectal cancers. Science.
318:1108–1113. 2007. View Article : Google Scholar : PubMed/NCBI
|
|
47
|
Coy JF, Wiemann S, Bechmann I, Bächner D,
Nitsch R, Kretz O, Christiansen H and Poustka A: Pore membrane
and/or filament interacting like protein 1 (POMFIL1) is
predominantly expressed in the nervous system and encodes different
protein isoforms. Gene. 290:73–94. 2002. View Article : Google Scholar : PubMed/NCBI
|
|
48
|
Soon PS, Gill AJ, Benn DE, Clarkson A,
Robinson BG, McDonald KL and Sidhu SB: Microarray gene expression
and immunohistochemistry analyses of adrenocortical tumors identify
IGF2 and Ki-67 as useful in differentiating carcinomas from
adenomas. Endocr Relat Cancer. 16:573–583. 2009. View Article : Google Scholar : PubMed/NCBI
|
|
49
|
Bleeker FE, Lamba S, Rodolfo M, Scarpa A,
Leenstra S, Vandertop WP and Bardelli A: Mutational profiling of
cancer candidate genes in glioblastoma, melanoma and pancreatic
carcinoma reveals a snapshot of their genomic landscapes. Hum
Mutat. 30:E451–E459. 2009. View Article : Google Scholar : PubMed/NCBI
|
|
50
|
Hahtola S, Burghart E, Puputti M, Karenko
L, Abdel-Rahman WM, Väkevä L, Jeskanen L, Virolainen S, Karvonen J,
Salmenkivi K, et al: Cutaneous T-cell lymphoma-associated lung
cancers show chromosomal aberrations differing from primary lung
cancer. Genes Chromosomes Cancer. 47:107–117. 2008. View Article : Google Scholar : PubMed/NCBI
|
|
51
|
Karenko L, Hahtola S, Päivinen S, Karhu R,
Syrjä S, Kähkönen M, Nedoszytko B, Kytölä S, Zhou Y, Blazevic V, et
al: Primary cutaneous T-cell lymphomas show a deletion or
translocation affecting NAV3, the human UNC-53 homologue. Cancer
Res. 65:8101–8110. 2005. View Article : Google Scholar : PubMed/NCBI
|
|
52
|
Hahtola S, Burghart E, Jeskanen L, Karenko
L, Abdel-Rahman WM, Polzer B, Kajanti M, Peltomäki P, Pettersson T,
Klein CA and Ranki A: Clinicopathological characterization and
genomic aberrations in subcutaneous panniculitis-like T-cell
lymphoma. J Invest Dermatol. 128:2304–2309. 2008. View Article : Google Scholar : PubMed/NCBI
|
|
53
|
Zhang SD, McCrudden CM, Meng C, Lin Y and
Kwok HF: The significance of combining VEGFA, FLT1, and KDR
expressions in colon cancer patient prognosis and predicting
response to bevacizumab. Onco Targets Ther. 8:835–843.
2015.PubMed/NCBI
|
|
54
|
Kershaw MH, Westwood JA, Zhu Z, Witte L,
Libutti SK and Hwu P: Generation of gene-modified T cells reactive
against the angiogenic kinase insert domain-containing receptor
(KDR) found on tumor vasculature. Hum Gene Ther. 11:2445–2452.
2000. View Article : Google Scholar : PubMed/NCBI
|
|
55
|
Edelbauer M, Datta D, Vos IH, Basu A,
Stack MP, Reinders ME, Sho M, Calzadilla K, Ganz P and Briscoe DM:
Effect of vascular endothelial growth factor and its receptor KDR
on the transendothelial migration and local trafficking of human T
cells in vitro and in vivo. Blood. 116:1980–1989. 2010. View Article : Google Scholar : PubMed/NCBI
|
|
56
|
He J, Xia M, Tsang WH, Chow KL and Xia J:
ICA1L forms BAR-domain complexes with PICK1 and is crucial for
acrosome formation in spermiogenesis. J Cell Sci. 128:3822–3836.
2015. View Article : Google Scholar : PubMed/NCBI
|
|
57
|
Parvin S, Rezazadeh M, Hosseinzadeh H,
Moradi M, Shiva S and Gharesouran J: The neuronal ceroid
lipofuscinoses-linked loss of function CLN5 and CLN8 variants
disrupt normal lysosomal function. Neuromolecular Med. 21:160–169.
2019. View Article : Google Scholar : PubMed/NCBI
|
|
58
|
Qi J, Zhang X, Zhang HK, Yang HM, Zhou YB
and Han ZG: ZBTB34, a novel human BTB/POZ zinc finger protein, is a
potential transcriptional repressor. Mol Cell Biochem. 290:159–167.
2006. View Article : Google Scholar : PubMed/NCBI
|
|
59
|
Clemens RA, Newbrough SA, Chung EY, Gheith
S, Singer AL, Koretzky GA and Peterson EJ: PRAM-1 is required for
optimal integrin-dependent neutrophil function. Mol Cell Biol.
24:10923–10932. 2004. View Article : Google Scholar : PubMed/NCBI
|
|
60
|
Moog-Lutz C, Peterson EJ, Lutz PG, Eliason
S, Cavé-Riant F, Singer A, Di Gioia Y, Dmowski S, Kamens J, Cayre
YE and Koretzky G: PRAM-1 is a novel adaptor protein regulated by
retinoic acid (RA) and promyelocytic leukemia (PML)-RA receptor
alpha in acute promyelocytic leukemia cells. J Biol Chem.
276:22375–22381. 2001. View Article : Google Scholar : PubMed/NCBI
|
|
61
|
Gill RM, Michael A, Westley L, Kocher HM,
Murphy JI and Dhoot GK: SULF1/SULF2 splice variants differentially
regulate pancreatic tumour growth progression. Exp Cell Res.
324:157–171. 2014. View Article : Google Scholar : PubMed/NCBI
|
|
62
|
Morimoto-Tomita M, Uchimura K, Werb Z,
Hemmerich S and Rosen SD: Cloning and characterization of two
extracellular heparin-degrading endosulfatases in mice and humans.
J Biol Chem. 277:49175–49185. 2002. View Article : Google Scholar : PubMed/NCBI
|
|
63
|
Hur K, Han TS, Jung EJ, Yu J, Lee HJ, Kim
WH, Goel A and Yang HK: Up-regulated expression of sulfatases
(SULF1 and SULF2) as prognostic and metastasis predictive markers
in human gastric cancer. J Pathol. 228:88–98. 2012.PubMed/NCBI
|