Introduction
Ewing sarcoma (ES) is a rare disease characterized
by tumors originating in the bone marrow of long flat bones of the
body. ES commonly affects the pelvis (19%), long bones (47%) and
ribs (12%) (1). However, this
disease can develop in any other tissue or organ (extra-osseous ES)
(2,3).
Generally, ES occurs during the second decade of
life and rarely arises before 5 years of age or after 30 years of
age (4). In Colombia, the incidence
rate of ES is approximately 0.1 cases per 100,000 inhabitants, with
similar rates in Chile, Ecuador and Costa Rica (5), while 225 cases have been reported in
individuals less than 20 years of age in North America (6).
ES tumors are histologically characterized by a
greyish, bright, translucent mass, with necrotic and hemorrhaging
areas with several cavities and marked vascularization (7). The presence of small round cells with
narrow cytoplasm and oval hyperchromatic and granulated nuclei
constitutes another key feature of ES tissue (8). Immunohistochemical analyses usually
reveal positivity for CD99 membrane glycoprotein, and in at least
90% of cases the tumor is caused by the chromosomal translocation
t(11;22), although it is possible that other translocations are
also involved in its pathology (10% of cases) (8). The t(11;22) translocation is
responsible for the generation of the EWS-FLI1 fusion gene
that expresses the EWS-FLI1 transcription factor. This fusion gene
is often used to diagnose the pathological condition, whereby ES
molecular profiling is performed, quantifying EWS-FLI1 and FLI1-EWS
expression by quantitative polymerase chain reaction (qPCR), and
detecting chromosomal rearrangements by fluorescence in situ
hybridization (FISH) (9,10).
EWS-FLI1 functions as an aberrant transcription
factor and is believed to be an initiator of tumorigenic events
(11). The study by Matsumoto et
al (12) reported that the
EWS-FLI1 transcription factor affects the expression of regulatory
genes of the G1 stage of the cell cycle, including cyclin G1,
cyclin D1, p21 and p27 (13). Other genes that have been identified
as transcriptional targets of EWS-FLI1 are homeobox protein
NKX2-2, nuclear receptor subfamily 0 group B member 1
(NR0B1), and histone-lysine N-methyltransferase EZH2
(14). The function of EWS-FLI1 is
not only restricted to transcriptional regulation, but also
includes modulating the expression of microRNAs (miRNAs) and long
non-coding RNAs.
The epigenetic events described within the
pathogenic context of ES include the participation of the EWS-FLI1
protein in aberrant chromatin remodeling processes (15). EWS-FLI1 has specific binding domains
that recognize microsatellites with GGAA sequences embedded in
specific genes; this binding leads to the recruitment of the p300
protein (acetyltransferase) to the nucleosome, resulting in
loosening the packaging of DNA, facilitating the transcriptional
mechanisms to reach the gene (15).
It has been reported that the aforementioned epigenetic mode of
action is involved in the activation of the NR0B1 genes
(15).
Cases of ES have been reported in which the EWS-FLI1
protein fulfills a role of transcriptional repressor of miRNA-22,
whose expression participates in the inhibition of cell
proliferation programs. In addition, lysine-specific demethylase 3A
has been reported to cause this silencing in tumorigenic ES
scenarios (16).
The contribution of altered DNA promoter methylation
to ES development is beginning to come into focus (14), whereas the epigenetic profile
(histone acetylation and methylation enrichment of the promoter)
that may be regulating the expression of aberrant transcription
factor EWS-FLI1, remains poorly studied and understood. The
in-depth study of the molecular mechanisms that regulate the
expression of aberrant transcription factors such as EWS-FLI1 is
fundamental and necessary (17),
because this knowledge will allow us to understand and develop
novel therapeutic approaches to this pathology, such as
epi-drugs.
Materials and methods
General
The present study was carried out under the 1993
guidelines of the Colombian Ministry of Health and Social
Protection (resolution no. 008430), and adhered to the ethics
principles for medical investigation with human beings, according
to the Ethical Committee of the School of Medicine, Javeriana
Pontifical University (Bogota, Colombia), and the Helsinki
Declaration of 1975. The code assigned by the ethics committee for
the execution of this study is FM-CIE-8148-14 (2014) Pontificia
Universidad Javeriana / Hospital Universitario San Ignacio.
The study was conducted at the San Ignacio
University Hospital (Bogota, Colombia), and included two patients
in whom malignant pulmonary lesions were suspected (Table I). These patients had a lung biopsy
and histopathological examinations between October and December
2016. Informed consent was obtained to access each of the patient
samples.
 | Table I.Clinical characteristics of all the
patients with cancer. |
Table I.
Clinical characteristics of all the
patients with cancer.
| Case |
| 1 | 2 |
|---|
| Age |
| 49 | 19 |
| Sex |
| F | M |
| Pathology | Cancer | Yes | Yes |
|
| Pathological
diagnosis | Ewing sarcoma
extraoseus | Poorly
differentiated adenocarcinoma |
| Origin |
| Primary | Metastatic |
| Origin | Lung | No | No |
|
| Other | Femur Ewing
sarcoma | Bone |
| TNM
classification | T | 1 | 1 |
|
| N | 1 | 0 |
|
| M | 1b | 1a |
|
| G | 2 | 3 |
| Stage |
| IV | IV |
| Comorbidity |
| Absent | Absent |
| One year
survival |
| No | Yes |
| Smoker |
| No | Yes |
| Treatment |
| No | Yes |
Samples and cell culture
Samples were obtained during open lung biopsy and
submerged in base C culture medium containing antibiotics and 5%
fetal bovine serum (cat. no. A3840201; Gibco; Thermo Fisher
Scientific, Inc.) in a sterile 24-well culture plate (18). Using a stereoscope, solid tumors
were fractionated mechanically with scissors or a scalpel. The cell
suspensions were subdivided into 2–3 wells of the 24-well culture
platform, and incubated at 37°C and in 5% CO2
conditions. Cell culture medium renewal was carried out every 48 h,
until a confluent monolayer was obtained from the tumor fragments.
Cells were enzymatically dissociated using trypsin/EDTA (cat. no.
2520056; Gibco; Thermo Fisher Scientific, Inc.), and then the
passages were transferred to Petri dishes of 35, 60 and 100 mm
(18). Once 100% confluency was
reached, the cells were used for immunohistochemistry, gene
expression, cytogenetic and epigenetic analysis.
Cell lines
ES A673 cell line [CRL-1598; American Type Culture
Collection (ATCC)] was cultured in Dulbecco's modified Eagle's
medium (DMEM; cat. no. 12491; Gibco; Thermo Fisher Scientific,
Inc.), supplemented with 10% fetal bovine serum and antibiotics
(cat. no. 15140122; Gibco; Thermo Fisher Scientific, Inc.). Cells
were incubated under conditions of 37°C and 5% CO2
(ATCC: The Global Bioresource Center). Hs 1.Tes (CRL-7002; ATCC) is
a non-tumor (NT) human testicular cell line that does not carry the
EWS-FLI1 fusion gene, and was used as a negative control.
This cell line was cultured in DMEM and supplemented with 10% fetal
bovine serum, according to the instructions from the ATCC.
Immunohistochemistry
Samples from two patients were available for
immunohistochemical analysis of CD99, Friend leukemia integration 1
transcription factor (FLI1), CD57 (HNK-1), Vimentin, enolase,
Chromogranin, Synaptophysin, S-100, CD45, CD117, TdT, Desmin,
Myogenin, Cytokeratin (AE/AE3). List of antibodies used in
immunhistochemistry assays are shown in Table SI.
The paraffin-embedded sections were rehydrated and
incubated for 55 min at 20°C in methanol 10%
H2O2 to block endogenous peroxidase
(EnVisionTM FLEX + Dako kit). Sections were pretreated to
facilitate antigen retrieval and increase membrane permeability to
antibodies with the same kit and then incubated with the primary
antibody (19). Positive reaction
was visualized by 3.3′-diaminobenzidine (DAB) peroxidation
according to the protocol. The sections were counterstained with
Harris's hematoxylin, dehydrated, coverslipped, and observed under
an Olympus optical microscope BX53. Positive and negative controls
were performed and validated for each antibody.
Analysis of the immunohistochemical markers was
carried out at the San Ignacio University Hospital as part of the
histopathological diagnosis protocol necessary to process the
samples of the patients.
Cytogenetic analysis and FISH
Cells were seeded on Knittel Microscope slides and
cultured until 80% confluency was reached. Colchicine (1 µg/ml) was
added and incubated for 2 h. Then, the cells were harvested by
treatment with 0.05 M KCl (cat. no. 7477-40-7; Sigma-Aldrich; Merck
KGaA) followed by fixation with 3:1 methanol (cat. no. 67-56-1;
Sigma-Aldrich; Merck KGaA) and glacial acetic acid (cat. no.
100063; Merck KGaA). Finally, the slides were evaluated using the
G-banding protocol (20). A total
of 30 metaphases were evaluated for each patient and each cell
line. Molecular cytogenetic analysis using FISH was performed to
evaluate the presence of the translocation between EWSR1 (ES region
1) and any of the ETS transcription factor family genes, in
particular FLI1, located in chromosomes 22 and 11, respectively.
The Cytocell Aquarius® kit was used, containing the
EWSR1 Breakapart Probe (Cytocell, Ltd.), with a 392-kb red probe
and a 631-kb green probe to be placed on either side of the
EWSR1 gene. The Carl Zeiss fluorescence microscope
(Axio-Scope A1) with image capture software was used for the
evaluation. The presence of fluorescent signals from the different
probes in both metaphase (25 metaphase) and nucleus (200 nucleus)
chromosomes were analyzed, and the findings were described
according to the International Cytogenetic Nomenclature System
(21).
Molecular analysis: RNA isolation, PCR
and nested PCR
Total RNA was extracted using TRIzol reagent (cat.
no. 15596026; Invitrogen; Thermo Fisher Scientific, Inc.) according
to the manufacturer's protocol, and cDNA was generated by reverse
transcription of 2 µg RNA using the ProtoScript® II
First Strand cDNA Synthesis kit (cat. no. E6560S; New England
BioLabs, Inc.). PCR reactions were performed with Taq DNA
Polymerase products (cat. no. M0273S; New England BioLabs, Inc.) on
the T100™ Thermal Cycler (Bio-Rad Laboratories, Inc.).
Conventional PCR was performed to detect the
presence of genes EWS, FLI1 and reciprocal fusion gene
FLI1-EWS. The primers used to amplify these genes were: EWS
forward, 5′-CAGCCTCCCACTAGTTACCC-3′ and reverse,
5′-GTTCTCTCCTGGTCCGGAAA-3′; FLI1 forward, 5′-AATACAACCTCCACACCGA-3′
and reverse, 5′-CTTACTGATCGTTTGTGCCCC-3′; and FLI1-EWS forward,
5′-GTGCTGTTGTCACACCTCAG-3′ and reverse, 5′-GTTCTCTCCTGGTCCGGAAA-3′
(22). Amplifications were
performed according to conditions established for each set of
primers: EWS with an initial denaturation step at 94°C for 30 sec,
and 42 cycles of denaturation at 59°C for 30 sec and annealing at
72°C for 60 sec for 15 sec; FLI1 with an initial denaturation step
at 94°C for 30 sec, and 42 cycles of denaturation at 58°C for 30
sec and annealing at 72°C for 60 sec; FLI1-EWS with an initial
denaturation step at 94°C for 30 sec, and 42 cycles of denaturation
at 62.4°C for 30 sec and annealing at 72°C for 60 sec. Nested PCR
was performed to detect the EWS-FLI1 fusion gene, using 5 µl
cDNA from each sample and two sets of primers. Nested PCR is a
modification of PCR that was designed to improve sensitivity and
specificity. The first round of amplification was performed using
EWS 22.8 forward, 5′-CCCACTAGTTACCCACCCCAAA-3′, and FLI1 reverse,
5′-AGGGTTGGCTAGGCGACTGCT-3′, and the second round of amplification
was performed using 5 µl of the first PCR product and primers EWS
22.3 forward, 5′-TCCTACAGCCAAGCTCCAAGTC-3′, and FLI1 reverse,
5′-GTCGGGCCCAGGATCTGATAC-3′ (23).
The thermocycling conditions used for the first and second round of
amplification included an initial denaturation step at 94°C for 30
sec, and 42 cycles of denaturation at 64.5°C for 30 sec and
annealing at 72°C for 60 sec. GAPDH was used as an internal
control.
Chromatin immunoprecipitation (ChIP)
assay
ChIP asssays were performed in cross-linked cromagin
samples. The cell were incubated for 10 min with 1% formaldehyde
with gentle agitation at room temperature, and washed three times
with 10 ml PBS. The formaldehyde cross-linked cells were incubated
for 1 h at room temperature with gentle agitation, washed three
times with cold PBS, resuspended in 1 ml cell lysis buffer (5 mM
Hepes, pH 8.0, 85 mM KCl, Triton X-100, and proteinase inhibitors),
and homogenized with a Dounce homogenizer (approximately 25 times
using a tight pestle). The cell extract was collected by
centrifugation at 3,000 × g for 5 min, resuspended in 0.5 ml
sonication buffer (50 mM Hepes, pH 7.9, 140 mM NaCl, 1 mM EDTA, 1%
Triton X-100, 0.1% deoxycholate acid, 0.1% SDS, and a mixture of
proteinase inhibitors) and incubated for 10 min on ice. Next, the
samples were sonicated at high power for four pulses of 10 min each
and centrifuged at 12,000 × g for 15 min at 4°C. The supernatant
was collected and stored at −80°C and chromatin size was confirmed
by electrophoretic analysis in 1% agarose gel.
Samples were precleared by incubating with 2–4 µg of
normal IgG and 50 µl of protein A/G-agarose beads (Santa Cruz
Biotechnology) for 1 h at 4°C with agitation. Chromatin was
centrifuged at 4000 × g for 5 min, and the supernatant was
collected and immunoprecipitated with specific antibodies (2 µg/ml)
for 12–16 h at 4°C. The immune complexes were recovered with the
addition of 50 µl of protein A or G-agarose beads followed by
incubation for 1 h at 4°C with gentle agitation. Immunoprecipitated
complexes were washed once with sonication buffer, twice with LiCl
buffer (100 mM Tris-EDTA buffer, pH 8.0 500 mM LiCl, 0,1% Nonidet
P-40, and 0,1% deoxycholic acid), and once with Tris-EDTA buffer,
pH 8.0 (2 mM EDTA and 50 mM Tris-HCl, pH 8.0), each time for 5 min
at 4°C. The protein-DNA complexes were eluted by incubation with
100 µl of elution buffer (50 mM NaHCO3 and 1% SDS) for
15 min at 65°C to reverse the crosslinking. Proteins were digested
with 100 µg/ml proteinase K for 2 h at 50°C, and the DNA was
recovered by phenol/Chloroform extraction and ethanol precipitation
using glycogen (20 µg/ml). The qPCR primers used to evaluate the
EWS-FLI1 promoter region were: set1EWS: Forward,
5′-CCGTAAACCTCCTCCTGCAT-3; and reverse, 5′-AAGCCCTTCACCCTTGCTAA-3,
directed towards the sequence of the promoter (24). The primer sequences used in this
study were taken from the study carried out by Jacques et al
(25).
In order to quantify the ChIP experiments, qPCR
(quantitative polymerase chain reaction) analysis was performed
using FastStart Essential DNA SYBR-Green Master; cat. no.
06402712001; Roche Diagnostics. The results were analyzed using the
percentage Input Method according to Haring et al (26). Results are expressed as % input ±
SEM using normal IgG as a specificity control.
The antibodies used in the ChIP assays were:
H3K27me3 (cat. no. 07-449), H3K9ac (cat. no. 06942) (both Merck
KGaA), H3K4me3 (cat. no. ab8580), H3K9Me3 (cat. no. ab8898) and
H3K27ac (cat. no. ab4729) (all from Abcam).
Statistical analysis
In order to perform statistical analysis, NT control
cells (testis Hs 1.Tes cell line) were used for the comparison with
the ES samples. For ChIP assays, we used a one-way analysis of
variance followed by the Dunnett's post hoc test to compare
significant changes with respect to control. A value of P<0.05
was considered to indicate a statistically significant
difference.
Results
Clinical characteristics of
patients
Table I lists the
study subjects with their clinical characteristics. Patient 1 was a
49-year-old female patient, with no history of pathological
conditions, who underwent a consultation following two months of
respiratory issues, including cough, dyspnea and functional class
deterioration associated with left hemithorax pain. During the
physical examination, decreased respiratory sounds were identified
in the left lung. A requested X-ray revealed enlargement of the
left pulmonary hilum, and contrast CT demonstrated a decrease in
the filling of the left pulmonary artery, and the presence of a
lobulated mass around the left pulmonary artery and left bronchus.
The patient underwent surgery, but complete tumor resection could
not be achieved; instead only biopsy samples were collected.
Patient 2 was an 18-year-old female with
advanced-stage ES in the left femur. Following tumor resection,
extension studies revealed a pulmonary nodule in the left upper
lobe. A wedge biopsy was performed, detecting visceral pleura and
lymphovascular tissue compromise due to metastatic ES, positive for
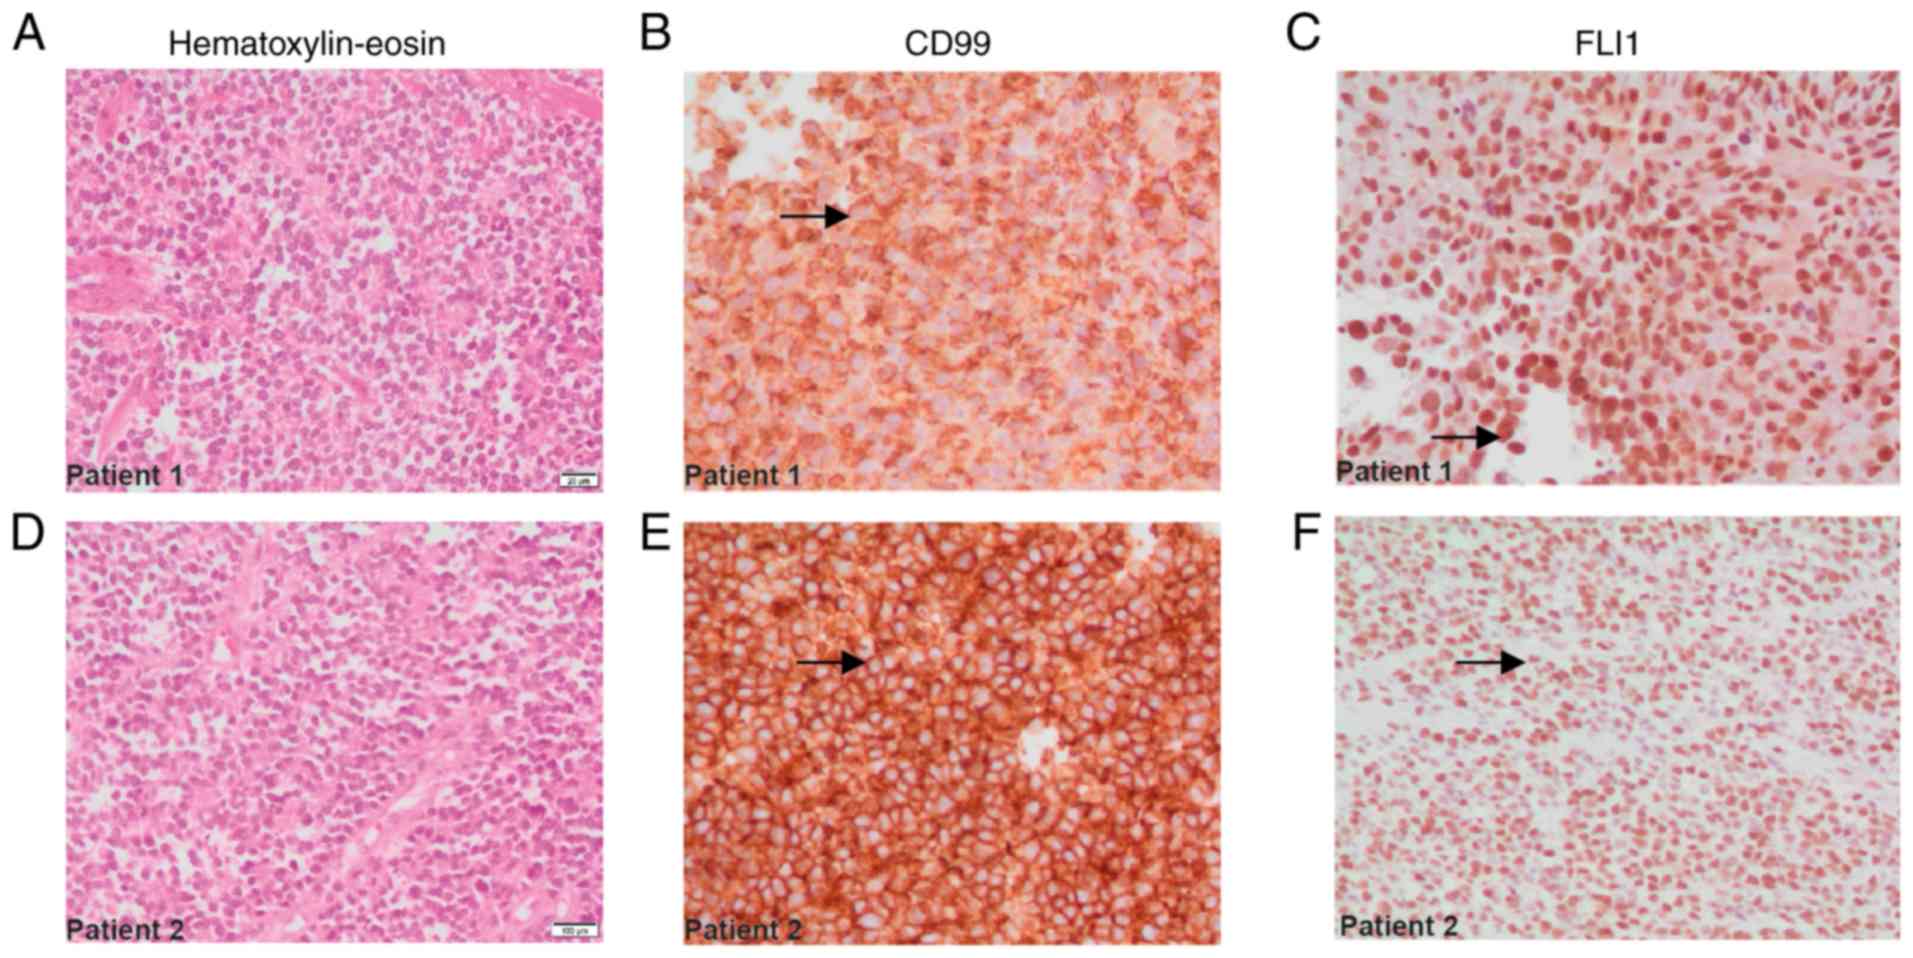
immunohistochemical markers FLI1 and CD99 (Fig. 1E-F), and the cell proliferation
index (Ki-67) was >90%.
ES immunohistochemical and cytogenetic
analysis
For patients 1 and 2, immunohistochemical analysis
results revealed positive membranous staining for CD99 (Fig. 1B and E, arrows), and nuclear
positivity for FLI1 (Fig. 1C and F,
arrows), consistent with the characteristics of ES family tumors.
Other markers, including S-100, CD45, desmin, enolase and myogenin,
were also investigated (Table
II).
| Table II.Immunohistochemical markers of
patients with Ewing sarcoma. The table lists 12 immunohistochemical
markers assayed in samples from two patients. |
Table II.
Immunohistochemical markers of
patients with Ewing sarcoma. The table lists 12 immunohistochemical
markers assayed in samples from two patients.
| Case number | 1 | 2 |
|---|
| CD99 | + | + |
| FLI-1 | + | + |
| CD57(HNK-1) | + | + |
| Vimentin | + | NA |
| Enolase | NA | − |
| Chromo-granin | − | NA |
| Synapto-physin | − | NA |
| S-100 | − | + |
| CD45 | − | − |
| CD117 | − | NA |
| TdT | − | NA |
| Desmin | − | − |
| Miogenin | NA | − |
| Cytokeratin
(AE/AE3) | − | NA |
The histological description of each case was also
carried out, based on the images captured of the tissues treated
with hematoxylin and eosin dyes. This staining made it possible to
demonstrate the presence of small, round, blue cells with
hyperchromatic nuclei and decreased cytoplasm, all characteristics
of ES (Fig. 1A and D).
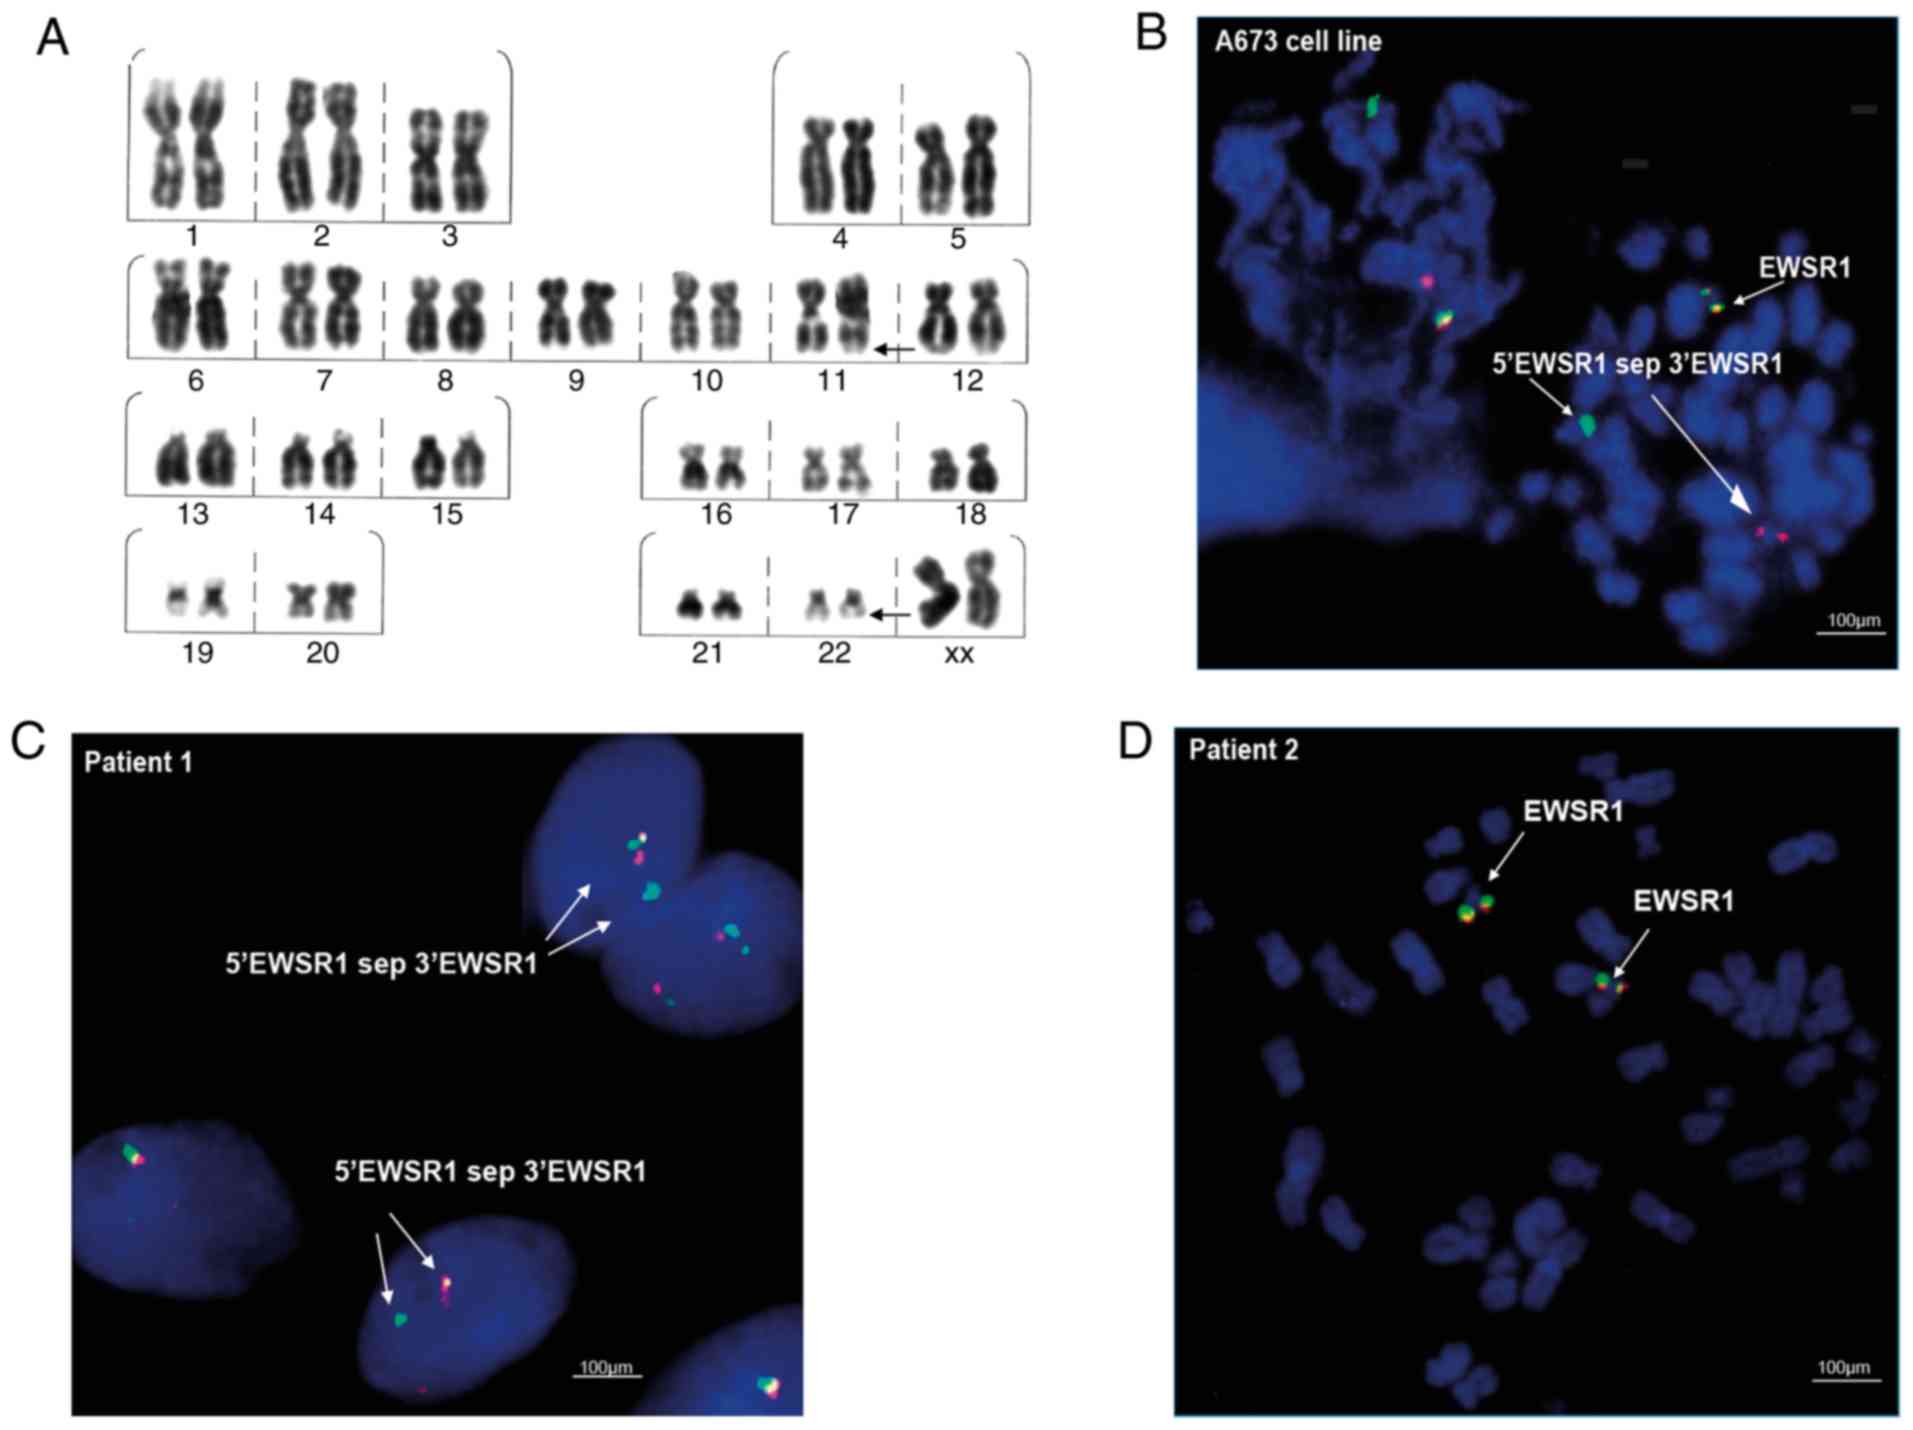
Cytogenetic investigation included G-banding
analysis to detect chromosomal abnormalities, and FISH for the
analysis of EWSR1 gene translocation on chromosome 22. In
patient 1, it was possible to observe clonal chromosomal
alterations such as del(22)(q13) (in 14 metaphases), del(20)(q13.2)
(in 5 metaphases) and del(16)(q22) (in 4 metaphases). In addition,
translocation t(11;22)(q22;q12), characteristic of ES, was observed
at a low frequency (2%; Fig. 2A),
as well as translocation t(1;16)(q21;p13), also reported for this
type of tumor (Table III). By
contrast, the presence of the translocation t(1;16)(q21;p13) was
not detected in the samples of patient 2.
| Table III.Cytogenetic findings obtained from
the G-banding technique. |
Table III.
Cytogenetic findings obtained from
the G-banding technique.
| Samples | Chromosomal
alterations | Frequency [%] | FISH EWSR1
translocation |
|---|
| A673 cell line |
Multiple
alterations | 90 | Positive |
| Hs-Tes cell
line |
None | 0 | Negative |
| Patient 1 |
t(11;22)(q22;q12) | 2 | Positive (2%) |
|
|
t(1;16)(q21;p13) | 1 |
|
|
|
del(22)(q13) | 14 |
|
|
|
del(20)(q13.2) | 5 |
|
|
|
del(16)(q22) | 4 |
|
| Patient 2 |
del(17)(p10) | 2 | Negative |
|
|
del(7)(p10) | 1 |
|
The FISH assays in the ES A673 cell line, revealed
the EWSR1 translocation ish 22q12(EWSR1×2)(5′EWSR1 sep 3′EWSR1×1)
(Fig. 2B), represented by the
separation of the probe and the visualization of separate green and
red signals (Fig. 2B; indicated
with arrows and the label 5′EWSR1 sep 3′EWSR1). In the clinical
samples, the FISH cytogenetic analysis showed the presence of the
EWSR1 translocation nuc ish(EWSR1×2)(5′EWSR1 sep 3′EWSR1×1) in
patient 1, indicated as separated signals in 10% of the interphase
nuclei analyzed (Fig. 2C). By
contrast, the translocation was not detected in the samples of
patient 2 (Fig. 2D).
EWS-FLI1 fusion gene expression
profile
The normal functionality of the EWSR1 and
FLI1 genes can be affected following reciprocal chromosomal
translocation events that lead to the synthesis of the fusion genes
responsible for the pathological condition of ES. The chimeric
proteins EWS-FLI1 and FLI1-EWS commonly characterizes the molecular
profile of the disease (22).
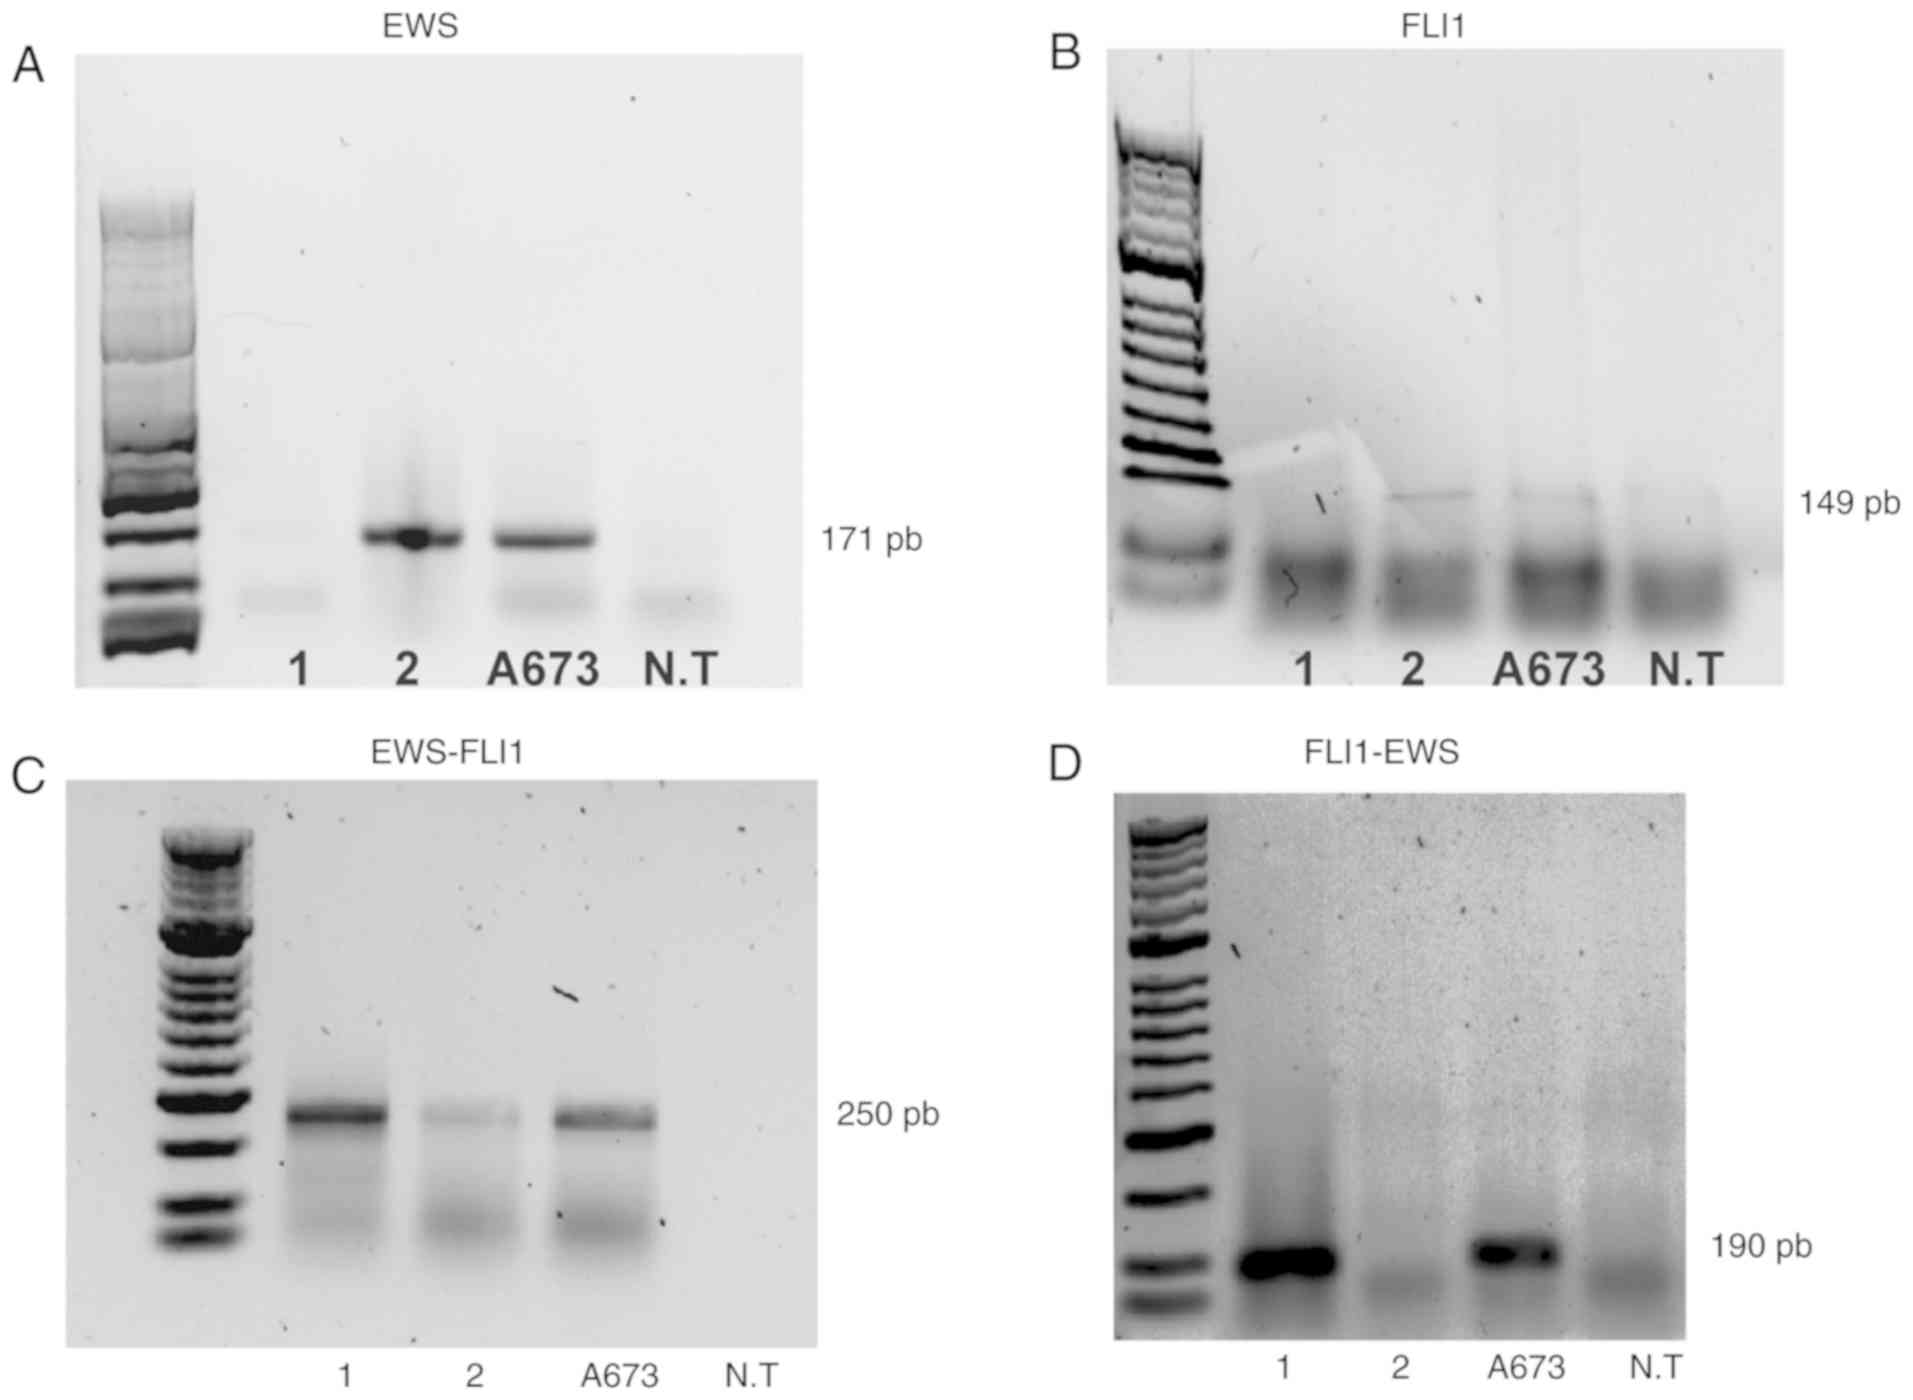
Conventional and nested PCR tests were performed on
lung samples from patients 1 and 2, using ES A673 cells as a
positive control and an NT cell line as a negative control for all
experiments (Fig. 3). Expression of
the EWS and FLI1 genes was observed in patient 2 and
the A673 cells (Fig. 3A and
3B). On the other hand, when
performing two rounds of amplification using two sets of EWS-FLI1
primers, the detection of the EWS-FLI1 fusion gene was
possible in the A673 cells and the two patients (Fig. 3C). Additionally, the reciprocal
fusion gene FLI1-EWS was detected in the cell line A673 and
patient 1 (Fig. 3D).
Notably, the mRNA levels of the fusion gene were
lower in patient 2 than those detected in patient 1 and in the A673
cell line (Fig. 3C), explaining why
patient 2 exhibited higher expression of the non-fusion EWS and
FL11 genes compared with patient 1 (Fig. 3A and B).
Epigenetic modifications in the
EWS-FLI1 fusion gene
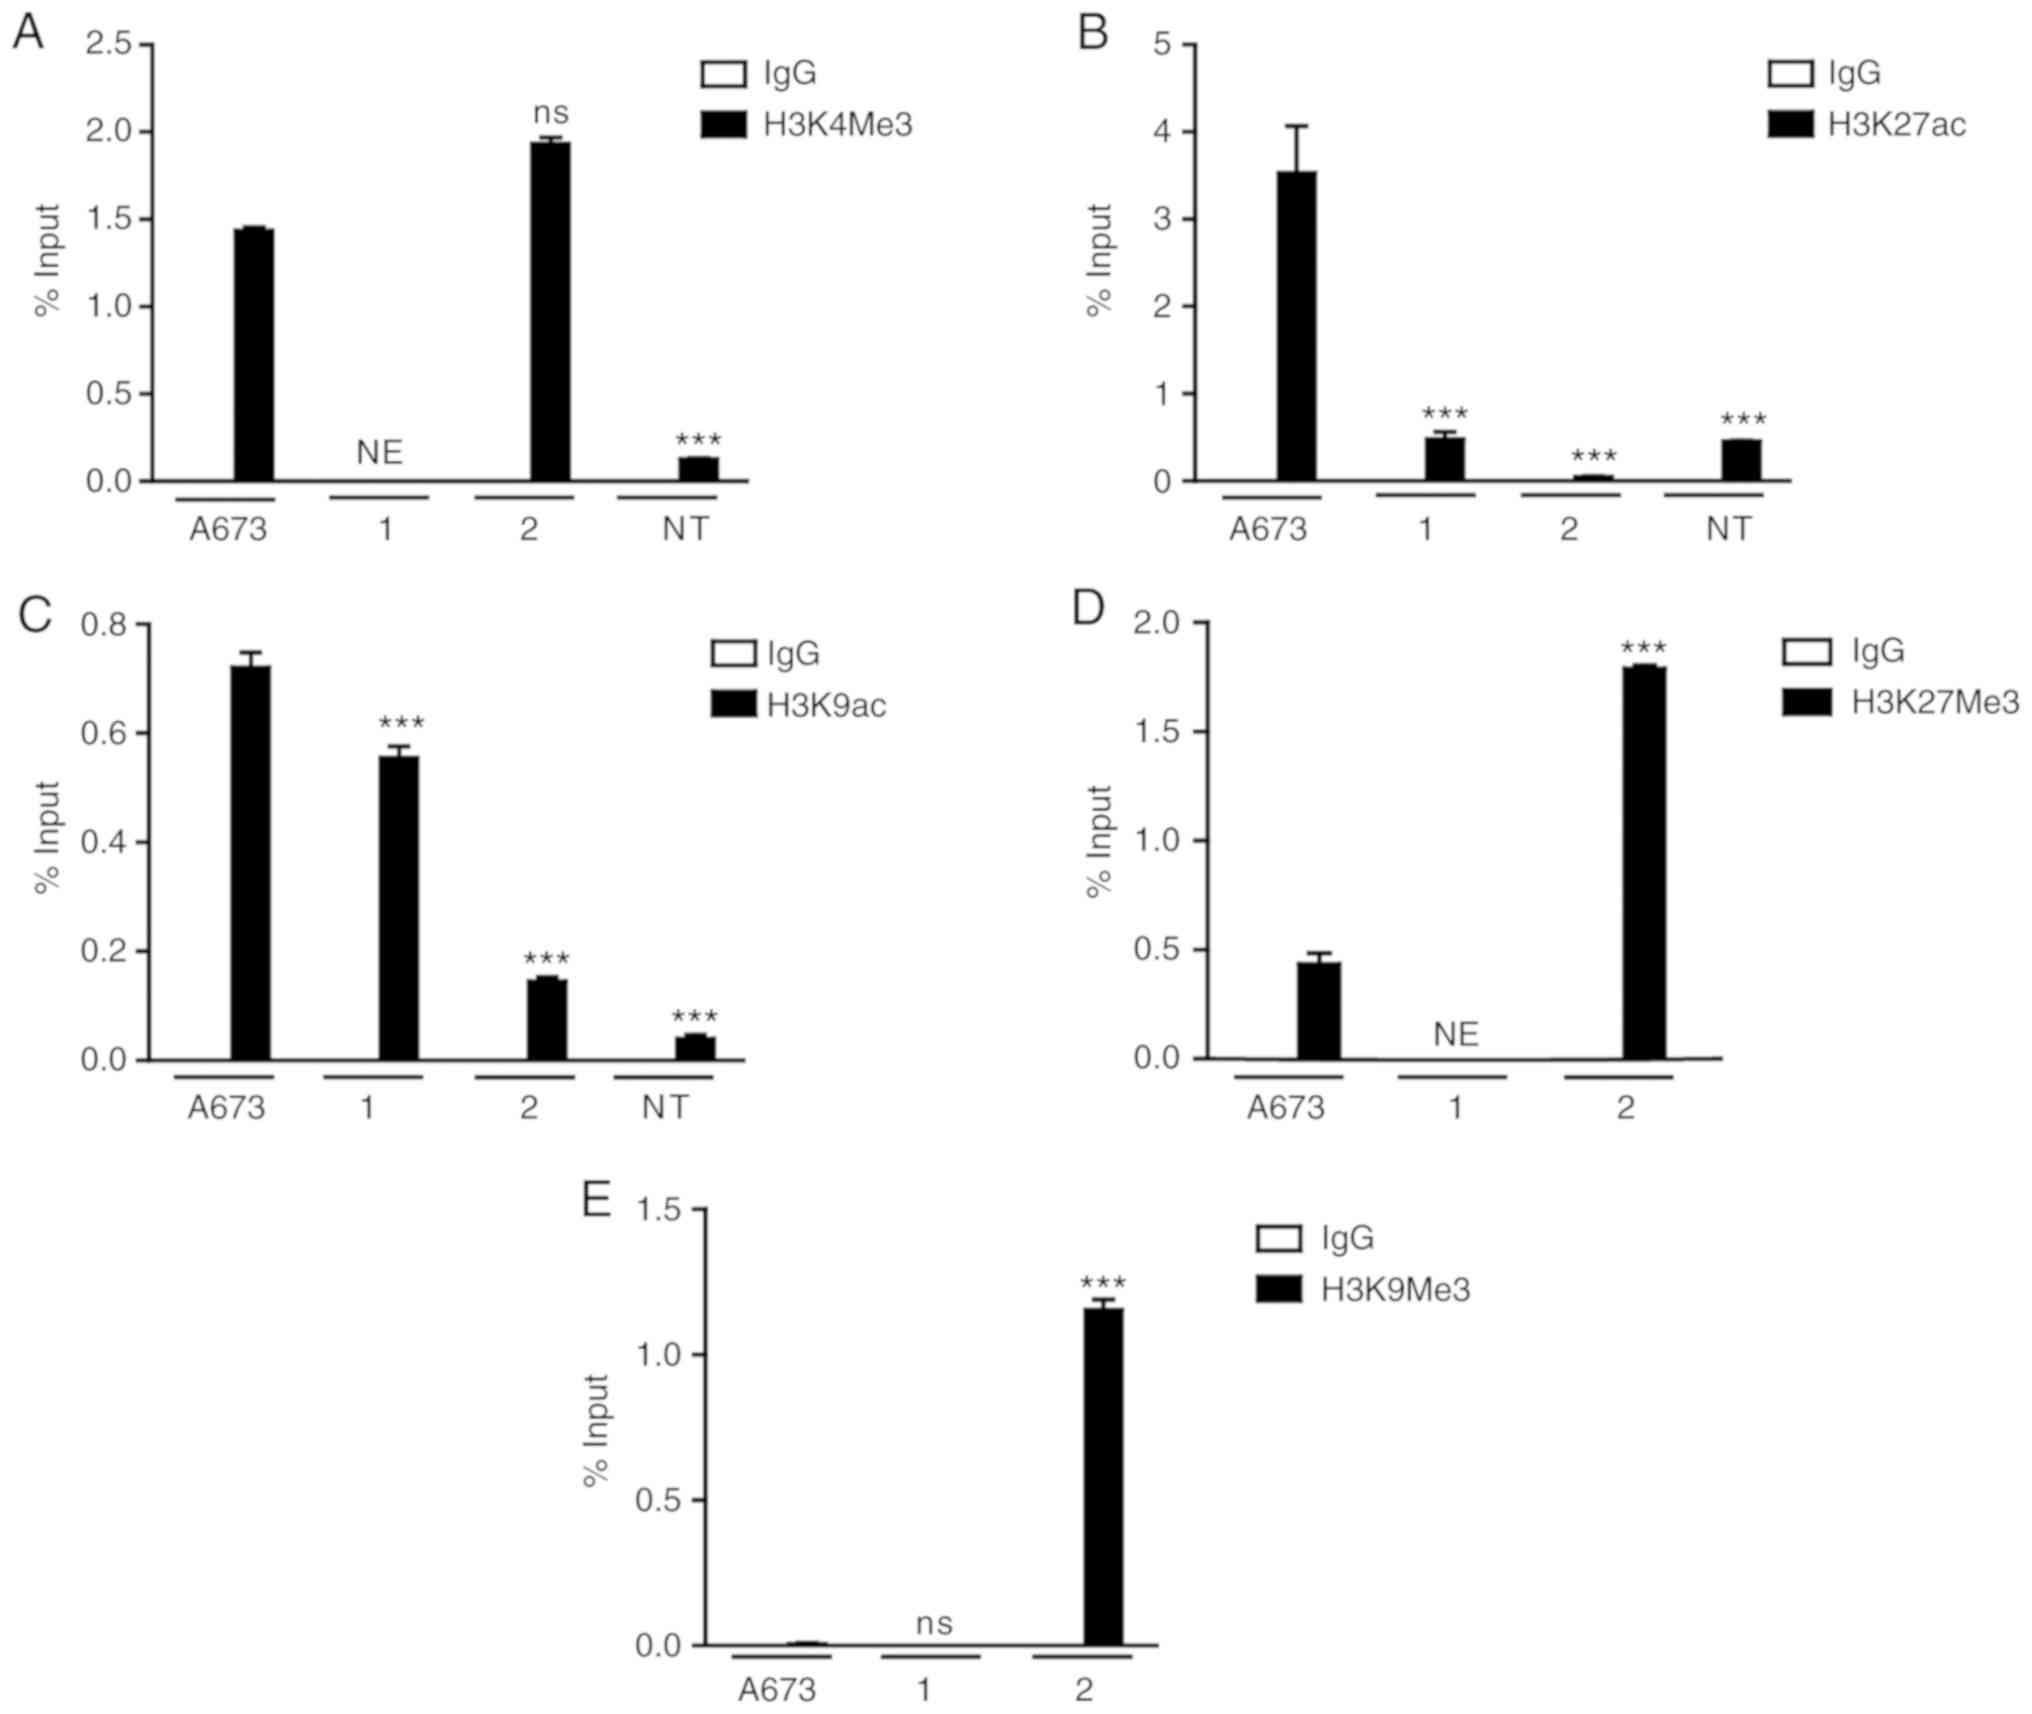
To elucidate the contribution of epigenetic
mechanisms on the transcriptional control of the EWS-FLI1
fusion gene and, therefore, on the cellular processes controlled by
EWS-FLI1 expression in ES, ChIP assays were performed, analyzing
histone H3 covalent modifications in the EWS promoter, which
controls the transcription of the EWS-FLI1 fusion gene (Fig. 4). Tumor cells obtained from patient
1, and the A673 cell line exhibited enrichment at H3K4Me3 and
H3K9ac, and decreased levels of H3K9Me3 (Fig. 4A, C and E). Surprisingly, H3K27ac
was present only in the A673 cell line (Fig. 4B), whereas decreased levels of
H3K27Me3 were detected in the A673 cells as well as in patient 1
(Fig. 4D). On the other hand, the
samples from patient 2 exhibited enrichment of repressive markers
H3K27Me3 and H3K9Me3 in the EWS promoter (Fig. 4D and E).
In the NT cells, the ChIP results revealed the
presence of low levels of the activating markers H3K4Me3, H3K27ac
and H3K9ac (Fig. 4A-C), consistent
with the absence of the detection of EWS-FLI1 fusion gene
expression.
Discussion
Detection and analysis of the EWS-FLI1 fusion
gene, together with immunohistochemical markers CD99 and FLI1,
constitutes an important part of the molecular characterization
that must be considered when making a correct diagnosis of ES,
given the symptomatic and histopathological similarities that this
condition may have with other soft tissue sarcomas (8,11).
Therefore, immunohistochemical, cytogenetic and molecular tests
confirmed the suspicion of two ES cases examined within the present
study.
Sarcomas, by definition, are rare tumors with
primary origin in soft and bony tissues of the body (1,2). In
addition, they display high genetic and clonal heterogeneity,
which, in some cases, may make diagnosis challenging. This means
that the same clinical picture can be the product of different
genotypes. Sarcomas in general are caused by chromosomal
rearrangements, including translocations, deletions, duplications
and inversions, and in certain cases by genetic mutations (8). Therefore, it is not surprising that,
in a single ES sample, a genetic mosaic can be responsible for the
condition, since there are at least 16 structural possibilities of
gene fusions that may cause this neoplasm, formed by different
combinations between the EWS gene and other genes belonging
to the ETS transcription factors family (1). In this study, lung tissue samples
analyzed from patient 1 were obtained from a biopsy performed by
open surgery as a consequence of the suspicion of a possible lung
adenocarcinoma. On the other hand, samples from patient 2, also
pulmonary tissue, were included in the study after having undergone
histopathological analyses that suggested a case of ES with primary
origin in the left femur and lung metastasis. Both samples were
subjected to FISH analysis and initial results demonstrated the
presence of the characteristic ES translocation t(11;22)(q22;q12)
in patient 1 (in only 2 of 200 analyzed nuclei). However, this
chromosomal rearrangement was not detected in the samples of
patient 2. This represents a possible reason for the negative
results obtained during the FISH analyses of the samples of patient
2, since this case could be made up of clonal and genetic mosaic
patterns different from the known characteristic translocation, or
the samples provided may have contained a large proportion of
healthy cells, as the FISH analysis detected several signals
referring to cells apparently free of chromosomal rearrangements.
However, the possibility that the cell samples contained expression
profiles for this gene that were too low to be detected by the
probe, cannot be excluded.
On the other hand, molecular analyses confirmed the
initial suspicion of ES in both samples (patient 1 and 2), which
showed expression of the EWS-FLI1 fusion gene, the molecular
hallmark of ES. A higher expression of EWS-FLI1 gene was
evident in patient 1, compared with the expression observed in
patient 2, providing a possible explanation to the tenuously
expressed band in the FISH results of the latter. In addition, it
was also clear that the EWS and FLI1 genes were
present in this sample (patient 2), leading to the conclusion that
the proportion of cells with the fusion gene in this case could be
significantly smaller than that without the translocation. On the
other hand, these two genes (EWS and FLI1) were not
detectable in the samples of patient 1, reflecting the prevalence
of cells carrying the characteristic chromosomal translocation of
the disease. In addition, expression of the reciprocal fusion gene
FLI1-EWS, whose presence is associated with diagnosis of ES
cases with more aggressive behavior, was quantified. This protein
collaborates with EWS-FLI1 to deregulate the normal expression of
genes associated with differentiation, proliferation and cell
survival processes (22).
Expression of the FLI1-EWS mature transcript expression was
demonstrated in patient 1; however, the translocated chromosome
encoding FLI1-EWS is likely lost in a small subset of cells,
contributing to the genetic heterogeneity of the sarcoma (22). As a complement to the cytogenetic
and molecular assays that contributed to the formation of the
differential diagnosis of the disease, immunohistochemical analysis
was also carried out. Immunohistochemical labeling for CD99 and
FLI1 was positive in both cases, in agreement with the main
hypothesis that both samples were framed in a cellular context of
ES. The clinical-molecular analysis ended up ruling out the fact
that both samples are clear cases of ES, particularly patient 1,
whose tumor corresponded to ES with primary origin in lung tissue,
a case rarely reported in the literature.
ChIP assays were performed using a set of primers
(set1EWS) directed to the EWS1 gene promoter. The primers were
designed as part of the study by Jacques et al (25), a product of the identification of
sections in EWS-FLI1 gene highly enriched by transcription
factors following a ChIPseq analysis. This analysis involved the
detection of covalent modifications of histone H3, including
methylation (H3K4Me3) and acetylation events (H3K27ac and H3K9ac),
characteristic markers of gene activation, as well as
trimethylation of lysine 27 (H3K27Me3) and trimethylation of lysine
9 (H3K9Me3), two transcriptional repressor markers.
A significant enrichment of H3K4Me3 was found in the
ES A673 cell line and patient 2, compared with that detected in the
NT cells, indicating its possible contribution to gene activation
in pathological contexts. This modification could not be evaluated
in patient 1, as not enough chromatin was available to perform the
analysis. On the other hand, H3K27ac proved to be an abundant
modification in the region amplified from the A673 cell line, and
was also found in patient 1, providing evidence for its possible
role in EWS-FLI1 fusion gene activation. H3K9ac was enriched
in A673 cells and in the sample of patient 1, compared with that
observed in the NT cells. A previous study indicated a probable
contribution in the activation of the EWS-FLI1 gene by the
covalent histone modifications evaluated in this study (25).
Furthermore, repressive covalent histone
modifications H3K27Me3 and H3K9Me3 were also analyzed.
Interestingly, low levels of H3K27Me3 were detected in the A673
cell line and in patient 1. However, cells from patient 2 exhibited
significant enrichment for this modification, possibly explaining
why the expression levels of EWS-FLI1 in this case were lower than
in patient 1, noting that clonal heterogeneity of the sample also
contributes to this condition. Finally, H3K9Me3, which was
completely absent in the A673 cells and patient 1, was highly
detected in patient 2 compared with the other samples, reinforcing
the arguments regarding the reason EWS-FLI1 was expressed less in
this sample.
In general, it is possible to predict the role that
histone modifications H3K27ac, H3K9ac and H3K4Me3 may have in the
transcriptional activation of EWS-FLI1 fusion gene, since it
was possible to detect significant enrichment levels when the
promoter was transcriptionally active. However, the enrichment
levels of all activating modifications were lower in patient 2
compared with the other ES groups. This result was in agreement
with the EWS-FLI1 mRNA expression levels, which were low compared
with those in patient 1, as well as with the high genetic and
cytogenetic heterogeneity exhibited in the cells analyzed. This
also corresponded with the enrichment of two repressive histone
modifications (H3K27Me3 and H3K9Me3), which were present to a
greater proportion in patient 2 compared with those in the A673
cells and patient 1, where the enrichment levels were low.
Previous findings have established that epigenetic
regulation of the EWS-FLI1 promoter is mediated by the presence of
reader-type proteins belonging to the bromodomain and
extra-terminal domain (BET) family (25). This type of peptide possesses a
functional domain, known as a bromodomain, responsible for the
identification of highly acetylated sections of the genome. After
detection of the activating modification, a set of molecular events
is initiated, concluding in the recruitment of transcription
factors that promote expression of the fusion gene. Studies using
ChIP assays have demonstrated the enrichment of enzymes belonging
to the BET family on the same sequences of the EWS-FLI1 gene
promoter analyzed during the development of the present study
(25). In this context, the
covalent histone modifications present on the EWS promoter reported
here, especially acetylation, may regulate the transcription of the
EWS-FLI1 gene through recruitment of BET family proteins,
which are responsible for triggering the first activation signaling
cascades of the EWS-FLI1 gene, as described by Jacques et
al (25).
The hallmark of ES tumors is a translocation between
chromosomes 11 and 22, resulting in a fusion protein, commonly
referred to as EWS-FLI1. The expression of the aberrant EWS-FLI1
transcription factor is responsible for the activation of signaling
pathways involved in cancer (11).
Herein, it is reported that the transcriptional activation and
repression of the EWS-FLI1 fusion gene is accompanied by selective
deposition and elimination of histone markers during ES disease.
These epigenetic profiles are mediated by the enrichment of
H3K4Me3, H3K9ac and H3K27ac when the promoter is active. By
contrast, when the promoter is repressed, there is H3K27Me3 and
H3K9Me3 enrichment.
The present study is a product of transdisciplinary
work by individuals belonging to areas of clinical research and
basic science, two bodies of knowledge that complement each other
and contribute to the realization of more accurate diagnoses.
The present study demonstrates the possible
potential of clinical-molecular analysis in the understanding of
ES, in order to develop more efficient treatments that direct their
therapeutic strategies to the molecular level.
Supplementary Material
Supporting Data
Acknowledgements
Not applicable.
Funding
The present study was supported by grants from
Hospital Universitario San Ignacio (2017–2018) and Pontificia
Universidad Javeriana (PUJ 7711 and PUJ 8530).
Availability of data and materials
The datasets used and/or analyzed during the current
study are available from the corresponding author on reasonable
request.
Authors' contributions
CM, LR and AR designed and performed the experiments
and analyzed the data. DT, MJF and AC performed the clinical
analysis. JR performed the pathological analysis. OM supervised
Cytogenetic Analysis. BH and AR designed and supervised the ChIP
experiments. A.R. supervised the research and analyzed the data.
C.M., A.R., B.H., and O.M. wrote the main parts of the manuscript.
All authors read and approved the final manuscript.
Ethics approval and consent to
participate
This study was conducted under the 1993 guidelines
established by the Colombian Ministry of Health and Social
Protection (resolution no. 008430), and following the ethical
principles for medical investigation with human beings, according
to the Ethical Committee of the School of Medicine, Javeriana
Pontifical University, Bogotá, Colombia (FM-CIE.8148-14).
Patient consent for publication
Not applicable.
Competing interests
The authors declare that they have no competing
interests.
References
|
1
|
Desai KI, Nadkarni TD, Goel A, Muzumdar
DP, Naresh KN and Nair CN: Primary Ewing's sarcoma of the cranium.
Neurosurgery. 46:62–68. 2000. View Article : Google Scholar : PubMed/NCBI
|
|
2
|
Deokar K, Nana GK and Shivhari G: Primary
ewings sarcoma of the lung. J Clin Diagn Res. 9:XD01–XD03.
2015.PubMed/NCBI
|
|
3
|
de Alava E: Patología molecular de los
srcomas. Oncología (Barcelona). 28:22–38. 2005.(In Spain).
View Article : Google Scholar
|
|
4
|
Kumar N and Gupta B: Global incidence of
primary malignant bone tumors. Curr Orthopaedic Practice. 27:52016.
View Article : Google Scholar
|
|
5
|
Soto C, Gómez L, Criollo F, Romo R, Messa
Ó and Arbeláez P: Sarcoma de Ewing de la falange proximal del
meñique. Reporte de caso. Revista Colombiana de Cancerología.
18:137–142. 2014.(In Spain). View Article : Google Scholar
|
|
6
|
Dynamed, . Ewing sarcoma in children.
Available at:. https://www.dynamed.com/condition/ewing-sarcoma-in-children
|
|
7
|
Desai SS and Jambhekar NA: Pathology of
Ewing's sarcoma/PNET: Current opinion and emerging concepts. Indian
J Orthop. 44:363–368. 2010. View Article : Google Scholar : PubMed/NCBI
|
|
8
|
Kaneko Y, Kobayashi H, Handa M, Satake N
and Maseki N: EWS-ERG fusion transcript produced by chromosomal
insertion in a Ewing sarcoma. Genes Chromosomes Cancer. 18:228–231.
1997. View Article : Google Scholar : PubMed/NCBI
|
|
9
|
Kim SK and Park YK: Ewing sarcoma: A
chronicle of molecular pathogenesis. Hum Pathol. 55:91–100. 2016.
View Article : Google Scholar : PubMed/NCBI
|
|
10
|
Balamuth NJ and Womer RB: Ewing's sarcoma.
Lancet Oncol. 11:184–192. 2010. View Article : Google Scholar : PubMed/NCBI
|
|
11
|
Franzetti GA, Laud-Duval K, Bellanger D,
Stern MH, Sastre-Garau X and Delattre O: MiR-30a-5p connects
EWS-FLI1 and CD99, two major therapeutic targets in Ewing tumor.
Oncogene. 32:3915–3921. 2012. View Article : Google Scholar
|
|
12
|
Matsumoto Y, Tanaka K, Nakatani F,
Matsunobu T, Matsuda S and Iwamoto Y: Downregulation and forced
expression of EWS-Fli1 fusion gene results in changes in the
expression of G(1)regulatory genes. Br J Cancer. 84:768–775. 2001.
View Article : Google Scholar : PubMed/NCBI
|
|
13
|
Randall L, Calvert G, Spraker H, Lessnick
S and Sarcoma de Ewing: Diagnóstico, tratamiento y pronóstico.
Liddy Shriver Sarcoma Initiative. Available at:. http://sarcomahelp.org/translate/es-sarcoma-ewing.htmlJan
18–2018
|
|
14
|
Lawlor ER and Thiele CJ: Epigenetic
changes in pediatric solid tumors: Promising new targets. Clin
Cancer Res. 18:2768–2779. 2012. View Article : Google Scholar : PubMed/NCBI
|
|
15
|
Cavalheiro dos Santos D, da Cruz
Evangelista L and Kerche-Silva L: Genetic alterations and diagnosis
in Ewing sarcoma: A review. Oatext.com (2017). Available at:.
http://www.oatext.com/genetic-alterations-and-diagnosis-in-ewing-sarcoma-a-review.phpApr
5–2018
|
|
16
|
Parrish JK, Sechler M, Winn RA and
Jedlicka P: The histone demethylase KDM3A is a
microRNA-22-regulated tumor promoter in Ewing sarcoma. Oncogene.
34:257–262. 2013. View Article : Google Scholar : PubMed/NCBI
|
|
17
|
Rocchi A, Manara MC, Sciandra M, Zambelli
D, Nardi F, Nicoletti G, Garofalo C, Meschini S, Astolfi A, Colombo
MP, et al: CD99 inhibits neural differentiation of human Ewing
sarcoma cells and thereby contributes to oncogenesis. J Clin
Invest. 120:668–680. 2010. View
Article : Google Scholar : PubMed/NCBI
|
|
18
|
Herreño AM, Fernández MJ, Rey L, Mejia JA,
Cañas A, Moreno OM, Henríquez B, Montecino MA and Rojas AP: Primary
lung cancer cell culture from transthoracic needle biopsy samples.
Cogent Med. 5:12018. View Article : Google Scholar :
|
|
19
|
Vural C, Uluoğlu O, Akyürek N, Oğuz A and
Karadeniz C: The evaluation of CD99 immunoreactivity and EWS/FLI1
translocation by fluorescence in situ hybridization in central
PNETs and Ewing's sarcoma family of tumors. Pathol Oncol Res.
17:619–625. 2011. View Article : Google Scholar : PubMed/NCBI
|
|
20
|
Moorhead PS, Nowell PC, Mellman WJ,
Battips DM and Hungerford DA: Chromosome preparations of leukocytes
cultured from human peripheral blood. Exp Cell Res. 20:613–616.
1960. View Article : Google Scholar : PubMed/NCBI
|
|
21
|
McGowan-Jordan J, Simons A and Schmid M:
ISCN 2016. An International System for Human Cytogenomic
Nomenclature (2016). Karger; Basel: 2016, View Article : Google Scholar
|
|
22
|
Elzi DJ, Song M, Houghton PJ, Chen Y and
Shiio Y: The role of FLI-1-EWS, a fusion gene reciprocal to
EWS-FLI-1, in Ewing sarcoma. Genes Cancer. 6:452–461.
2015.PubMed/NCBI
|
|
23
|
Przybyl J, Kozak K, Kosela H, Falkowski S,
Switaj T, Lugowska I, Szumera-Cieckiewicz A, Ptaszynski K,
Grygalewicz B, Chechlinska M, et al: Gene expression profiling of
peripheral blood cells: New insights into Ewing sarcoma biology and
clinical applications. Med Oncol. 31:1092014. View Article : Google Scholar : PubMed/NCBI
|
|
24
|
Abcam (2011). A-beginners-guide-to-ChIP.
Available at. http://docs.abcam.com/pdf/chromatin/A-beginners-guide-to-ChIP.pdfJan
22–2018
|
|
25
|
Jacques C, Lamoureux F, Baud'huin M,
Rodriguez Calleja L, Quillard T, Amiaud J, Tirode F, Rédini F,
Bradner JE, Heymann D and Ory B: Targeting the epigenetic readers
in Ewing Sarcoma inhibits the oncogenic transcription factor
EWS/Fli1. Oncotarget. 7:24125–24140. 2016. View Article : Google Scholar : PubMed/NCBI
|
|
26
|
Haring M, Offermann S, Danker T, Horst I,
Peterhansel C and Stam M: Chromatin immunoprecipitation:
Optimization, quantitative analysis and data normalization. Plant
Methods. 3:112007. View Article : Google Scholar : PubMed/NCBI
|