Introduction
Acute myeloid leukemia (AML) is the most common
myeloid malignancy in adults, and is considered to be the result of
several genetic aberrations leading to irreversible dysregulation
of genes critical for proliferation, differentiation and apoptosis
(1). These genetic alterations are
used by clinicians for both the diagnosis and prognosis of AML
(2). Internal tandem duplications
(ITD) or kinase domain mutations of FMS-like tyrosine kinase 3
(FLT3) represent the most frequent genetic alterations, occurring
in ~30% of cases and being associated with poor disease outcome
(3). Reports indicate that the
FLT3-ITD mutation shifts the metabolism of glucose from oxidative
phosphorylation towards aerobic glycolysis, also known as the
Warburg effect, and increases the resistance of AML cells to
chemotherapy (4,5), making aerobic glycolysis a potential
therapeutic target for FLT3-ITD AML cells (6).
Melatonin is a natural indoleamine with diverse
antitumoral properties (7). It
inhibits the proliferation of most types of tumor, but only kills
certain specific tumor types, such as Ewing sarcoma or
hematological malignancies (8).
Several mechanisms have been proposed for the antiproliferative
effects of melatonin, but mechanisms underlying the proapoptotic
effects of melatonin remain to be completely unraveled. The
regulation of tumor cell metabolism has received increasing
attention in relation to this; studies have demonstrated the
ability of this indoleamine to regulate several metabolic pathways,
mainly glycolysis and lipid metabolism (9–11).
The present study aimed to evaluate the hypothesis
that melatonin specifically kills tumor cells with an altered
glucose metabolism, using AML cells with or without the FLT-ITD
mutation.
Materials and methods
Cell culture and reagents
MV-4–11 (FLT3-ITD), MOLM-13 (FLT3-ITD), U-937
[wild-type (wt)] and OCI-AML3 (wt) cell lines were purchased from
the Leibniz Institute GSMZ-German Collection of Microorganisms and
Cell Cultures GmbH and aliquoted to prevent phenotypic drift once
received. Cells were maintained in RPMI supplemented with 10% fetal
bovine serum (FBS) and 1% antibiotic-antimycotic mixture containing
5,000 U/ml penicillin and 5,000 U/ml streptomycin at 37°C in a
humidified atmosphere of 5% CO2. Culture cells have been
monitored to ensure that they are mycoplasma-free using a
LookOut® mycoplasma quantitative (q)PCR detection kit
(Sigma-Aldrich; Merck KGaA). All experiments were performed between
passage 5 and 20. Cell culture reagents were purchased from
Sigma-Aldrich (Merck KGaA) except for FBS, which was obtained from
Gibco (Thermo Fisher Scientific, Inc.). Culture flasks and dishes
were acquired from Thermo Fisher Scientific, Inc. The primary
antibodies used for western blotting were hydroxylated
hypoxia-inducible factor (HIF)1α (1:1,000; cat. no. 3434; Cell
Signaling Technology, Inc.), phosphorylated (p)-mTOR (1:1,000; cat.
no. 2976; Cell Signaling Technology, Inc.), p-S6 (1:1,000; cat. no.
5364; Cell Signaling Technology, Inc.), p-AKT (1:1,000; cat. no.
9271; Cell Signaling Technology, Inc.), p-STAT5 (1:1,000; cat. no.
9314; Cell Signaling Technology, Inc.), dihydrolipoamide
dehydrogenase (DLD; 1:250; cat. no. ab182146; Abcam),
hexose-6-phosphate dehydrogenase (H6PD; 1:500; cat. no. ab72183;
Abcam), phosphoenolpyruvate carboxykinase 2 (PCK2; 1:1,000; cat.
no. ab70359; Abcam) and GAPDH (1:5,000; cat. no. sc-47724; Santa
Cruz Biotechnology, Inc.). EC-70124 was provided by EntreChem, S.L.
Melatonin (cat. no. M5250) and mitochondrial complex I inhibitor
rotenone (cat. no. R8875) were purchased from Sigma-Aldrich (Merck
KGaA), while hexokinase II inhibitor 3-bromopyruvate (3-BrPA; cat.
no. sc-260854), and PCK2 inhibitor 3-mercaptopicolinic acid (3-MP;
cat. no. sc-206655) were purchased from Santa Cruz Biotechnology,
Inc.
Evaluation of cell proliferation and
cell viability
Cell viability was evaluated using an MTT reduction
assay. Cells were seeded onto 96-well plates at a density of 5,000
cells/ml and treated with increasing melatonin concentrations
(100-1,000 µM) for 48 h. Once the treatments were completed, 10 µl
MTT solution diluted in PBS (5 mg/ml) was added. After 4 h of
incubation at 37°C, one volume of the lysis solution [SDS (20%) and
dimethylformamide pH 4.7 (50%)] was added and the mixture was
incubated at 37°C overnight. Samples were measured using an
automatic microplate reader (µQuant; Bio-Tek Instruments, Inc.) at
a wavelength of 540 nm.
For cell death evaluation, propidium iodide (PI) was
used. It is a membrane-impermeant fluorescence dye that cannot
enter the cells unless there are membrane breaks. Thus, dead cells
can be determined as cells with PI uptake. Cells were seeded onto
6-well plates at a density of 5,000 cells/ml and treated with 1 mM
melatonin, 5 µM 3-BrPA or 500 nM rotenone for 48 h. For combination
experiments, 250 µM 3-MP or 10 mM glucose were added at the same
time as melatonin. Once the treatment was completed, cells were
harvested and resuspended in 500 µl of PBS. PI staining solution
(10 µl; 10 µg/ml in PBS) was added at room temperature for 10 min
and the fluorescence of 10,000 cells/group was measured in a
Beckman Coulter FC500 flow cytometer (Beckman Coulter, Inc.). Data
was analyzed using Flowing Software v2.5 (http://flowingsoftware.btk.fi/).
Measurement of glucose uptake activity
using 2-NBDG
Glucose uptake activity was measured using a
fluorescent D-glucose analogue 2-NBDG. Cells were seeded in 96-well
plates at a density of 5,000 cells/ml and treated with 1 mM
melatonin or 10 nM EC-70124 for 8 h. After treatment, cells were
washed with PBS and incubated with 10 µM 2-NBDG at 37°C for 35 min.
Fluorescence was measured in an FLX-800 microplate fluorimeter
(Bio-Tek Instruments, Inc.) at an excitation wavelength of 467 nm
and an emission wavelength of 542 nm.
Measurement of lactate dehydrogenase
(LDH) activity
For this assay, cells were seeded onto 24-well
plates at a density of 5.000 cells/ml. Determination of total LDH
activity was performed after 24 h treatment with 1 mM melatonin or
10 nM EC-70124 according to the specifications of a Lactate
Dehydrogenase Activity Assay kit (cat. no. MAK066; Sigma-Aldrich;
Merck KGaA). Absorbance was determined using a µQuant automatic
microplate reader at 490 nm and enzyme activity was related to
protein content on each sample.
Measurement of intracellular lactate
levels
Cells were seeded in 150-mm plates at a density of
5.000 cells/ml. After 24 h treatment with 1 mM melatonin or 10 nM
EC-70124, the lactate concentration was determined using a Lactate
Assay kit (cat. no. MAK064; Sigma-Aldrich; Merck KGaA) according to
the manufacturer's protocol. Absorbance was measured at 570 nm
using a µQuant automatic microplate reader.
Assessment of apoptosis by flow
cytometry
Apoptosis was evaluated using an Annexin V-FITC
Apoptosis Detection kit (cat. no. APOAF; Sigma-Aldrich; Merck KGaA)
according to the manufacturer's protocols. Briefly, cells were
seeded in 6-well plates at a density of 5.000 cells/ml and treated
with 1 mM melatonin for 24 h. Once the treatment was completed,
cells were harvested and resuspended in 500 µl of 1X binding
buffer. Annexin V-FITC conjugate (5 µl; 50 µg/ml) and 10 µl PI
solution (100 µg/ml) were added to each cell suspension and after
10 min of incubation, the apoptosis percentage was determined in
10,000 cells/group using a Beckman Coulter FC500 flow cytometer.
Data was analyzed using Flowing Software v2.5 and represented as
the sum of early apoptotic cells (PI-negative, Annexin V-positive
cells) + late apoptotic cells (PI-positive, Annexin V-positive
cells).
Caspase-3 activity
To measure the activation of caspase-3, a
fluorometric caspase-3 assay kit (cat. no. CASP3F; Sigma-Aldrich;
Merck KGaA) was used according to the manufacturer's protocols.
Briefly, cells were seeded in 100 mm plates at a density of 5.000
cells/ml and treated with 1 mM melatonin for 24 h. Once the
treatment was completed, cells were harvested and processed
according to manufacturer's protocol. After 2 h of incubation of
the reaction mixture at room temperature in darkness, samples were
analyzed in an FLX-800 microplate fluorimeter at an excitation
wavelength of 360 nm and an emission wavelength of 460 nm.
RT2 Profiler™ PCR Array
screening
Cells were seeded in 100 mm plates at a density of
5.000 cells/ml and treated with 1 mM melatonin for 8 h. Total
cellular RNA was extracted using a GenElute Mammalian Total RNA
Miniprep Kit (Sigma-Aldrich; Merck KGaA) and reverse transcription
was conducted using a High Capacity cDNA Reverse Transcription Kit
(Applied Biosystems; Thermo Fisher Scientific, Inc.) according to
the manufacturer's protocol. The RT2 Profiler PCR Array
screening of 84 glucose metabolism genes (cat. no. PAHS-006Z;
SABiosciences Corporation; Qiagen, Inc.) was performed via qPCR
using Green PCR Core Reagents (Applied Biosystems; Thermo Fisher
Scientific, Inc.) in an AB7700 Real-Time System (Applied
Biosystems; Thermo Fisher Scientific, Inc.). Thermal cycling
parameters were 95°C for 10 min, followed by 40 cycles of
amplification at 95°C for 15 sec, 55°C for 30 sec and 72°C for 30
sec, with a final elongation step at 72°C for 5 min. Data analysis
of relative levels of mRNA expression was based on the ΔΔCq method
(12), with normalization of the
raw data to housekeeping genes included in the array (β-actin,
β-2-microglobulin, GAPDH, hypoxanthine phosphoribosyltransferase
and ribosomal protein) using the web-based software GeneGlobe Data
Analysis Center (Qiagen, Inc.).
Western blot analysis
For protein expression analysis, cells were seeded
on 100-mm plates and treated with 1 mM melatonin for 8 or 24 h.
After treatments, cells were lysed with ice-cold lysis buffer (150
mM NaCl, 1 mM EDTA, 1 mM EGTA, 1% v/v Triton X-100, 2.5 mM sodium
pyrophosphate, 1 mM β-glycerophosphate, 1 mM
Na3VO4, 1 µg/ml leupeptin, 2 µg/ml aprotinin,
1 µg/ml pepstatin-A, 110 nM NaF, 1 mM PMSF, 20 mM Tris-HCl pH 7.5).
Protein concentration was determined using Pierce™ 660 nm protein
assay reagent (cat. no. 10177723; Pierce; Thermo Fisher Scientific,
Inc.) and 30 µg were separated by 10% SDS-PAGE and transferred to
polyvinylidene difluoride membranes (Amersham; GE Healthcare).
Blots were blocked using Pierce Clear Milk Blocking Buffer (cat.
no. 13494209; Pierce; Thermo Fisher Scientific, Inc.) for 1 h at
room temperature and incubated overnight at 4°C with appropriate
primary antibodies. Immunoreactive polypeptides were visualized
using horseradish peroxidase-conjugated anti-rabbit IgG secondary
antibodies (1:4,000; cat. no. sc-2357; Santa Cruz Biotechnology,
Inc.) and enhanced chemiluminescence detection reagents (Amersham;
GE Healthcare) according to the manufacturer's protocols.
In vivo xenograft assays
Female immunodeficient mice were purchased from
Janvier Labs (CB17 SCID, 5 weeks old, weight range 19.05±0.3 g) and
maintained under sterile and controlled conditions (25°C, 60%
humidity, 12/12 light/dark cycle) with food and water ad
libitum. All animal research protocols were approved by the
Animal Research Ethical Committee of the University of Oviedo
(permit no. PROAE 14/2017).
In order to evaluate tumor growth, MOLM-13
(FLT3-ITD) cells (5×10⁶ cells with 25% Matrigel) were
injected subcutaneously into the right flank of CB17 SCID mice.
Alternatively, in order to evaluate animal survival,
2×10⁶ cells were injected into the tail veins of CB17
SCID mice. At 10 days after injection, animals were randomized in
the different experimental groups of 10 mice/group in both animal
models (subcutaneous or intravenous) and melatonin administration
via drinking water was initiated (10 mM melatonin as final
concentration in the drinking water). Indolamine administration was
well tolerated by all mice, as no significant weight loss was
detected (data not shown). The greatest longitudinal diameter
(length) and the greatest transverse diameter (width) were measured
by an external caliper every other day. Tumor volumes based on
caliper measurements were calculated by the modified ellipsoidal
formula [tumor volume=1/2 × (length × width2)]. Animals
were sacrificed using CO2 once the tumor volume reached
2,000 mm3.
Statistical analysis
Results are presented as the mean ± SEM of at least
three independent experiments. Significance was tested by one-way
ANOVA followed by Tukey test for multiple groups comparison,
unpaired t-tests when only two groups are compared or two-way ANOVA
followed by Bonferroni test when different drug concentrations in
different cell types are compared. P≤0.05 was considered to
indicate a statistically significant difference. The in vivo
survival graphs were generated using the Kaplan-Meier method, with
P-values determined using the log-rank test.
Results and Discussion
Melatonin is toxic specifically in AML
cells carrying the FLT3-ITD mutation
Melatonin has exhibited antitumoral properties in
various hematological malignancies, including AML (8). However, none of these studies have
analyzed in detail the effects of melatonin on AML in relation to
prognostic factors. Several gene mutations have been identified as
leukemia risk factors, with FLT3 the most frequent site of genetic
alterations associated with poor disease outcome (3). Two wt AML cell lines (OCI-AML3 and
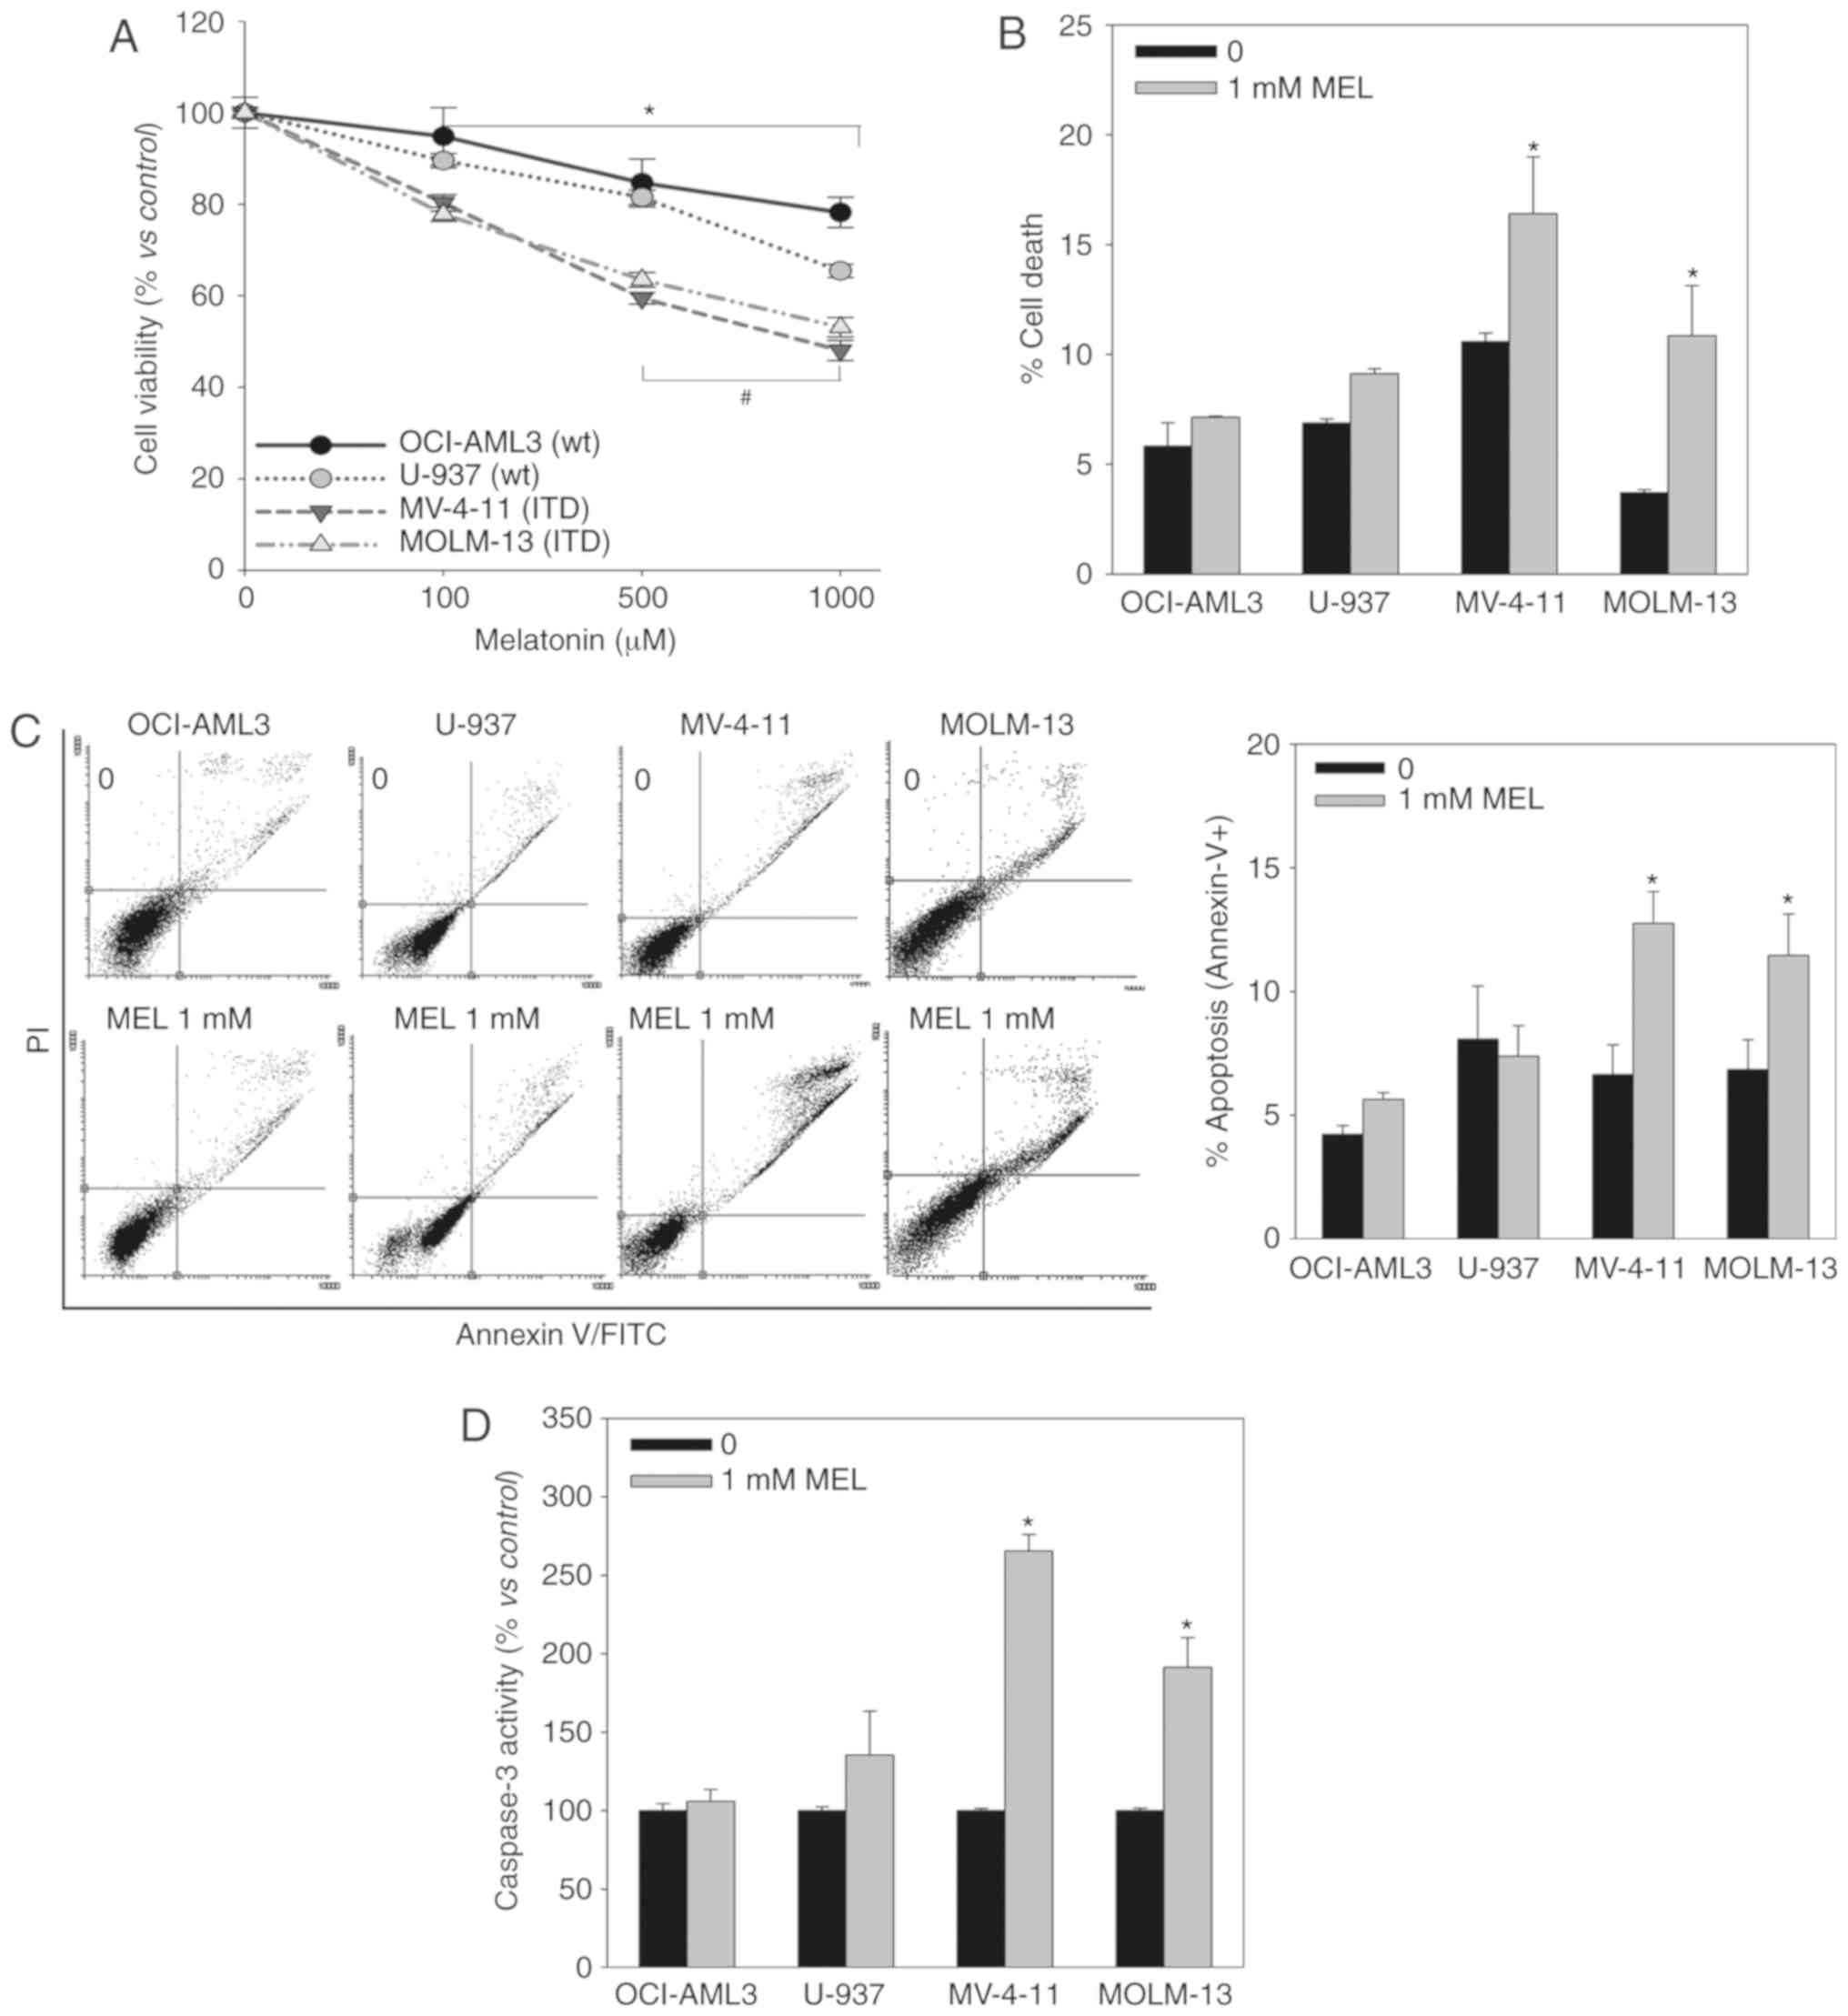
U-937) and two FLT3-ITD AML cell lines (MV-4-11 and MOLM-13) were
incubated with melatonin (0.1–1 mM) for 48 h, and the proportion of
viable cells was determined using an MTT assay (Fig. 1A). Melatonin induced a
dose-dependent decrease in cell viability in all cell lines,
although it exhibited a greater effect in FLT3-ITD mutant
cells.
Melatonin can decrease the proportion of viable
cells by inhibiting proliferation or inducing cell death, and the
MTT assay does not allow to distinguish between these phenomena. PI
staining (Fig. 1B), Annexin V
staining (Fig. 1C) and Caspase-3
activity (Fig. 1D) assays indicated
that melatonin only induces cell death in FLT3-ITD mutant cells,
and that it kills these particular AML cells by apoptosis.
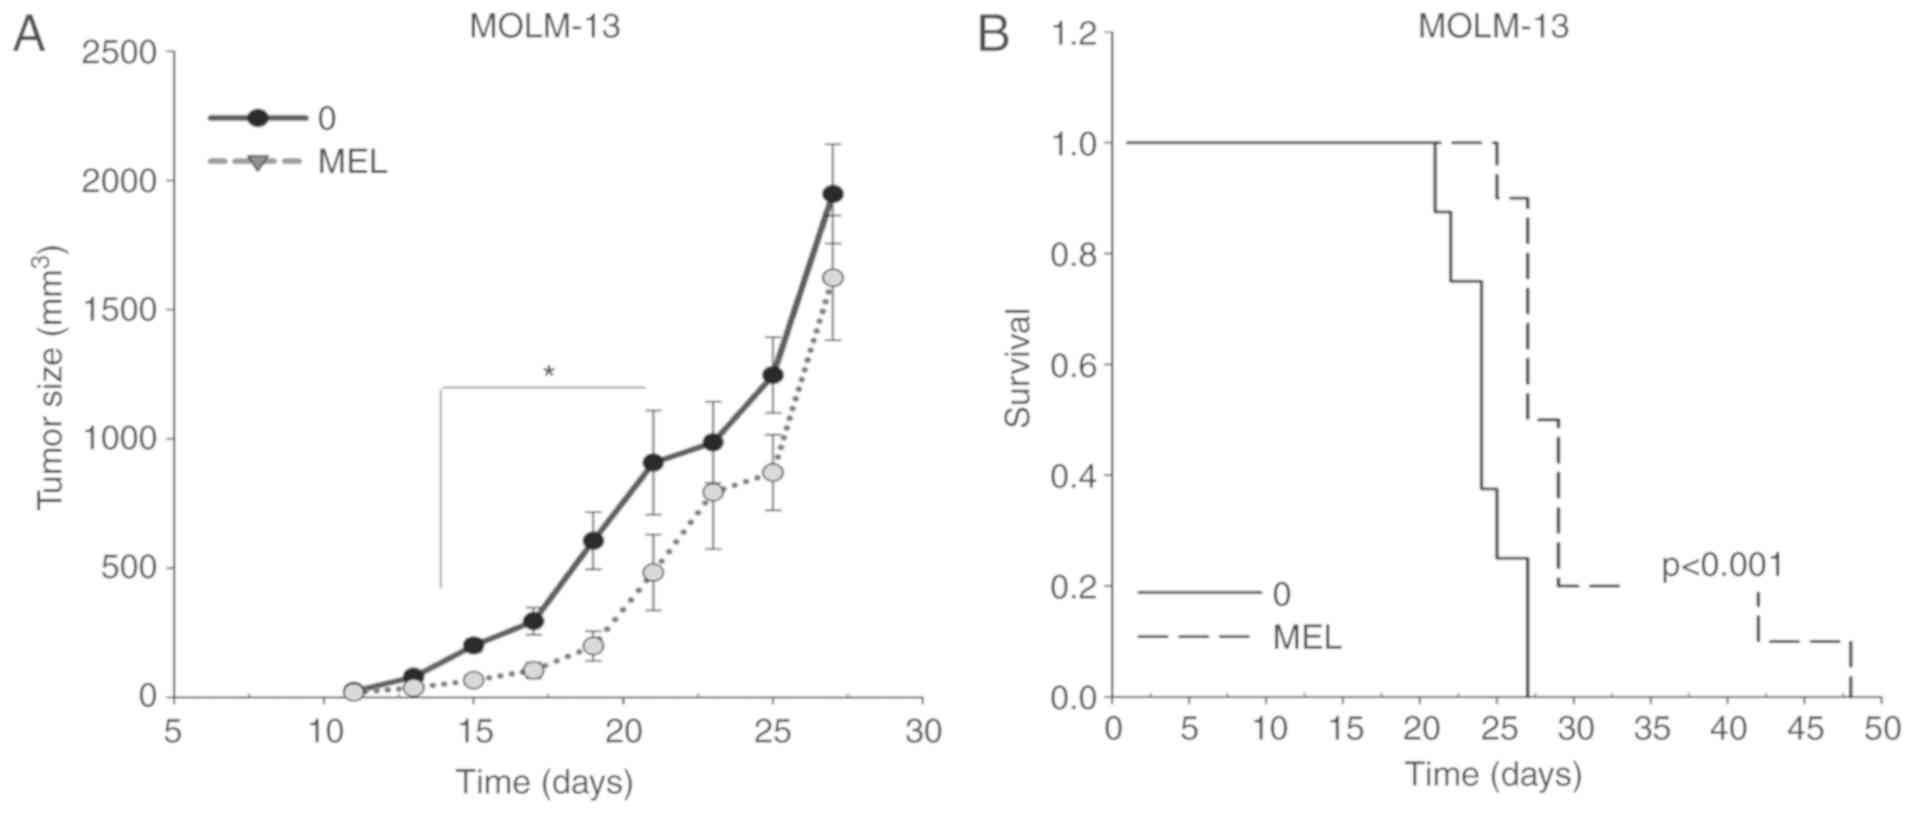
The antitumoral activity of melatonin was further
evaluated in a MOLM-13 ×enograft model in vivo. A
significant decrease in tumor volume was observed upon treatment
with melatonin, starting at day 15 after tumor implantation
(Fig. 2A). Moreover, the
antitumoral activity of melatonin in MOLM-13 FLT3-ITD cells was
associated with a significant increase in survival time (Fig. 2B), with an average survival of
24±0.8 days in the control group and 31±2.4 days in the
melatonin-treated group. Altogether, the present findings indicated
that melatonin specifically kills FLT3-ITD AML cells.
Melatonin cytotoxicity is associated
with reliance on the Warburg effect in AML cells
Tumor cells can obtain their energy from oxidative
phosphorylation, in the same manner as physiological cells, or they
can exhibit a metabolic adaptation via which they metabolize
glucose fundamentally to lactate even in the presence of oxygen
(the Warburg effect) (13). Our
previous study demonstrated that the specificity of melatonin
toxicity in certain Ewing's sarcoma cell lines was related to their
metabolic profiles, namely whether their glucose metabolism relies
on oxidative phosphorylation or the Warburg effect (11).
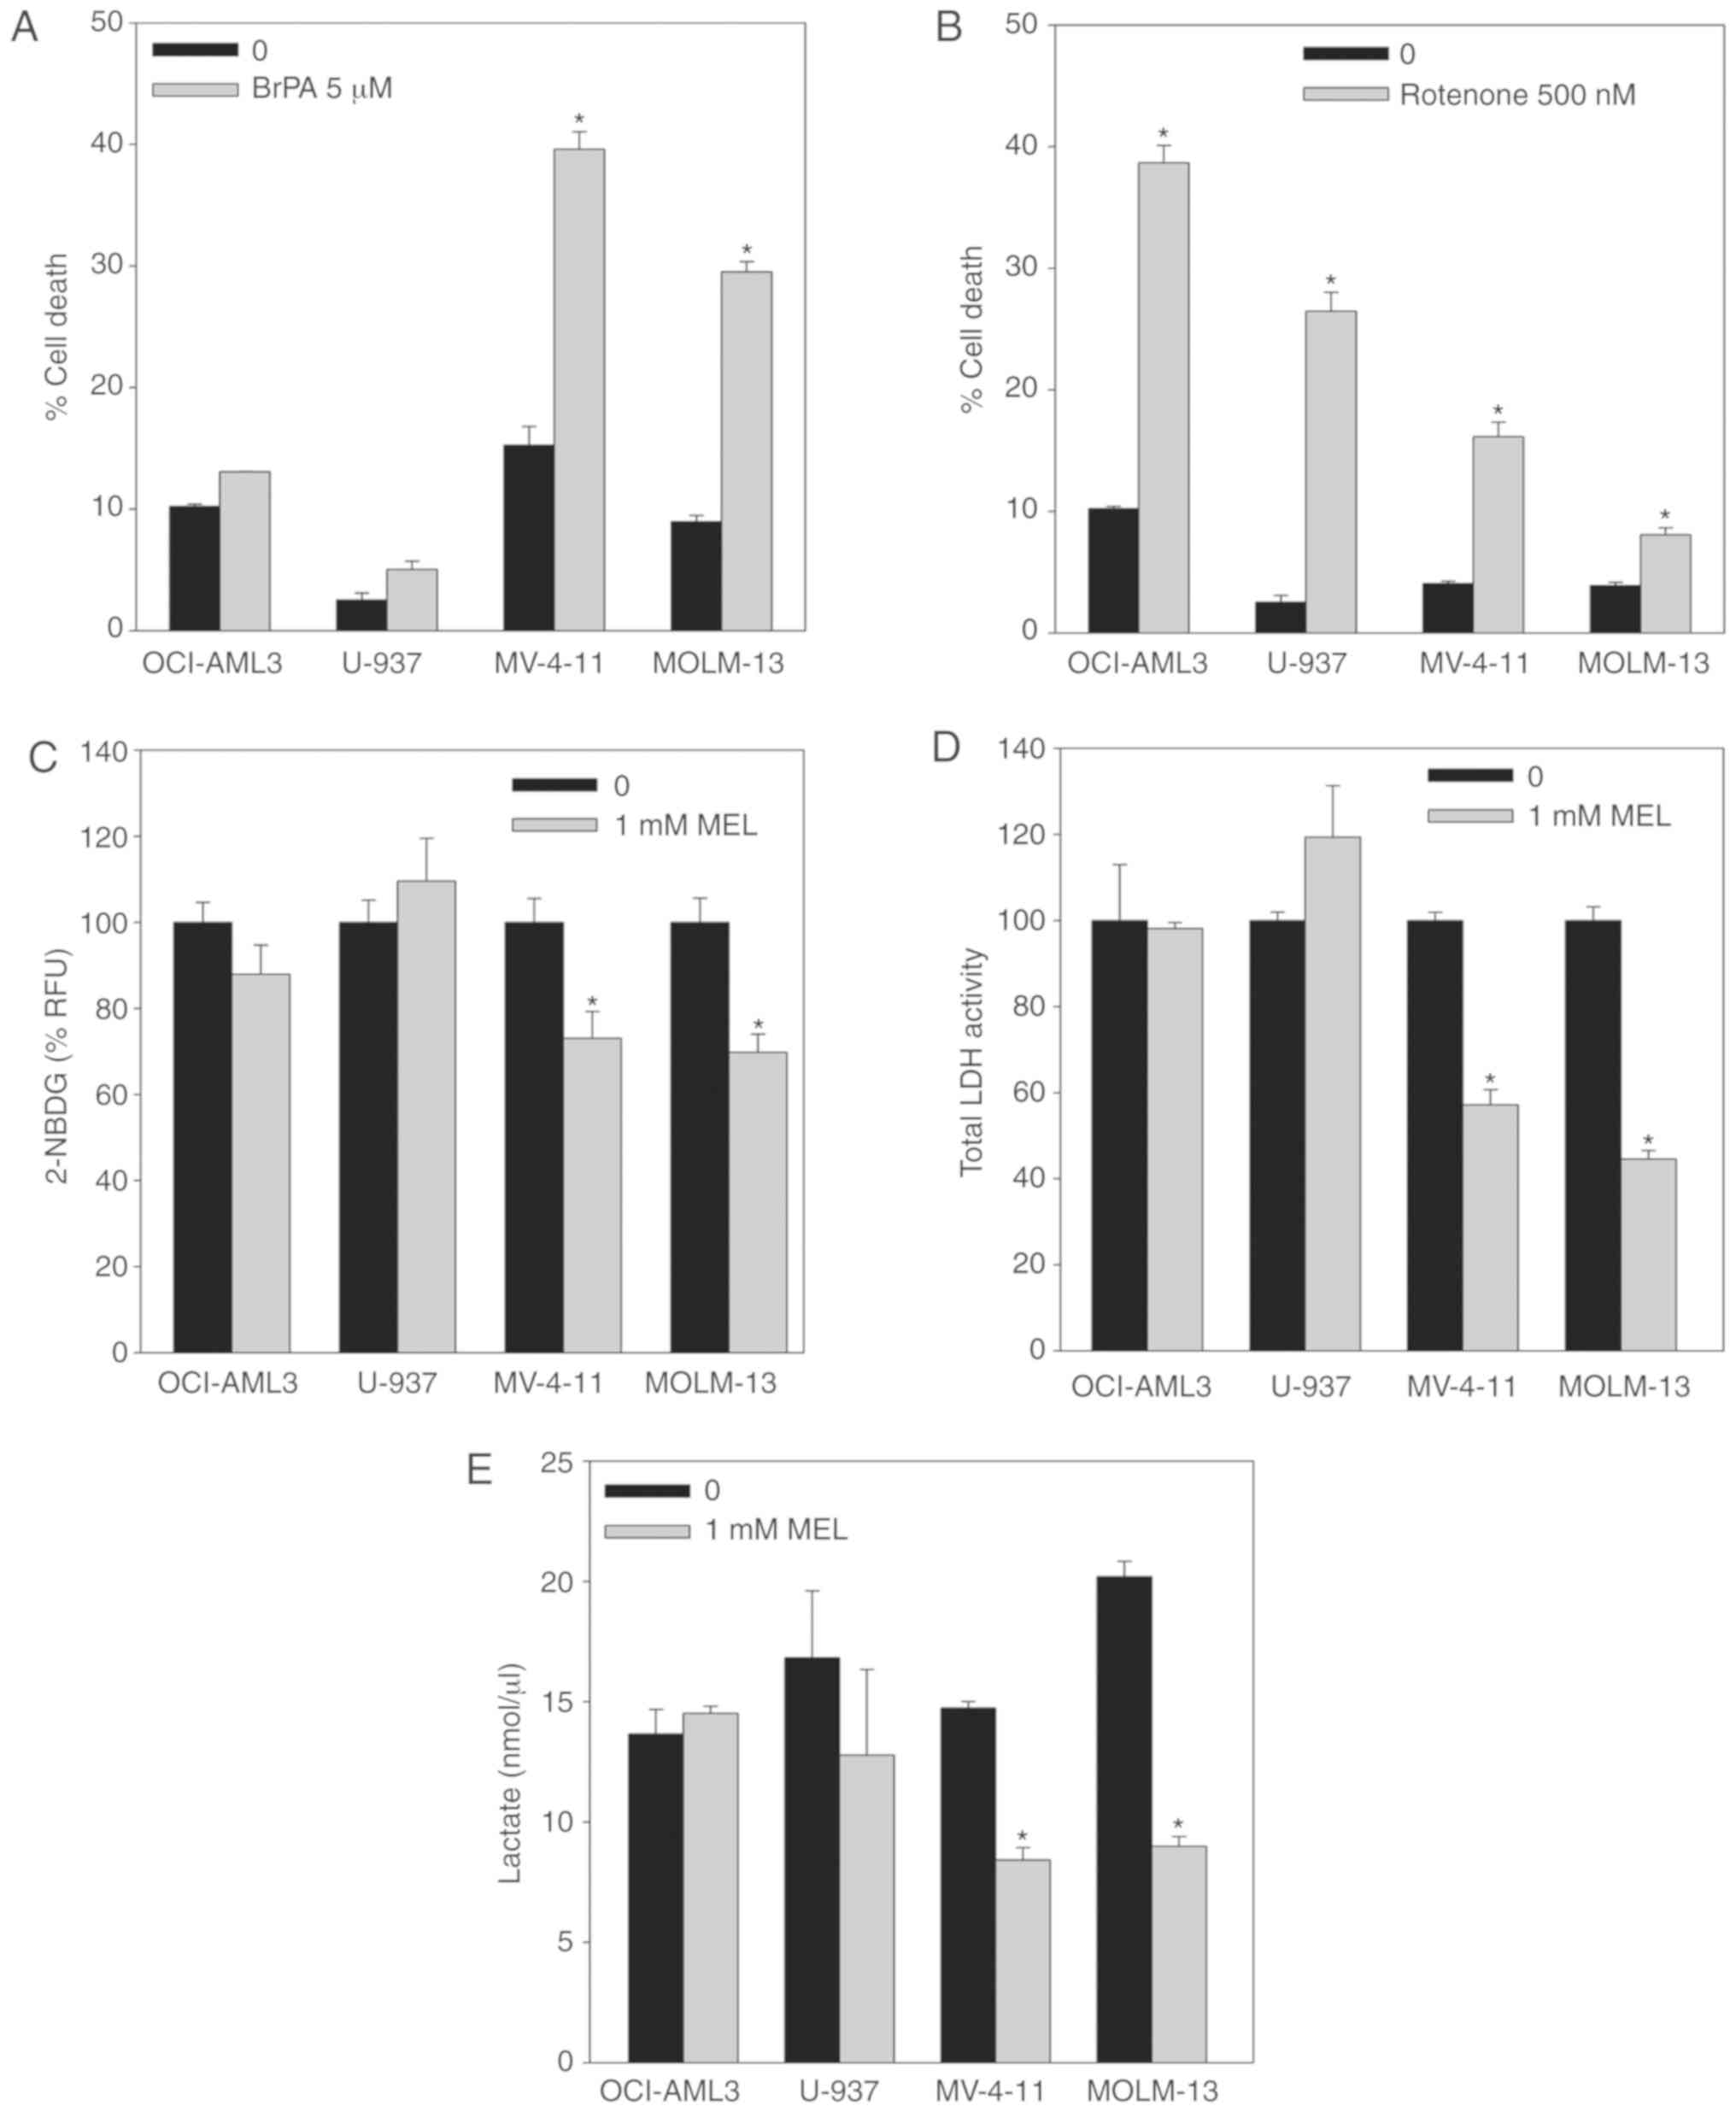
As previously described for Ewing sarcoma cells,
FLT3-ITD AML cells presented a higher dependency on aerobic
glycolysis (Fig. 3A and B).
Inhibition of hexokinase II by means of 3-BrPA (5 µM) incubation
for 48 h resulted in a higher induction of cell death in MV-4-11
and MOLM-13 mutant cells than U-937 and OCI-AML3 wt cells (Fig. 3A). Conversely, inhibition of
mitochondrial complex I by incubation with rotenone (500 nM) for 48
h had less effect on the viability of FLT3-ITD cells compared with
wt cells (Fig. 3B). These results
indicated that the FLT3-ITD mutation renders AML cells more
dependent on the Warburg effect than on oxidative phosphorylation
as their energy supply, consistent with a previous independent
study (5).
Melatonin inhibits key signaling and
metabolic pathways controlling aerobic glycolysis only in FLT-ITD
AML cells
The Warburg effect is characterized by an increased
uptake of glucose, which in turn is rapidly metabolized to lactate
instead of entering the Krebs cycle and undergoing oxidative
phosphorylation (13). Melatonin
induced a significant decrease in glucose uptake (measured using
the fluorescent D-glucose analogue 2-NBDG) only in FLT3-ITD cells
after 8 h of incubation (Fig. 3C).
Additionally, LDH activity (Fig.
3D) and intracellular lactate levels (Fig. 3E) were significantly reduced in
mutant cells after treatment with melatonin for 24 h, while no
changes in any of these two parameters were observed in U-937 and
OCI-AML3 wt cells. These results indicated that FLT3-ITD cells
relied more on aerobic glycolysis to obtain energy than non-mutant
AML cells, suggesting that melatonin partially blocks aerobic
glycolysis in these cells.
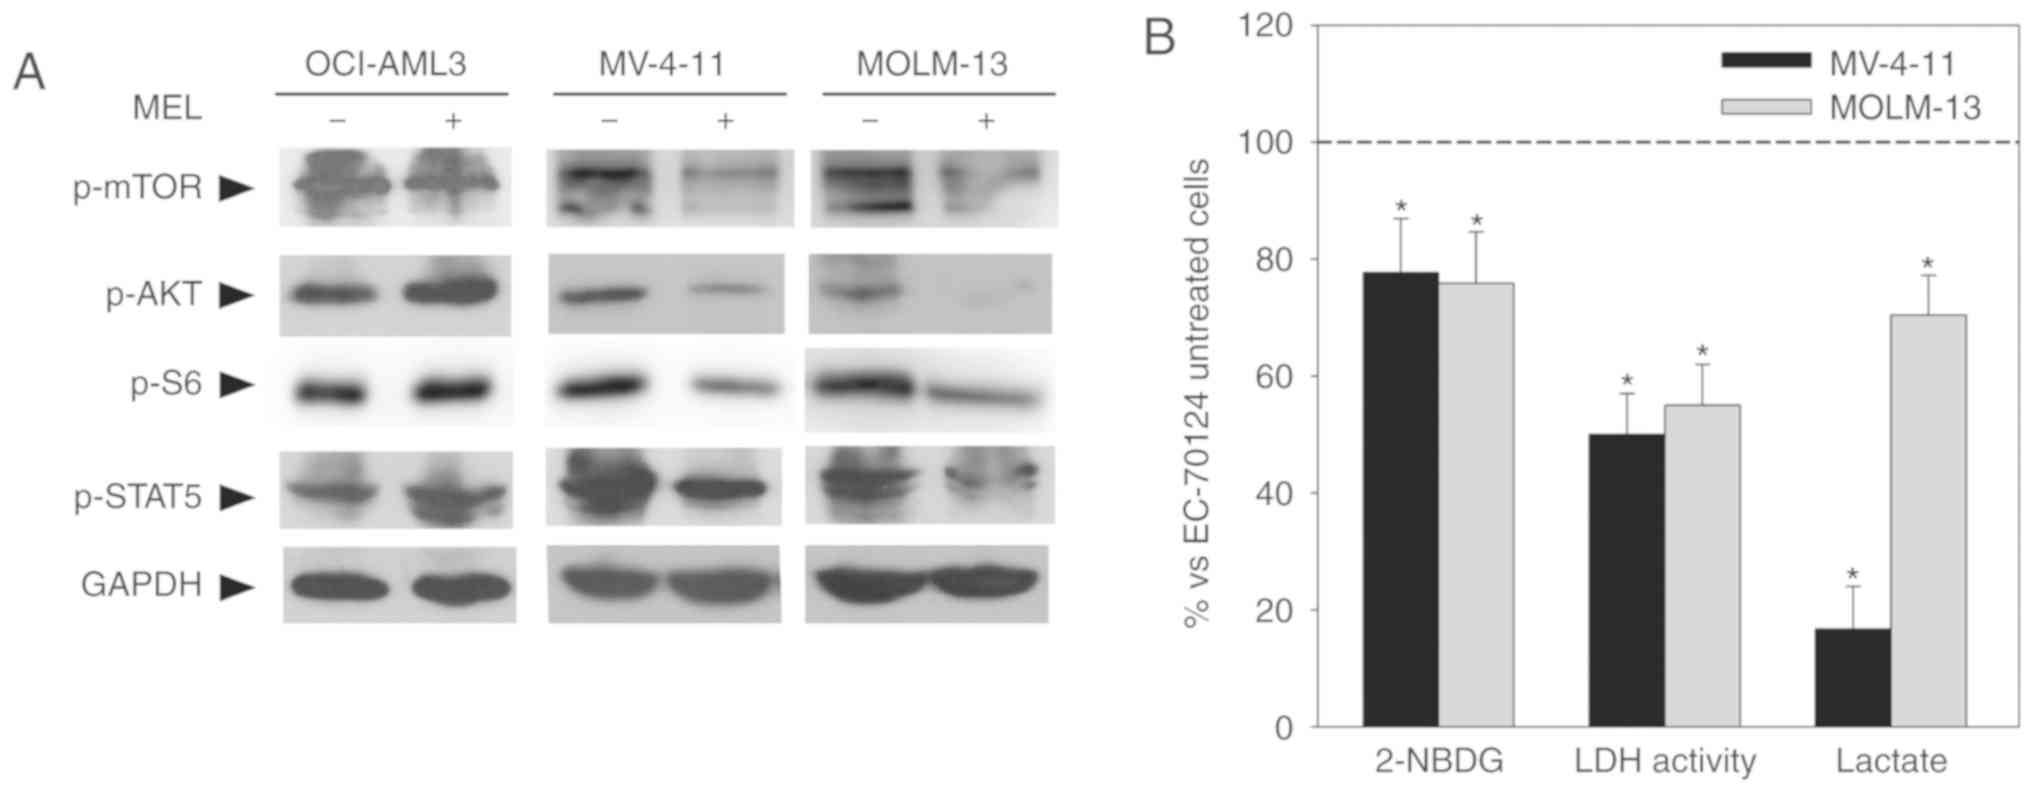
Differences found in the effects of melatonin on wt
cells compared with mutant cells suggested the possibility that
melatonin regulated receptor-mediated intracellular pathways. This
signaling includes activation of downstream prosurvival effectors
such as JAK/STAT5 and PI3K/AKT/mTOR (14); previous studies have shown that
melatonin regulates this pathway in other types of tumor (15,16).
Western blot analysis demonstrated that melatonin inhibits these
pathways as determined by decreased levels of p-STAT5, p-AKT and
p-mTOR/p-S6 only in FLT3-ITD cells (Fig. 4A). As a role for FLT3-ITD signaling
in the shift of glucose metabolism from oxidative phosphorylation
towards aerobic glycolysis has been recently described (5), the regulation of this intracellular
signaling by melatonin could be responsible for its effects on
glucose metabolism in FLT3-ITD cells. Supporting this hypothesis,
treatment of mutant cells with the FLT3-ITD inhibitor EC-70124 (10
nM) (17) resulted in a decrease in
glucose uptake after 8 h of treatment, and LDH activity and lactate
production after 24 h of treatment (Fig. 4B), similar to the effects of
melatonin.
Although several intracellular pathways can regulate
aerobic glycolysis, transcription factor HIF1α has been described
as the master regulator of the Warburg effect (18). In normal cells, this transcription
factor is regulated by oxygen levels and activated under hypoxia;
however, in tumor cells, HIF1α can be activated by oncogenic
signals independently of oxygen levels, such as the PI3K/AKT/mTOR
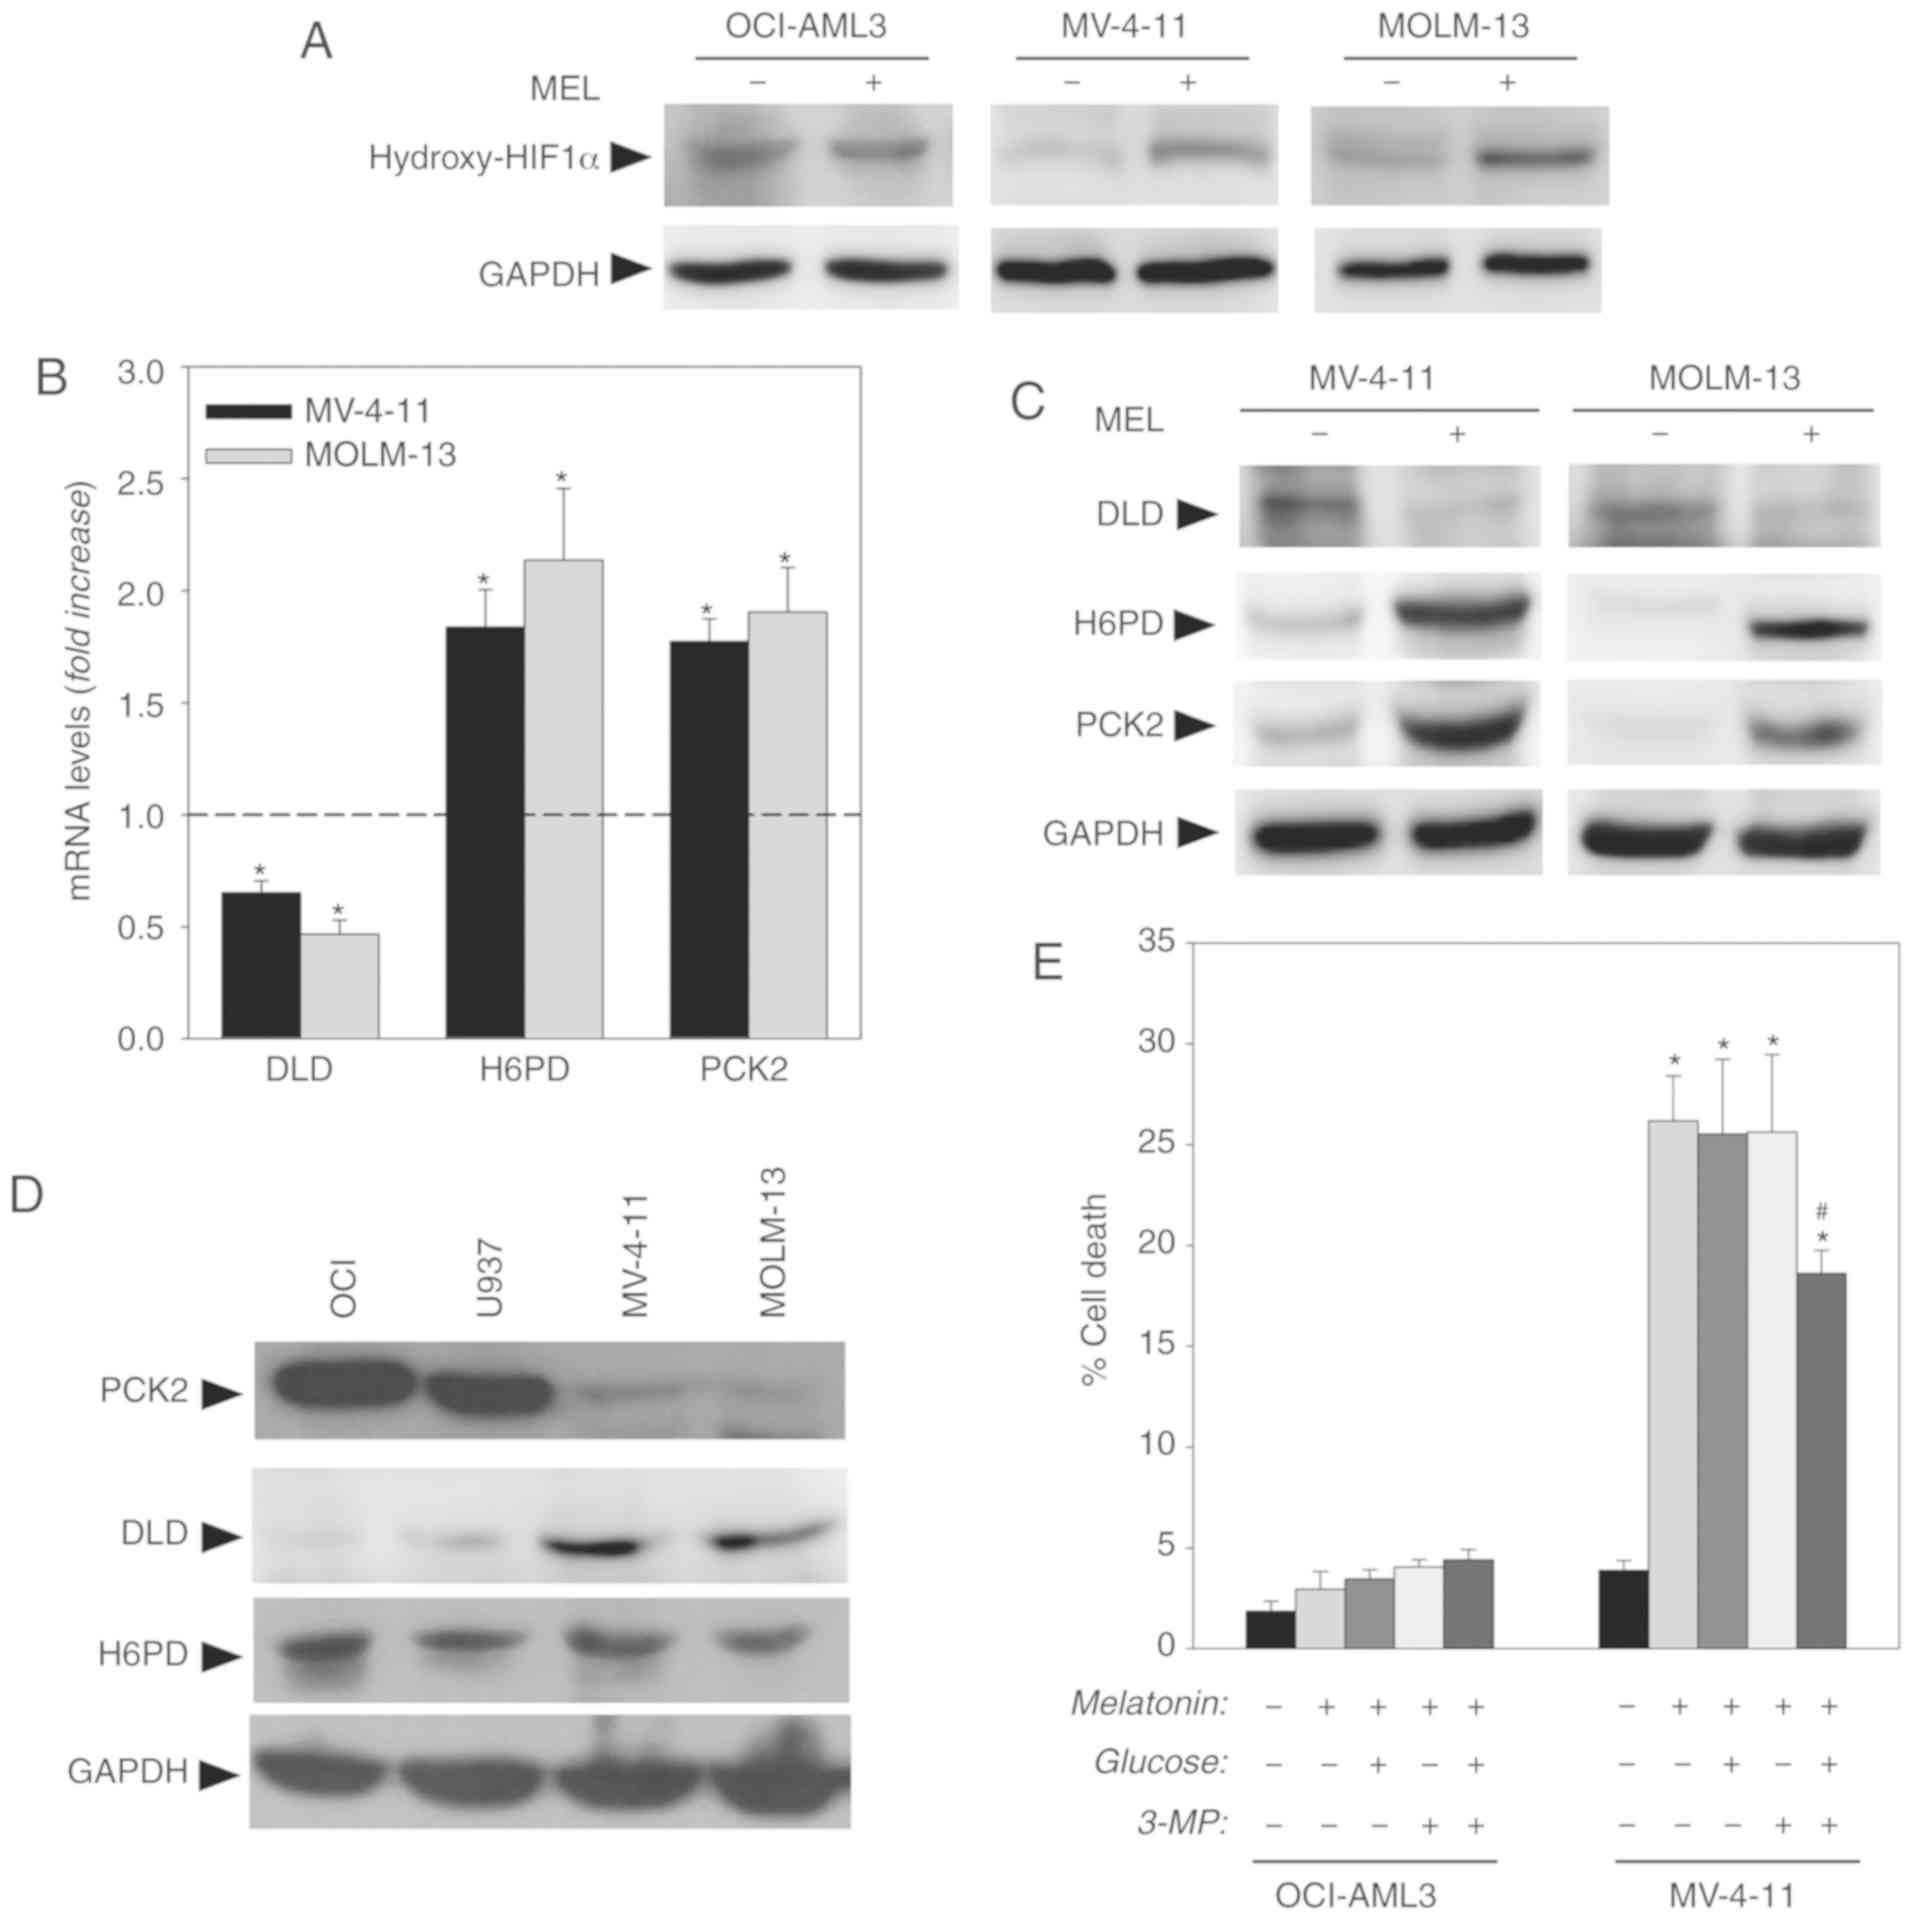
signaling pathway (19). As shown
in Fig. 5A, melatonin induced a
significant increase in the hydroxylated (inactive) form of HIF1α
in MV-4-11 and MOLM-13 FLT3-ITD, cells while no changes were found
in OCI-AML3 wt cells. The inhibition of the PI3K/AKT/mTOR pathway
observed in FLT3-ITD cells is consistent with the inactivation of
HIF1α.
HIF1α regulates a large number of enzymes involved
in aerobic glycolysis (18).
However, evaluation of the expression levels of various genes
involved in glucose metabolism using an reverse transcription-PCR
array showed that melatonin only induced a significant decrease in
DLD mRNA levels, and an increase in H6PD and PCK2 mRNA levels in
FLT3-ITD AML cells (Fig. 5B). These
results were confirmed by western blotting with antibodies against
these proteins in the presence or absence of melatonin (Fig. 5C). These results indicated that
melatonin altered tumor glucose metabolism in AML mutant cells,
potentially in search of new routes to obtain energy and
intermediate metabolites necessary for survival and proliferation.
Consistent with this, it has been reported that, at least in tumor
cells, the activity of H6PD could contribute to the complete
conversion of glucose into water and CO2 at the
endoplasmic reticulum (ER) (20).
Moreover, H6PD produces NADPH in the ER lumen, which constitutes a
cofactor for various reducing enzymes and serves as the ultimate
donor of reductive power for most reactive oxygen species
(ROS)-detoxifying enzymes (21). As
melatonin induction of cell death in numerous cancer cells,
including AML cells, has been associated with an increase in
intracellular ROS (22), the
increased expression of this enzyme could be related to an attempt
to maintain controlled levels of oxidative stress.
Conversely, DLD functions as the E3 component of the
pyruvate dehydrogenase and α-ketoglutarate dehydrogenase complexes,
both of which form part of the tricarboxylic acid (TCA) cycle
(23). Of note, low levels of
α-ketoglutarate can activate HIF1α (19). Thus, a decrease in DLD levels and
subsequent inhibition of the α-ketoglutarate dehydrogenase complex
could account for α-ketoglutarate accumulation and be related to
the observed inactivation of HIF1α. Moreover, both enzymes are
essential not only for TCA cycle progression but also for the
incorporation of TCA intermediates that come from other sources of
carbon, particularly glutamine and gluconeogenic amino acids
(24). In this way, TCA flux is
tightly regulated by the process of replenishing (anaplerosis) and
removal (cataplerosis) of TCA intermediates (24). Thus, decreased DLD expression
induced by melatonin could result not only in an alteration of
progression through the TCA cycle, but also in an imbalance between
anaplerosis and cataplerosis. PCK2 catalyzes the first step and
limiting step of gluconeogenesis, the main process responsible for
cataplerosis that is required to shuttle glycolytic intermediates
into biosynthetic pathways (25).
Although studies of this metabolic pathway in tumors are not
numerous, PCK2 appears to have a dichotomous role depending on the
tumor type, so that it favors survival in tumors that express high
levels of the enzyme, while it is capable of promoting cell death
in those that express low or undetectable levels of the enzyme
(26). Thus, in hepatocarcinoma or
renal cell carcinoma, which express low levels of PCK, metabolic
reprogramming with activation of this enzyme has been reported to
induce tumor death by creating a ‘futile’ cycle between glycolysis
and gluconeogenesis that induces metabolic stress in the cells
leading to the induction of apoptotic cell death (27,28).
Of note, melatonin has been described to be deleterious for both
cancer types (29,30).
Evaluation of basal levels of expression of these
proteins revealed that AML wt cells presented low expression of DLD
and high expression of PCK2, contrary to FLT3-ITD cells that
exhibited high expression of DLD and low levels of PCK2 (Fig. 5D). No changes in basal expression of
H6PD were reported. Differences in the basal levels of expression
of DLD and PCK2 appear to indicate that wt and mutant cells exhibit
distinct anaplerosis/cataplerosis balances. Melatonin treatment in
mutant cells modified the equilibrium, increasing PCK2 expression.
The induction of the enzyme by melatonin could be responsible for
cell death, as occurs in hepatocarcinoma, where the induction of
PCK expression in the absence of glucose leads to the death of
tumor cells (27). In fact, in the
present study, treatment with melatonin induced both reduced
glucose uptake and PCK2 induction. To evaluate this hypothesis,
cells were treated with the PCK2 inhibitor 3-MP (250 µM) along with
a glucose supplement (10 mM). As shown in Fig. 5E, the combination of 3-MP and
glucose was able to prevent, at least partially, the cytotoxic
effect of melatonin on the FLT3-ITD mutant MV-4-11 cells after 48 h
of treatment, without any effect on the wt OCI-AML3 cells, which
indicated that the overexpression of PCK2 would be involved in the
effects of melatonin in these cells.
Blockage of glycolytic metabolism currently
constitutes a major target to prevent cancer growth (31,32),
and glycolysis inhibitors exhibited antitumoral effects on numerous
acute leukemia subtypes, including AML (33). The present findings indicated a
differential effect of melatonin dependent on the presence or
absence of the FLT3-ITD mutation in AML cells. Thus, melatonin
induced cell death in relation to the inhibition of aerobic
glycolysis in FLT3-ITD AML cells that are more dependent on this
metabolic pathway than wt cells. A recent study suggested that
FLT3/ITD promotes aerobic glycolysis in an AKT-dependent manner
(5). The present study indicated
that melatonin is able to inhibit not only AKT but also other
FLT3/ITD downstream targets such as STAT5 only in mutant cells.
Collectively, these findings suggested that melatonin selectivity
may be related to the ability to inhibit FLT3/ITD downstream
signaling. Moreover, treatment of cells with an FLT3/ITD inhibitor
induced similar effects on glucose metabolism to melatonin,
reinforcing the idea of FLT3/ITD downstream signaling inhibition as
responsible for melatonin selectivity. However, as melatonin has
not been described to exhibit kinase inhibitor activity directly,
further studies are required needed to clarify the exact mechanism
by which melatonin is able to regulate these kinases. Nevertheless,
the present findings in AML cells are consistent with our previous
observations in sarcoma cell lines, where melatonin only killed
those dependent on the Warburg effect (11), as well as the already described
regulation of glucose metabolism in prostate cancer cells (34). Data suggested that glucose uptake
and metabolism could be a major target of the indole in cancer
cells. Collectively, the results suggested that melatonin not only
limited the aerobic glycolysis of FLT3-ITD AML cells but also
altered the anaplerosis/cataplerosis equilibrium, inducing
metabolic stress in FLT3-ITD AML cells that can induce apoptotic
cell death. Melatonin should be further evaluated as a possible
therapeutic tool for cancer types relying on the Warburg effect in
general, particularly those that present low levels of
gluconeogenesis, and for those patients with AML carrying the
deleterious FLT3-ITD mutation in particular.
Acknowledgements
Not applicable.
Funding
This study was supported by Ministry of Science and
Innovation (grant no. SAF2014-58468-R) and FICYT grants (grant no
GRUPIN14-081), a FICYT fellowship (grant no. BP13-108), the Project
LISBOA-01-0145-FEDER-007660 (Cellular Structural and Molecular
Microbiology) funded by FEDER funds through COMPETE2020-Programa
Operacional Competitividade e Internacionalização and by national
funds from Fundação para a Ciência e Tecnologia (grant no.
IF/00094/2013/CP1173/CT0005).
Availability of data and materials
The datasets used and/or analyzed during the present
study are available from the corresponding author on reasonable
request.
Authors' contribution
NPM, AMSS, CDO and MTC performed laboratory
experiments. IA, FH and JRB conceived and designed the study, and
interpreted the data. VM and CR contributed to the conception and
design of the study, interpretation of the data and writing of the
manuscript. All authors read and approved the final manuscript.
Ethics approval and consent to
participate
All animal research protocols were approved by the
Animal Research Ethical Committee of the University of Oviedo.
Patient consent for publication
Not applicable.
Competing interests
The authors declare that they have no competing
interests.
References
|
1
|
Döhner H, Weisdorf DJ and Bloomfield CD:
Acute myeloid leukemia. N Engl J Med. 373:1136–1152. 2015.
View Article : Google Scholar : PubMed/NCBI
|
|
2
|
Patel JP, Gönen M, Figueroa ME, Fernandez
H, Sun Z, Racevskis J, Van Vlierberghe P, Dolgalev I, Thomas S,
Aminova O, et al: Prognostic relevance of integrated genetic
profiling in acute myeloid leukemia. N Engl J Med. 366:1079–1089.
2012. View Article : Google Scholar : PubMed/NCBI
|
|
3
|
Leung AY, Man CH and Kwong YL: FLT3
inhibition: A moving and evolving target in acute myeloid
leukaemia. Leukemia. 27:260–268. 2013. View Article : Google Scholar : PubMed/NCBI
|
|
4
|
Huang A, Ju HQ, Liu K, Zhan G, Liu D, Wen
S, Garcia-Manero G, Huang P and Hu Y: Metabolic alterations and
drug sensitivity of tyrosine kinase inhibitor resistant leukemia
cells with a FLT3/ITD mutation. Cancer Lett. 377:149–157. 2016.
View Article : Google Scholar : PubMed/NCBI
|
|
5
|
Ju HQ, Zhan G, Huang A, Sun Y, Wen S, Yang
J, Lu WH, Xu RH, Li J, Li Y, et al: ITD mutation in FLT3 tyrosine
kinase promotes Warburg effect and renders therapeutic sensitivity
to glycolytic inhibition. Leukemia. 31:2143–2150. 2017. View Article : Google Scholar : PubMed/NCBI
|
|
6
|
Chen WL, Wang JH, Zhao AH, Xu X, Wang YH,
Chen TL, Li JM, Mi JQ, Zhu YM, Liu YF, et al: A distinct glucose
metabolism signature of acute myeloid leukemia with prognostic
value. Blood. 124:1645–1654. 2014. View Article : Google Scholar : PubMed/NCBI
|
|
7
|
Favero G, Moretti E, Bonomini F, Reiter
RJ, Rodella LF and Rezzani R: Promising. Antineoplastic Actions of
Melatonin. Front Pharmacol. 9:10862018. View Article : Google Scholar : PubMed/NCBI
|
|
8
|
Rodriguez C, Martín V, Herrera F,
García-Santos G, Rodriguez-Blanco J, Casado-Zapico S,
Sánchez-Sánchez AM, Suárez S, Puente-Moncada N, Anítua MJ and
Antolín I: Mechanisms involved in the pro-apoptotic effect of
melatonin in cancer cells. Int J Mol Sci. 14:6597–6613. 2013.
View Article : Google Scholar : PubMed/NCBI
|
|
9
|
Chuffa LG, Lupi Júnior LA, Seiva FR,
Martinez M, Domeniconi RF, Pinheiro PF, Dos Santos LD and Martinez
FE: Quantitative proteomic profiling reveals that diverse metabolic
pathways are influenced by melatonin in an in vivo model of ovarian
carcinoma. J Proteome Res. 15:3872–3882. 2016. View Article : Google Scholar : PubMed/NCBI
|
|
10
|
Mao L, Dauchy RT, Blask DE, Dauchy EM,
Slakey LM, Brimer S, Yuan L, Xiang S, Hauch A, Smith K, et al:
Melatonin suppression of aerobic glycolysis (Warburg effect),
survival signalling and metastasis in human leiomyosarcoma. J
Pineal Res. 60:167–177. 2016. View Article : Google Scholar : PubMed/NCBI
|
|
11
|
Sanchez-Sanchez AM, Antolin I,
Puente-Moncada N, Suarez S, Gomez-Lobo M, Rodriguez C and Martin V:
Melatonin cytotoxicity is associated to Warburg effect inhibition
in Ewing sarcoma cells. PLoS One. 10:e01354202015. View Article : Google Scholar : PubMed/NCBI
|
|
12
|
Livak KJ and Schmittgen TD: Analysis of
relative gene expression data using real-time quantitative PCR and
the 2(-Delta Delta C(T)) method. Methods. 25:402–408. 2001.
View Article : Google Scholar : PubMed/NCBI
|
|
13
|
Warburg O, Wind F and Negelein E: The
metabolism of tumors in the body. J Gen Physiol. 8:519–530. 1927.
View Article : Google Scholar : PubMed/NCBI
|
|
14
|
Gunawardane RN, Nepomuceno RR, Rooks AM,
Hunt JP, Ricono JM, Belli B and Armstrong RC: Transient exposure to
quizartinib mediates sustained inhibition of FLT3 signaling while
specifically inducing apoptosis in FLT3-activated leukemia cells.
Mol Cancer Ther. 12:438–447. 2013. View Article : Google Scholar : PubMed/NCBI
|
|
15
|
León J, Casado J, Jiménez Ruiz SM, Zurita
MS, González-Puga C, Rejón JD, Gila A, Muñoz de Rueda P, Pavón EJ,
Reiter RJ, et al: Melatonin reduces endothelin-1 expression and
secretion in colon cancer cells through the inactivation of FoxO-1
and NF-κβ. J Pineal Res. 56:415–426. 2014. View Article : Google Scholar : PubMed/NCBI
|
|
16
|
Martin V, Herrra F, Carrera-Gonzalez P,
García-Santos G, Antolín I, Rodriguez-Blanco J and Rodriguez C:
Intracellular signaling pathways involved in the cell growth
inhibition of glioma cells by melatonin. Cancer Res. 66:1081–1088.
2006. View Article : Google Scholar : PubMed/NCBI
|
|
17
|
Puente-Moncada N, Costales P, Antolín I,
Núñez LE, Oro P, Hermosilla MA, Pérez-Escuredo J, Ríos-Lombardía N,
Sanchez-Sanchez AM, Luño E, et al: Inhibition of FLT3 and PIM
kinases by EC-70124 exerts potent activity in preclinical models of
acute myeloid leukemia. Mol Cancer Ther. 17:614–624. 2018.
View Article : Google Scholar : PubMed/NCBI
|
|
18
|
Stubbs M and Griffiths JR: The altered
metabolism of tumors: HIF-1 and its role in the Warburg effect. Adv
Enzyme Regul. 50:44–55. 2010. View Article : Google Scholar : PubMed/NCBI
|
|
19
|
Majmundar AJ, Wong WJ and Simon MC:
Hypoxia-inducible factors and the response to hypoxic stress. Mol
Cell. 40:294–309. 2010. View Article : Google Scholar : PubMed/NCBI
|
|
20
|
Marini C, Ravera S, Buschiazzo A, Bianchi
G, Orengo AM, Bruno S, Bottoni G, Emionite L, Pastorino F,
Monteverde E, et al: Discovery of a novel glucose metabolism in
cancer: The role of endoplasmic reticulum beyond glycolysis and
pentose phosphate shunt. Sci Rep. 6:250922016. View Article : Google Scholar : PubMed/NCBI
|
|
21
|
Rogoff D, Black K, McMillan DR and White
PC: Contribution of hexose-6-phosphate dehydrogenase to NADPH
content and redox environment in the endoplasmic reticulum. Redox
Rep. 15:64–70. 2010. View Article : Google Scholar : PubMed/NCBI
|
|
22
|
Sánchez-Sánchez AM, Martín V,
García-Santos G, Rodríguez-Blanco J, Casado-Zapico S,
Suarez-Garnacho S, Antolín I and Rodriguez C: Intracellular redox
state as determinant for melatonin antiproliferative vs. cytotoxic
effects in cancer cells. Free Radic Res. 45:1333–1341. 2011.
View Article : Google Scholar : PubMed/NCBI
|
|
23
|
Ambrus A: An updated view on the molecular
pathomechanisms of human dihydrolipoamide dehydrogenase deficiency
in light of novel crystallographic evidence. Neurochem Res.
44:2307–2313. 2019. View Article : Google Scholar : PubMed/NCBI
|
|
24
|
Owen OE, Kalhan SC and Hanson RW: The key
role of anaplerosis and cataplerosis for citric acid cycle
function. J Biol Chem. 277:30409–30412. 2002. View Article : Google Scholar : PubMed/NCBI
|
|
25
|
Montal ED, Dewi R, Bhalla K, Ou L, Hwang
BJ, Ropell AE, Gordon C, Liu WJ, DeBerardinis RJ, Sudderth J, et
al: PEPCK coordinates the regulation of central carbon metabolism
to promote cancer cell growth. Mol Cell. 60:571–583. 2015.
View Article : Google Scholar : PubMed/NCBI
|
|
26
|
Grasmann G, Smolle E, Olschewski H and
Leithner K: Gluconeogenesis in cancer cells-repurposing of a
starvation-induced metabolic pathway? Biochim Biophys Acta Rev
Cancer. 1872:24–36. 2019. View Article : Google Scholar : PubMed/NCBI
|
|
27
|
Liu MX, Jin L, Sun SJ, Liu P, Feng X,
Cheng ZL, Liu WR, Guan KL, Shi YH, Yuan HX and Xiong Y: Metabolic
reprogramming by PCK1 promotes TCA cataplerosis, oxidative stress
and apoptosis in liver cancer cells and suppresses hepatocellular
carcinoma. Oncogene. 37:1637–1653. 2018. View Article : Google Scholar : PubMed/NCBI
|
|
28
|
Ma R, Zhang W, Tang K, Zhang H, Zhang Y,
Li D, Li Y, Xu P, Luo S, Cai W, et al: Switch of glycolysis to
gluconeogenesis by dexamethasone for treatment of hepatocarcinoma.
Nat Commun. 4:25082013. View Article : Google Scholar : PubMed/NCBI
|
|
29
|
Park EJ, Woo SM, Min KJ and Kwon TK:
Transcriptional and post-translational regulation of Bim controls
apoptosis in melatonin-treated human renal cancer Caki cells. J
Pineal Res. 56:97–106. 2014. View Article : Google Scholar : PubMed/NCBI
|
|
30
|
Wang TH, Wu CH, Yeh CT, Su SC, Hsia SM,
Liang KH, Chen CC, Hsueh C and Chen CY: Melatonin suppresses
hepatocellular carcinoma progression via lncRNA-CPS1-IT-mediated
HIF-1α inactivation. Oncotarget. 8:82280–82293. 2017. View Article : Google Scholar : PubMed/NCBI
|
|
31
|
Cardaci S, Desideri E and Ciriolo MR:
Targeting aerobic glycolysis: 3-bromopyruvate as a promising
anticancer drug. J Bioenerg Biomembr. 44:17–29. 2012. View Article : Google Scholar : PubMed/NCBI
|
|
32
|
Zhao Y, Butler EB and Tan M: Targeting
cellular metabolism to improve cancer therapeutics. Cell Death Dis.
4:e5322013. View Article : Google Scholar : PubMed/NCBI
|
|
33
|
Akers LJ, Fang W, Levy AG, Franklin AR,
Huang P and Zweidler-McKay PA: Targeting glycolysis in leukemia: A
novel inhibitor 3-BrOP in combination with rapamycin. Leuk Res.
35:814–820. 2011. View Article : Google Scholar : PubMed/NCBI
|
|
34
|
Hevia D, Gonzalez-Menendez P,
Fernandez-Fernandez M, Cueto S, Rodriguez-Gonzalez P, Garcia-Alonso
JI, Mayo JC and Sainz RM: Melatonin decreases glucose metabolism in
prostate cancer cells: A 13C stable isotope-resolved
metabolomic study. Int J Mol Sci. 18:E16202017. View Article : Google Scholar : PubMed/NCBI
|