Introduction
Emerging single-cell technologies, including
single-cell DNA/RNA sequencing and mass cytometry, enable
characterization of the extensive degree of heterogeneity in the
cell pool by simultaneously quantifying a large number of
parameters in single cells (1–3).
Single-cell sequencing allows simultaneous analysis of the genes
and transcript expression levels in individual cells at the DNA or
RNA level (4). However, it is
limited by an incapability of quantifying proteins that perform
dominant functions within cells and thus cannot precisely identify
the bioactive status in single cells or certain cell populations
via surface marker-guided phenotyping. One of the traditional
techniques used to determine cell subsets from a heterogeneous cell
population is fluorescence-activated cell sorting (FACS), which is
restricted by the number of detection channels (generally <15)
and cumbersome compensation due to spectral spillover. In contrast,
the newest form of mass cytometry is capable of simultaneously
measuring more than 40 parameters in thousands to millions of
individual cells with minimal/no compensation (5,6).
Cytometry with increased parameters presents an unprecedented
opportunity to measure more membrane or intercellular targets and
identify markers, therefore revealing high-dimensional details at
the single-cell resolution in well-defined phenotypic populations.
In recent years, this powerful innovation has already become widely
employed to obtain a detailed understanding of complex processes in
cellular development (7,8), proliferation (9,10), and
differentiation (11,12) and disease progression (13,14).
Novel immunotherapeutic approaches, such as immune
checkpoint blockade and chimeric antigen receptor T cell therapy,
which mainly function to reactivate endogenous antitumor T cells or
construct specific antitumor T cells, expand the options for
effective cancer therapy (15,16).
Immune checkpoints represent a series of co-stimulatory and
co-inhibitory molecules expressed on T cells and other leukocytes
that regulate T lymphocyte activation and effector functions
(17,18). These immune regulatory checkpoints
play critical roles in the maintenance of self-tolerance and immune
homeostasis under normal physiological conditions; however, cancer
cells co-opt these checkpoints to escape immune attack (19,20).
Nevertheless, blocking inhibitory receptors can enlist and
strengthen the immune system to attack tumors and has achieved
clinical success in treating many tumor types, even metastatic and
chemo-resistant cancer (21–24).
Targeting cytotoxic T lymphocyte-associated protein 4 (CTLA-4) and
the interaction between programmed cell death 1 (PD-1) and PD
ligand 1 (PD-L1) are the most prominent immune checkpoint blockade
strategies in the clinic (25–28).
However, these immunotherapies fail to overcome cancer in a
significant proportion of patients, largely due to inter-individual
heterogeneity of the onco-immune phenotype in the primary tumor
microenvironment and the fact that signals inducing T cell
exhaustion and dysfunction are not fully and sustainably blocked
(21,29). Accordingly, it is necessary to
determine more potential immune biomarkers with clinical efficacy
that can facilitate the selection of immune checkpoint blocking
targets or strategies to improve immunotherapies. After analyzing
mass cytometry data collected from 73 patients with clear cell
renal cell carcinoma, Chevrier et al discovered
heterogeneous levels of co-inhibitory receptors, including CTLA-4
and T cell immunoglobulin mucin domain 3 (Tim-3) and absent
lymphocyte-activation gene 3 (LAG3) in tumor-infiltrating
PD-1+ cells (30).
Inspiringly, mass cytometry-based single-cell analysis was utilized
to predict the response to PD-1 blockade in patients with stage IV
melanoma and demonstrated that responders had higher expression of
HLA-DR, CTLA-4, CD56 and CD45RO and lower expression of CD3, CD27
and CD28 in peripheral blood (PB) mononuclear cells than
non-responders before therapy (31). These latest studies emphasize the
variability of immune checkpoints and bring the clinical
application of mass cytometry-based in-depth analysis closer to
reality.
Plasma cell dyscrasias (PCD), also termed plasma
cell disorders, are an orchestrated spectrum of heterogeneous
diseases, such as multiple myeloma (MM), amyloid light-chain (AL)
amyloidosis, and solitary bone plasmacytoma (SBP), characterized by
a malignant clonal proliferation of plasma cells (32). With the widespread application of
immune checkpoint blockade for cancer therapy, this strategy has
also been applied to induce and reinforce anti-myeloma immunity.
However, a phase 1b study of a single PD-1 antibody for MM
treatment showed no significant disease regression, although MM
cells highly express PD-L1 (33–36),
implicating that single-agent therapy is insufficient to induce
clinically meaningful anti-MM immunity. In addition, little
information is known about the immune checkpoints in other PCD
patients due to restrictions on the methods for analyzing multiple
parameters in various cell types. Considering the complex nature of
immune dysfunction in the tumor microenvironment of MM or other
form of PCD, it is vital to obtain a comprehensive image of the
immunologic milieu, which will drive the discovery of more precise
and comprehensive blockade targets to finally reverse
tumor-mediated immune suppression and expand malignant plasma
cell-reactive T cells.
In the present study, we introduced mass cytometry
technology to map the immune microenvironment of 3 PCD patients and
1 non-PCD patient at a single-cell resolution. To integrally
understand immune checkpoint status in immune cells, an antibody
panel was specifically designed to assess 13 immune cell markers
and 18 immunomodulatory receptors and ligands. As the sample source
or processing methods may impact the biology of immune cells, we
collected samples from both the bone marrow (BM) and PB and
processed these samples with direct fixation or fixation after
mononuclear cell (MC) isolation. Our study supports the use of mass
cytometry technology as a novel tool for determining personalized
immune information and expands the view of the specific providers
and receivers of immune checkpoint axes in PCD patients.
Materials and methods
Human specimens
Peripheral blood (PB) and bone marrow (BM) samples
were concurrently collected from patients undergoing diagnosis
between October 2017 and December 2017 at the Third Affiliated
Hospital of Sun Yat-sen University after obtaining patient informed
consent. All protocols were reviewed and approved by the Third
Affiliated Hospital of Sun Yat-sen University Ethics Committee. The
patient details are listed in Table
SI. Samples were collected from 3 patients with PCD and 1
patient who was diagnosed without any hematological malignancy
(NHM).
Sample collection and cell
fixation
PB and BM samples were collected from the patients
into sodium heparin tubes. PB or BM (1–2 ml) samples were directly
fixed with 1X Fix I Buffer (cat. no. 201065, Fluidigm) for 10 min
at room temperature (RT); thereafter, red blood cells were removed
using red blood lysis buffer. Bone marrow mononuclear cells (BMMCs)
or peripheral blood mononuclear cells (PBMCs) were collected from
freshly collected samples via a Lymphoprep (cat. no. 07851,
STEMCELL Technologies) gradient and then fixed with 1X Fix I Buffer
for 10 min at RT. Fixed cells were resuspended in cell staining
buffer (CSB) [0.5% bovine serum albumin (BSA) and 0.02% sodium
azide in Dulbecco's phosphate buffered saline] with 10% DMSO and
stored at −80°C before use.
Antibody staining
Fixed cells (1-2×10⁶) were washed twice
with CSB and incubated with Human Fc Receptor Binding Inhibitor
Antibody (cat. no. 85-14-9161-73, eBioscience) for 10 min at RT.
Samples were initially stained with biotin anti-human OX40L (cat.
no. 326306, Biolegend) and APC anti-human ICOSL (cat. no. 309407,
Biolgend) for 30 min at RT and washed twice with CSB. Thereafter,
samples were stained with 29 metal isotope-labeled antibodies
against 29 human surface molecules and 2 metal isotope-labeled
antibodies against biotin or APC (Table SII) for 30 min at RT. After washing
with CSB twice, the cells were resuspended in 1 ml of nucleic acid
Ir-Intercalator (125 nM, cat. no. 201192A, Fluidigm) overnight at
4°C. The cells were then washed once in CSB and three times in
ultrapure water; thereafter, the cells were resuspended in
ultrapure water containing 15% EQ Four Element Calibration Beads
(cat. no. 201078, Fluidigm) and acquired on Helios mass cytometer
(Fluidigm). After acquisition, the data were normalized to make all
samples maximally comparable using bead-based normalization in
CyTOF software 6.7 (Fluidigm).
Data analysis
Debris, beads, and doublets were removed from the
events and the single cell data were used for further analyses.
Analysis by mass cytometry contour plots, heatmaps, viSNE maps, and
SPADE tress was performed on the Cytobank platform www.cytobank.org (37). FlowJo version V10 was used for
generating histogram overlays (FlowJo™ Software, v.10;
Becton, Dickinson and Company).
Results
In-depth immunophenotyping of relapsed
MM samples
To evaluate the immune status of individual
patients, BM and PB samples were collected at the time of BM biopsy
for diagnosis and fixed directly (Q-FIX) or fixed after MC
isolation (G-FIX; Fig. 1A). We
stained cells with an antibody panel containing 31 antibodies
against 13 immune cell markers and 18 immunomodulatory molecules
(Fig. 1A), and single-cell data
were acquired using mass cytometry. Multiple methods, including
gating, heatmapping, viSNE, and spanning-tree progression analysis
of density-normalized events (SPADE) (12) were performed for in-depth
single-cell analysis.
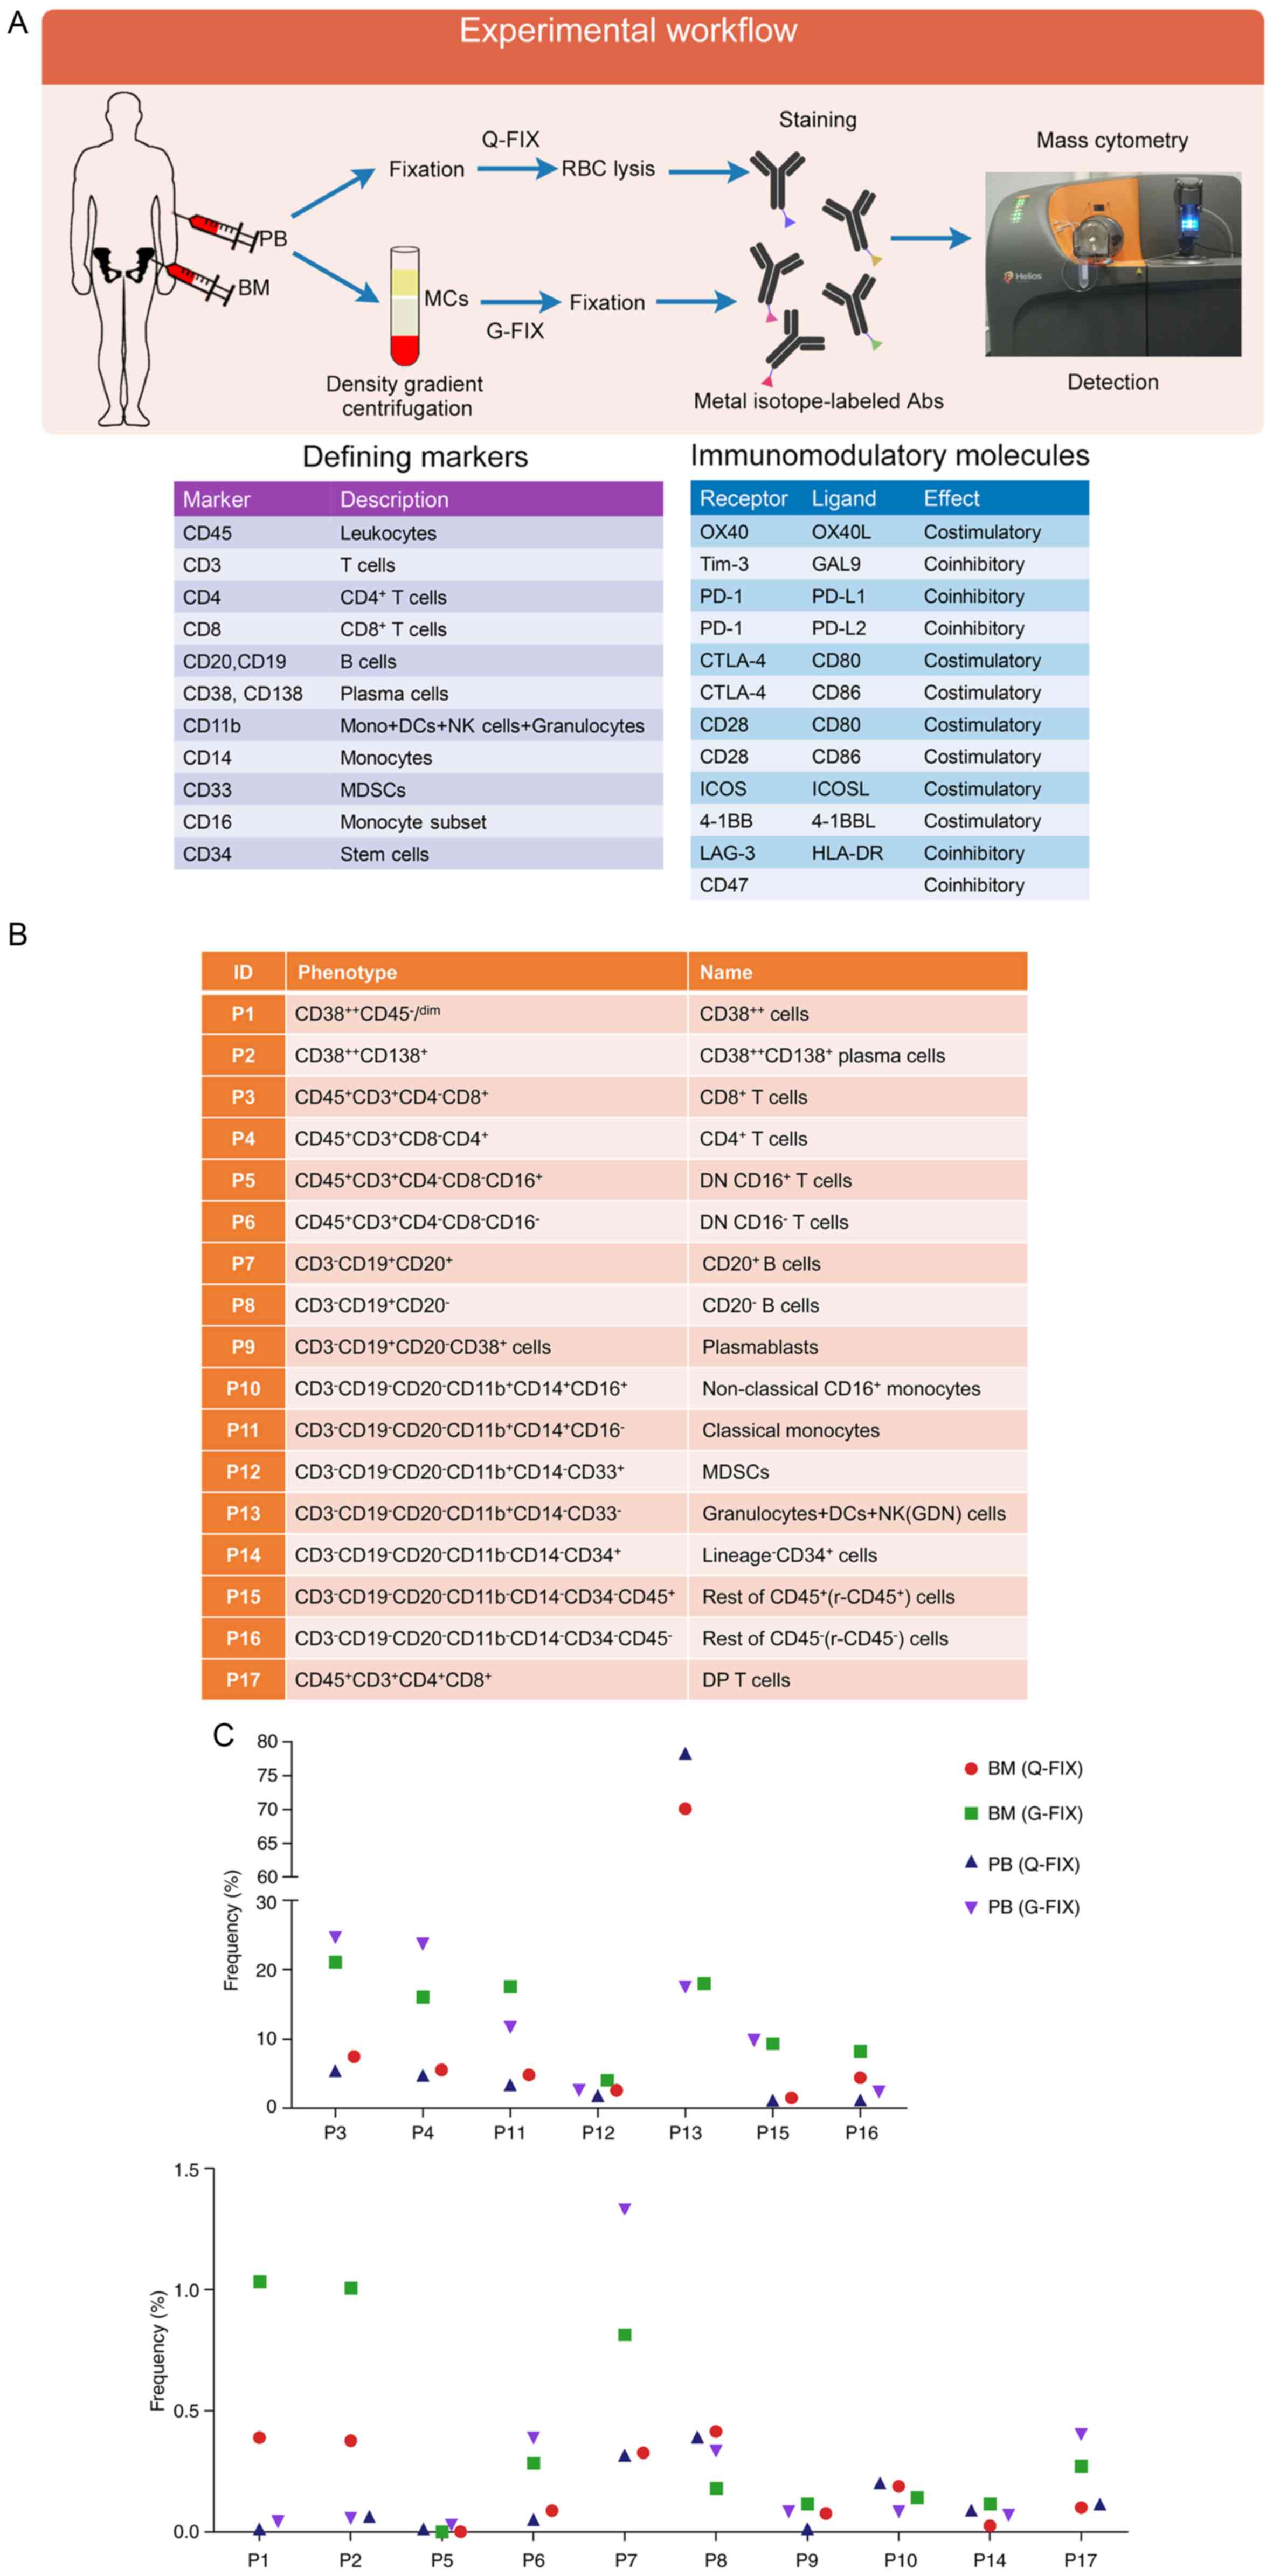 | Figure 1.Identification of the immune
populations in PB and BM cells of a relapsed MM patient. (A)
Experimental approach and single-cell analysis methods used in this
study and markers used to define cell populations and onco-immune
phenotypes. (B) Phenotypes of the gated populations. (C) Frequency
of immune lineages for each sample collected from the relapsed MM
patient's PB or BM. (D) viSNE maps displaying BM (G-FIX) cells from
the relapsed MM patient and colored by the normalized expression of
the indicated markers. (E) Heatmaps showing the normalized median
expression of 13 markers in all cell populations. Cell types are
indicated by color. MM, multiple myeloma; PB, peripheral blood; BM,
bone marrow; MCs, mononuclear cells; RBC, red blood cell; Abs,
antibodies; Mono, monocytes; DCs, dendritic cells; NK, natural
killer; MDSCs, myeloid-derived suppressor cells; DP T cells,
double-positive T cells; Q-FIX, fixed directly; G-FIX, fixed after
MC isolation. |
Based on standardized immunophenotyping for human
immunology (38), 17 cell
populations (P1-P17) were identified (Fig. 1B). The frequency of each population
in each sample obtained from a relapsed MM patient with low
malignant plasma (MM) cells which may be caused by unavoidable
interfusion of PB during marrow extraction, was analyzed. Because
malignant plasma cells are mainly localized in the BM, the
proportion of plasma cells in the BM (G-FIX) sample (1%) was larger
than that in the PB (G-FIX) sample (0.04%), whereas no significant
differences in the frequency of the other populations except for P7
were observed between them (Fig.
1C). Although the percentage of MM cells is low, this patient
still was diagnosed with relapsed MM based on diagnostic history
and the other examinations. We analyzed the distribution of gated
immune cells using a viSNE map to visualize high-dimensional data
in two dimensions, and multiple masses representing differenT cell
populations were clearly displayed after 13 marker channel-based
viSNE analysis. The expression of defining markers shown on the
viSNE map was identical to the phenotypes of the gated cell
populations (Fig. 1D). Expression
levels of the defining markers in defined cell populations were
similar between Q-FIX and G-FIX samples (Fig. 1E), suggesting that these two process
methods are reliable for population analysis.
Immune checkpoint landscape in the
relapsed MM patient
Expression profiles containing 18 immune checkpoint
molecules of the 17 cell populations were visualized in heatmaps
(Fig. 2A), showing similar
expression pattern between the BM and PB samples. For instance,
monocytes (P10 and P11) and myeloid-derived suppressor cells
(MDSCs) (P12) in the BM (Q-FIX) sample expressed a lower level of
galectin-9 (GAL9) than those in the PB (Q-FIX) sample, and
lineage−CD34+ cells (P14) in the PB (Q-FIX)
sample expressed a higher level of programmed death ligand 1
(PD-L1) and PD-L2 than those in the BM (Q-FIX) sample (Fig. 2A). We next used viSNE to assess the
heterogeneity of these immunomodulatory molecules at a single-cell
resolution (Figs. 2B and S1A). viSNE maps showed detailed
distribution of these molecules and revealed more small cell
subsets hiding in the cell populations, such as CD4+ or
CD8+ T cell subsets highly expressing PD-1 or CD28.
Because immunotherapy is mainly intended to rescue functional T
cells, we next determined the frequency of cells expressing immune
checkpoint receptors in the T cell subpopulations (Fig. 2C). The frequencies of
PD-1+ cells in the BM CD4+, CD8+
and double-positive (DP) T clusters were 29, 16 and 14% on average,
respectively, and they were 20, 9 and 5% in the PB samples, whereas
they were only 0.9 and 0.6% in BM and PB non-T cells, respectively.
Inducible T-cell costimulator (ICOS)+ cells accounted
for 36%, 10 and 42 of BM CD4+, CD8+, and
double-positive (DP) T cells, respectively, and for 25, 6, and 30
of PB CD4+, CD8+, and DP T cells,
respectively. In total, 53–66% of CD4+ T cells, 24–21%
of CD8+ T cells, and 80–95% of DP T cells were positive
for CD28 expression. A low frequency (<8%) of CTLA-4-expressing
CD4+ and CD8+ T cells was observed in both
the BM and PB samples. To exhaustively reveal T cell clusters with
immunologic differences, we narrowed down the population using
SPADE analysis (Figs. 2D and
S1B). Increasing minor T cell
subsets were clarified, such as a cluster with the highest PD-1
expression in 0.17% of CD4+, 0.12% of CD8+,
and 9.7% of DP T cells that also expressed high levels of ICOS,
CD28, human leukocyte antigen-DR isotype (HLA-DR), and CD38. When
comparing the BM and PB T cells using viSNE, several small
differences were detected in the combined viSNE map (Fig. S2A), such as BM PD-1+ T
cells showing higher PD-1 expression than PB PD-1+ T
cells (Fig. S2B), indicating that
the immune status of T cells in BM is different from that in
PB.
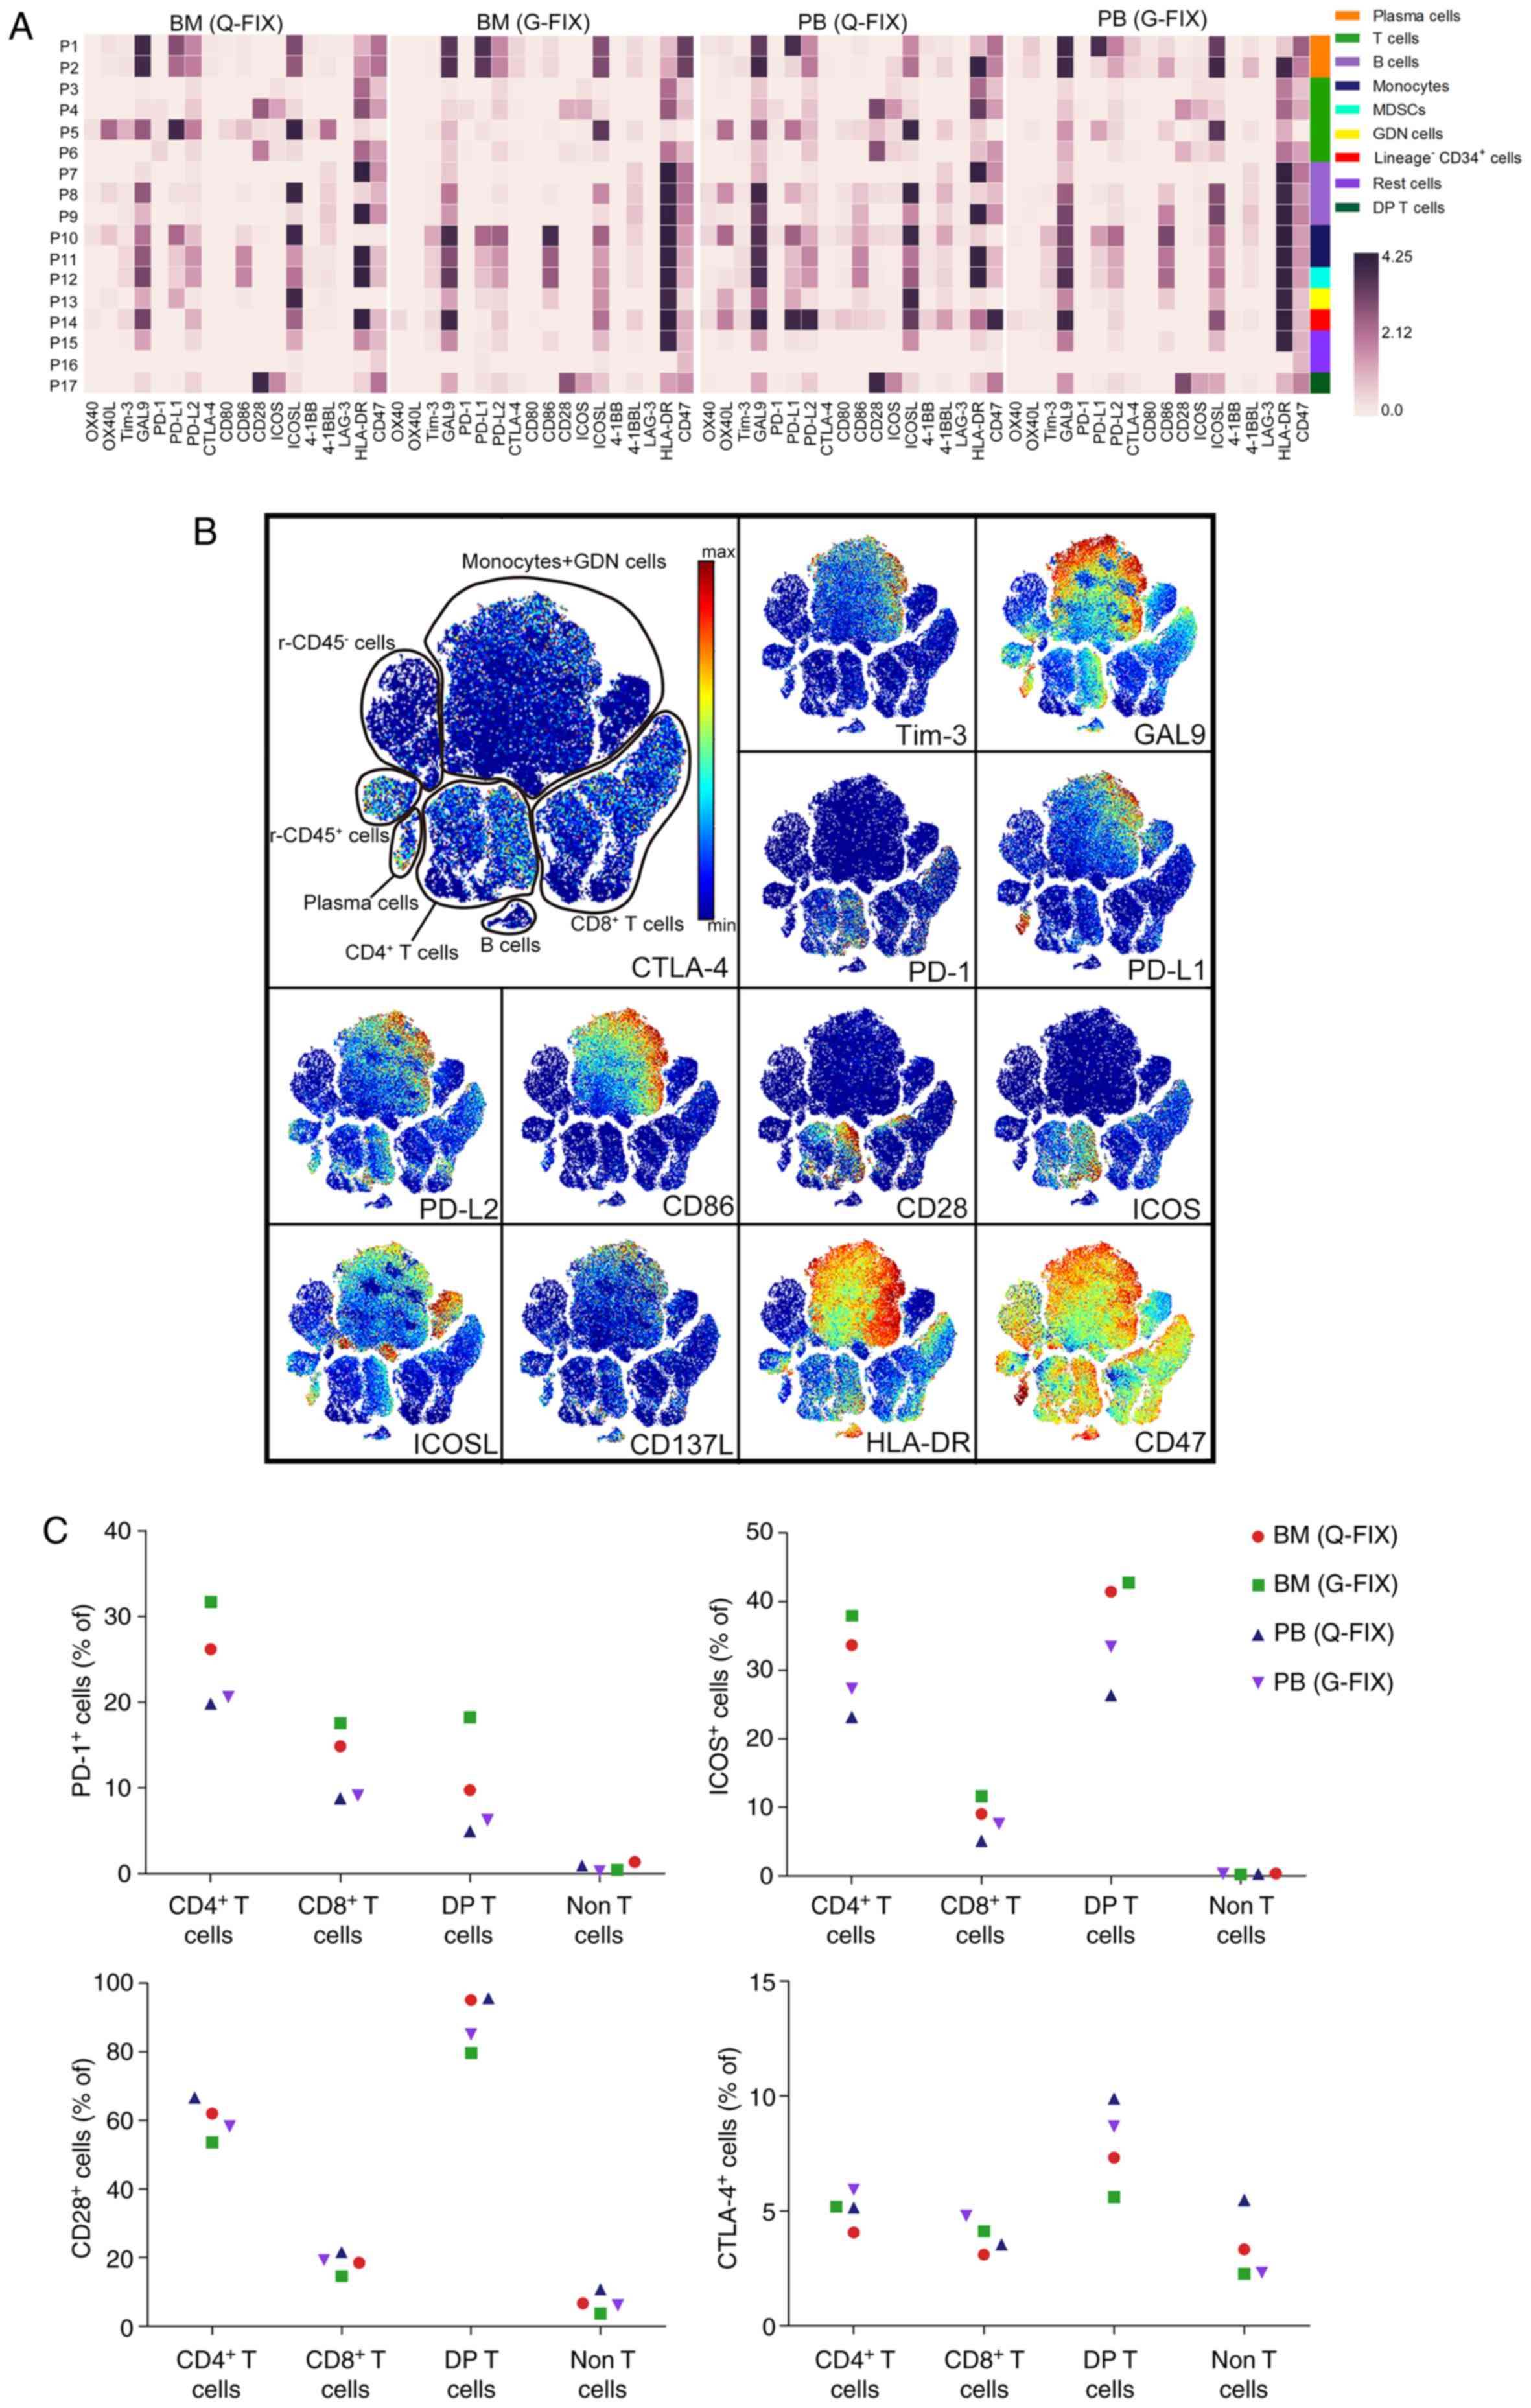 | Figure 2.Onco-immune atlas in PB and BM cells
of the relapsed MM patient. (A) Heatmaps showing the normalized
median expression of 18 immunomodulatory molecules in all cell
populations. Cell types are indicated by color. (B) viSNE maps
displaying BM (G-FIX) cells from the relapsed MM patient and
colored by the normalized expression of the indicated
immunomodulatory molecules. (C) Frequency of PD-1+,
ICOS+, CD28+, or CTLA-4+ cells in
the indicated populations for each sample collected from the
relapsed MM patient's PB or BM. (D) SPADE tree describing T cell
subsets and colored by the normalized expression of the indicated
molecules. T cell subpopulations are gated with a grey color, and
PD-1+ subsets are gated with a deep grey area. A red
circle indicates a small subset that highly expresses PD-1 in the
indicated T cell subpopulation. MM, multiple myeloma; PB,
peripheral blood; BM, bone marrow; MDSCs, myeloid-derived
suppressor cells; DP T cells, double-positive T cells; Q-FIX, fixed
directly; G-FIX, fixed after MC isolation. |
Identification of immunomodulatory
ligand providers in the relapsed MM patient
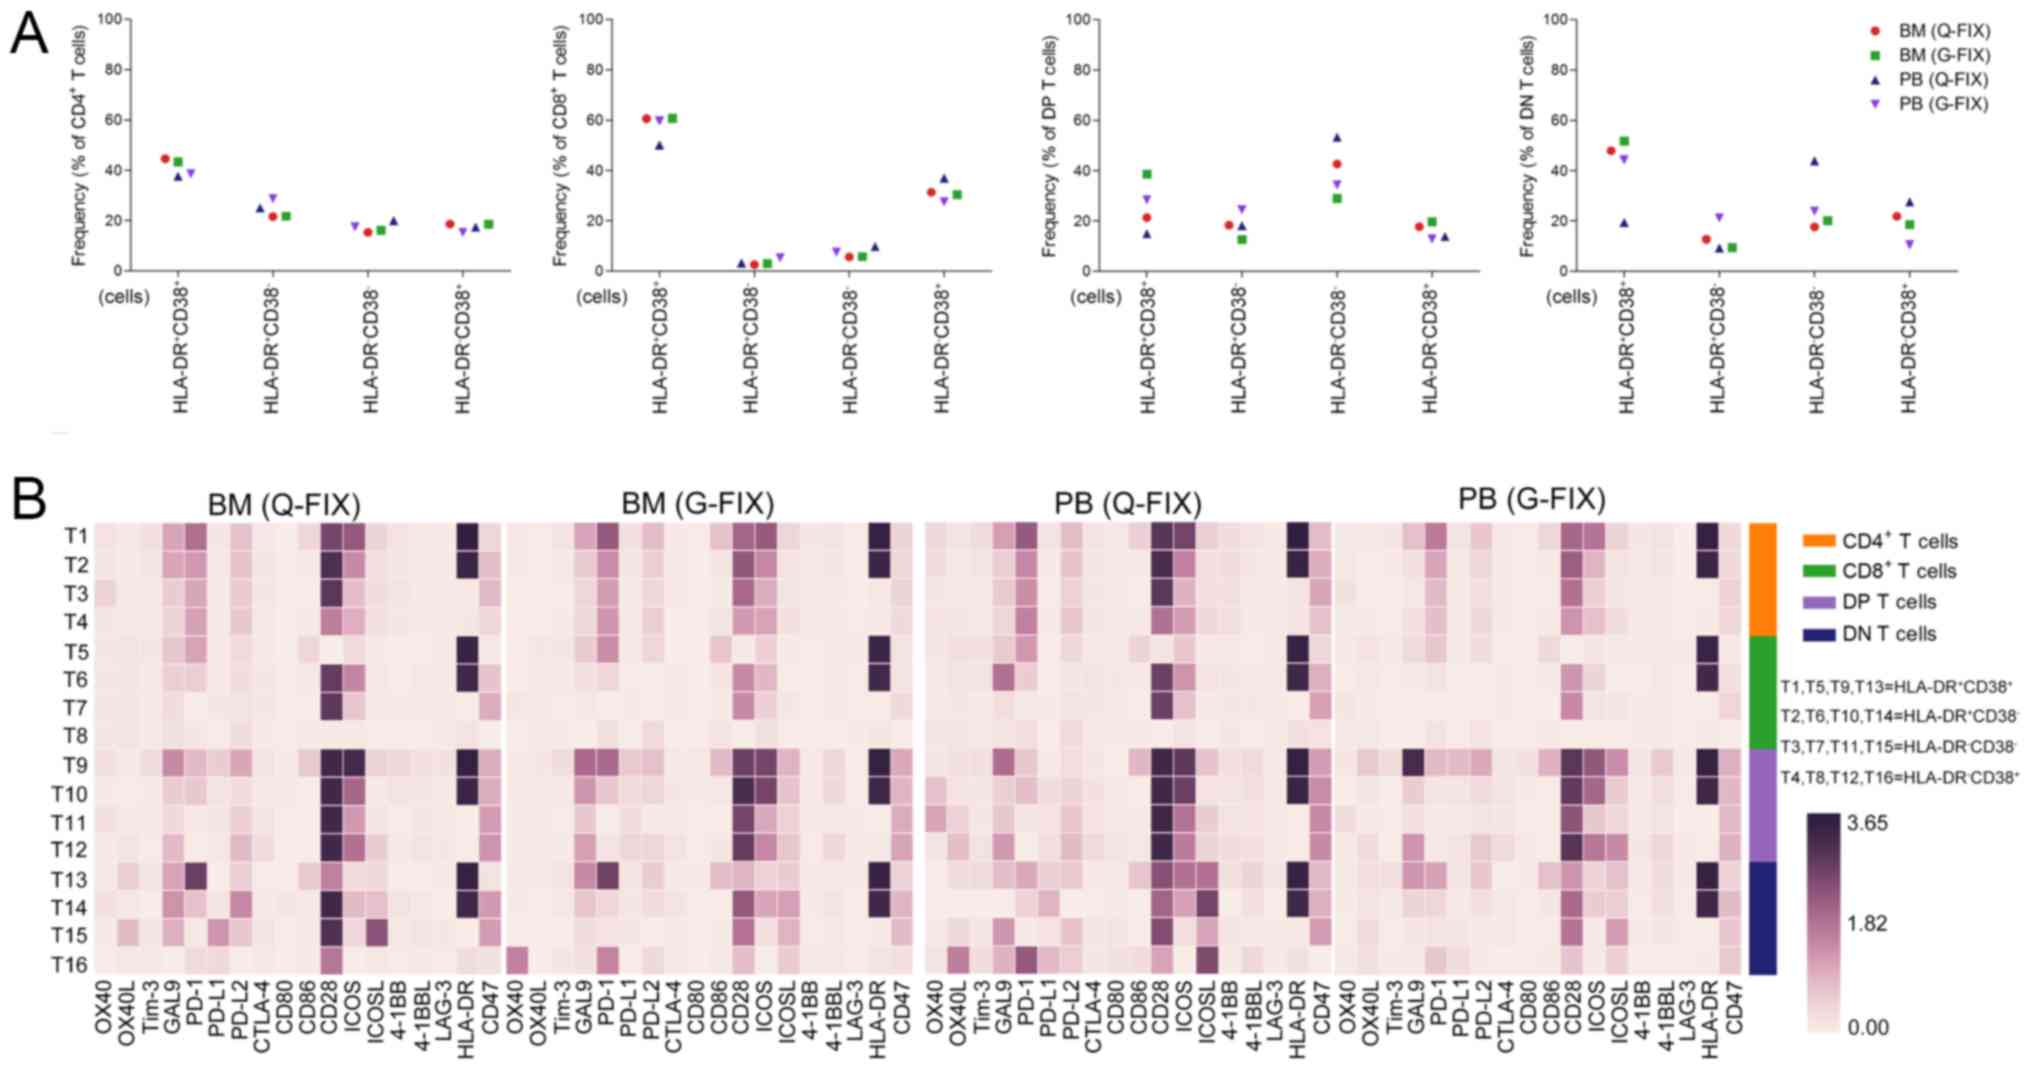
CD38 and HLA-DR together have proven to be useful as
biomarkers for tracking activated T cells (30,38).
Thus, we employed these two markers to reveal the activation status
of T cells in the MM patient. Activated
(HLA-DR+CD38+) cells accounted for 37–44,
50–60, 14–38, and 19–51% of CD4+, CD8+,
double-positive (DP), and double-negative (DN) T cells,
respectively (Fig. 3A). Analysis of
immunomodulatory molecules in these T cell clusters showed that
activated T cells tended to express higher levels of PD-1 and ICOS
than the other 3 T cell subsets. Interestingly, activated
CD8+ T (T5) cells barely expressed CD28, which provides
co-stimulatory signals required for T cell activation and survival
(Fig. 3B). MalignanT cells usually
express high levels of ligands that recognize the immunomodulatory
receptors on T cells to create an immunosuppressive
microenvironment. In addition, ligands matched with PD-1, ICOS, and
CD28 were offered by plasma cells, B cells, monocytes, and MDSCs in
the BM and PB (Figs. 3C and
S2C and D). Plasma cells were
identified as the significant source of ligands in the BM because
92, 92 and 97% of them expressed PD-L1, PD-L2, and ICOSL,
respectively (Fig. 3D).
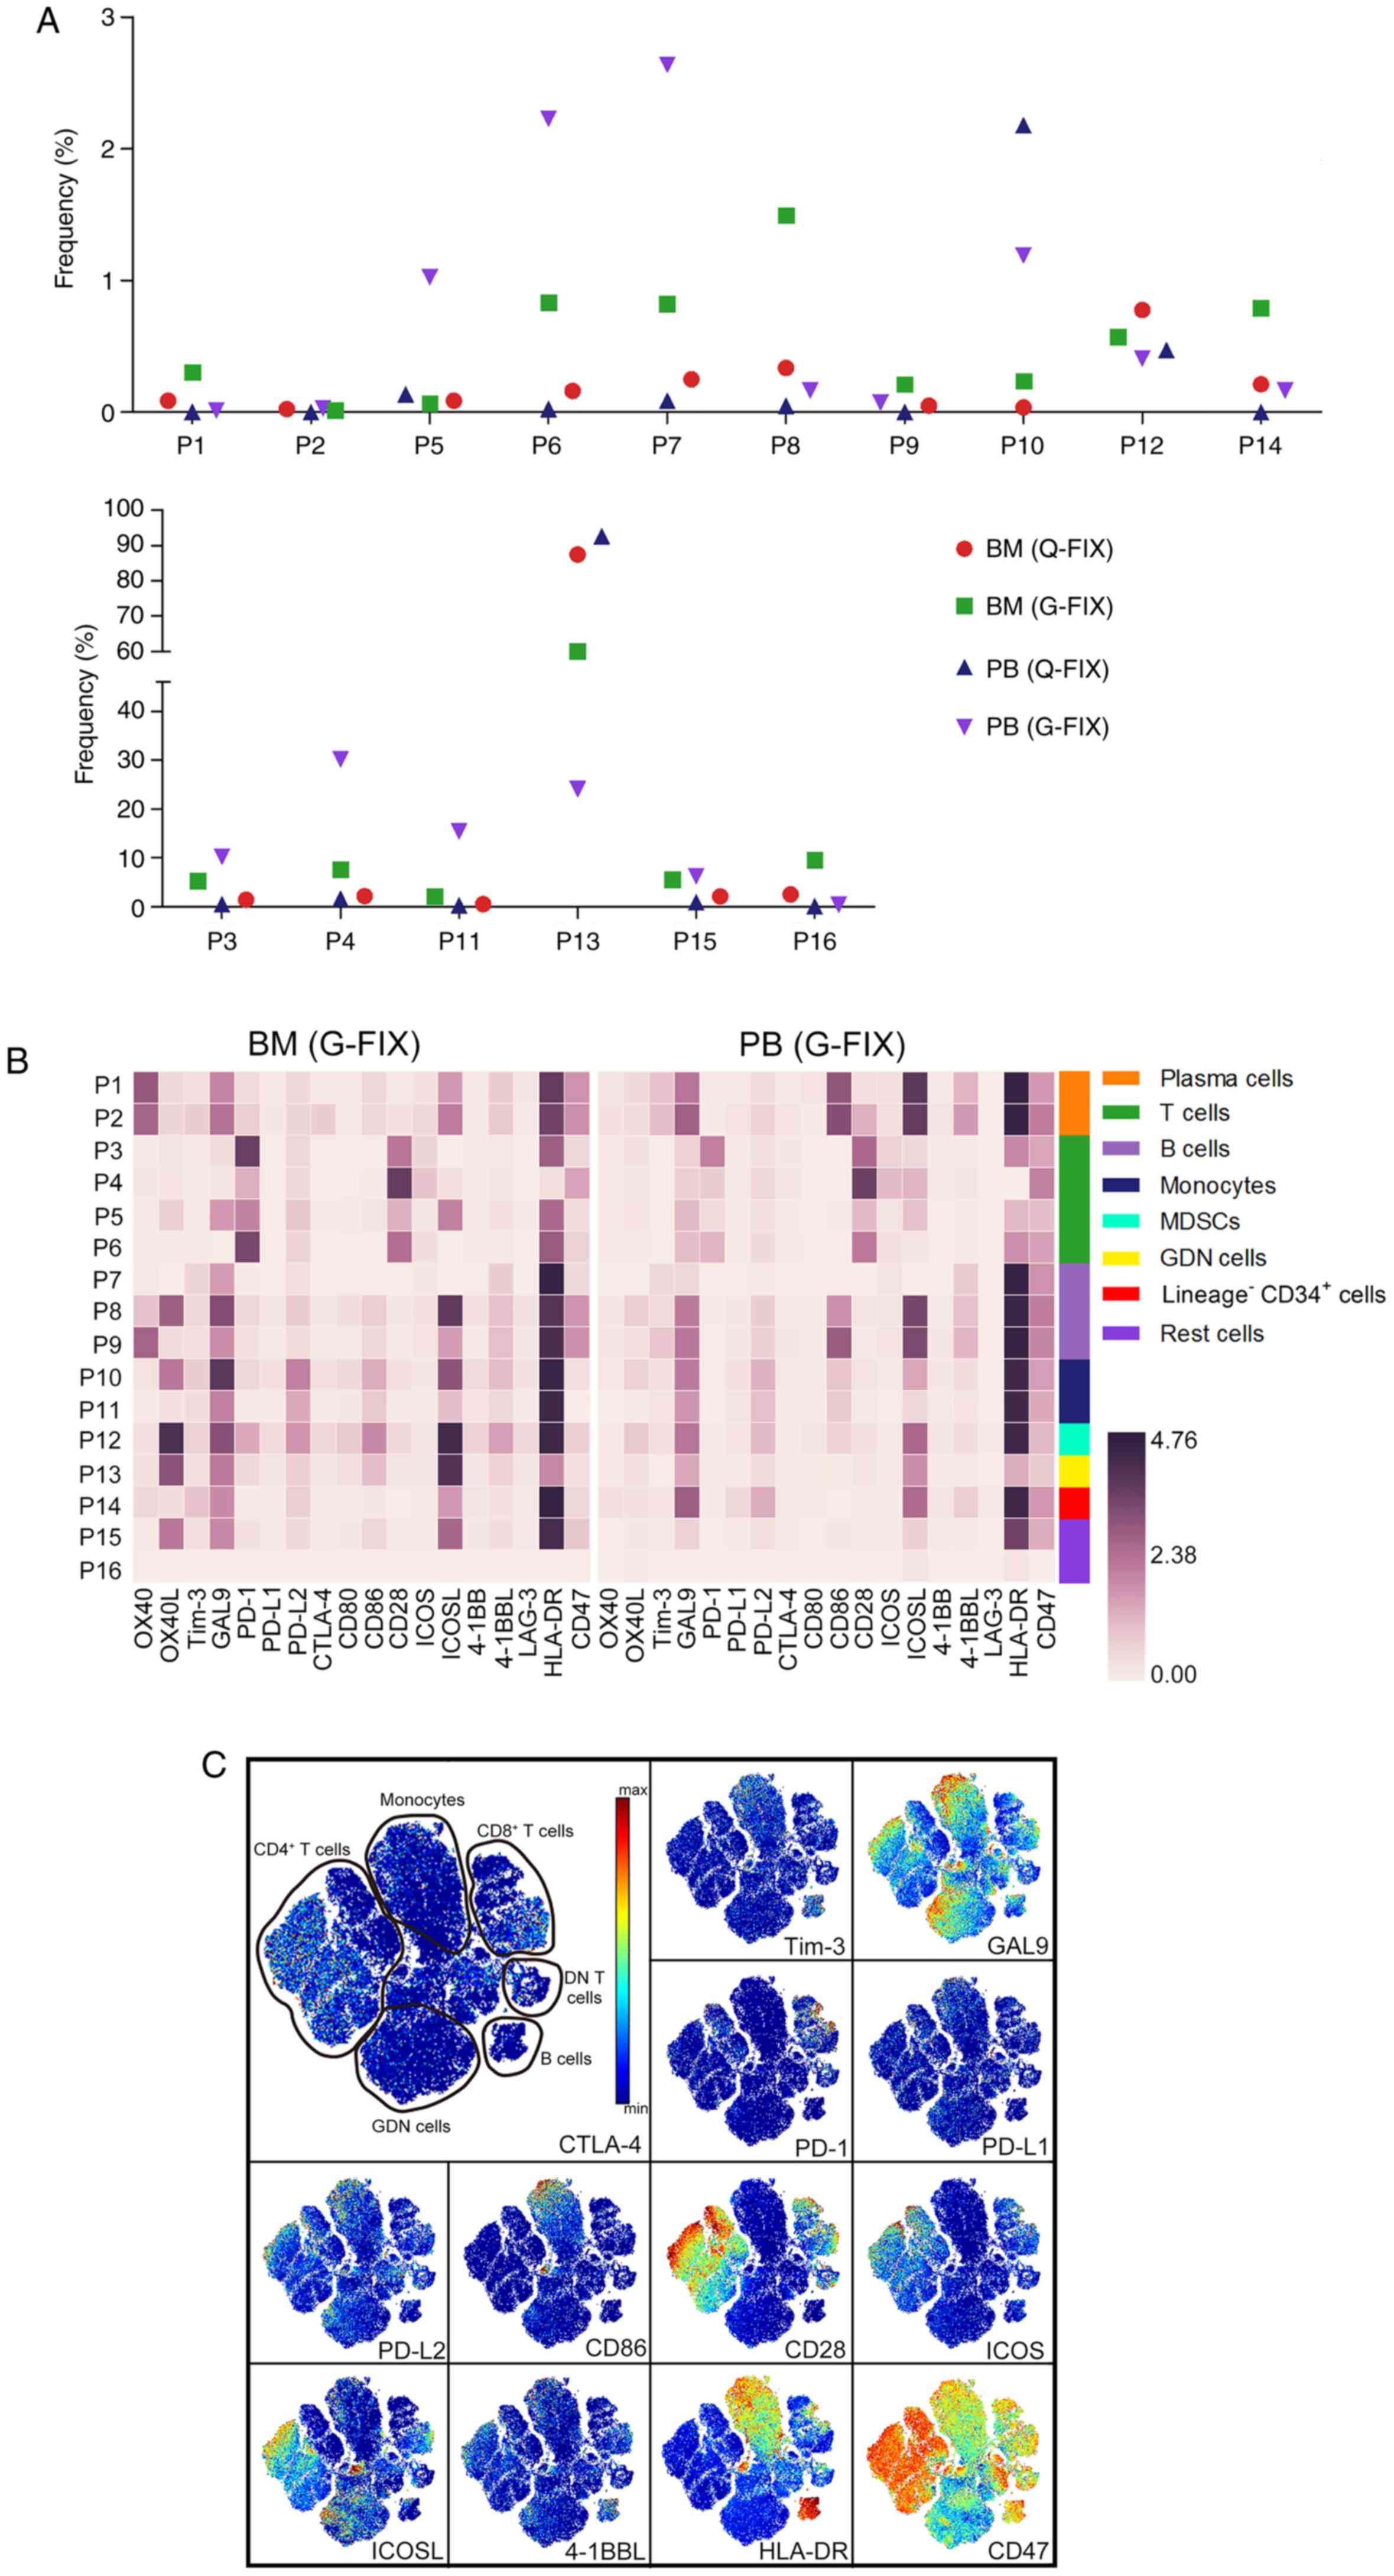
Immune landscape in a non-hematologic
malignancy (NHM) patient
To confirm the reliability of mass cytometry-based
immune analysis, we next determined the immune landscape in an NHM
patient. This patient was initially suspected with MM and later
diagnosed with an abnormal hemogram induced by medicine. Plasma
cells accounted for 0.9 and 0% of all BM and PB cells,
respectively, and these are accordant with clinical examination
results of the bone marrow sample determined using flow cytometry.
The proportions of the other populations were examined and are
presented (Fig. 4A). Next,
full-scale expression levels of defining markers and
immunomodulatory molecules were determined by heatmapping and viSNE
map (Figs. 4B and S3A and B), showing different immune
phenotypes from those in the MM patient. viSNE map showed the
distribution of all the molecules and revealed PD-1+,
CD28+, and ICOS+ cells in the BM T cell
populations (Fig. 4C). When we
analyzed BM and PB T cells together, we observed that
PD-1+ T cells in the BM showed higher PD-1 signals than
those in the PB. Subtle distinctions between BM and PB T cells were
identified in the expression of Tim-3, CTLA-4, CD8, and CD14
(Fig. S3C).
In this patient, the percentages of PD-1+
cells among BM CD4+, CD8+, and DN T cells on
average were 12, 50, and 45%, respectively, and they were 11, 30,
and 17% in the PB T cell subpopulations. ICOS was expressed by 37%
of CD4+ and 23% of CD8+ T cells (Fig. 4D). In all, 95–97% of CD4+
T cells and 60–70% of CD8+ T cells expressed CD28. Less
than 3% of BM or PB CD4+ T cells, 28% of BM
CD8+ or DN T cells, 17% of PB CD8+ T cells,
and 15% of PB DN T cells, were activated (Fig. S4A), and these cells had a tendency
for higher PD-1, ICOS, and CD28 expression than pre/non-activated T
cells (Fig. S4B).
The main providers of ligands for receptors on T
cells included MDSCs, the population containing granulocytes,
dendritic, and natural killer (GDN) cells, and monocytes, and
plasma cells provided minimal ligands. PD-L1 signaling, which is
important for T cell suppression, was consistently subdued in these
providers (Fig. 4E and F).
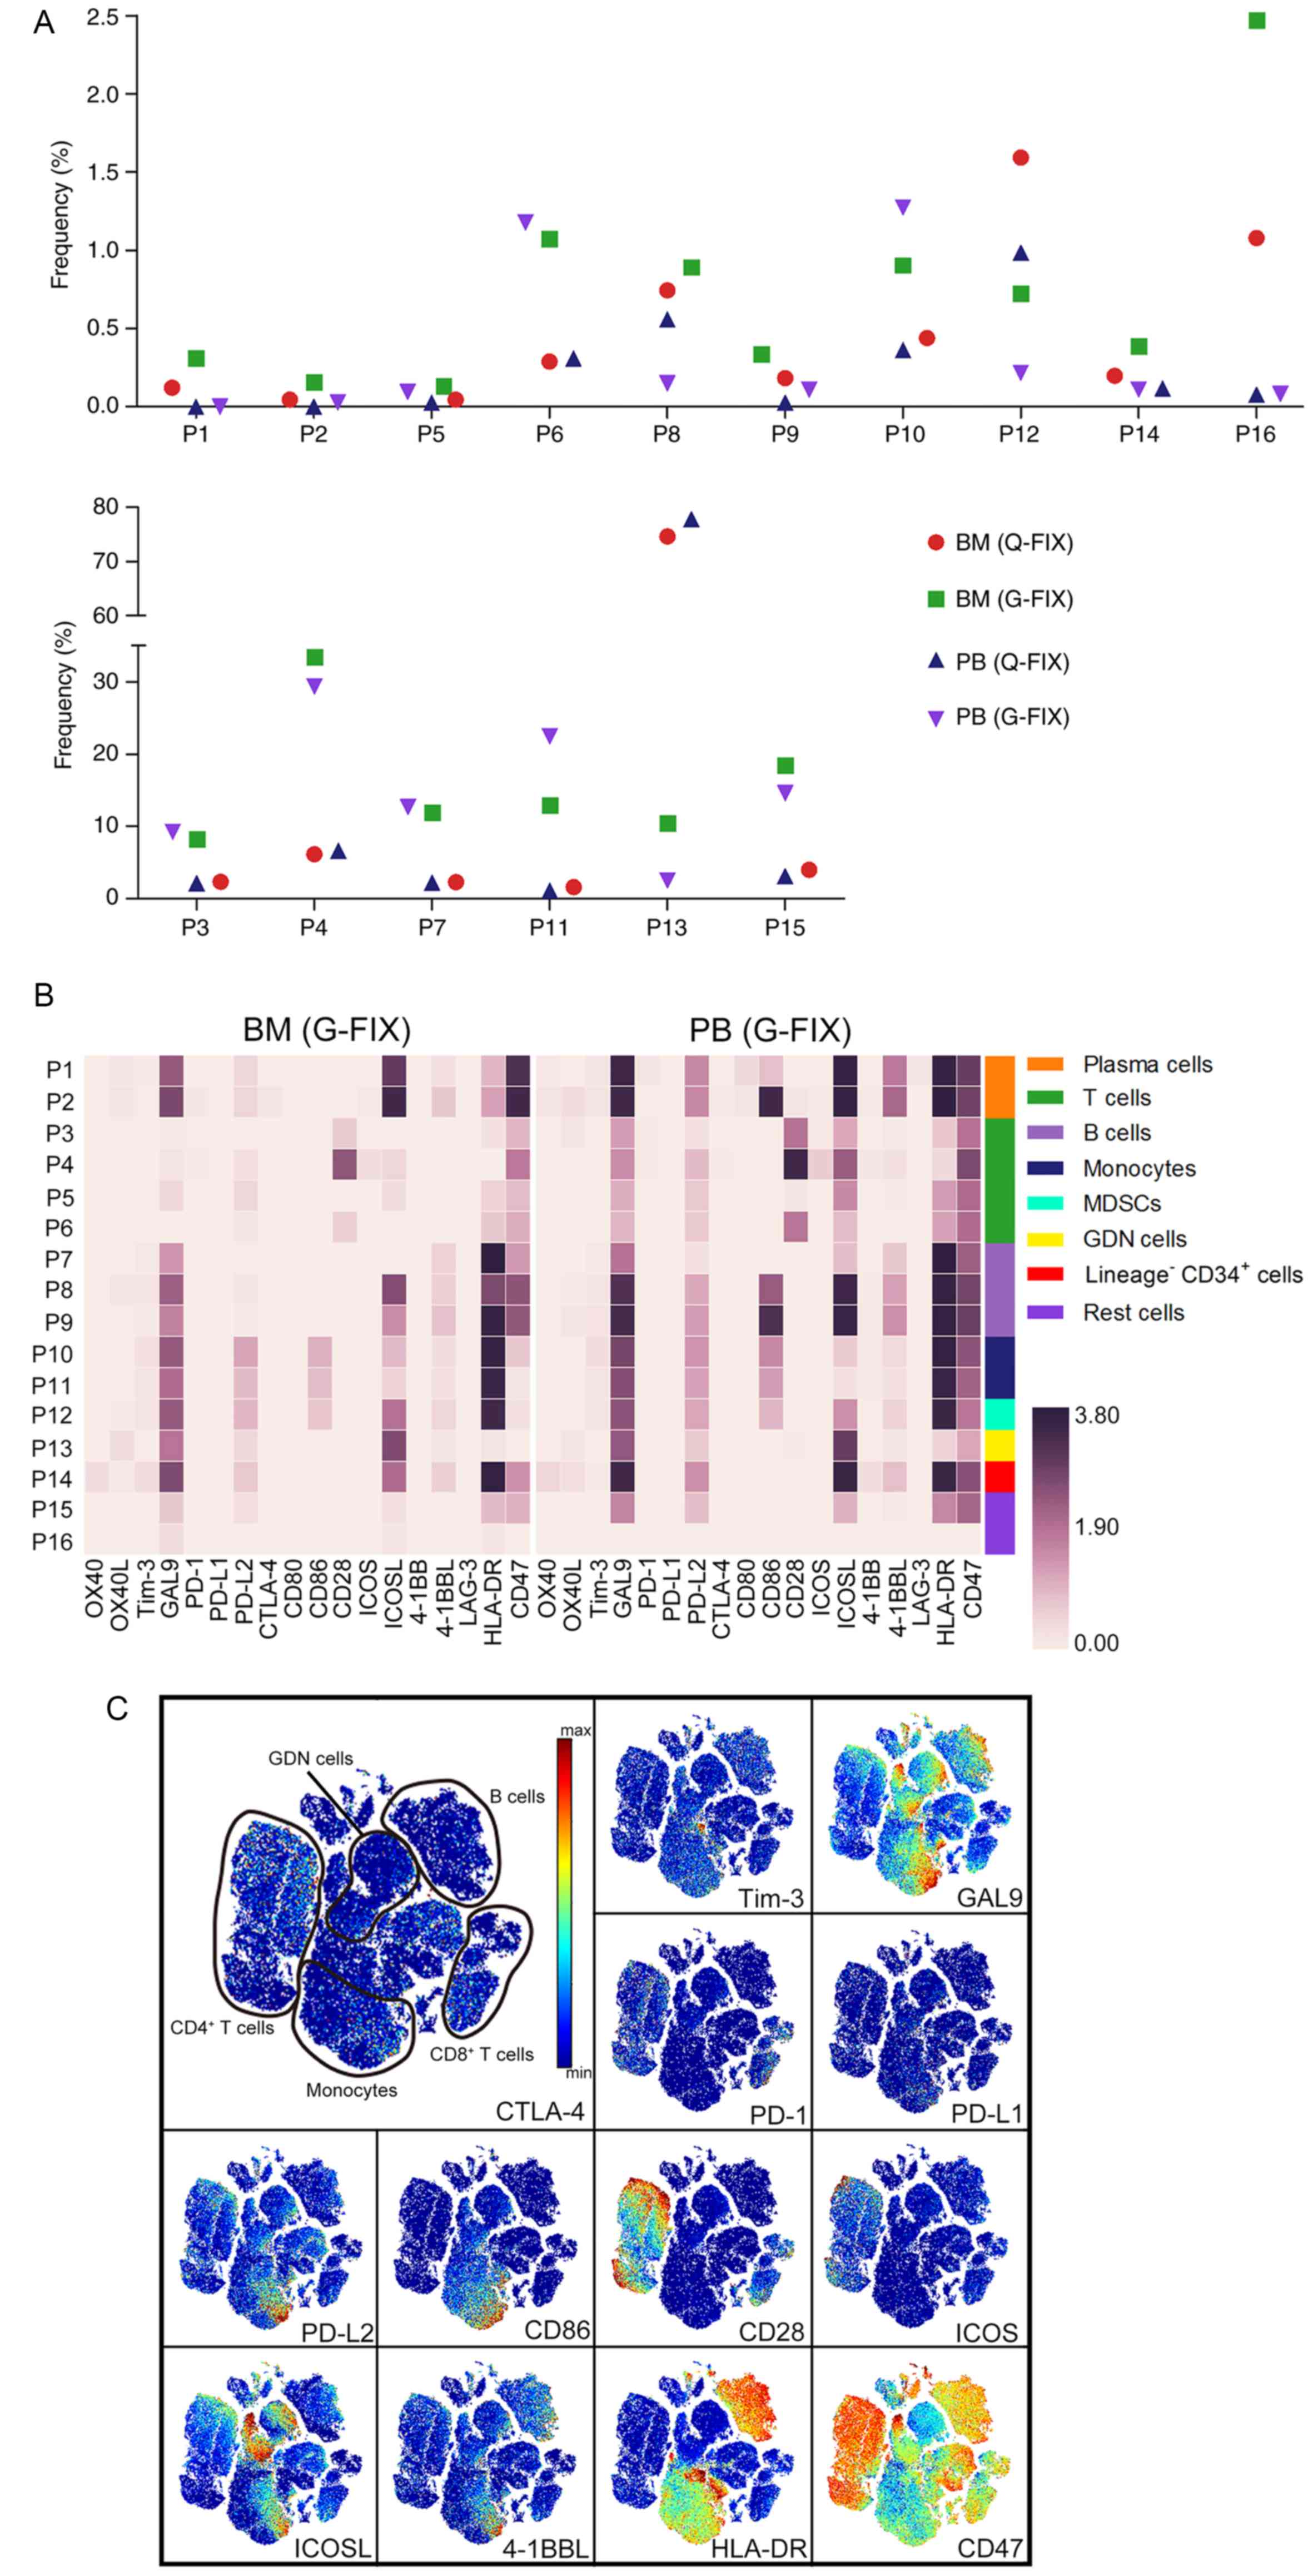
Immune landscape in an AL amyloidosis
patient
We next identified the immune atlas in a patient
newly diagnosed with MM-induced AL amyloidosis accompanied by renal
amyloidosis. Although the proportion of plasma cells (0.12%) was
low in the BM (Fig. 5A), this
patient was still diagnosed with MM and achieved remission after
treatment with anti-MM drugs bortezomib and dexamethasone. We next
used heatmapping and viSNE analysis to systematically visualize the
expression of immunomodulatory molecules in all cell populations
and in the defining marker-based cell distribution map (Figs. 5B and C; S5A and S5B). In total, 29–33% of
CD4+, 32–36% of CD8+, and 14–22% of DN T
cells were PD-1 positive. ICOS+ cells accounted for
34–44, 17–22 and 11–15% of CD4+, CD8+, and DN
T cells, respectively. In all, 86–94% of CD4+, 52–65% of
CD8+, and 48–62% of DN T cells expressed CD28 (Fig. 5D). Less than 11% of CD4+,
CD8+, and DN T cells were confirmed to be activated
(Fig. S5C), and these cells
expressed higher levels of PD-1, ICOS, and CD28 than the other 3 T
cell clusters (Fig. S5D).
Ligand-expressing cells were next analyzed and plasma cells
strongly expressed ICOSL, whereas barely expressed the other
ligands. CD86, PD-L2, and ICOSL were more widely present in the
indicated cell populations than PD-L1 and CD80 (Fig. 5E and F).
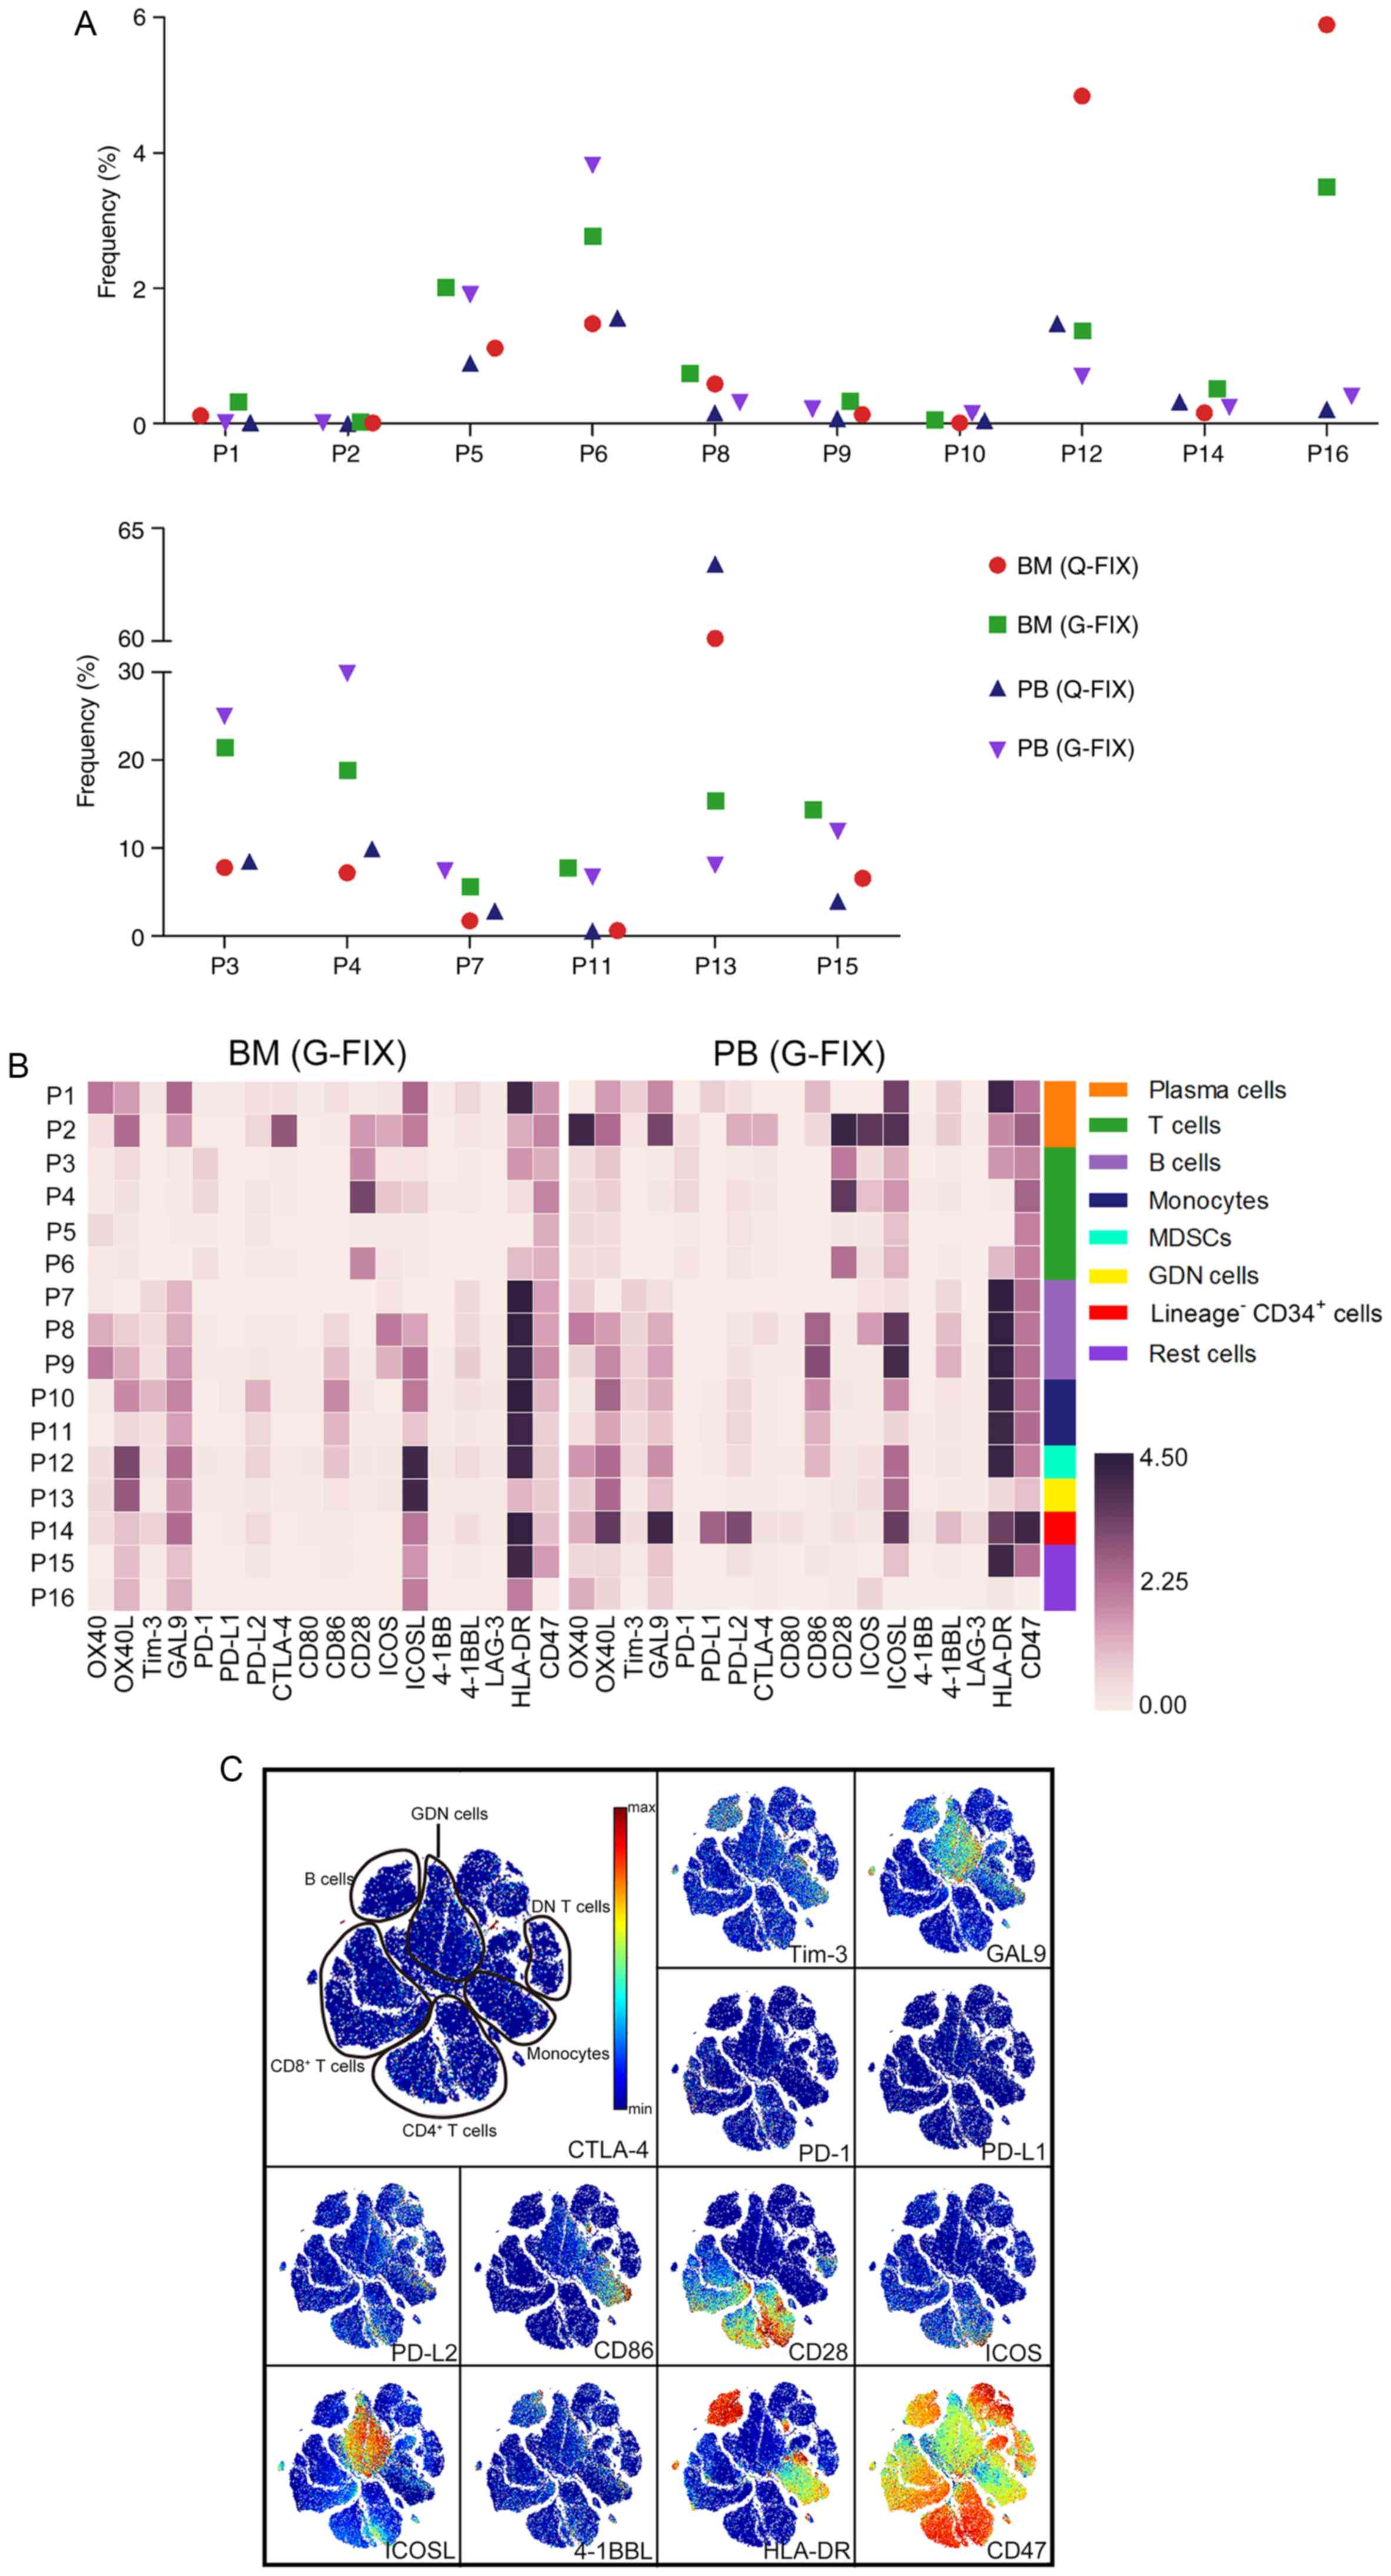
Immune atlas in a SBP patient
A 27-year-old male patient was initially admitted to
the department of stomatology due to consistent swelling of the
gingival mucosa and was later diagnosed with SBP, as myeloma plasma
cells were detected in the gingiva but not the ilium bone marrow.
The immune atlas in the BM and PB of this rare patient was analyzed
by mass cytometry. Similar to the results of FACS, a low proportion
of plasma cells (0.12%) was detected in the BM by mass cytometry
(Fig. 6A). After manual gating, the
frequency of cell populations, the expression of immunomodulatory
molecules in these populations, and two-dimensional maps showing
all marker expression levels were analyzed (Figs. 6B; S6A
and B). Because the expression of PD-1, ICOS, and CD28 was
observed in the T cell populations on the viSNE maps (Fig. 6C), we gated and analyzed these
cells. In all, 15–20% of PD-1+ cells were detected in
CD4+ or CD8+ T cells. The percentage of
ICOS+ cells among CD4+ T cells (30-48%) was
greater than that among CD8+ cells (17-30%). In total,
90–96% of CD4+ T cells and 60–70% of CD8+ T
cells expressed CD28 (Fig. 6D).
Notably, less than 1% of CD4+ and only 4–8% of
CD8+ T cells were activated in this patient (Fig. S6C). Nevertheless, these activated
cells expressed higher levels of PD-1, ICOS, and CD28 (Fig. S6D). In this patient, a minimal
number of non-T cells expressed PD-L1 and CD80, while PD-L2, ICOSL,
and CD86 were provided by plasma cells, monocytes, MDSCs, and GDN
cells (Fig. 6E and F).
Discussion
Although immune checkpoint blockade has been
approved for the treatment of advanced cancer of various
histological types, a low overall response rate and treatment
failure occur in a significant proportion of patients partially due
to inter-individual differences in the phenotype of immune
regulatory checkpoints (21). To
improve the understanding of personal immunity changes in plasma
cell dyscrasias (PCD) patients, we introduced and validated the
mass cytometry-based single-cell analysis of immune regulatory
checkpoints in individuals. The sharp inter-individual
heterogeneity among patients in the immunologic milieu and
unambiguous immune checkpoints networks we explored here emphasizes
the value and necessity of identifying an individual's immune atlas
for selecting the optimum immunotherapy. Moreover, immune
checkpoint-related receptors and ligands in individuals were
summarized, and their expression levels, as well as top 3
providers, were ranked (Fig. 7A),
thus providing an integrative immune checkpoint information for
these patients. Additionally, our high-dimensional dataset not only
validates prior observations but also provides the immune
checkpoint network for each patient (Fig. 7B).
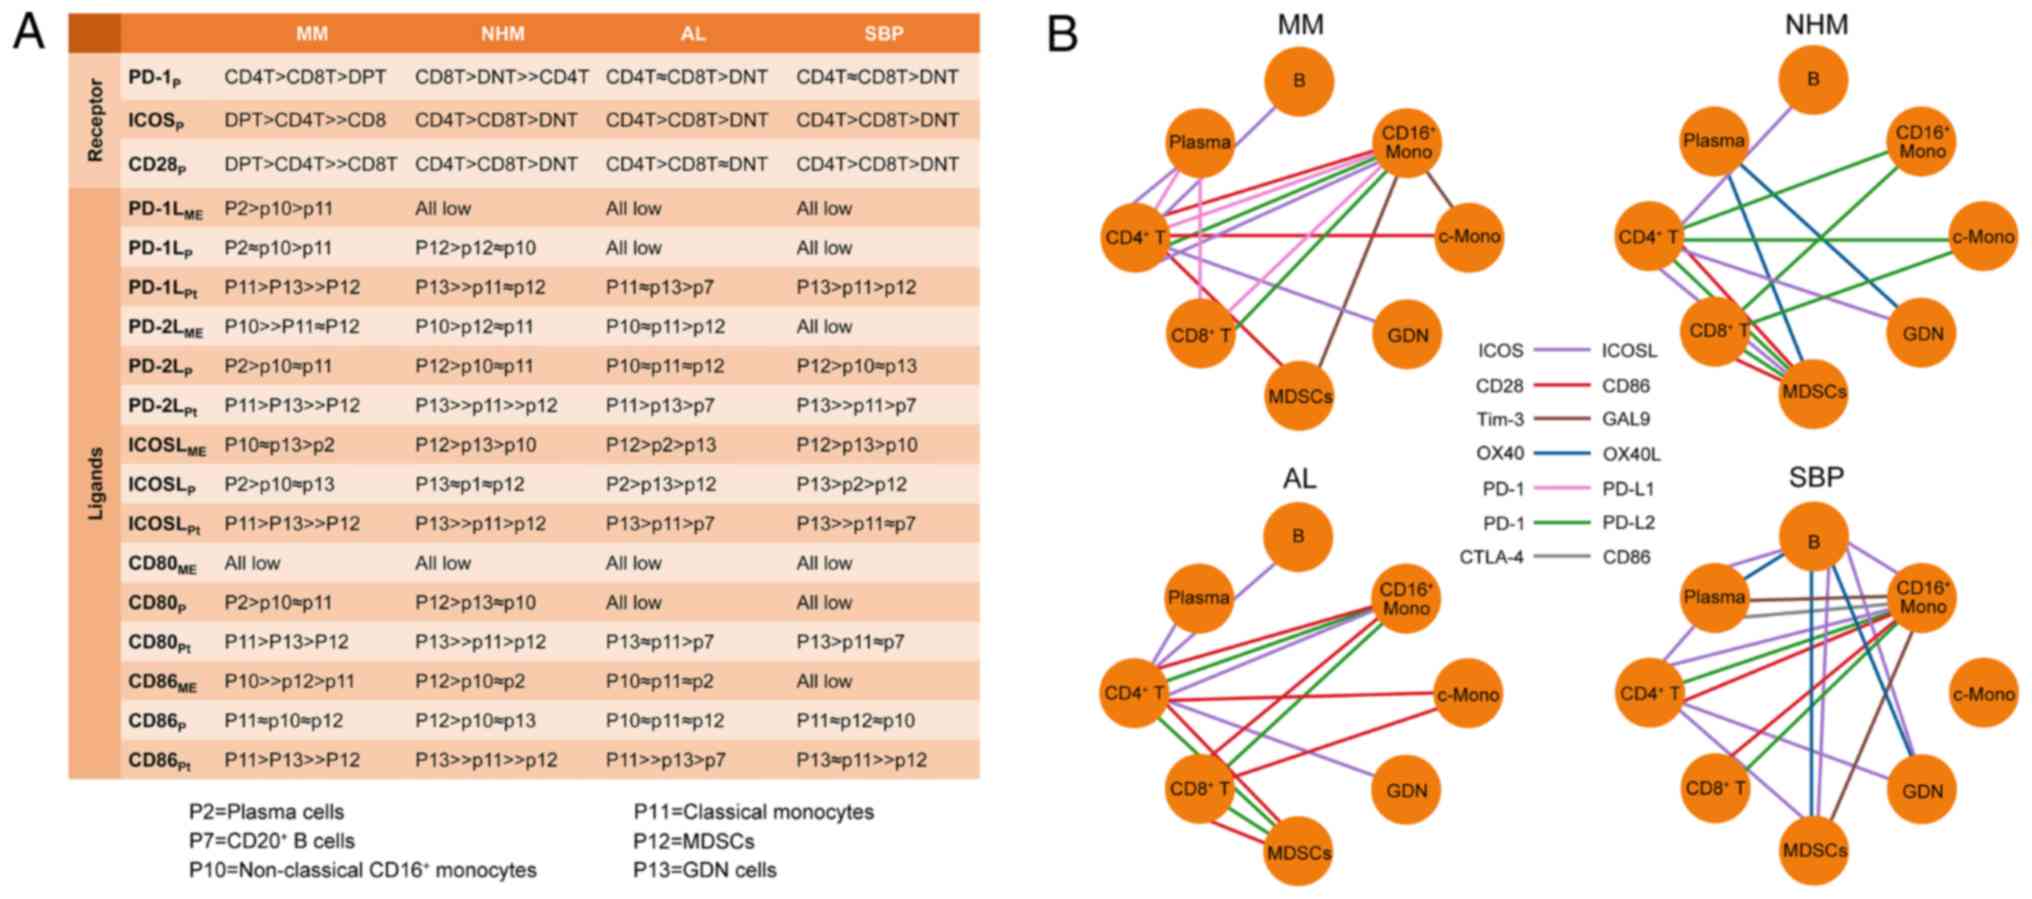 | Figure 7.Immune checkpoints crosstalk in each
patient. (A) Ranks of top 3 providers of each receptor or ligand in
each patient's BM. ME, mean expression on positive cells; P,
percentage of positive cells in subpopulation; Pt, percentage of
positive cells in total cells. (B) The predicted interaction
network of immunomodulatory receptors and ligands between cell
populations based on their expression in different cell
populations. MM, multiple myeloma; NHM, non-hematologic malignancy;
AL, amyloid light-chain; SBP, solitary bone plasmacytoma; MDSC,
myeloid-derived suppressor cells; B, B cells; GDN, granulocytes,
dendritic, and natural killer; Mono, monocytes; c-Mono, classical
monocytes. |
In multiple myeloma (MM), bone marrow (BM)
represents a complex microenvironment with substantial
immunosuppressive elements, including soluble factors, suppressive
extracellular vesicles, myeloid-derived suppressor cells (MDSCs),
regulatory T cells, and MM cells that consistently provide
suppressive signals (39,40). MM cells express PD-L1, which is not
expressed on plasma cells obtained from monoclonal gammopathy of
undetermined significance or healthy donors (41). Enriched PD-1 is expressed on
circulating T cells isolated from advanced MM patients compared to
normal volunteers and its expression in MM patients returns to
normal levels following autologous transplantation (34). In keeping with these findings, our
mass cytometry results from a single MM patient confirmed the
elevated expression of programmed death ligand 1 (PD-L1) on MM
cells and discovered the presence of PD-1-expressing
CD4+ and CD8+ T cells in the BM and PB.
Specifically, BM T cells, except CD28+ cells, expressed
higher levels of PD-1 and ICOS than PB T cells. In addition, PD-L2,
a second ligand for PD-1, which has been demonstrated to inhibit T
cell receptor-mediated proliferation and cytokine production by
CD4+ T cells (42), was
also expressed in MM cells, as well as in monocytes and MDSCs.
As another immune regulatory checkpoint at the
forefront of immunotherapy for cancer, cytotoxic T
lymphocyte-associated protein 4 (CTLA-4) expression was only
detected in small amounts (<10%) of T cells in the MM patient.
In contrast, Zelle-Rieser et al demonstrated that the median
percentages of CTLA-4+ cells among CD4+ and
CD8+ T cells in the BM are 60.5 and 65.8%, respectively;
these percentages are 56.7 and 64.7% in PB CD4+ and
CD8+ T cells, respectively, as summarized from 16 newly
diagnosed MM patients (43).
However, another early study reported a much lower proportion
(<10%) of CTLA-4+ cells among PB CD4+ and
CD8+ T cells from 22 MM patients and demonstrated a
gradual decrease in CTLA-4 expression on T cells with advancing
stage (44). These contradictory
findings may be due to different antibody clones or detection
methods used in these studies.
Indeed, blockade of the PD1-PDL1 pathway using
CT-011, an anti PD-1 antibody, enhances the CTL- and natural killer
(NK) cell-mediated killing of MM cells (34,45,46)
and anti-PD-L2 antibody-mediated blocking of the PD1-PDL-2 axis can
increase the cytotoxicity of in vitro-expanded NK cells
targeting MM cells (47),
suggesting that PD-1 signaling is an important element contributing
to tumor-mediated immune suppression. However, as reported by a
phase 1b clinical trial, the single use of nivolumab, a Food and
Drug Administration-approved PD-1 inhibitor, did not lead to
disease regression in relapsed MM patients (48,49),
suggesting the existence of other decisive contributors to
immunosuppression. Of note, a large proportion of CD4+
and CD8+ T cells was activated even though the MM load
in the BM was very low. These activated CD4+ T cells
express higher levels of PD-1 and ICOS, as well as CD28, which is a
key T cell co-stimulatory receptor that binds to B7 molecules
(50), whereas activated
CD8+ T cells express higher levels of PD-1 and ICOS but
barely express CD28. Downregulation of CD28 is a feature of both
exhaustion and senescence in T cells (51) and is detected in T cells from
high-risk smoldering MM patients compared to healthy individuals
(52). Thus, CD8+ T
cells were initially activated and subsequently exhausted by MM
cells to favor the immune escape of cancer cells. Two recent
studies have provided substantial evidence indicating that CD28 is
strongly preferred as a target of PD-1 signaling and that the
rescue of exhausted CD8+ T cells by PD-1/PD-L1 blockade
is CD28 dependent (53,54). These novel findings, in combined
with our result that most MM CD8+ T cells lack CD28
expression, can at least partially explain why PD-1/PD-L1 blockade
alone cannot alleviate MM progression. According to the personal
immune atlas discovered in the MM patient, we can use a combination
of PD-1/PD-L1 blockade with strategies that restore and strengthen
CD28 signaling to improve immunotherapy.
In the MM patient, a clear subset of CD4+
T cells expressed ICOS, which is a mediator and regulator of helper
T cell immunity and effector T cell differentiation (55), and several cell populations,
including MM cells, MDSCs, and monocytes, provide its ligand,
ICOSL, for them. In keeping with this mechanism, a previous study
has reported that MM patients present a higher percentage of
ICOS+ cells in follicular helper T cells than healthy
controls (56). In an in
vitro experiment, ICOS/ICOSL blockade significantly inhibited
the generation of MM cell-induced TReg
(CD4+CD25+FoxP3+) cells (57), and lenalidomide, a clinically
verified anti-MM immunomodulatory drug, downregulated ICOSL
expression in MM cells (58) and
enhanced PD-1/PD-L1 blockade-induced immune response in MM patients
(59), underscoring ICOS/ICOSL
blockade as a possible anti-MM immunotherapeutic sponsor and
enhancer. The fact that large numbers of granulocytes removed by
density gradient centrifugation offer the highest expression of
PD-L1 and ICOSL highlights the importance of granulocytes in
regulating immune-checkpoints. Thus, these cells should be
considered when developing new immunotherapeutic strategies.
Very few details of immune checkpoints in AL and SBP
patients have been discovered. Our results directly provide
comprehensive insights into the immune status of these individual
patients. In these patients, we were unable to detect a large
proportion of activated (HLA-DR+CD38+) and
exhausted (CD28−) CD8+ T cells. Although
>50% of CD28+ cells were detected in CD8+
T cell population from these 3 patients, the activation of these
cells was deficient, indicating a lack of stimulators. Because
malignant plasma cells are located in various bone tissues in AL
amyloidosis, and solitary bone plasmacytoma (SBP) patients, the
absence of these cells in the ilium BM may be the cause of
CD8+ T cell inactivation. Predictably, the discovery of
the state of PD-1, ICOS, and CD28 expression on T cells and the
providers for their ligands in an individual patient will direct
the formulation of personalized treatment. Importantly, other
immune checkpoints axes, including inhibitory signaling by
Tim-3-GAL9 and LAG-3-HLA-DR (60),
and the stimulatory pathways OX40-OX40L and 4–1BB-4-1BBL (61,62),
are more or less presented in multiple cell subsets aside from T
cells. These interactions ought to be meaningful for understanding
the immune regulation in the tumor microenvironment during
malignant neoplasm development, and they need to be validated in
the future. Moreover, the strong expression of CD47 which serves as
an inhibitory receptor, was widely detected in the malignant plasma
cells and leukocytes of all 4 patients. Elevated CD47 expression
has been shown to regulate tumor metastasis and dissemination in
several hematologic malignancies and to be associated with a poorer
clinical prognosis (63). CD47
blockade stimulates the phagocytosis of cancer cells by macrophages
and triggers the T cell-mediated death of immunogenic tumors
(64). Furthermore, a variety of
therapeutics targeting CD47 singling are currently under
investigation in preclinical models and clinical trials for both
solid and hematologic malignancies (65). The common expression of CD47 found
in these 3 PCD patients provides a clinical indication for
targeting this pathway.
Although our findings provide extensive systemic
onco-immune information for individuals, several underlying
limitations are raised with it. First, our antibody panel only
covers the markers for gating general cell populations due to the
restriction of available channels, leading to the missing of
detailed information in T cell subsets, NK cells, and dendritic
cell (DC) clusters. Second, data collected by mass cytometry from
individuals were finely analyzed by various verified computational
analyses, but follow-up preclinical and clinical studies are needed
to validate these information-conducted precision medicine
approaches. Third, although the main objective of this study was to
explore the personal immunologic milieu using mass cytometry
technology, the quantity of cases was low; therefore, single-cell
analysis of more patients and healthy donors should be performed to
discover changes in the regulation of immune checkpoints in
specific PCD subtypes. Nevertheless, our successful identification
of the personalized immune atlas in these patients demonstrates the
promise of applying mass cytometry-based single-cell analysis for
better understanding the immune transition during cancer
progression and in monitoring the individual onco-immune status,
thereby promoting the selection of appropriate immunotherapies and
concretely benefitting patients.
Supplementary Material
Supporting Data
Acknowledgements
We thank Professor Yongliang Huo from Guangzhou
Medical University for critical review of the manuscript.
Funding
This study was supported by the National Natural
Science Foundation of China (grant nos. 81700203 and 81970193) and
the Guangdong Basic and Applied Basic Research Foundation (project
nos. 2019A1515011126 and 2019A1515011327).
Availability of data and materials
The data that support the findings of this study are
available from the corresponding author upon reasonable
request.
Authors' contributions
JW conceived the research idea and supervised the
experiments. JW implemented the experiments together with
assistance from CT,YZ and HZ. YZ collected the samples from the
patients. JW, CT and HZ analyzed the data and wrote the manuscript
with suggestions from YZ. All authors read and approved the final
manuscript and agree to be accountable for all aspects of the
research in ensuring that the accuracy or integrity of any part of
the work are appropriately investigated and resolved.
Ethics approval and consent to
participate
Patient samples were collected from patients at the
Third Affiliated Hospital of Sun Yat-sen University (Guangzhou,
Guangdong, China) after obtaining patient informed consent. All
protocols were reviewed and approved by the Third Affiliated
Hospital of Sun Yat-sen University Ethics Committee.
Patient consent for publication
Not applicable.
Competing interests
The authors declare that they have no competing
interests.
References
|
1
|
Newell EW and Cheng Y: Mass cytometry:
Blessed with the curse of dimensionality. Nat Immunol. 17:890–895.
2016. View
Article : Google Scholar : PubMed/NCBI
|
|
2
|
Spitzer MH and Nolan GP: Mass cytometry:
Single cells, many features. Cell. 165:780–791. 2016. View Article : Google Scholar : PubMed/NCBI
|
|
3
|
Wang Z, Gerstein M and Snyder M: RNA-Seq:
A revolutionary tool for transcriptomics. Nat Rev Genet. 10:57–63.
2009. View
Article : Google Scholar : PubMed/NCBI
|
|
4
|
Stegle O, Teichmann SA and Marioni JC:
Computational and analytical challenges in single-cell
transcriptomics. Nat Rev Genet. 16:133–145. 2015. View Article : Google Scholar : PubMed/NCBI
|
|
5
|
Bendall SC, Simonds EF, Qiu P, Amir el-AD,
Krutzik PO, Finck R, Bruggner RV, Melamed R, Trejo A, Ornatsky OI,
et al: Single-cell mass cytometry of differential immune and drug
responses across a human hematopoietic continuum. Science.
332:687–696. 2011. View Article : Google Scholar : PubMed/NCBI
|
|
6
|
Bodenmiller B, Zunder ER, Finck R, Chen
TJ, Savig ES, Bruggner RV, Simonds EF, Bendall SC, Sachs K, Krutzik
PO and Nolan GP: Multiplexed mass cytometry profiling of cellular
states perturbed by small-molecule regulators. Nat Biotechnol.
30:858–867. 2012. View Article : Google Scholar : PubMed/NCBI
|
|
7
|
Bendall SC, Davis KL, Amir el-AD, Tadmor
MD, Simonds EF, Chen TJ, Shenfeld DK, Nolan GP and Pe'er D:
Single-cell trajectory detection uncovers progression and
regulatory coordination in human B cell development. Cell.
157:714–725. 2014. View Article : Google Scholar : PubMed/NCBI
|
|
8
|
Good Z, Sarno J, Jager A, Samusik N,
Aghaeepour N, Simonds EF, White L, Lacayo NJ, Fantl WJ, Fazio G, et
al: Single-cell developmental classification of B cell precursor
acute lymphoblastic leukemia at diagnosis reveals predictors of
relapse. Nat Med. 24:474–483. 2018. View Article : Google Scholar : PubMed/NCBI
|
|
9
|
Behbehani GK, Bendall SC, Clutter MR,
Fantl WJ and Nolan GP: Single-cell mass cytometry adapted to
measurements of the cell cycle. Cytometry A. 81:552–566. 2012.
View Article : Google Scholar : PubMed/NCBI
|
|
10
|
Knapp DJ, Hammond CA, Aghaeepour N, Miller
PH, Pellacani D, Beer PA, Sachs K, Qiao W, Wang W, Humphries RK, et
al: Distinct signaling programs control human hematopoietic stem
cell survival and proliferation. Blood. 129:307–318. 2017.
View Article : Google Scholar : PubMed/NCBI
|
|
11
|
Porpiglia E, Samusik N, Ho ATV, Cosgrove
BD, Mai T, Davis KL, Jager A, Nolan GP, Bendall SC, Fantl WJ and
Blau HM: High-resolution myogenic lineage mapping by single-cell
mass cytometry. NaT Cell Biol. 19:558–567. 2017. View Article : Google Scholar : PubMed/NCBI
|
|
12
|
Qiu P, Simonds EF, Bendall SC, Gibbs KD
Jr, Bruggner RV, Linderman MD, Sachs K, Nolan GP and Plevritis SK:
Extracting a cellular hierarchy from high-dimensional cytometry
data with SPADE. Nat Biotechnol. 29:886–891. 2011. View Article : Google Scholar : PubMed/NCBI
|
|
13
|
Amir el-AD, Davis KL, Tadmor MD, Simonds
EF, Levine JH, Bendall SC, Shenfeld DK, Krishnaswamy S, Nolan GP
and Pe'er D: viSNE enables visualization of high dimensional
single-cell data and reveals phenotypic heterogeneity of leukemia.
Nat Biotechnol. 31:545–552. 2013. View Article : Google Scholar : PubMed/NCBI
|
|
14
|
Lavin Y, Kobayashi S, Leader A, Amir ED,
Elefant N, Bigenwald C, Remark R, Sweeney R, Becker CD, Levine JH,
et al: Innate immune landscape in early lung adenocarcinoma by
paired single-cell analyses. Cell. 169:750–765.e17. 2017.
View Article : Google Scholar : PubMed/NCBI
|
|
15
|
Minn AJ and Wherry EJ: combination cancer
therapies with immune checkpoint blockade: Convergence on
interferon signaling. Cell. 165:272–275. 2016. View Article : Google Scholar : PubMed/NCBI
|
|
16
|
June CH, O'Connor RS, Kawalekar OU,
Ghassemi S and Milone MC: CAR T cell immunotherapy for human
cancer. Science. 359:1361–1365. 2018. View Article : Google Scholar : PubMed/NCBI
|
|
17
|
Syn NL, Teng MWL, Mok TSK and Soo RA:
De-novo and acquired resistance to immune checkpoint targeting.
Lancet Oncol. 18:e731–e741. 2017. View Article : Google Scholar : PubMed/NCBI
|
|
18
|
Dougall WC, Roman Aguilera A and Smyth MJ:
Dual targeting of RANKL and PD-1 with a bispecific antibody
improves anti-tumor immunity. Clin Transl Immunol. 8:e010812019.
View Article : Google Scholar
|
|
19
|
Topalian SL, Taube JM, Anders RA and
Pardoll DM: Mechanism-driven biomarkers to guide immune checkpoint
blockade in cancer therapy. Nat Rev Cancer. 16:275–287. 2016.
View Article : Google Scholar : PubMed/NCBI
|
|
20
|
Oliver AJ, Davey AS, Keam SP, Mardiana S,
Chan JD, von Scheidt B, Beavis PA, House IG, Van Audernaerde JR,
Darcy PK, et al: Tissue-specific tumor microenvironments influence
responses to immunotherapies. Clin Transl Immunol. 8:e10942019.
View Article : Google Scholar
|
|
21
|
Pitt JM, Vétizou M, Daillère R, Roberti
MP, Yamazaki T, Routy B, Lepage P, Boneca IG, Chamaillard M,
Kroemer G and Zitvogel L: Resistance mechanisms to
immune-checkpoint blockade in cancer: Tumor-intrinsic and
-extrinsic factors. Immunity. 44:1255–1269. 2016. View Article : Google Scholar : PubMed/NCBI
|
|
22
|
Wilson RAM, Evans TRJ, Fraser AR and Nibbs
RJB: Immune checkpoint inhibitors: New strategies to checkmate
cancer. Clin Exp Immunol. 191:133–148. 2018. View Article : Google Scholar : PubMed/NCBI
|
|
23
|
Marhelava K, Pilch Z, Bajor M,
Graczyk-Jarzynka A and Zagozdzon R: Targeting negative and positive
immune checkpoints with monoclonal antibodies in therapy of cancer.
Cancers. 11:17562019. View Article : Google Scholar
|
|
24
|
Bhandaru M and Rotte A: monoclonal
antibodies for the treatment of melanoma: Present and future
strategies. Methods Mol Biol. 1904:83–108. 2019. View Article : Google Scholar : PubMed/NCBI
|
|
25
|
Rowshanravan B, Halliday N and Sansom DM:
CTLA-4: A moving target in immunotherapy. Blood. 131:58–67. 2018.
View Article : Google Scholar : PubMed/NCBI
|
|
26
|
Ribas A and Wolchok JD: Cancer
immunotherapy using checkpoint blockade. Science. 359:1350–1355.
2018. View Article : Google Scholar : PubMed/NCBI
|
|
27
|
Jiang C, Cao S, Li N, Jiang L and Sun T:
PD-1 and PD-L1 correlated gene expression profiles and their
association with clinical outcomes of breast cancer. Cancer Cell
Int. 19:2332019. View Article : Google Scholar : PubMed/NCBI
|
|
28
|
Wang X, Guo G, Guan H, Yu Y, Lu J and Yu
J: Challenges and potential of PD-1/PD-L1 checkpoint blockade
immunotherapy for glioblastoma. J Exp Clin Cancer Res. 38:872019.
View Article : Google Scholar : PubMed/NCBI
|
|
29
|
Gettinger S, Choi J, Hastings K, Truini A,
Datar I, Sowell R, Wurtz A, Dong W, Cai G, Melnick MA, et al:
Impaired HLA class I antigen processing and presentation as a
mechanism of acquired resistance to immune checkpoint inhibitors in
lung cancer. Cancer Discov. 7:1420–1435. 2017. View Article : Google Scholar : PubMed/NCBI
|
|
30
|
Chevrier S, Levine JH, Zanotelli VRT,
Silina K, Schulz D, Bacac M, Ries CH, Ailles L, Jewett MAS, Moch H,
et al: An immune atlas of clear cell renal cell carcinoma. Cell.
169:736–749.e18. 2017. View Article : Google Scholar : PubMed/NCBI
|
|
31
|
Krieg C, Nowicka M, Guglietta S, Schindler
S, Hartmann FJ, Weber LM, Dummer R, Robinson MD, Levesque MP and
Becher B: High-dimensional single-cell analysis predicts response
to anti-PD-1 immunotherapy. Nat Med. 24:144–153. 2018. View Article : Google Scholar : PubMed/NCBI
|
|
32
|
Heher EC, Goes NB, Spitzer TR, Raje NS,
Humphreys BD, Anderson KC and Richardson PG: Kidney disease
associated with plasma cell dyscrasias. Blood. 116:1397–1404. 2010.
View Article : Google Scholar : PubMed/NCBI
|
|
33
|
Suen H, Brown R, Yang S, Ho PJ, Gibson J
and Joshua D: The failure of immune checkpoint blockade in multiple
myeloma with PD-1 inhibitors in a phase 1 study. Leukemia.
29:1621–1622. 2015. View Article : Google Scholar : PubMed/NCBI
|
|
34
|
Rosenblatt J, Glotzbecker B, Mills H,
Vasir B, Tzachanis D, Levine JD, Joyce RM, Wellenstein K, Keefe W,
Schickler M, et al: PD-1 blockade by CT-011, anti-PD-1 antibody,
enhances ex vivo T-cell responses to autologous dendritic
cell/myeloma fusion vaccine. J Immunother. 34:409–418. 2011.
View Article : Google Scholar : PubMed/NCBI
|
|
35
|
Ray A, Das DS, Song Y, Richardson P,
Munshi NC, Chauhan D and Anderson KC: Targeting PD1-PDL1 immune
checkpoint in plasmacytoid dendritic cell interactions with T
cells, natural killer cells and multiple myeloma cells. Leukemia.
29:1441–1444. 2015. View Article : Google Scholar : PubMed/NCBI
|
|
36
|
Jelinek T, Paiva B and Hajek R: Update on
PD-1/PD-L1 inhibitors in multiple myeloma. Front Immunol.
9:24312018. View Article : Google Scholar : PubMed/NCBI
|
|
37
|
Kotecha N, Krutzik PO and Irish JM:
Web-based analysis and publication of flow cytometry experiments.
Curr Protoc Cytom 10: Unit. 10:2010.
|
|
38
|
Maecker HT, McCoy JP and Nussenblatt R:
Standardizing immunophenotyping for the human immunology project.
Nat Rev Immunol. 12:191–200. 2012. View Article : Google Scholar : PubMed/NCBI
|
|
39
|
Wang J, Hendrix A, Hernot S, Lemaire M, De
Bruyne E, Van Valckenborgh E, Lahoutte T, De Wever O, Vanderkerken
K and Menu E: Bone marrow stromal cell-derived exosomes as
communicators in drug resistance in multiple myeloma cells. Blood.
124:555–566. 2014. View Article : Google Scholar : PubMed/NCBI
|
|
40
|
Wang J, De Veirman K, Faict S, Frassanito
MA, Ribatti D, Vacca A and Menu E: Multiple myeloma exosomes
establish a favourable bone marrow microenvironment with enhanced
angiogenesis and immunosuppression. J Pathol. 239:162–173. 2016.
View Article : Google Scholar : PubMed/NCBI
|
|
41
|
Liu J, Hamrouni A, Wolowiec D, Coiteux V,
Kuliczkowski K, Hetuin D, Saudemont A and Quesnel B: Plasma cells
from multiple myeloma patients express B7-H1 (PD-L1) and increase
expression after stimulation with IFN-{gamma} and TLR ligands via a
MyD88-, TRAF6-, and MEK-dependent pathway. Blood. 110:296–304.
2007. View Article : Google Scholar : PubMed/NCBI
|
|
42
|
Latchman Y, Wood CR, Chernova T, Chaudhary
D, Borde M, Chernova I, Iwai Y, Long AJ, Brown JA, Nunes R, et al:
PD-L2 is a second ligand for PD-1 and inhibits T cell activation.
Nat Immunol. 2:261–268. 2001. View
Article : Google Scholar : PubMed/NCBI
|
|
43
|
Zelle-Rieser C, Thangavadivel S,
Biedermann R, Brunner A, Stoitzner P, Willenbacher E, Greil R and
Jöhrer K: T cells in multiple myeloma display features of
exhaustion and senescence at the tumor site. J Hematol Oncol.
9:1162016. View Article : Google Scholar : PubMed/NCBI
|
|
44
|
Mozaffari F, Hansson L, Kiaii S, Ju X,
Rossmann ED, Rabbani H, Mellstedt H and Osterborg A: Signalling
molecules and cytokine production in T cells of multiple
myeloma-increased abnormalities with advancing stage. Br J
Haematol. 124:315–324. 2004. View Article : Google Scholar : PubMed/NCBI
|
|
45
|
Benson DM Jr, Bakan CE, Mishra A,
Hofmeister CC, Efebera Y, Becknell B, Baiocchi RA, Zhang J, Yu J,
Smith MK, et al: The PD-1/PD-L1 axis modulates the natural killer
cell versus multiple myeloma effect: A therapeutic target for
CT-011, a novel monoclonal anti-PD-1 antibody. Blood.
116:2286–2294. 2010. View Article : Google Scholar : PubMed/NCBI
|
|
46
|
Dong W, Wu X, Ma S, Wang Y, Nalin AP, Zhu
Z, Zhang J, Benson DM, He K, Caligiuri MA and Yu J: The mechanism
of anti-PD-L1 antibody efficacy against PD-L1-negative tumors
identifies NK cells expressing PD-L1 as a cytolytic effector.
Cancer Discov. 9:1422–1437. 2019. View Article : Google Scholar : PubMed/NCBI
|
|
47
|
Guo Y, Feng X, Jiang Y, Shi X, Xing X, Liu
X, Li N, Fadeel B and Zheng C: PD1 blockade enhances cytotoxicity
of in vitro expanded natural killer cells towards myeloma cells.
Oncotarget. 7:48360–48374. 2016. View Article : Google Scholar : PubMed/NCBI
|
|
48
|
Lesokhin AM, Ansell SM, Armand P, Scott
EC, Halwani A, Gutierrez M, Millenson MM, Cohen AD, Schuster SJ,
Lebovic D, et al: Nivolumab in patients with relapsed or refractory
hematologic malignancy: Preliminary results of a phase Ib study. J
Clin Oncol. 34:2698–2704. 2016. View Article : Google Scholar : PubMed/NCBI
|
|
49
|
Rosenblatt J and Avigan D: Targeting the
PD-1/PD-L1 axis in multiple myeloma: A dream or a reality? Blood.
129:275–279. 2017. View Article : Google Scholar : PubMed/NCBI
|
|
50
|
Esensten JH, Helou YA, Chopra G, Weiss A
and Bluestone JA: CD28 costimulation: From mechanism to therapy.
Immunity. 44:973–988. 2016. View Article : Google Scholar : PubMed/NCBI
|
|
51
|
Akbar AN and Henson SM: Are senescence and
exhaustion intertwined or unrelated processes that compromise
immunity? Nat Rev Immunol. 11:289–295. 2011. View Article : Google Scholar : PubMed/NCBI
|
|
52
|
Paiva B, Mateos MV, Sanchez-Abarca LI,
Puig N, Vidriales MB, López-Corral L, Corchete LA, Hernandez MT,
Bargay J, de Arriba F, et al: Spanish myeloma group/program study
and treatment of hematological malignancies cooperative study
groups: Immune status of high-risk smoldering multiple myeloma
patients and its therapeutic modulation under LenDex: A
longitudinal analysis. Blood. 127:1151–1162. 2016. View Article : Google Scholar : PubMed/NCBI
|
|
53
|
Hui E, Cheung J, Zhu J, Su X, Taylor MJ,
Wallweber HA, Sasmal DK, Huang J, Kim JM, Mellman I and Vale RD: T
cell costimulatory receptor CD28 is a primary target for
PD-1-mediated inhibition. Science. 355:1428–1433. 2017. View Article : Google Scholar : PubMed/NCBI
|
|
54
|
Kamphorst AO, Wieland A, Nasti T, Yang S,
Zhang R, Barber DL, Konieczny BT, Daugherty CZ, Koenig L, Yu K, et
al: Rescue of exhausted CD8 T cells by PD-1-targeted therapies is
CD28-dependent. Science. 355:1423–1427. 2017. View Article : Google Scholar : PubMed/NCBI
|
|
55
|
Wikenheiser DJ and Stumhofer JS: ICOS
co-stimulation: Friend or foe? Front Immunol. 7:3042016. View Article : Google Scholar : PubMed/NCBI
|
|
56
|
Zhou DM, Xu YX, Zhang LY, Sun Y, Wang ZY,
Yuan YQ and Fu JX: The role of follicular T helper cells in
patients with malignant lymphoid disease. Hematology. 22:412–418.
2017. View Article : Google Scholar : PubMed/NCBI
|
|
57
|
Feyler S, Scott GB, Parrish C, Jarmin S,
Evans P, Short M, McKinley K, Selby PJ and Cook G: Tumour cell
generation of inducible regulatory T-cells in multiple myeloma is
contact-dependent and antigen-presenting cell-independent. PLoS
One. 7:e359812012. View Article : Google Scholar : PubMed/NCBI
|
|
58
|
Scott GB, Carter C, Parrish C, Wood PM and
Cook G: Downregulation of myeloma-induced ICOS-L and regulatory T
cell generation by lenalidomide and dexamethasone therapy. Cell
Immunol. 297:1–9. 2015. View Article : Google Scholar : PubMed/NCBI
|
|
59
|
Görgün G, Samur MK, Cowens KB, Paula S,
Bianchi G, Anderson JE, White RE, Singh A, Ohguchi H, Suzuki R, et
al: Lenalidomide enhances immune checkpoint blockade-induced immune
response in multiple myeloma. Clin Cancer Res. 21:4607–4618. 2015.
View Article : Google Scholar : PubMed/NCBI
|
|
60
|
Perez-Gracia JL, Labiano S, Rodriguez-Ruiz
ME, Sanmamed MF and Melero I: Orchestrating immune check-point
blockade for cancer immunotherapy in combinations. Curr Opin
Immunol. 27:89–97. 2014. View Article : Google Scholar : PubMed/NCBI
|
|
61
|
Goulding J, Tahiliani V and Salek-Ardakani
S: OX40:OX40L axis: Emerging targets for improving poxvirus-based
CD8(+) T-cell vaccines against respiratory viruses. Immunol Rev.
244:149–168. 2011. View Article : Google Scholar : PubMed/NCBI
|
|
62
|
Chester C, Sanmamed MF, Wang J and Melero
I: Immunotherapy targeting 4-1BB: Mechanistic rationale, clinical
results, and future strategies. Blood. 131:49–57. 2018. View Article : Google Scholar : PubMed/NCBI
|
|
63
|
Chao MP, Weissman IL and Majeti R: The
CD47-SIRPα pathway in cancer immune evasion and potential
therapeutic implications. Curr Opin Immunol. 24:225–232. 2012.
View Article : Google Scholar : PubMed/NCBI
|
|
64
|
Liu X, Pu Y, Cron K, Deng L, Kline J,
Frazier WA, Xu H, Peng H, Fu YX and Xu MM: CD47 blockade triggers T
cell-mediated destruction of immunogenic tumors. Nat Med.
21:1209–1215. 2015. View Article : Google Scholar : PubMed/NCBI
|
|
65
|
Weiskopf K: Cancer immunotherapy targeting
the CD47/SIRPα axis. Eur J Cancer. 76:100–109. 2017. View Article : Google Scholar : PubMed/NCBI
|