Introduction
Breast cancer is the most common type of cancer in
women worldwide (1). In China, the
incidence of breast cancer has increased in recent decades, and it
is estimated to account for 15% of all newly diagnosed cases of
cancer in women (1). The
Tumor-Node-Metastasis staging system (2), histological grade, lymph node status,
estrogen receptor (ER), progestogen receptor (PR) and human
epidermal growth factor receptor 2 (HER2) status are commonly used
biological indicators for breast cancer diagnosis, treatment and
prognosis assessment (2). Although
these indicators have consistent clinical outcomes in several
patients with breast cancer, other patients with a similar
combination of these features can respond differently to treatment,
and have a variable prognosis status (3). Therefore, novel biomarkers and methods
are required to improve the accuracy of diagnosis and prognosis,
and to facilitate the determination of the most appropriate
treatment for patients with breast cancer on an individual
basis.
MicroRNAs (miRNAs/miRs) are RNAs of ~22 nucleotides
that primarily function in regulating gene expression via several
mechanisms (4). Dysregulation of
miRNAs is involved in the initiation and progression of several
types of cancer, including breast cancer (5–9).
Studies have demonstrated that several upregulated miRNAs can
regulate numerous functional genes and influence tumor development
or metastasis (5–7). Upregulation of miR21, miR27a, miR155
and miR206 expression has been detected in breast tumor tissues and
several human breast cancer cell lines, and was demonstrated to
serve a crucial role in all phases of breast cancer pathogenesis
(5). The expression levels of Let-7
family members are downregulated in breast cancer, and low let-7
expression is associated with a less favorable prognosis (6). As a driver of metastasis, miR10b binds
to Homeobox D10, and enhances cell migration and invasion (7). Due to their evolutionary conservation
and relatively easy means of detection in tumor biopsies, several
miRNAs have been proposed as promising biomarkers of breast cancer
(8). Numerous studies have revealed
that the combination of several prognosis-associated miRNAs may be
used to differentiate breast tumors from normal breast tissues with
a high degree of accuracy (8,9).
However, these miRNA markers are typically screened from a small
group of patients (<100), and thus require validation in larger
datasets and cohorts to verify the applicability in the general
population.
The interaction between miRNAs and their target
genes affects multiple biological functions and patient prognosis
in patients with breast cancer (10). The determination of the binding
characteristics to target mRNAs by miRNAs is important in defining
their functions. Several computational algorithms have been
developed and implemented as software tools for miRNA target
prediction (11–15). The major features of these
prediction tools are the sequence composition (seed match),
conservation and thermodynamic stability (free energy) (16). Considering that each algorithm has
its limitations, the combined use of these tools should result in
more accurate results (16). The
aim of the present study was to determine the hub miRNAs in breast
cancer using multiple bioinformatics approaches combined with
target gene prediction to explore the potential carcinogenic
mechanisms of the identified miRNAs.
Materials and methods
Breast cancer data collection
Breast cancer transcriptome data (including mRNA and
miRNA expression) and clinical data were acquired from The Cancer
Genome Atlas (TCGA) database (cancergenome.nih.gov/). Non-solid tumor samples or
patients who lacked prognostic data were removed. The filtered
female samples contained 1,076 breast tumor and 104 adjacent normal
tissues [TCGA-breast invasive carcinoma (BRCA)]. All samples were
RNA sequenced using the Illumina HiSeq 2000 platform (version 2).
mRNA expression was normalized using the RNA-sequencing by
expectation maximization method, and miRNA expression was
normalized using the reads per million miRNA mapped method
(https://www.cancer.gov/tcga).
Considering that the high imbalance in the numbers of breast tumor
and adjacent normal tissues may introduce some bias in the
expression analysis of miR150, a comprehensive analysis was
conducted from multiple perspectives. The validation datasets
GSE22220 (17) and GSE40267
(18) were downloaded from the Gene
Expression Omnibus database (ncbi.nlm.nih.gov/geo/). However, there is no
information on hormone receptor status in the validation sets.
Data pre-processing and differential
expression analysis
R version 3.4.0 (https://www.r-project.org/) was used to perform data
pre-processing. The mRNAs and miRNAs with a median expression value
>0 in all samples were selected, and those with no expression in
>50% of the samples were removed. All mRNA and miRNA expression
values were log2-transformed. Differentially expressed
mRNAs and miRNAs were calculated using the empirical Bayes method
using the limma package (19).
Upregulated and downregulated mRNAs and miRNAs were defined as
log2fold change (FC)≥|1|. A false discovery rate
(FDR)-corrected P≤0.05 was considered to indicate a statistically
significant difference.
Construction of the miRNA-mRNA
co-expression network
Gene Network Inference with Ensemble of trees
(GENIE3) (20) was used to
construct the miRNA-mRNA co-expression network. The combined mRNA
and miRNA expression matrix was used as the input data, and the
network was constructed using the default parameters in GENIE3. The
top 10,000 miRNA-mRNA interactions were extracted from the original
output, and the network was visualized using Cytoscape version
3.4.0 (cytoscape.org/). The NetworkAnalyzer
function in Cytoscape was used to analyze the network.
miRNA target gene prediction
A total of five web-based target prediction tools,
including microRNA (11),
miRTarBase (12), mmmRNA (13), miRGate (14) and miRDB (15), were used to predict the target genes
of the given miRNAs, and the commonly predicted genes were
considered the miRNA target genes. The univariate linear model was
used to analyze the linear correlation between miRNAs and the
predicted target genes. Pearson's correlation coefficients were
calculated between miRNAs and their predicted target genes. An
absolute value of the correlation coefficient ≥0.1 and an
FDR-corrected P≤0.05 were considered to indicate a statistically
significant difference.
miRNA, clinicopathological features
and prognostic analysis
The results for categorical variables, including
ethnicity, ER status, PR status, HER2 status and stage [according
to the American Joint Committee on Cancer staging manual (2), are presented as the number and
percentage of cases. Continuous variables, including age at
diagnosis, copy number alterations, number of lymph nodes examined,
mutation count, disease-free survival (DFS) in months and overall
survival (OS) in months, are presented as the mean ± standard
deviation. The means of continuous variables in two groups were
compared using unpaired Student's t-tests, and the prevalence of
categorical variables was compared using a χ2 test. Due
to the small sample size in stage and ethnicity, the comparisons
were performed using a χ2 test with Yates' continuity
correction and Fisher's exact test. Pearson's correlation analysis
was used to analyse the correlation between disease stage and
miR150 expression. The unitary linear regression model was used to
assess the associations between miRNAs and clinicopathological
features. All survival analyses were performed using the survival
package in R. Kaplan-Meier survival curve analysis was used to
exhibit the prognostic differences between two groups. The
univariate Cox proportional hazards model was used to determine the
effect of the miRNAs and clinical features on patient survival
status. The multivariate Cox proportional hazards model was used to
explore the independent effect of miRNAs on patient OS and DFS with
adjusted related covariates. P≤0.05 was considered to indicate a
statistically significant difference.
Gene set enrichment analysis
(GSEA)
GSEA was performed using javaGSEA Desktop
Application version 2.2.4 (21).
The gene set used in enrichment operations was the Kyoto
Encyclopedia of Genes and Genomes (KEGG) gene sets version 6.0
(https://www.gsea-msigdb.org/gsea/index.jsp), which
included 186 gene sets. The analytical parameters were set as
follows: Gene sets containing <15 genes or >500 genes were
excluded, a phenotype label was set as case vs. control, and the
t-statistic mean of the genes was computed in each KEGG pathway
using a permutation test with 1,000 replications. The upregulated
pathways were defined by a normalized enrichment score (NES)>0,
and the downregulated pathways were defined by a NES<0. Pathways
with an FDR-corrected P≤0.05 were considered as significantly
enriched.
Cell culture and antibodies
MDA-MB-231 and MCF7 cells were purchased from the
American Type Culture Collection. All cells were maintained in RPMI
1640 medium supplemented with 10% FBS (both Gibco; Thermo Fisher
Scientific, Inc.), 100 U/ml penicillin and 100 mg/ml streptomycin
(Beyotime Institute of Biotechnology). The cells were cultured at
37°C with 5% CO2 in a humidified incubator. Antibodies
against anti-rat B and T lymphocyte attenuator (BTLA) (1:500; cat.
no. 250587) were purchased from Abbiotec, Inc., while antibodies
against β-actin (1:1,000; cat. no. sc-130300) were purchased from
Santa Cruz Biotechnology, Inc..
Overexpression and knockdown of
miR150, and knockdown of BTLA
miR150 overexpression and knockdown were performed
using liposome-mediated miRNA mimics and inhibitors transfection.
Chemically modified hsa-miR150 mimics
(5′-UCUCCCAACCCUUGUACCAGUG-3′), hsa-miR150 inhibitor
(5′-CACUGGUACAAGGGUUGGGAGA-3′), scrambled miRNA mimics negative
control (mimics NC; 5′-CACUGGUACAAGGGUUGGGAGA-3′) and inhibitor NC
(5′-CAGUACUUUUGUGUAGUACAA-3′) were purchased from Guangzhou RiboBio
Co., Ltd.. Small interfering RNAs (siRNAs) specific to human BTLA
(si-BTLA forward, 5′-GGUAGAUGAUGGUAUUAUACU-3′ and reverse,
5′-UAUAAUACCAUCAUCUACCUA-3′) and non-targeting siRNA (si-NC,
forward, 5′-UUCUCCGAACGUGUCACGUTT-3′ and reverse,
5′-ACGUGACACGUUCGGAGAATT-3′) were designed and synthesized by
Shanghai GenePharma Co., Ltd. MDA-MB-231 and MCF7 cells were
transfected using Lipofectamine® 2000 (Invitrogen;
Thermo Fisher Scientific, Inc.) at 37°C for 6 h according to the
manufacturer's protocol with working concentrations of 20 nM for
the inhibitors/mimics and 30 nM for the siRNAs. miR150 mimics and
inhibitors were transfected into MDA-MB-231 cells. miR150
inhibitors were transfected into MCF7 cells. After 48 h of
transfection, the cells were used for subsequent experiments.
Cell viability assay
For the cell viability assays, cells were counted
and plated in 96-well plates (1,500 cells/well) 24 h after
transfection with the modified oligonucleotides (miR150
mimics/inhibitors) or siRNA. Cell viability was determined using a
Cell Counting Kit-8 (CCK-8) assay (Dojindo Molecular Technologies,
Inc.) according to the manufacturer's protocol. CCK-8 reagent was
added into the culture medium at the indicated time points (0, 24,
48 and 72 h) and incubated for 60 min. The absorbance was measured
using a microplate reader at 450 nm. All experiments were performed
in triplicate.
Reverse transcription-quantitative
(RT-q)PCR
Total RNA was isolated from cell lines using an RNA
isolation kit (Takara Bio, Inc.). Moloney murine leukemia virus
(MMLV) reverse transcriptase (Takara Bio, Inc.; 1X 200 µl MMLV RT,
1 ml 5X First Strand Buffer and 500 µl 100 mM DTT) was used to
synthesize the cDNA. A SYBR Green reaction system (Takara Bio,
Inc.) was used to amplify the cDNA. The thermocycling conditions
were 95°C for 10 min, followed by 40 cycles of 95°C for 15 sec and
60°C for 1 min. The differences in miR150 RNA expression were
normalized to the levels of U6. The sequences of the PCR primers
were: miR150 sense,
5′-CTCAACTGGTGTCGTGGAGTCGGCAATTCAGTTGAGCACTGGTA-3′ and antisense,
5′-ACACTCCAGCTGGGTCTCCCAACCCTTGTA-3′; BTLA sense,
5′-ATCCCAGATGCTACCAATGC-3′ and antisense,
5′-TTGGGAGTTTGTCCTGGAAC-3′; U6 sense, 5′-CCGTATGACCTCCTTCCACAGA-3′
and antisense, 5′-TCTGTCCACCTCTGAAACCAGG-3′; and GAPDH sense,
5′-TGTTCGTCATGGGTGTGAAC-3′ and antisense,
5′-ATGGCATGGACTGTGGTCAT-3′. The relative gene expression was
calculated using the 2−ΔΔCq method (22).
Western blotting
Proteins from MDA-MB-231 and MCF7 cells were
extracted using RIPA cell lysis buffer (Santa Cruz Biotechnology,
Inc.), and protein concentration was determined using a BCA assay
kit. Protein samples (30 µg/lane) were separated using 10%
SDS-PAGE. Proteins were transferred onto a PVDF membrane and
blocked for 60 min in 0.05% Tween-20 in TBS (TBST) with 5% dried
skim milk at room temperature. Immunoblot analysis was performed by
incubating with the appropriate primary antibodies at 4°C for 12 h.
The membranes were then washed three times with TBST and incubated
with a horseradish peroxidase-conjugated secondary antibody
(1:20,000; cat. no. ab205718; Abcam) for 60 min at room
temperature. Immunoreactive bands were visualized using an enhanced
chemiluminescent detection kit (Beyotime Institute of
Biotechnology). Signal quantification was obtained using Quantity
One software (version 4.6.6; Bio-Rad Laboratories, Inc.) and
normalized to β-actin.
Migration and wound healing
assays
Cell migration assays were performed using
Transwell® chambers (8-µM pores; Corning, Inc.).
RPMI-1640 supplemented with 10% FBS was added to the bottom
chamber. Transfected MDA-MB-231 and MCF7 cells (5×10⁴)
in serum-free IMDM were added to the upper chamber of each well.
After incubation at 37°C for 24 h, cells that had adhered to the
membrane were fixed using 4% paraformaldehyde at room temperature
for 20 min and stained with 0.1% crystal violet dye for 20 min at
room temperature. Cells that had migrated through the membrane were
imaged in six randomly selected fields of view using an inverted
light microscope (magnification, ×200). For the wound healing
assays, a confluent monolayer of cells was scratched using a 250-µl
pipette tip. Cells were cultured in serum-free RPMI-1640 medium.
The wounded cell monolayer was observed under a light microscope
(magnification, ×100; Olympus Corporation) and images were taken at
0 and 24 h following the infliction of wounds, which was a
cell-free nick created using Culture-Inserts. Closure of wounds was
measured using ImageJ software (version 1.48; National Institutes
of Health). Wound closure rates were expressed as percentages of
the wound area closed at 24 h relative to the initial area of the
cell-free region at 0 h.
Statistical analysis
SPSS software version 22.0 (IBM Corp.) and GraphPad
Prism 6 (GraphPad Software, Inc.) were used for statistical
analysis of the data. All data were expressed as the mean ± SD. F
test was first used to check whether the variances are equal for
statistical comparison, and then an unpaired two-tailed Student's
t-test with equal variance was used for comparisons between two
groups. Kolmogorov-Smirnov test was used to determine the normality
of the distribution of data in each group. One-way ANOVA was used
for making comparisons among multiple groups followed by Tukey's
post-hoc test to assess the difference between 2 groups. P<0.05
was considered to indicate a statistically significant
difference.
Results
miR150 serves a crucial role in gene
regulation and patient prognosis
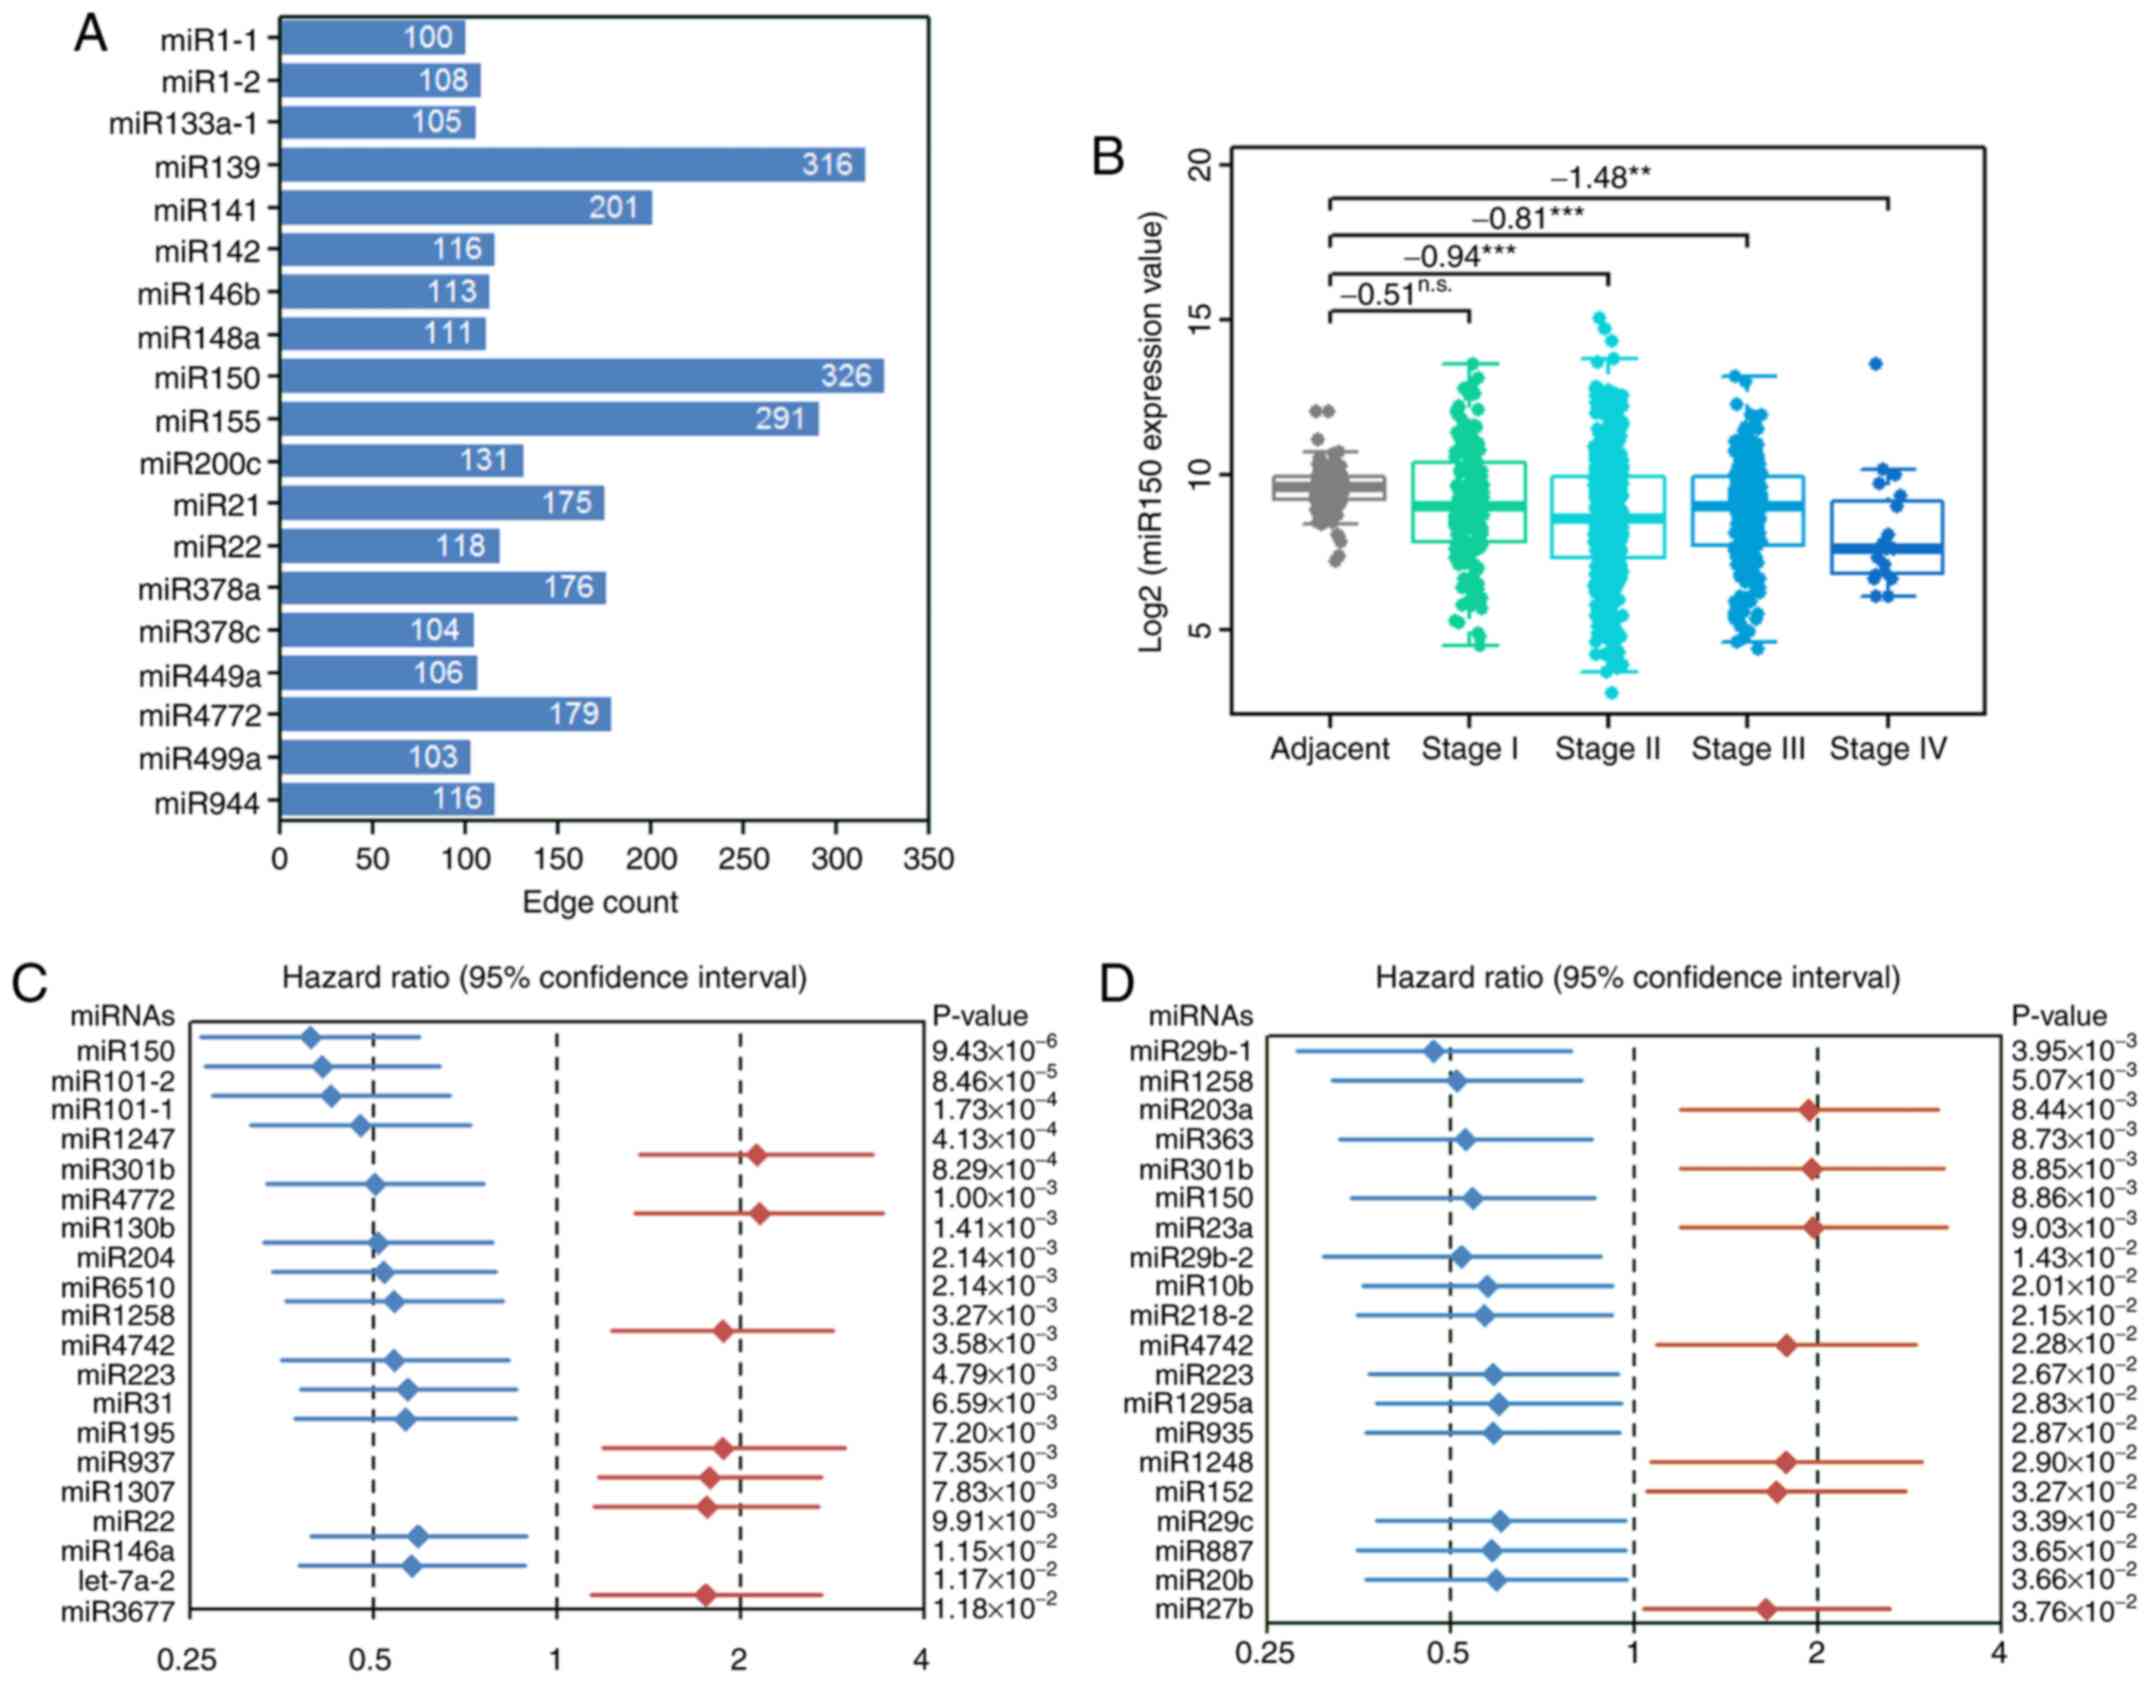
Through miRNA-mRNA co-expression network analysis,
19 miRNAs with >100 nodes were identified in the top 10,000
interactions (Fig. S1 and Table SI). According to the network
properties, the miRNAs with the most nodes had the largest number
of regulated genes; in this network, miR150 had the most nodes
(Fig. 1A). Therefore, from the
perspective of the co-expression network, miR150 had the most
regulated genes compared with the other miRNAs. Lower expression
levels of miR150 were observed in tumor samples compared with in
adjacent samples at each stage (Fig.
1B). However, miR150 expression did not reach the criteria of a
differentially expressed gene (log2FC≥|1| and FDR≤0.05)
in stages I–III (Fig. 1B).
Additionally, Pearson's correlation analysis revealed that miR150
expression was negatively correlated with disease stage (r=−0.13;
P<0.001; data not shown). Furthermore, 56 miRNAs were found to
affect patient OS, while 25 miRNAs affected patient DFS (Tables SII and SIII). Among the top 20 miRNAs that were
significantly associated with OS or DFS, low miR150 expression
significantly decreased patient OS (Fig. 1C) and DFS (Fig. 1D). Based on the aforementioned
results, it was hypothesized that miR150 served a vital role in
breast cancer; thus, subsequent analyses focused on miR150.
miR150 target gene prediction
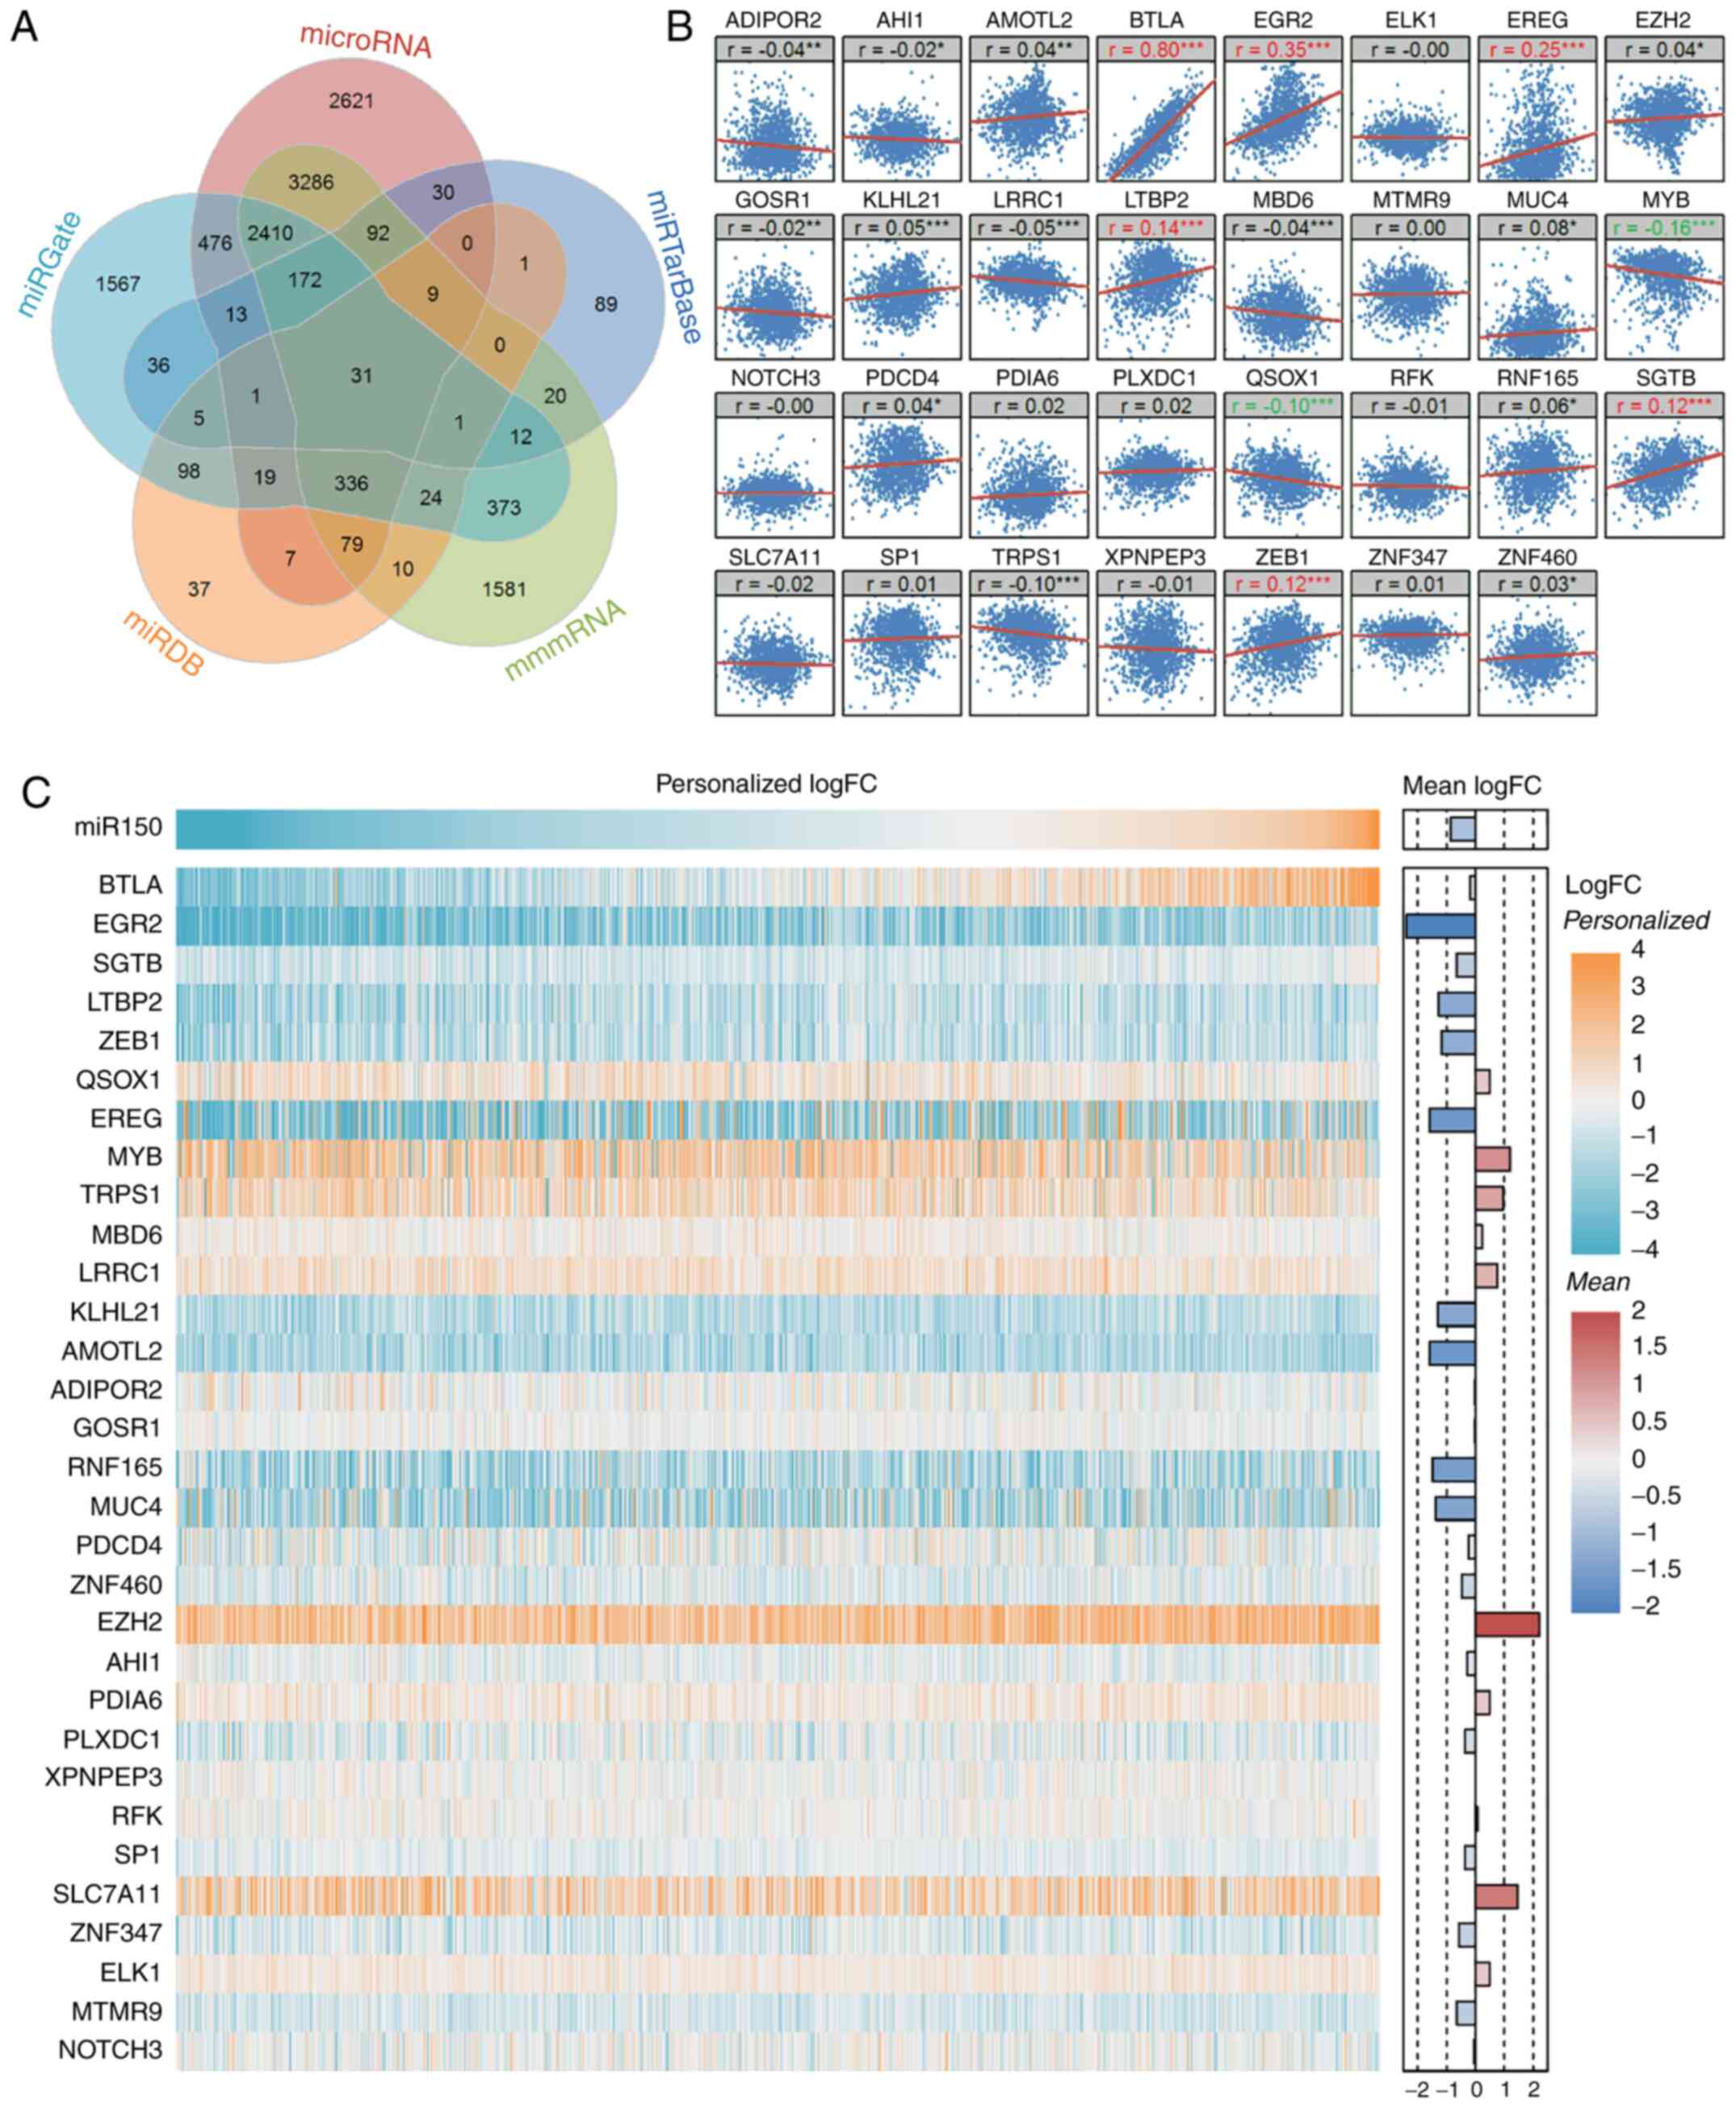
There were 9,583, 511, 8,436, 5,574 and 658 unique
predicted miR150 target genes in microRNA, miRTarBase, mmmRNA,
miRGate and miRDB, respectively (Fig.
2A and Table SIV). A total of
31 commonly predicted miR150 target genes were used for subsequent
analyses. Among the 31 common target genes, BTLA exhibited the most
positive significant correlation with miR150 (Fig. 2B). Furthermore, EGR2, EREG, LTBP2
and SGTB were positively correlated with miR150, while MYB and
QSOX1 were negatively correlated with miR150. The correlation of
BTLA, EGR2, EREG, LTBP2 and MYB expression with miR150 expression
was validated in the GSE22220 dataset (Fig. S2); however, there was no data on
SGTB or QSOX1 expression in this dataset. Since miR150 was not
differentially expressed in the averaged whole tumor samples
compared with the averaged adjacent samples, the specific paired
expression differences of miR150 and its target genes in each tumor
sample was compared with the mean expression of adjacent samples
(calculated as the log2-transformed expression value of
each tumor sample minus the mean log2-transformed value
of all adjacent samples). Although miR150 did not reach
significance in the entire cohort compared with the control group,
~two-thirds of patients exhibited low miR150 expression, whereas
the remaining one-third of patients exhibited high miR150
expression compared with the controls. This suggested that the
overall mean expression may mask some important information, and
thus a more accurate personalized analysis method is required to
reveal details that may otherwise be missed. Based on the
individual expression differences, the mean expression value in the
control group was used as the cut-off value for miR150.
Accordingly, patients with miR150 ≥9.55 were defined as the
high-miR150 group and those with miR150 <9.55 were defined as
the low-miR150 group. In the follow-up analysis, the effects of
high/low miR150 expression on global gene expression, pathway
impairment and patient prognosis are described (Fig. 2C).
Low miR150 expression results in
pathway impairment and gene deregulation
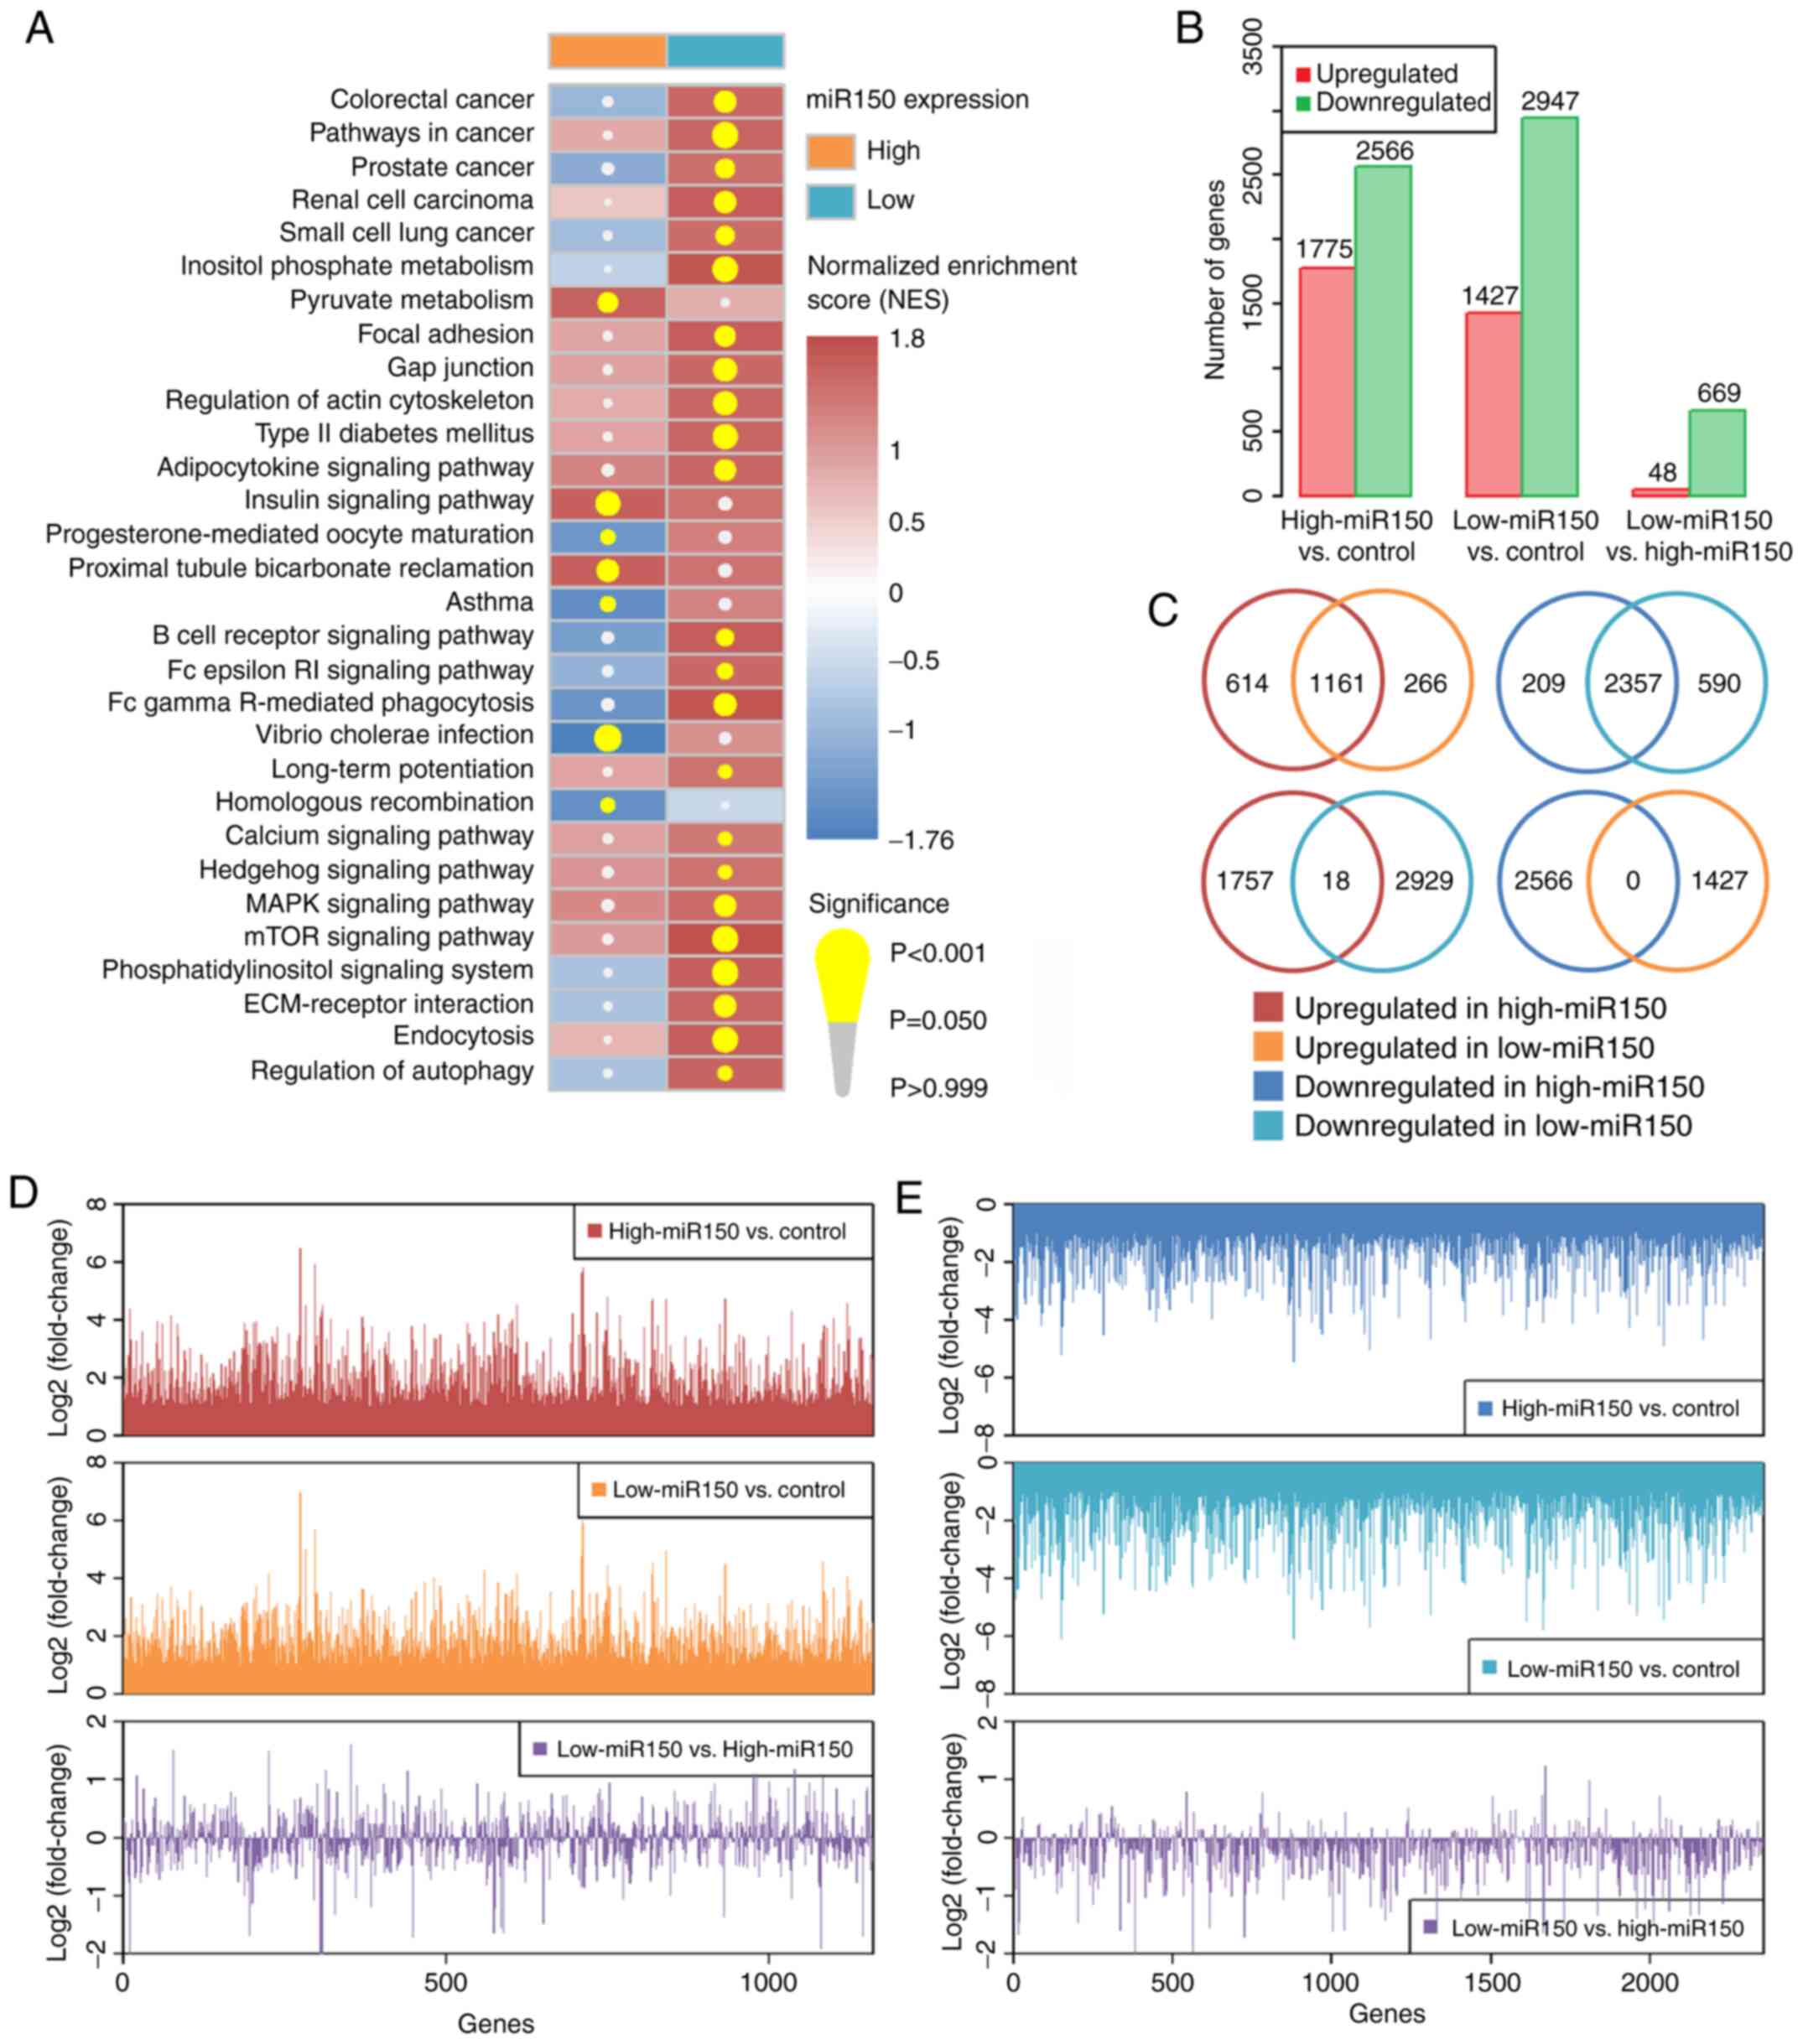
Multiple cancer-associated and immune-associated
signaling pathways were upregulated in the low-miR150 group (such
as ‘pathways in cancer’, ‘B cell receptor signaling pathway’, ‘MAPK
signaling pathway’ and ‘mTOR signaling pathway’), whereas only a
few pathways were affected in the high-miR150 group (Fig. 3A and Table SV). Low miR150 expression was
associated with multiple upregulated pathways also in the GSE22220
dataset (Fig. S3). There were
4,341 dysregulated genes in the high-miR150 vs. control groups,
4,374 dysregulated genes in the low-miR150 vs. control groups, and
717 dysregulated genes in the low-vs. high-miR150 groups (Fig. 3B and Tables SVI–SVIII). The 1,161 commonly upregulated
genes and 2,357 downregulated genes between high-miR150 vs.
controls and low-miR150 vs. controls were extracted (Fig. 3C), and the degree of
log2FC of these commonly dysregulated genes between
high- and low-miR150 groups were compared (Fig. 3D and E). The results suggested that
the effect on the commonly upregulated genes was similar between
high- and low-miR150 groups; however, there were a greater number
of stronger influences of the commonly downregulated genes in
low-vs. high-miR150 (mean logFCs of commonly upregulated and
downregulated genes in low- vs. high-miR150 were: −0.045 and
−0.270, respectively). These results suggested that low miR150
expression may result in a higher degree of downregulation of the
targeted genes.
Overall analysis of the effects of
miR150 on clinicopathological features and patient prognosis
Compared with patients with high-miR150, patients
with low-miR150 were more likely to have a higher age at diagnosis
and be ER+, PR+ and possess copy number
alterations (Table I). Furthermore,
miR150 was negatively associated with age at diagnosis, ER status,
PR status, copy number alterations and stage (Table II). Using a univariate Cox
regression model to assess the effect of miR150 and other clinical
variables on patient prognosis, it was revealed that high miR150
expression was a protective factor of patient OS, but did not
appear to affect DFS (Tables III
and IV). Additionally, patients
with positive ER or PR status exhibited improved OS and DFS
compared with patients with a negative ER or PR status. Other
factors, such as copy number alterations, number of lymph nodes
examined, mutation count and stage also affected patient survival
status. Therefore, a multivariate Cox regression model was used to
analyze the independent effect of miR150 on patient prognosis with
adjusted potential covariates (Table
V). The results suggested that high miR150 expression
independently predicted an improved patient OS.
 | Table I.Clinicopathological features of
patients with breast invasive carcinoma grouped by microRNA 150
expression. |
Table I.
Clinicopathological features of
patients with breast invasive carcinoma grouped by microRNA 150
expression.
| Variable | Low expression | High
expression | P-value |
|---|
| Age at
diagnosisa, years | 59.7±13.4 | 56.1±12.5 |
<0.001b |
| Ethnicity, n
(%) |
|
| 0.037c |
|
White | 502 (77.6) | 240 (70.8) |
|
|
Asian | 39 (6.0) | 22 (6.5) |
|
| African
American | 106 (16.4) | 76 (22.4) |
|
|
American Indian or Alaska
Native | 0 (0.0) | 1 (0.3) |
|
| Estrogen receptor
status, n (%) |
|
|
<0.001b |
|
Negative | 119 (17.2) | 113 (34.0) |
|
|
Positive | 574 (82.8) | 219 (66.0) |
|
| Progesterone
receptor status, n (%) |
|
|
<0.001b |
|
Negative | 198 (28.7) | 137 (41.3) |
|
|
Positive | 492 (71.3) | 195 (58.7) |
|
| Human epidermal
growth factor receptor 2 status, n (%) |
|
| 0.608 |
|
Negative | 228 (80.6) | 100 (83.3) |
|
|
Positive | 55 (19.4) | 20 (16.7) |
|
| Copy number
alterationsa | 0.30±0.2 | 0.27±0.2 | 0.044c |
| Lymph nodes
examined numbera | 10.6±8.5 | 10.6±9.3 | 0.964 |
| Mutation
counta |
66.0±239.9 |
57.5±135.5 | 0.482 |
| Stage, n (%) |
|
| 0.378 |
| I | 113 (16.0) | 67
(19.3) |
|
| II | 410 (58.2) | 198 (56.9) |
|
|
III | 166 (23.5) | 79
(22.7) |
|
| IV | 16 (2.3) | 4
(1.1) |
|
| Table II.Univariate linear regression analysis
of microRNA 150 expression and clinicopathological features. |
Table II.
Univariate linear regression analysis
of microRNA 150 expression and clinicopathological features.
| Variable | Na | Mean ± SD | β (SE) | P-value |
|---|
| Age at
diagnosis | 1,074 |
| −0.02 (0.00) |
<0.001b |
| Estrogen receptor
status |
|
|
|
|
|
Negative | 232 | 9.29±2.05 | Reference |
|
|
Positive | 793 | 8.52±1.73 | −0.77 (0.13) |
<0.001b |
| Progesterone
receptor status |
|
|
|
|
|
Negative | 335 | 8.95±2.00 | Reference |
|
|
Positive | 687 | 8.56±1.73 | −0.39 (0.12) | 0.002c |
| Human epidermal
growth factor receptor 2 status |
|
|
|
|
|
Negative | 328 | 8.63±1.83 | Reference |
|
|
Positive | 75 | 8.41±1.78 | −0.22 (0.23) | 0.356 |
| Copy number
alterations | 1,059 |
| −1.21 (0.27) |
<0.001b |
| Lymph nodes
examined number | 954 |
| 0.01 (0.01) | 0.420 |
| Mutation count | 957 |
| −0.00 (0.00) | 0.730 |
| Stage |
|
|
|
|
| Stage
I | 180 | 9.04±1.84 | Reference |
|
| Stage
II | 608 | 8.62±1.89 | −0.42 (0.16) | 0.008c |
| Stage
III | 245 | 8.75±1.67 | −0.15 (0.09) | 0.087 |
| Stage
IV | 20 | 8.08±1.79 | −0.32 (0.14) | 0.027 |
| Table III.Univariate Cox regression analysis of
miR150 expression, clinicopathological features and overall
survival. |
Table III.
Univariate Cox regression analysis of
miR150 expression, clinicopathological features and overall
survival.
| Variable | Na | Median (Q1-Q3),
months | HR (95% CI) | P-value |
|---|
| miR150
(continuous) | 1,073 |
| 0.89
(0.82–0.97) | 0.010b |
| miR150
(categorical)c |
|
|
|
|
| Low
expression | 718 | 23.90
(13.68–50.33) | Reference |
|
| High
expression | 355 | 36.10
(18.35–70.91) | 0.63
(0.44–0.90) | 0.012b |
| Age at
diagnosis | 1,073 |
| 1.03
(1.02–1.04) |
<0.001d |
| Estrogen receptor
status |
|
|
|
|
|
Negative | 232 | 29.88
(13.49–58.59) | Reference |
|
|
Positive | 793 | 26.97
(15.60–55.45) | 0.68
(0.47–0.99) | 0.042b |
| Progesterone
receptor status |
|
|
|
|
|
Negative | 335 | 27.99
(13.59–56.73) | Reference |
|
|
Positive | 687 | 27.56
(16.21–55.42) | 0.72
(0.51–1.02) | 0.065 |
| Human epidermal
growth factor receptor 2 status |
|
|
|
|
|
Negative | 328 | 33.10
(18.50–62.02) | Reference |
|
|
Positive | 75 | 32.72
(15.46–55.42) | 0.89
(0.40–2.00) | 0.779 |
| Copy number
alterations | 1,056 |
| 2.65
(1.27–5.55) | 0.009e |
| Lymph nodes
examined number | 953 |
| 1.02
(1.00–1.04) | 0.060 |
| Mutation
countf | 956 |
| 1.00
(1.00–1.00) | 0.001e |
| Stage |
|
|
|
|
| Stage
I | 180 | 39.52
(20.74–72.49) | Reference |
|
| Stage
II | 607 | 26.02
(14.75–53.47) | 1.72
(0.98–3.02) | 0.060 |
| Stage
III | 245 | 23.23
(13.07–46.62) | 3.17
(1.76–5.69) |
<0.001d |
| Stage
IV | 20 | 26.56
(9.59–39.59) | 14.18
(6.69–30.04) |
<0.001d |
| Table IV.Univariate Cox regression analysis of
miR150 expression, clinicopathological features and disease-free
survival. |
Table IV.
Univariate Cox regression analysis of
miR150 expression, clinicopathological features and disease-free
survival.
| Variable | Na | Median (Q1-Q3),
months | HR (95% CI) | P-value |
|---|
| miR150
(continuous) | 984 |
| 0.91
(0.83–1.01) | 0.068 |
| miR150
(categorical)b |
|
|
|
|
| Low
expression | 651 | 21.91
(13.01–42.79) | Reference |
|
| High
expression | 333 | 33.67
(17.12–68.69) | 0.70
(0.47–1.05) | 0.083 |
| Age at
diagnosis | 984 |
| 1.01
(0.99–1.02) | 0.485 |
| Estrogen receptor
status |
|
|
|
|
|
Negative | 215 | 24.97
(12.68–53.38) | Reference |
|
|
Positive | 727 | 24.70
(14.87–50.77) | 0.56
(0.37–0.83) | 0.004c |
| Progesterone
receptor status |
|
|
|
|
|
Negative | 310 | 23.25
(12.92–53.15) | Reference |
|
|
Positive | 628 | 24.98
(15.31–49.92) | 0.54
(0.37–0.80) | 0.002c |
| Human epidermal
growth factor receptor 2 status |
|
|
|
|
|
Negative | 310 | 31.70
(17.81–59.24) | Reference |
|
|
Positive | 69 | 32.72
(14.68–55.45) | 0.47
(0.17–1.32) | 0.153 |
| Copy number
alterations | 968 |
| 1.80
(0.74–4.40) | 0.196 |
| Lymph nodes
examined number | 878 |
| 1.02
(1.00–1.04) | 0.031d |
| Mutation
counte | 875 |
| 1.00
(1.00–1.00) | 0.920 |
| Stage |
|
|
|
|
| Stage
I | 168 | 37.55
(20.02–63.90) | Reference |
|
| Stage
II | 565 | 23.52
(13.96–48.19) | 1.66
(0.86–3.20) | 0.132 |
| Stage
III | 224 | 21.73
(12.44–42.91) | 3.73
(1.91–7.32) |
<0.001f |
| Stage
IV | 10 | 23.24
(8.46–44.40) | 13.98
(4.95–39.50) |
<0.001f |
| Table V.Multivariate Cox regression analysis
of miR150 expression and patient survival. |
Table V.
Multivariate Cox regression analysis
of miR150 expression and patient survival.
| A, Overall
survival |
|---|
|
|---|
| Variable | Na | Median (Q1-Q3),
months | HR (95% CI) |
P-valueb |
|---|
| miR150
(continuous) | 1,073 |
| 0.71
(0.58–0.87) | 0.001c |
| miR150
(categorical)d |
|
|
|
|
| Low
expression | 718 | 23.90
(13.68–50.33) | Reference |
|
| High
expression | 355 | 36.10
(18.35–70.91) | 0.31
(0.12–0.78) | 0.013e |
|
| B, Disease-free
survival |
|
|
Variable | Na | Median (Q1-Q3),
months | HR (95%
CI) |
P-valueb |
|
| miR150
(continuous) | 984 |
| 0.78
(0.63–0.95) | 0.015e |
| miR150
(categorical)d |
|
|
|
|
| Low
expression | 651 | 21.91
(13.01–42.79) | Reference |
|
| High
expression | 333 | 33.67
(17.12–68.69) | 0.54
(0.24–1.24) | 0.146 |
Subgroup analysis of miR150 on patient
prognosis
Considering the effects of hormonal receptor status
and disease stage on patient prognosis, the independent effects of
miR150 on patient OS and DFS in each subgroup were analyzed
(Tables SIX–SXII). The prognostic analysis revealed
that high miR150 expression significantly promoted patient OS in
several subgroups (particularly in the ER− group);
however, it had a relatively weak impact on patient DFS in
different PR or HER groups, whereas it was significantly associated
with patient DFS in the ER− group. Furthermore, high
miR150 expression significantly improved patient OS in stage I/II
groups and improved patient DFS in stage III/IV groups (Table SXII).
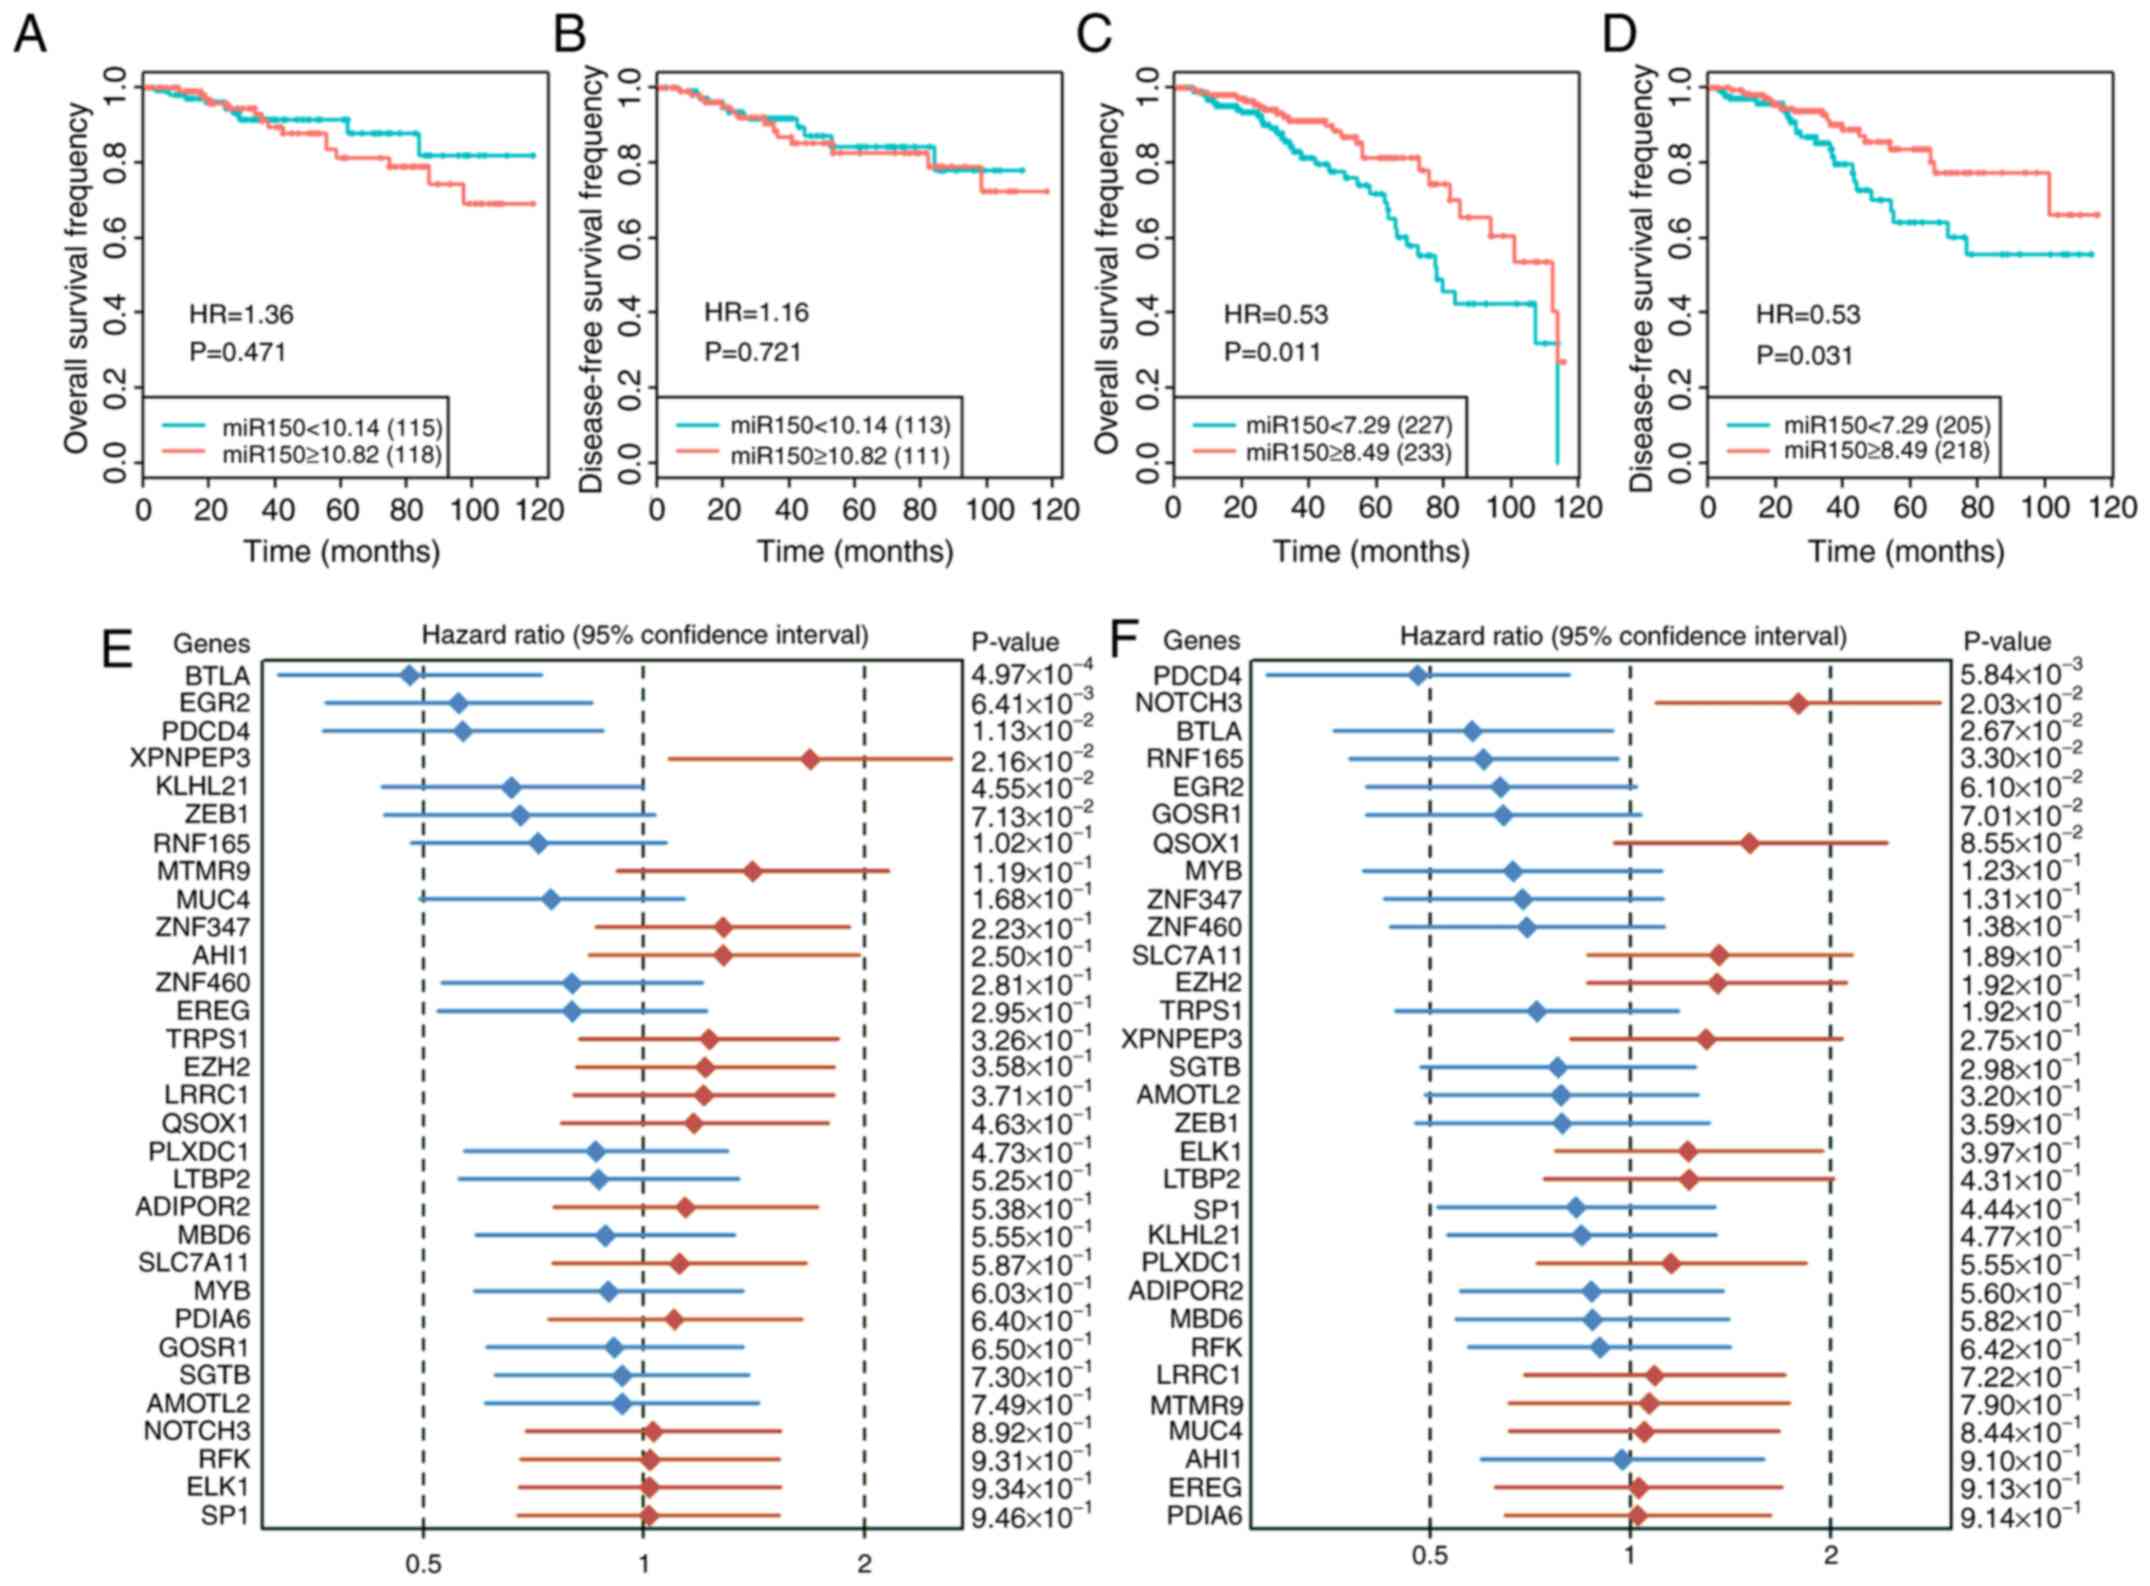
In the subgroup analysis grouped by median miR150
expression, the results revealed that low miR150 expression
significantly decreased patient OS and DFS in the low-miR150 group,
but not in the high-miR150 group (Fig.
4A-D). Since there was no information on hormone receptor
status in the validation set, the overall impact of miR150 on
patient prognosis was analyzed. The results revealed that low
miR150 expression significantly decreased patient DFS, but did not
significantly affect patient OS in the whole group or in the
subgroups in the validation datasets (Fig. S4). Therefore, the role of miR150 on
the prognosis in patients with breast cancer requires further
investigation.
Effect of miR150 target genes on
patient prognosis
The effect of the 31 common miR150 target genes on
patient OS (Fig. 4E) and DFS
(Fig. 4F) were determined. The
results revealed that BTLA and PDCD4 both positively affected
patient OS and DFS. EGR2 and KLHL21 positively affected patient OS,
XPNPEP3 negatively affected patient OS, NOTCH3 negatively affected
patient DFS and RNF165 positively affected patient DFS. In the
interaction analysis of miR150 and its target genes on patient
prognosis, miR150 and 7 genes (BTLA, EGR2, NOTCH3, PDIA6, QSOX1,
SLC7A11 and ZNF460) interactively affected both patient OS and DFS
(Table SXIII).
miR150 affects cell viability and
migratory capacity of breast cancer cells
MDA-MB-231 cells were transfected with the miR150
mimics and MCF7 cells were transfected with the miR150 inhibitors;
the transfection efficiency is shown in Fig. 5A. To explore the effects of miR150
on migration and viability of breast cancer cells, miR150 was
overexpressed in MDA-MB-231 cells via transfection of the miR150
mimics using a mimics NC as the control, while MCF7 cells were
transfected with the designed inhibitors to decrease miR150
expression levels. The results indicated that cell viability was
significantly decreased in the miR150 overexpression group compared
with in the control group (Fig.
5B). Compared with in the inhibitors NC group, MCF7 cell
viability was significantly increased in the miR150 inhibitor group
(Fig. 5B), suggesting that
overexpression of miR150 decreased the viability of breast cancer
cells. Transwell® assays revealed that overexpression of
miR150 significantly decreased cell migration (Fig. 5C), whereas inhibition of miR150
significantly increased cell migration (Fig. 5D). These results were further
confirmed by wound healing assays, which demonstrated that cell
mobility was significantly decreased in the overexpressed miR150
group (Fig. 5E), while it was
significantly increased in the miR150 inhibited group (Fig. 5F). Overall, these results indicated
that miR150 decreased breast cancer cell viability and
migration.
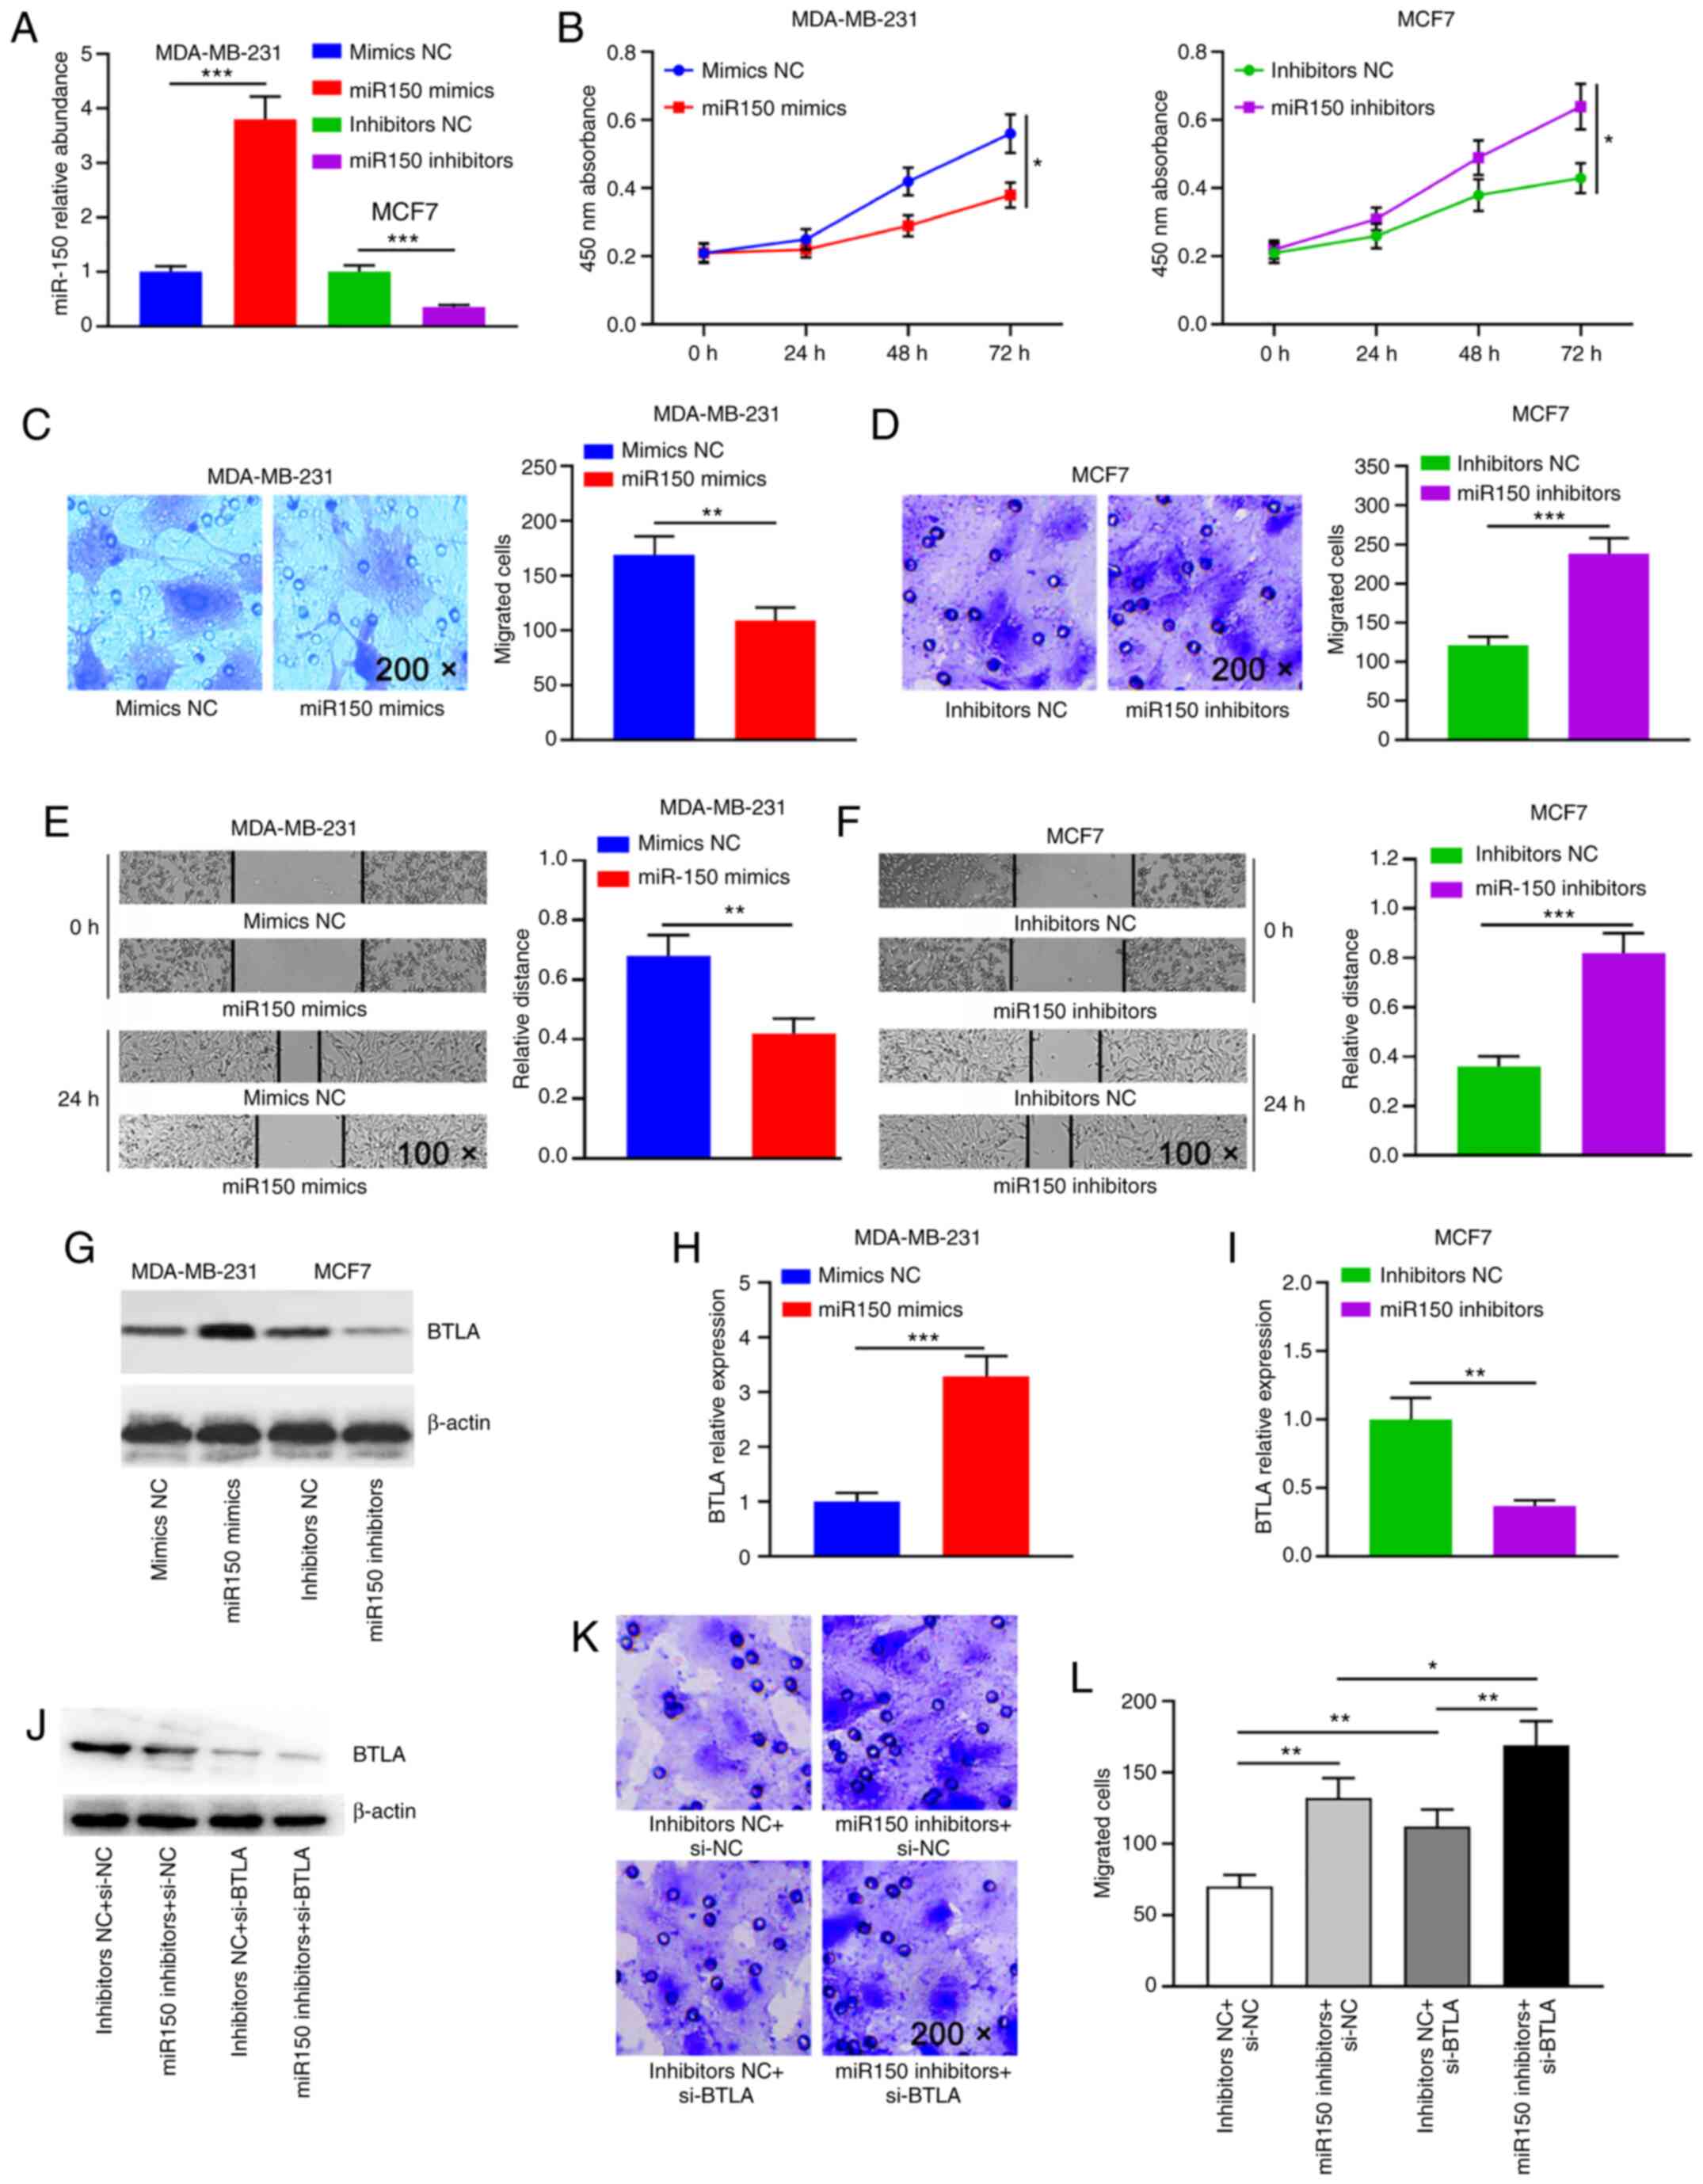 | Figure 5.miR150 inhibits breast cancer cell
viability and migration via BTLA. (A) Reverse
transcription-quantitative PCR was used to detect miR150 expression
in MDA-MB-231 and MCF7 cells transfected with miR150
mimics/inhibitors. miR150 RNA levels are expressed as the mean ± SD
of four different experiments normalized to U6. (B) CCK-8 assay was
performed to assess the effect of miR150 overexpression or
knockdown on cell viability in MDA-MB-231 and MCF-7 cells,
respectively. Representative microscopic images and cell counts of
migratory cells from (C) the mimics-transfected MDA-MB-231 breast
cancer cells and (D) the inhibitors-transfected MCF7 breast cancer
cells in a Transwell® assay (magnification, ×200).
Representative microscopic images of wound healing in (E) the
miR150-overexpressing MDA-MB-231 cells and (F) the miR150-knockdown
MCF7 cells (magnification, ×100). Data from the CCK-8 cell
viability, Transwell® migration and wound healing assays
are presented as the mean ± SEM of three independent repeats. (G)
Western blot of BTLA expression in the different miR150-treated
groups. Densitometry analysis was performed to assess expression in
(H) MDA-MB-231 and (I) MCF7 cells. BTLA protein expression levels
are expressed as the mean ± SEM of three different experiments
normalized to β-actin levels. (J) Western blot of BTLA expression
in different treatment groups. (K) Transwell® assays
were performed to detect the migratory capacity of treated cells
(magnification, ×200). (L) Quantification of the
Transwell® assays. *P≤0.05; **P≤0.01; ***P≤0.001. miR,
microRNA; BTLA, B and T lymphocyte attenuator; NC, negative
control; si, small interfering; CCK-8, Cell Counting Kit-8. |
Subsequently, the effect of the interaction between
miR150 and BTLA on breast cancer cell migration was analyzed. The
mRNA and protein expression levels of BTLA were significantly
increased when miR150 was overexpressed (Figs. 5G, H and S5A), while they were significantly
decreased when miR150 expression was knocked down (Figs. 5G, I and S5B). To further test whether the
migratory capacity of breast cancer cells was directly dependent on
BTLA, a siRNA targeting BTLA (si-BTLA; Fig. S6) and a miR150 inhibitor were
co-transfected to concurrently knock down BTLA and miR150
expression in MCF7 cells (Fig. 5J).
Concurrent knockdown of BTLA and miR150 expression resulted in a
considerably more severe phenotype than either miR150 inhibitors or
si-BTLA alone (Fig. 5K and L). In
summary, the present results demonstrated that miR150 may regulate
cell migration by directly regulating BTLA expression.
Discussion
An increasing number of studies have shown that
numerous miRNAs exhibit varying roles in the pathophysiology of
breast cancer, such as facilitating invasion and metastasis,
inducing epithelial-mesenchymal transition and maintaining breast
cancer stem cell proliferation. miRNAs regulate gene expression at
numerous levels, including epigenetic and genetic alterations, and
transcriptional repression (3–9).
Several studies have demonstrated that each miRNA is capable of
regulating the expression of multiple downstream genes (5–7);
therefore, one miRNA can simultaneously regulate multiple cellular
signaling pathways (4). The present
study revealed that miR150 and its potential target genes
(including BTLA, EGR2, EREG, MYB and LTPB2) resulted in the
upregulation of several carcinogenic and signaling transduction
pathways, ultimately leading to breast cancer development and/or
progression. Additionally, downregulation of miR150 expression
decreased OS in patients with breast cancer. Functional in
vitro experiments demonstrated that a miR150-BTLA axis
regulated cell migration.
Previous studies revealed that aberrant activation
of these miR150-associated signaling transduction pathways (such as
the Wnt/β-catenin and Notch signaling pathways) accelerated breast
cancer progression (23–25). In human breast cancer cell lines,
the Wnt/β-catenin signaling pathway activates Lin28 expression and
represses let-7 expression, leading to expansion of breast cancer
stem cells (23). The Notch
signaling pathway is required for stem cell maintenance in breast
cancer (24). Through directly
targeting NOTCH1, it was revealed that ectopic miR34a expression
decreases cancer stem cell properties and increases their
sensitivity to doxorubicin treatment (25). Furthermore, increased miR34
expression results in cell cycle arrest, whereas its downregulation
increases the invasive capacity and metastatic potential of breast
cancer cell lines (25). The
present study demonstrated that low miR150 expression may activate
these signaling transduction pathways. Considering the carcinogenic
effects of these pathways in breast cancer, it was speculated that
increasing the expression levels of miR150 may facilitate breast
cancer treatment and prolong patient survival.
The antitumor effects of miR150 have been
demonstrated in several types of cancer. Li et al (26) revealed that upregulated miR150
expression suppresses proliferation and tumorigenicity via
targeting multiple cell cycle-associated genes (including CCND1,
CCND2, CDK2 and CCNE2) in nasopharyngeal carcinoma in vitro
and in vivo. In non-small cell lung cancer cell lines,
suppression of miR150 inhibits proliferation by inactivating the
AKT and the SIRT2/JMJD2A signaling pathways (27). Furthermore, downregulated miR150
expression decreases the inhibition of HIG2 and promotes
proliferation, motility, apoptosis and iron metabolism in
hepatocellular carcinoma cell lines (28). The present study demonstrated that
in patients with low expression levels of miR150 who were
ER+ and PR+, dysregulation of signaling
pathways was more severe, resulting in less favorable outcomes. A
recent triple-negative breast cancer study revealed that miR150
expression is downregulated in tumor tissues compared with in
normal breast tissues, and that ectopic miR150 expression
suppresses tumor cell migration and metastasis (29). Monocytes are important for tumor
immunity. Shu et al (30)
demonstrated that miR150-5p suppresses CCR2 expression by targeting
Notch 3 in breast cancer monocytes, thus inhibiting tumorigenesis.
However, a previous study revealed that miR150 expression was
upregulated in tumor tissues and breast cancer cell lines,
suggesting that high miR150 expression is associated with increased
cell proliferation (31). The
aforementioned studies are all focused on the entire cohorts used
in each study, which may ignore the differences between
individuals. In the present study, miR150 was not dysregulated in
the entire cohort; however, in the subgroup analysis, there was a
significant difference in patients with low levels of miR150
compared with those expressing high levels. Therefore, increased
stratification and personalized research may assist in identifying
and understanding the biological mechanisms of cancer.
There were 8 genes (BTLA, EGR2, EREG, LTBP2, SGTB,
MYB, ZEB1 and QSOX1) that were significantly correlated with miR150
among the 31 predicted miR150 target genes in the present study.
Several studies have identified EGR2 as a target of miR150;
upregulated miR150 regulates EGR2-promoted gastric cancer cell
proliferation (32) and the
development of chronic rhinosinusitis (33). A previous study revealed that there
were four miR150 binding sites in the 3′-untranslated region of
c-Myb, and found that miR150 decreased endogenous c-Myb mRNA and
protein expression levels by half (34). A recent study demonstrated that
upregulation of miR150 significantly inhibits the proliferation,
migration and invasion of melanoma cells by suppressing MYB
(35). Furthermore, decreased
miR150 expression results in increased c-Myb expression in
B-lymphocytes in patients with autoimmune hemolytic anemia/Evans
syndrome (36). BTLA is a member of
the immunoglobulin superfamily and functions in immune response
inhibition (37,38). Gene polymorphisms of BTLA were
associated with an increased risk of sporadic breast cancer and a
less favorable prognosis (37). By
lowering BTLA levels using neutralizing antibodies, downregulation
of BTLA decreases anti-tumor immunity in natural killer T cells
(38). The results of the present
study revealed that miR150 positively regulated BTLA expression,
and concurrent downregulation of miR150 and BTLA promoted cell
migration.
In conclusion, the present study indicated that low
miR150 expression was associated with less favorable
clinicopathological characteristics, upregulation of multiple
carcinogenic pathways and poor patient survival. miR150 expression
was significantly negatively correlated with disease stage, and may
thus be used as a marker of advanced stage breast cancer. Through
miRNA target gene prediction and correlation analysis, BTLA, EGR2
and MYB were significantly correlated with miR150 expression in
both the TCGA-BRCA and validation datasets. The strong positive
association between miR150 and BTLA was verified by functional
in vitro experiments. Furthermore, experimental results
suggested that miR150 and BTLA promoted cell migration. Therefore,
the present study suggested that increasing miR150 expression or
interfering with its target genes may serve as a potential form of
breast cancer treatment aimed at improving patient survival.
Supplementary Material
Supporting Data
Supporting Data
Supporting Data
Supporting Data
Supporting Data
Supporting Data
Supporting Data
Supporting Data
Supporting Data
Supporting Data
Supporting Data
Supporting Data
Supporting Data
Supporting Data
Acknowledgements
Not applicable.
Funding
The present study was supported by grants from the
National Natural Science Foundation of China (grant nos. 81071990
and 81641110), the Natural Science Foundation Guangdong Province
(grant no. 2015A030313725), the Science and Technology Program of
Guangzhou (grant no. 201707010305), the Medical Research Foundation
of Guangdong Province (grant no. A2017427) and the Youth Science
Foundation of Guangdong Second Provincial General Hospital (grant
no. YQ2016-001).
Availability of data and materials
The datasets generated and/or analyzed during the
current study are available in The Cancer Genome Atlas database
(cancergenome.nih.gov/) for the TCGA-BRCA
dataset and in Gene Expression Omnibus database (ncbi.nlm.nih.gov/geo/) for the microarray datasets
GSE22216, GSE22219, GSE22220 and GSE40267.
Authors' contributions
SQA, KH, GAX and WXL designed the study. SQA, KH,
FL, QSD and WXL collected the data. SQA, KH, YLW, ZLX, XPD, RH and
WXL performed the data analysis and visualization. KH, FL, QSD,
BWL, HHW and YT performed the experiments. SQA, KH, BWL, HHW, GAX
and WXL wrote the manuscript. SQA, KH, GAX and WXL revised the
manuscript. All authors read and approved the final manuscript.
Ethics approval and consent to
participate
Not applicable.
Patient consent for publication
Not applicable.
Competing interests
The authors declare that they have no competing
interests.
Glossary
Abbreviations
Abbreviations:
|
BRCA
|
breast invasive carcinoma
|
|
TCGA
|
The Cancer Genome Atlas
|
|
GENIE3
|
Gene Network Inference with Ensemble
of trees
|
|
GSEA
|
gene set enrichment analysis
|
|
KEGG
|
Kyoto Encyclopedia of Genes and
Genomes
|
|
OS
|
overall survival
|
|
DFS
|
disease-free survival
|
|
FDR
|
false discovery rate
|
References
|
1
|
Chen W, Zheng R, Baade PD, Zhang S, Zeng
H, Bray F, Jemal A, Yu XQ and He J: Cancer statistics in China,
2015. CA Cancer J Clin. 66:115–132. 2016. View Article : Google Scholar : PubMed/NCBI
|
|
2
|
Giuliano AE, Connolly JL, Edge SB,
Mittendorf EA, Rugo HS, Solin LJ, Weaver DL, Winchester DJ and
Hortobagyi GN: Breast cancer-major changes in the American joint
committee on cancer eighth edition cancer staging manual. CA Cancer
J Clin. 67:290–303. 2017. View Article : Google Scholar : PubMed/NCBI
|
|
3
|
Bertoli G, Cava C and Castiglioni I:
MicroRNAs: New biomarkers for diagnosis, prognosis, therapy
prediction and therapeutic tools for breast cancer. Theranostics.
5:1122–1143. 2015. View Article : Google Scholar : PubMed/NCBI
|
|
4
|
Bartel DP: Metazoan MicroRNAs. Cell.
173:20–51. 2018. View Article : Google Scholar : PubMed/NCBI
|
|
5
|
Zhang ZJ and Ma SL: miRNAs in breast
cancer tumorigenesis (Review). Oncol Rep. 27:903–910. 2012.
View Article : Google Scholar : PubMed/NCBI
|
|
6
|
Aure MR, Leivonen SK, Fleischer T, Zhu Q,
Overgaard J, Alsner J, Tramm T, Louhimo R, Alnaes GI, Perälä M, et
al: Individual and combined effects of DNA methylation and copy
number alterations on miRNA expression in breast tumors. Genome
Biol. 14:R1262013. View Article : Google Scholar : PubMed/NCBI
|
|
7
|
Ma L, Teruya-Feldstein J and Weinberg RA:
Tumour invasion and metastasis initiated by microRNA-10b in breast
cancer. Nature. 449:682–688. 2007. View Article : Google Scholar : PubMed/NCBI
|
|
8
|
Iorio MV, Ferracin M, Liu CG, Veronese A,
Spizzo R, Sabbioni S, Magri E, Pedriali M, Fabbri M, Campiglio M,
et al: MicroRNA gene expression deregulation in human breast
cancer. Cancer Res. 65:7065–7070. 2005. View Article : Google Scholar : PubMed/NCBI
|
|
9
|
Blenkiron C, Goldstein LD, Thorne NP,
Spiteri I, Chin SF, Dunning MJ, Barbosa-Morais NL, Teschendorff AE,
Green AR, Ellis IO, et al: MicroRNA expression profiling of human
breast cancer identifies new markers of tumor subtype. Genome Biol.
8:R2142007. View Article : Google Scholar : PubMed/NCBI
|
|
10
|
He K, Li WX, Guan D, Gong M, Ye S, Fang Z,
Huang JF and Lu A: Regulatory network reconstruction of five
essential microRNAs for survival analysis in breast cancer by
integrating miRNA and mRNA expression datasets. Funct Integr
Genomics. 19:645–658. 2019. View Article : Google Scholar : PubMed/NCBI
|
|
11
|
Betel D, Wilson M, Gabow A, Marks DS and
Sander C: The microRNA.org resource: Targets and expression.
Nucleic Acids Res. 36:D149–D153. 2008. View Article : Google Scholar : PubMed/NCBI
|
|
12
|
Chou CH, Shrestha S, Yang CD, Chang NW,
Lin YL, Liao KW, Huang WC, Sun TH, Tu SJ, Lee WH, et al: miRTarBase
update 2018: A resource for experimentally validated
microRNA-target interactions. Nucleic Acids Res. 46:D296–D302.
2018. View Article : Google Scholar : PubMed/NCBI
|
|
13
|
Tabas-Madrid D, Muniategui A,
Sánchez-Caballero I, Martinez-Herrera DJ, Sorzano CO, Rubio A and
Pascual-Montano A: Improving miRNA-mRNA interaction predictions.
BMC Genomics. 15 (Suppl 10):S22014. View Article : Google Scholar : PubMed/NCBI
|
|
14
|
Andrés-León E, González Peña D,
Gómez-López G and Pisano DG: miRGate: A curated database of human,
mouse and rat miRNA-mRNA targets. Database (Oxford).
2015:bav0352015. View Article : Google Scholar : PubMed/NCBI
|
|
15
|
Wong N and Wang X: miRDB: An online
resource for microRNA target prediction and functional annotations.
Nucleic Acids Res. 43:D146–D152. 2015. View Article : Google Scholar : PubMed/NCBI
|
|
16
|
Ekimler S and Sahin K: Computational
methods for microRNA target prediction. Genes (Basel). 5:671–683.
2014. View Article : Google Scholar : PubMed/NCBI
|
|
17
|
Buffa FM, Camps C, Winchester L, Snell CE,
Gee HE, Sheldon H, Taylor M, Harris AL and Ragoussis J:
microRNA-associated progression pathways and potential therapeutic
targets identified by integrated mRNA and microRNA expression
profiling in breast cancer. Cancer Res. 71:5635–5645. 2011.
View Article : Google Scholar : PubMed/NCBI
|
|
18
|
de Rinaldis E, Gazinska P, Mera A,
Modrusan Z, Fedorowicz GM, Burford B, Gillett C, Marra P,
Grigoriadis A, Dornan D, et al: Integrated genomic analysis of
triple-negative breast cancers reveals novel microRNAs associated
with clinical and molecular phenotypes and sheds light on the
pathways they control. BMC Genomics. 14:6432013. View Article : Google Scholar : PubMed/NCBI
|
|
19
|
Ritchie ME, Phipson B, Wu D, Hu Y, Law CW,
Shi W and Smyth GK: limma powers differential expression analyses
for RNA-sequencing and microarray studies. Nucleic Acids Res.
43:e472015. View Article : Google Scholar : PubMed/NCBI
|
|
20
|
Huynh-Thu VA, Irrthum A, Wehenkel L and
Geurts P: Inferring regulatory networks from expression data using
tree-based methods. PLoS One. 5:e127762010. View Article : Google Scholar : PubMed/NCBI
|
|
21
|
Subramanian A, Tamayo P, Mootha VK,
Mukherjee S, Ebert BL, Gillette MA, Paulovich A, Pomeroy SL, Golub
TR, Lander ES and Mesirov JP: Gene set enrichment analysis: A
knowledge-based approach for interpreting genome-wide expression
profiles. Proc Natl Acad Sci USA. 102:15545–15550. 2005. View Article : Google Scholar : PubMed/NCBI
|
|
22
|
Livak KJ and Schmittgen TD: Analysis of
relative gene expression data using real-time quantitative PCR and
the 2(-Delta Delta C(T)) method. Methods. 25:402–408. 2001.
View Article : Google Scholar : PubMed/NCBI
|
|
23
|
Cai WY, Wei TZ, Luo QC, Wu QW, Liu QF,
Yang M, Ye GD, Wu JF, Chen YY, Sun GB, et al: The wnt-β-catenin
pathway represses let-7 microRNA expression through transactivation
of lin28 to augment breast cancer stem cell expansion. J Cell Sci.
126:2877–2889. 2013. View Article : Google Scholar : PubMed/NCBI
|
|
24
|
Park EY, Chang E, Lee EJ, Lee HW, Kang HG,
Chun KH, Woo YM, Kong HK, Ko JY, Suzuki H, et al: Targeting of
miR34a-NOTCH1 axis reduced breast cancer stemness and
chemoresistance. Cancer Res. 74:7573–7582. 2014. View Article : Google Scholar : PubMed/NCBI
|
|
25
|
Yang S, Li Y, Gao J, Zhang T, Li S, Luo A,
Chen H, Ding F, Wang X and Liu Z: MicroRNA-34 suppresses breast
cancer invasion and metastasis by directly targeting Fra-1.
Oncogene. 32:4294–4303. 2013. View Article : Google Scholar : PubMed/NCBI
|
|
26
|
Li X, Liu F, Lin B, Luo H, Liu M, Wu J, Li
C, Li R, Zhang X, Zhou K and Ren D: miR-150 inhibits proliferation
and tumorigenicity via retarding G1/S phase transition in
nasopharyngeal carcinoma. Int J Oncol. 50:1097–1108. 2017.
View Article : Google Scholar
|
|
27
|
Jiang K, Shen M, Chen Y and Xu W: miR-150
promotes the proliferation and migration of nonsmall cell lung
cancer cells by regulating the SIRT2/JMJD2A signaling pathway.
Oncol Rep. 40:943–951. 2018.PubMed/NCBI
|
|
28
|
Xu Y, Luo X, He W, Chen G, Li Y, Li W,
Wang X, Lai Y and Ye Y: Long non-coding RNA PVT1/miR-150/ HIG2 axis
regulates the proliferation, invasion and the balance of iron
metabolism of hepatocellular carcinoma. Cell Physiol Biochem.
49:1403–1419. 2018. View Article : Google Scholar : PubMed/NCBI
|
|
29
|
Tang W, Xu P, Wang H, Niu Z, Zhu D, Lin Q,
Tang L and Ren L: MicroRNA-150 suppresses triple-negative breast
cancer metastasis through targeting HMGA2. Onco Targets Ther.
11:2319–2332. 2018. View Article : Google Scholar : PubMed/NCBI
|
|
30
|
Shu L, Wang Z, Wang Q, Wang Y and Zhang X:
Signature miRNAs in peripheral blood monocytes of patients with
gastric or breast cancers. Open Biol. 8:1800512018. View Article : Google Scholar : PubMed/NCBI
|
|
31
|
Huang S, Chen Y, Wu W, Ouyang N, Chen J,
Li H, Liu X, Su F, Lin L and Yao Y: miR-150 promotes human breast
cancer growth and malignant behavior by targeting the pro-apoptotic
purinergic P2X7 receptor. PLoS One. 8:e807072013. View Article : Google Scholar : PubMed/NCBI
|
|
32
|
Wu Q, Jin H, Yang Z, Luo G, Lu Y, Li K,
Ren G, Su T, Pan Y, Feng B, et al: MiR-150 promotes gastric cancer
proliferation by negatively regulating the pro-apoptotic gene EGR2.
Biochem Biophys Res Commun. 392:340–345. 2010. View Article : Google Scholar : PubMed/NCBI
|
|
33
|
Ma Z, Shen Y, Zeng Q, Liu J, Yang L, Fu R
and Hu G: MiR-150-5p regulates EGR2 to promote the development of
chronic rhinosinusitis via the DC-Th axis. Int Immunopharmacol.
54:188–197. 2018. View Article : Google Scholar : PubMed/NCBI
|
|
34
|
Barroga CF, Pham H and Kaushansky K:
Thrombopoietin regulates c-myb expression by modulating micro RNA
150 expression. Exp Hematol. 36:1585–1592. 2008. View Article : Google Scholar : PubMed/NCBI
|
|
35
|
Sun X, Zhang C, Cao Y and Liu E: miR-150
suppresses tumor growth in melanoma through downregulation of MYB.
Oncol Res. 21:317–323. 2019. View Article : Google Scholar
|
|
36
|
Xing L, Xu W, Qu Y, Zhao M, Zhu H, Liu H,
Wang H, Su X and Shao Z: miR-150 regulates B lymphocyte in
autoimmune hemolytic anemia/Evans syndrome by c-Myb. Int J Hematol.
107:666–672. 2018. View Article : Google Scholar : PubMed/NCBI
|
|
37
|
Fu Z and Li D, Jiang W, Wang L, Zhang J,
Xu F, Pang D and Li D: Association of BTLA gene polymorphisms with
the risk of malignant breast cancer in Chinese women of
Heilongjiang province. Breast Cancer Res Treat. 120:195–202. 2010.
View Article : Google Scholar : PubMed/NCBI
|
|
38
|
Sekar D, Govene L, Del Rio ML,
Sirait-Fischer E, Fink AF, Brüne B, Rodriguez-Barbosa JI and
Weigert A: Downregulation of BTLA on NKT cells promotes tumor
immune control in a mouse model of mammary carcinoma. Int J Mol
Sci. 19:7522018. View Article : Google Scholar
|