Introduction
Over the past years, cutting-edge research and
advanced screening, surgical and therapeutic technologies have
contributed to increasing the 5-year relative survival rate for all
types of cancer from 68 to 86% from 2010 to 2016 in adolescents in
the United States (1). Despite these
advances, the 5-year overall survival rate for advanced ovarian
cancer remains 29% after diagnosis, as determined by statistics
from 2008 to 2014 in the USA (2).
Ovarian cancer is the seventh most common type of cancer worldwide
and the second most common cause of cancer-associated death among
women with gynecological malignancies (3). Although ~70% of ovarian cancer cases are
diagnosed at a late stage, patients usually respond well to primary
therapy using cytoreductive surgery followed by adjuvant
chemotherapy (4). Nevertheless,
75–85% of patients relapse, with a median progression-free survival
time of 12–18 months, and exhibit resistance to chemotherapy, which
leads to a decrease in the 5-year survival rate to <50%
(5). Thus, the discovery of new
therapeutic targets and the elucidation of their mechanisms of
action are required to improve the prognosis and treatment of
ovarian cancer.
Bcl2-like-10 (Bcl2l10), also called Diva, Bcl-b or
Boo, is a member of the Bcl-2 family of proteins, which are central
mediators of apoptosis and autophagy (6). Previous studies have revealed that
Bcl2l10 exhibits both pro-apoptotic and anti-apoptotic functions
depending on the type of cells or tissues, and is recognized for
its dual pro-apoptotic (7,8) and anti-apoptotic activities (9,10). Bcl2l10
has been reported to have oncogenic functions in myelodysplastic
syndromes, acute myeloid leukemia (AML), glioma and breast cancer
(9,11,12), but
it acts as a tumor suppressor gene in gastric and lung cancer cells
(13,14). Based on our previous findings that
Bcl2l10 regulates cytoskeletal organization as a functional partner
of Aurora kinase A (AURKA) during mouse oocyte maturation (15), it was hypothesized that Bcl2l10 may
have oncogenic functions in ovarian cancer, since AURKA has been
reported as an oncogene (16,17). However, our recent study has revealed
that Bcl2110 is a tumor suppressor gene in human ovarian cancer
cells (18). Specifically, the
suppression of Bcl2l10 in SKOV3 and A2780 cells causes cell cycle
arrest at the G0/G1 phase and stimulates cell
proliferation independently of apoptotic regulation (18). The current study aimed to clarify the
molecular mechanism underlying the oncogenic effects induced by
Bcl2l10-knockdown in ovarian cancer cells.
Materials and methods
Cell culture
Two ovarian cancer cell lines were used in the
present study. SKOV3 cells were obtained from the Korean Cell Line
Bank (Korean Cell Line Research Foundation) and maintained in
RPMI-1640 medium (Gibco; Thermo Fisher Scientific, Inc.) containing
10% FBS (Gibco; Thermo Fisher Scientific, Inc.), 25 mM HEPES
(Gibco; Thermo Fisher Scientific, Inc.) and 25 mM NaHCO3
(Sigma-Aldrich; Merck KGaA). A2780 cells were obtained from
CellBank Australia and maintained in RPMI-1640 medium containing
10% FBS. All cells were cultured in a 5% CO2 atmosphere
at 37°C.
Cell transfection
Bcl2l10 small interfering (si)RNA was synthesized by
Shanghai GenePharma Co., Ltd., and a non-targeting negative control
siRNA was purchased from Bioneer Corporation. One day before
transfection, A2780 (2×10⁵/well) and SKOV3
(1.5×10⁵/well) cells were seeded in 6-well plates, and
before transfection, the medium was removed and replaced with 1.5
ml fresh growth medium. All siRNA molecules were diluted in 0.25 ml
OPTI-MEM (Gibco; Thermo Fisher Scientific, Inc.) to a final
concentration of 100 nM, and Lipofectamine® 3000
(Invitrogen; Thermo Fisher Scientific, Inc.) was diluted in 0.25 ml
OPTI-MEM. The solutions were incubated individually for 5 min at
room temperature and then combined, and the mixture was incubated
for an additional 20 min at room temperature and then added to each
well containing cells, which were maintained in a 5% CO2
atmosphere at 37°C for 48 h. All cells were harvested 48 h after
transfection for subsequent experiments. The following Bcl2l10
siRNA sequences were used: Sense, 5′-CAACAGCCUUCAUUUAUCU-3′ and
antisense, 5′-AGAUAAAUGAAGGCUGUUG-3′.
Total RNA extraction and cDNA
synthesis
After the cultured cells were washed twice with PBS,
1 ml TRIzol® (Takara Bio, Inc.) and 0.2 ml chloroform
were added, and the mixture was incubated for 10 min at room
temperature. The cells were centrifuged at 12,000 × g at 4°C for 20
min, and the supernatants were transferred to new tubes and
resuspended in 0.5 ml isopropanol. The tubes were then centrifuged
at 12,000 × g at 4°C for 10 min, and the supernatants were
discarded. The pellets were dried, washed with 75% ethanol, dried
and dissolved in 0.1% diethylpyrocarbonate (DEPC)-treated water.
For the synthesis of first-strand cDNA, total RNA (2 µg) was added
to DNase I and DNase I buffer (both New England BioLabs, Inc.), and
the total volume was adjusted to 11 ml with DEPC-treated water.
After the mixture was incubated at room temperature for 15 min, 1
ml of 25 mM EDTA was added, and the mixture was incubated at 65°C
for 15 min. Subsequently, 1 ml of oligo dT was added, and the
mixture was incubated at 70°C for 10 min. M-MLV RNase (Promega
Corporation), 5X buffer (Promega Corporation), RNase inhibitor
(Promega Corporation) and 10 mM dNTP were then added, and reverse
transcription was performed at 42°C for 1 h and 94°C for 2 min.
Quantitative (q)PCR
qPCR analysis was performed using an iCycler system
(Bio-Rad Laboratories, Inc.). iQ SYBR Green Supermix PCR reagents
(Bio-Rad Laboratories, Inc.) were used for monitoring the
amplification, and the results were evaluated with the iCycler iQ
real-time detection system software. The amplification mixture
contained cDNA, 5 pmol forward and reverse primers, and SYBR Green
Supermix. qPCR involved an initial denaturation step at 95°C for 5
min, followed by 40 cycles of denaturation at 95°C for 40 sec,
annealing at 60°C for 40 sec and extension at 72°C for 40 sec. Upon
the completion of PCR, the fluorescence was monitored while slowly
heating the samples from 55 to 95°C at 0.5°C intervals. Human GAPDH
was used as the endogenous reference for mRNA normalization, and
fold-changes were calculated using the 2−ΔΔCq method
(19). The primer sequences used for
qPCR are listed in Table I.
 | Table I.Primer sequences used for
quantitative PCR. |
Table I.
Primer sequences used for
quantitative PCR.
| Genes | Forward sequences
(5′→3′) | Reverse sequences
(5′→3′) |
|---|
| Bcl2l10 |
GGTCCTTTTTCTCCGCCTAC |
CTGGAAGCCCCACTTCTTC |
| ZNF845 |
AGGCCTTCAGTCAGAAGTCATC |
GTGTGAATCACGCCCAAAA |
| MED11 |
AGAGACTACGCGCTCTGGAA |
AGGAGCCGCTCGTTAGTTTT |
| POLR2D |
TTGCCAGTGTTCGTAGCTTG |
TGCAGCTCCTCATCTTCAAA |
| FOXP4 |
CACCAGGATGTTCGCCTATT |
TTCTGATACTCCCGCTCGTC |
| ZNF415 |
AATTCACACCTTGCGAGTCA |
GAAGCCTTTGCCACATTGAT |
| HABP4 |
CGGAAACCAGAATCCACTGT |
GCTGGGATGTGATGTCATTG |
| SETD7 |
GGGAACTTTGTTCACGGAGA |
TCCCCCATCTTCGTAAGTGT |
| ZNF721 |
CCTTTGGATGGTCCACAAAC |
AGCAAAGCTTGAGGATGACG |
| VOPP1 |
GATGAACCCTGTCGGGAAT |
GGCCTTCACTACCTGTTCGTA |
| ZNF765 |
CATCTGCCTGAACTGCACAT |
TTCTTTGGGCTGTTGAAACC |
| ZSCAN29 |
AGGAAGACAGTGGGCAAAGA |
TCCCAAGCAAGGTCTCTGTT |
| ZNF267 |
CACACCTTATTCGACATCATCG |
TGCACAGTAAGACCTGAGGAGT |
| ACER2 |
GCAGTCCTTTGGGTTCTGAT |
TGTTGATGGCAGGCTTGA |
| SDHD |
CTGGAGGCTGAGTGCCGTTT |
TCTGGGATAGGTCGGTCCTGAA |
| IDH1 |
TTGTCCAGATGGCAAGACAG |
CTCTGGTCCAGGCAAAAATG |
| LCLAT1 |
CATCCAAGGAGGACCTTCAA |
CAGACTTGCAAGGTGGAATG |
| ENOPH1 |
CGAAAGACCACTGCACTCAA |
CTCCGTAGAATGCCCGAATA |
| IDI1 |
CCGAGCTTGAGGAAAGTGAC |
CATGTTCACCCCAGATACCA |
| HPRT1 |
GACCAGTCAACAGGGGACAT |
CTTGCGACCTTGACCATCTT |
| PAICS |
CAGTGGTCTTGGCTGTTCAA |
CAGCCTGCTTCAAGGAAATC |
| ATP6V1D |
GTGGGGAACAGTTGGCTAAA |
GCATTTACACGCCTGTTGGT |
| ACSL5 |
TCCCGAATGGAACTCTGAAG |
AGCTCTCCCCGTGTACAAAA |
| TPM4 |
CTGAGACCCGTGCTGAATTT |
AGCCCACGTTCTCTTCTTTG |
| GAPDH |
TCAAGAAGGTGGTGAAGCAG |
CCCTGTTGCTGTAGCCAAAT |
Western blot analysis
Proteins were extracted from the siRNA-transfected
cells using RIPA lysis buffer with 1% protease inhibitor cocktail
(Thermo Fisher Scientific, Inc.) and 0.5 M EDTA (pH 8.0). Protein
concentration was estimated using the Bio-Rad protein assay reagent
(Bio-Rad Laboratories, Inc.) according to the manufacturer's
instructions. The protein extracts (50 µg/lane) were separated by
10% SDS-PAGE and transferred to PVDF membranes (Amersham; Cytiva).
The membranes were blocked for 1 h at room temperature in TBS/Tween
(TBST; 0.2 M NaCl, 0.1% Tween-20 and 10 mM Tris, pH 7.4) containing
5% skimmed dry milk. The immunoblots were incubated overnight at
4°C on a shaker with diluted polyclonal primary antibodies against
BCL2L10 (cat. no. 3869S; Cell Signaling Technology, Inc.),
succinate dehydrogenase complex subunit D (SDHD; cat. no.
PA5-34387; Thermo Fisher Scientific, Inc.), isocitrate
dehydrogenase 1 (IDH1; cat. no. 3997S; Cell Signaling Technology,
Inc.), fumarate hydratase (FH; cat. no. GTX110128; GeneTex
International Corporation), tropomyosin 4 (TPM4; cat. no.
PA5-340194; Thermo Fisher Scientific, Inc.) and β-actin (cat. no.
PA1-183; Invitrogen; Thermo Fisher Scientific, Inc.), all of which
were diluted 1:1,000. The membranes were then washed several times
with TBST and incubated with diluted HRP-conjugated goat
anti-rabbit IgG secondary antibody (1:2,000; cat. no. 65-6120;
Thermo Fisher Scientific, Inc.) for 1 h at room temperature.
Finally, the membranes were washed several times with TBST, and
Amersham™ ECL™ Prime Western Blotting Detection Reagent (cat. no.
RPN2232; GE Healthcare Life Sciences) was used to visualize
chemiluminescence. The relative protein expression levels were
quantified using the ChemiDoc XRS+ imaging system with Image Lab
software version 6.0.0 (Bio-Rad Laboratories, Inc.).
RNA isolation for sequencing
For RNA-Seq analysis, duplicate samples obtained
from two repeated experiments were used. Total RNA was isolated
from cells using TRIzol reagent (Invitrogen; Thermo Fisher
Scientific, Inc.). The RNA quality was assessed using an Agilent
2100 bioanalyzer (Agilent Technologies, Inc.), and RNA
quantification was performed using a NanoDrop 2000
Spectrophotometer (Thermo Fisher Scientific, Inc.).
Library preparation and
sequencing
All RNA-Seq and analysis of sequencing data were
performed by ebiogen, Inc. Libraries were prepared from total RNA
using the SMARTer Stranded RNA Seq kit (cat. no. 634839; Clontech
Laboratories, Inc.). mRNA isolation was performed using the Poly(A)
RNA Selection kit (Lexogen GmbH). The isolated mRNAs were used for
cDNA synthesis and shearing according to the manufacturer's
instructions (Clontech Laboratories, Inc.). Indexing was performed
using Illumina indexes 1–12 found in Illumina Adapter Sequences
(document no. 1000000002694, v14), and enrichment was conducted by
PCR. Subsequently, the libraries were checked using the Agilent
2100 bioanalyzer (DNA High Sensitivity kit; Agilent Technologies,
Inc.) to evaluate the mean fragment size. Quantification was
performed using a library quantification kit and a StepOne Real
Time PCR System (Thermo Fisher Scientific, Inc.). High-throughput
sequencing was performed as paired-end 100 bp sequencing using the
HiSeq 2500 system (Illumina, Inc.).
Analysis of RNA sequencing (RNA-Seq)
data
Quality control of the raw sequencing data was
performed using FastQC (https://www.bioinformatics.babraham.ac.uk/projects/fastqc/).
Adapter and low-quality reads (<Q20) were removed using
FASTX_Trimmer (http://hannonlab.cshl.edu/fastx_toolkit/) and BBMap
(https://sourceforge.net/projects/bbmap/). The trimmed
reads were mapped to the UCSC Human genome (hg19) using TopHat
(20). Gene expression levels were
estimated based on read count and Fragments Per Kilobase Million
values calculated using BEDTools (21) and Cufflinks (22). The expression values were normalized
based on the quantile normalization method using edgeR within R
(https://www.r-project.org/). Data mining
and graphic visualization were performed using ExDEGA V3.0.1
(ebiogen, Inc.). To define differentially expressed genes (DEGs),
adjusted |log2fold-change (FC)|≥1 and P<0.05 were
selected as the cut-off values. The functions and associated
pathways of the DEGs were further analyzed using the Gene Ontology
(GO) and Kyoto Encyclopedia of Genes and Genomes (KEGG) pathway
using the DAVID database (https://david.ncifcrf.gov/).
Measurement of levels of succinate and
isocitrate
Cellular contents of succinate and isocitrate in
ovarian cancer cells after Bcl2l10-knockdown were measured using a
succinate colorimetric assay kit (cat. no. K649-100; BioVision,
Inc.) and isocitrate colorimetric assay kit (cat. no. K656-100;
BioVision, Inc.), according to the manufacturer's instructions.
Briefly, cells (2×10⁶) were rapidly homogenized on ice
using 100 µl of ice-cold supplied-assay buffer and centrifuged at
4°C at 10,000 × g for 5 min (succinate) or 15,000 × g for 10 min
(isocitrate) to remove any cell debris. Supernatants (50 µl) were
collected and diluted 1:1 with assay buffer. The samples were then
added to duplicate wells in a 96-well plate and mixed with the
appropriate reaction mix. The resultant mixtures were further
incubated at 37°C for 30 min. The concentrations were determined
using a microplate reader at a wavelength of 450 nm and calculated
based on a standard curve.
Statistical analysis
The statistical analysis was performed using
GraphPad Prism 9.0 (GraphPad Software, Inc.). The data are
presented as the mean ± SEM from four independent experiments. The
differences between the negative control and the Bcl2l10
siRNA-treated groups were analyzed using unpaired Student's t-test.
P<0.05 was considered to indicate a statistically significant
difference.
Results
Identification of DEGs by Bcl2l10
suppression
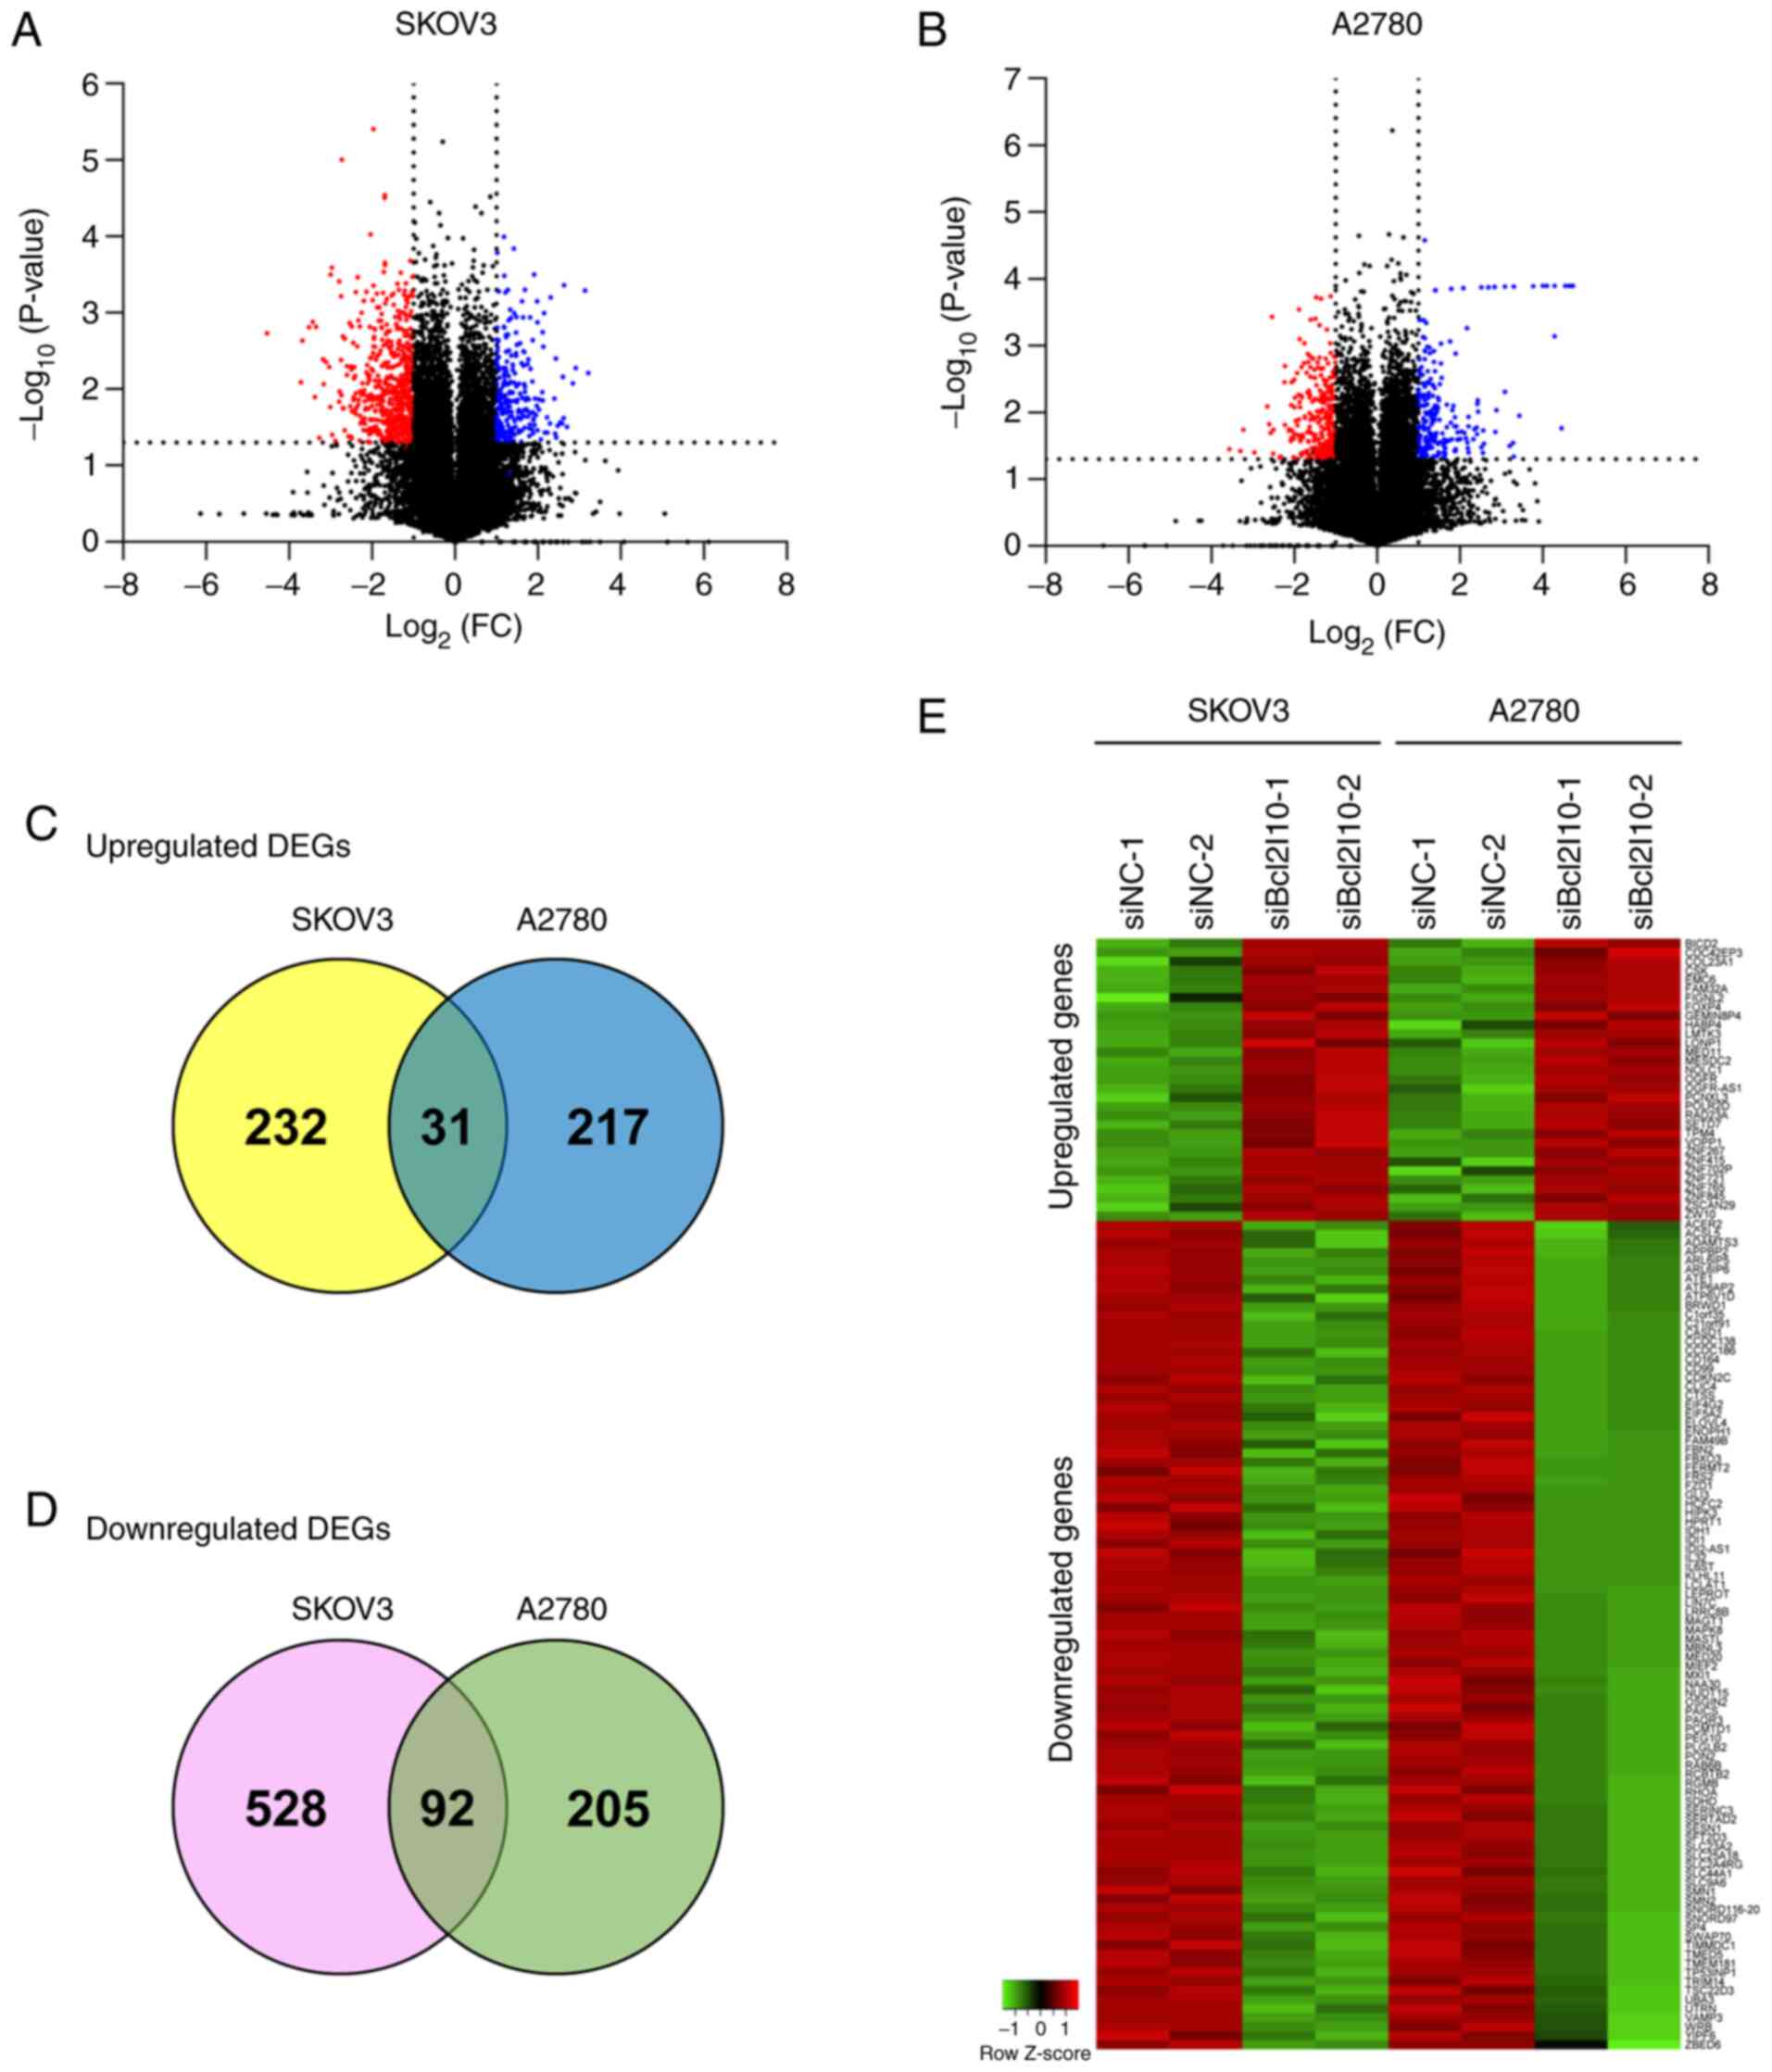
To investigate the molecular mechanisms through
which Bcl2l10 may exert anticancer effects on ovarian cancer cells,
a list of DEGs after Bcl2l10-knockdown in two ovarian cancer cell
lines, SKOV3 and A2780, was obtained by RNA-Seq. The volcano plots
from RNA-Seq data show the 25,737 expressed genes in both SKOV3 and
A2780 cells after Bcl2l10-knockdown (Fig.
1A and B). The number of significantly expressed genes in
response to Bcl2l10-knockdown with P<0.05 was 3,852 and 3,296 in
SKOV3 and A2780 cells, respectively. Using more stringent criteria
(|log2FC|≥1 and P<0.05), 883 and 545 significantly
deregulated genes were selected in SKOV3 and A2780 cells,
respectively. Of the 883 genes in SKOV3 cells, 263 genes were
upregulated and 620 genes were downregulated (Fig. 1A). Of the 545 genes in A2780 cells,
248 genes were upregulated and 297 genes were downregulated
(Fig. 1B). The Venn diagrams indicate
that 31 genes were significantly upregulated, whereas 92 genes were
significantly downregulated in both SKOV3 and A2780 cells (Fig. 1C and D). These 123 genes were
classified as common DEGs regulated by Bcl2l10 and used for further
analysis. All common DEGs are listed in Tables II and III, and the relative expression levels of
these genes are shown in a hierarchical clustering heat map
(Fig. 1E). The present study
subsequently focused on the common DEGs to further explore the
roles of genes associated with Bcl2l10 in ovarian cancer cells.
| Table II.List of the commonly upregulated
differentially expressed genes after Bcl2l10-knockdown. |
Table II.
List of the commonly upregulated
differentially expressed genes after Bcl2l10-knockdown.
|
| SKOV3 cells | A2780 cells |
|---|
|
|
|
|
|---|
| Gene |
log2FC | P-value |
log2FC | P-value |
|---|
| BICD2 | 1.65 | 0.003 | 1.44 | 0.010 |
| CDC42EP3 | 1.06 | 0.001 | 1.01 | 0.049 |
| COL23A1 | 1.52 | 0.023 | 1.51 | 0.013 |
| CSK | 1.27 | 0.029 | 1.21 | 0.004 |
| EMC6 | 1.87 | 0.002 | 1.56 | 0.003 |
| FAM32A | 1.22 | 0.005 | 1.03 | 0.003 |
| FIGNL2 | 1.99 | 0.034 | 1.54 | 0.001 |
| FOXP4 | 1.49 | 0.015 | 1.35 | 0.027 |
| GEMIN8P4 | 1.61 | 0.020 | 1.73 | 0.027 |
| HABP4 | 1.65 | 0.005 | 1.09 | 0.045 |
| LMTK3 | 1.53 | 0.037 | 1.65 | 0.034 |
| LONP1 | 1.11 | 0.013 | 1.02 | 0.002 |
| MED11 | 2.11 | 0.011 | 1.38 | 0.002 |
| MESDC2 | 1.44 | 0.006 | 1.17 | 0.010 |
| NOLC1 | 1.39 | 0.005 | 1.22 | 0.001 |
| OGFR | 1.66 | 0.023 | 1.81 | 0.009 |
| OGFR-AS1 | 1.44 | 0.025 | 1.39 | 0.013 |
| PCNXL3 | 1.07 | 0.026 | 1.16 | 0.018 |
| POLR2D | 1.20 | 0.005 | 1.15 | 0.004 |
| RAD23A | 1.10 | 0.013 | 1.25 | 0.005 |
| SETD7 | 1.12 | 0.020 | 1.13 | 0.008 |
| TPM4 | 2.48 | 0.030 | 1.87 | 0.016 |
| VOPP1 | 1.44 | 0.040 | 1.12 | 0.006 |
| ZNF267 | 1.24 | 0.003 | 1.79 | 0.014 |
| ZNF415 | 1.29 | 0.001 | 1.04 | 0.022 |
| ZNF702P | 2.30 | 0.001 | 1.65 | 0.025 |
| ZNF721 | 1.29 | 0.008 | 1.11 | 0.001 |
| ZNF765 | 1.69 | 0.013 | 1.20 | 0.011 |
| ZNF845 | 1.67 | 0.003 | 1.25 | 0.020 |
| ZSCAN29 | 1.24 | 0.026 | 1.35 | 0.004 |
| ZW10 | 1.18 | 0.005 | 1.11 | 0.012 |
| Table III.List of the commonly downregulated
differentially expressed genes after Bcl2l10-knockdown. |
Table III.
List of the commonly downregulated
differentially expressed genes after Bcl2l10-knockdown.
|
| SKOV3 cells | A2780 cells |
|---|
|
|
|
|
|---|
| Gene |
log2FC | P-value |
log2FC | P-value |
|---|
| ACER2 | −2.61 | 0.005 | −1.63 | 0.006 |
| ACSL5 | −1.53 | 0.021 | −2.02 | 0.047 |
| ADAMTS3 | −1.56 | 0.019 | −1.09 | 0.010 |
| APPBP2 | −1.35 | 0.008 | −1.39 | 0.002 |
| ARL6IP5 | −1.84 | 0.001 | −1.90 | 0.005 |
| ARL6IP6 | −1.49 | 0.001 | −1.36 | 0.010 |
| ATE1 | −1.77 | 0.001 | −1.62 | 0.003 |
| ATP6AP2 | −1.09 | 0.006 | −1.12 | 0.001 |
| ATP6V1D | −2.73 | <0.001 | −1.13 | 0.001 |
| BRWD1 | −1.16 | 0.033 | −1.54 | 0.002 |
| C1orf35 | −1.30 | 0.002 | −1.15 | 0.018 |
| C21orf91 | −1.83 | 0.003 | −1.34 | 0.007 |
| CASD1 | −1.09 | 0.014 | −1.06 | 0.015 |
| CCDC138 | −1.11 | 0.011 | −1.32 | 0.046 |
| CCDC186 | −1.41 | 0.001 | −1.61 | 0.001 |
| CD164 | −2.25 | 0.001 | −1.89 | <0.001 |
| CD99 | −1.69 | <0.001 | −1.07 | 0.002 |
| CDKN2C | −1.30 | 0.013 | −1.35 | 0.006 |
| CLIC4 | −2.02 | 0.005 | −2.23 | 0.002 |
| CTSS | −1.69 | 0.001 | −1.22 | 0.037 |
| EIF4G2 | −2.75 | 0.001 | −1.67 | 0.001 |
| EIF5A2 | −1.97 | 0.003 | −1.05 | 0.008 |
| ELOVL4 | −3.17 | 0.009 | −2.54 | <0.001 |
| ENOPH1 | −2.70 | 0.002 | −1.82 | 0.002 |
| FAM49B | −1.91 | 0.004 | −1.38 | 0.005 |
| FBN2 | −1.02 | 0.023 | −1.28 | 0.037 |
| FBXO3 | −1.39 | <0.001 | −1.14 | 0.014 |
| FERMT2 | −2.75 | 0.004 | −1.62 | 0.005 |
| FRS2 | −1.08 | 0.015 | −1.05 | 0.015 |
| FZD1 | −1.97 | 0.003 | −1.99 | 0.008 |
| GLI3 | −1.09 | 0.025 | −1.02 | 0.003 |
| HCFC2 | −1.29 | 0.008 | −1.13 | 0.033 |
| HIPK3 | −1.94 | 0.003 | −1.50 | 0.003 |
| HPRT1 | −1.31 | <0.001 | −1.51 | 0.003 |
| IDH1 | −2.51 | 0.005 | −1.61 | 0.013 |
| IDI1 | −1.03 | 0.012 | −1.18 | 0.017 |
| IDI2-AS1 | −1.31 | 0.009 | −1.20 | 0.038 |
| IL32 | −1.76 | 0.019 | −3.30 | 0.038 |
| IL6ST | −2.43 | 0.013 | −1.57 | 0.011 |
| KLHL11 | −1.20 | 0.004 | −1.17 | 0.004 |
| LCLAT1 | −1.89 | 0.001 | −1.76 | 0.001 |
| LEPROT | −1.16 | 0.006 | −1.35 | 0.002 |
| LIN7C | −2.04 | <0.001 | −2.24 | 0.004 |
| LRRC8B | −1.91 | 0.009 | −1.36 | 0.007 |
| MAGT1 | −1.83 | 0.001 | −1.30 | 0.005 |
| MAPK8 | −1.48 | 0.005 | −1.25 | 0.031 |
| MASTL | −1.01 | 0.001 | −1.09 | 0.022 |
| MBNL3 | −1.61 | 0.039 | −1.18 | 0.034 |
| MED20 | −1.53 | 0.003 | −1.05 | 0.003 |
| MIEF2 | −1.28 | 0.022 | −1.93 | 0.016 |
| MXI1 | −2.40 | 0.001 | −1.39 | <0.001 |
| NAA30 | −1.62 | 0.002 | −1.10 | 0.006 |
| NUDT15 | −2.05 | 0.004 | −1.11 | 0.005 |
| OSGIN2 | −1.82 | 0.012 | −1.12 | 0.025 |
| PAICS | −1.01 | 0.005 | −1.10 | 0.028 |
| PAQR3 | −2.55 | 0.001 | −1.66 | 0.027 |
| PCMTD1 | −1.67 | 0.002 | −1.50 | 0.012 |
| PEG10 | −1.40 | 0.001 | −2.01 | 0.025 |
| PLGLB2 | −1.32 | 0.008 | −1.68 | 0.049 |
| PON2 | −1.40 | 0.022 | −1.11 | 0.005 |
| RAB6B | −1.65 | 0.011 | −1.24 | 0.011 |
| RCBTB2 | −1.29 | 0.009 | −1.13 | 0.004 |
| RGMB | −1.41 | 0.009 | −1.08 | 0.003 |
| RHOA | −2.14 | 0.001 | −1.29 | 0.003 |
| SDHD | −2.97 | 0.000 | −1.97 | 0.013 |
| SERINC3 | −2.06 | 0.007 | −1.32 | 0.024 |
| SERTAD2 | −1.94 | 0.002 | −1.47 | 0.000 |
| SESN1 | −1.29 | 0.014 | −1.54 | 0.040 |
| SFT2D3 | −1.03 | 0.027 | −1.39 | 0.010 |
| SLC23A2 | −1.34 | 0.021 | −1.18 | 0.028 |
| SLC25A18 | −1.41 | 0.032 | −2.97 | 0.040 |
| SLC2A4RG | −1.62 | 0.004 | −1.05 | 0.029 |
| SLC44A1 | −1.95 | 0.002 | −1.32 | 0.009 |
| SLC9A6 | −1.58 | 0.002 | −1.61 | <0.001 |
| SMN1 | −1.69 | <0.001 | −1.14 | 0.003 |
| SMN2 | −1.65 | 0.001 | −1.10 | 0.004 |
| SNORD116-20 | −1.93 | 0.035 | −1.12 | 0.009 |
| SNORD97 | −2.66 | 0.002 | −1.35 | 0.017 |
| SP4 | −1.29 | 0.013 | −1.05 | 0.009 |
| SWAP70 | −2.79 | <0.001 | −1.37 | 0.010 |
| TIMMDC1 | −1.72 | <0.001 | −1.29 | 0.007 |
| TMED5 | −1.36 | 0.008 | −1.01 | 0.029 |
| TMEM181 | −1.51 | 0.003 | −1.05 | 0.024 |
| TP53INP1 | −2.51 | 0.005 | −2.36 | 0.048 |
| TRIM14 | −2.24 | 0.008 | −1.58 | 0.034 |
| TSC22D3 | −1.04 | 0.023 | −1.27 | 0.032 |
| UBA3 | −1.23 | 0.036 | −1.58 | 0.021 |
| UTRN | −1.37 | 0.031 | −1.43 | 0.002 |
| VAMP3 | −1.60 | 0.003 | −1.45 | 0.010 |
| WRB | −2.12 | 0.005 | −1.98 | 0.006 |
| YIPF6 | −1.12 | 0.005 | −1.21 | 0.001 |
| ZBED6 | −1.22 | 0.016 | −1.35 | 0.030 |
Characterization of common DEGs after
Bcl2l10-knockdown
GO analysis of the 31 genes that were upregulated by
Bcl2l10-knockdown in both SKOV3 and A2780 cells indicated that
these genes were enriched in five GO terms encompassing two
biological process, one cellular compound (CC) and two molecular
function terms (Table IV). As a
result, it was identified that 13/31 commonly upregulated genes
were involved in the regulation of transcription. In particular,
the ranking of the 31 genes by FC indicated that the top 20
upregulated genes in both SKOV3 and A2780 cells included five genes
(ZNF845, MED11, FOXP4, ZNF765 and ZNF702P) among the 13 genes
associated with transcriptional regulation (Table SI). The most enriched CC term of the
commonly upregulated genes after Bcl2l10-knockdown was GO:0005634
‘nucleus’ (Table IV). The KEGG
pathway analysis did not identify any pathway enriched in the list
of genes that were upregulated by Bcl2l10-knockdown in both cell
lines.
| Table IV.GO analysis of 31 genes commonly
upregulated by Bcl2l10-knockdown. |
Table IV.
GO analysis of 31 genes commonly
upregulated by Bcl2l10-knockdown.
| A, GO terms
(biological process) |
|---|
|
|---|
| Accession no. | Term | Count | Genes | P-value |
|---|
| GO:0006351 | Transcription,
DNA-templated | 13 | ZNF845, MED11,
POLR2D, FOXP4, ZNF415, HABP4, SETD7, ZNF721, VOPP1, ZNF765,
ZSCAN29, ZNF702P, ZNF267 |
1.20×10−05 |
| GO:0006355 | Regulation of
transcription, DNA-templated | 9 | ZNF845, ZNF415,
SETD7, HABP4, VOPP1, ZNF721, ZNF765, ZNF702P, ZNF267 | 0.001 |
|
| B, GO terms
(cellular component) |
|
| Accession
no. | Term | Count | Genes | P-value |
|
| GO:0005634 | Nucleus | 15 | ZNF845, RAD23A,
POLR2D, FOXP4, LONP1, HABP4, OGFR, FIGNL2, ZNF721, FAM32A, ZNF765,
ZSCAN29, ZNF702P, ZW10, ZNF267 | 0.013 |
|
| C, GO term
(molecular function) |
|
| Accession
no. | Term | Count | Genes | P-value |
|
| GO:0046872 | Metal ion
binding | 10 | ZNF845, ZNF415,
LMTK3, ZNF721, ZNF765, CSK, FOXP4, ZSCAN29, ZNF702P, ZNF267 | 0.004 |
| GO:0003697 | Single-stranded DNA
binding | 3 | LONP1, RAD23A,
POLR2D | 0.010 |
Moreover, 92 genes were downregulated by
Bcl2l10-knockdown in both SKOV3 and A2780 cells. In contrast to the
commonly upregulated genes, these downregulated genes were enriched
in the terms ‘cytoplasm’ (GO:0005737), containing the cell regions
excluding the plasma membrane and nucleus but including other
subcellular structures, and ‘protein binding’ (GO:0005515)
(Table V). GO analysis demonstrated
that upregulated and downregulated genes after Bcl2l10-knockdown
may have clearly distinct functions in ovarian cancer progression.
Although P>0.05, the KEGG pathway analysis revealed that the
commonly downregulated genes were mainly involved in ‘metabolic
pathways’, ‘biosynthesis of antibiotics’ and ‘pathways in cancer’
(Table V). Notably, the largest
proportion (~11%) of the commonly downregulated genes after
Bcl2l10-knockdown was involved in metabolic pathways. The ordering
of the 92 commonly downregulated genes based on their FC in each
cell line (in descending order) revealed that three metabolic genes
(SDHD, ENOPH1 and ACER2) were included in the list of top 20
downregulated genes (Table SII),
which suggested that Bcl2l10 strongly affected ovarian cancer
metabolism. To validate the RNA-Seq findings that potential target
genes of Bcl2l10 regulated transcription and metabolism in cancer,
the expression levels of some transcription- and
metabolism-associated genes among the common DEGs after
Bcl2l10-knockdown were analyzed in two ovarian cancer cell
lines.
| Table V.GO analysis and KEGG pathway analysis
of 92 genes commonly downregulated by Bcl2l10-knockdown. |
Table V.
GO analysis and KEGG pathway analysis
of 92 genes commonly downregulated by Bcl2l10-knockdown.
| A, GO terms
(biological process) |
|---|
|
|---|
| Accession no. | Term | Count | Genes | P-value |
|---|
| GO:0045669 | Positive regulation
of osteoblast differentiation | 3 | IL6ST, FBN2,
GLI3 | 0.033 |
| GO:0016485 | Protein
processing | 3 | CTSS, ADAMTS3,
GLI3 | 0.042 |
| GO:0006353 | DNA-templated
transcription, termination | 2 | SMN2, SMN1 | 0.046 |
|
| B, GO terms
(cellular component) |
|
| Accession
no. | Term | Count | Genes | P-value |
|
| GO:0005737 | Cytoplasm | 36 | SLC2A4RG, LRRC8B,
FERMT2, UTRN, TRIM14, HCFC2, MXI1, HPRT1, GLI3, SESN1, PEG10,
TSC22D3, NAA30, CDKN2C, SLC23A2, IDH1, MASTL, MBNL3, APPBP2, FBXO3,
FRS2, SERTAD2, SWAP70, LIN7C, CD99, SMN2, SMN1, ATE1, BRWD1, CLIC4,
HIPK3, SP4, PCMTD1, KLHL11, PAICS, TP53INP1 | 0.006 |
| GO:0005829 | Cytosol | 25 | FERMT2, NUDT15,
IL32, HPRT1, SESN1, GLI3, ATP6V1D, SMN2, SMN1, EIF4G2, TSC22D3,
CLIC4, CDKN2C, UBA3, RHOA, IDH1, VAMP3, RAB6B, MAPK8, FBXO3,
ENOPH1, IDI1, PAICS, EIF5A2, TP53INP1 | 0.011 |
| GO:0005793 | Endoplasmic
reticulum-Golgi intermediate compartment | 3 | RGMB, TMED5,
RAB6B | 0.040 |
| GO:0005789 | Endoplasmic
reticulum membrane | 9 | TMED5, SLC9A6,
LRRC8B, RHOA, LCLAT1, EIF5A2, ARL6IP5, WRB, ACSL5 | 0.042 |
| GO:0007504 | Gemini of coiled
bodies | 2 | SMN2, SMN1 | 0.049 |
|
| C, GO term
(molecular function) |
|
| Accession
no. | Term | Count | Genes | P-value |
|
| GO:0005515 | Protein
binding | 50 | LRRC8B, ATP6AP2,
IL6ST, FERMT2, UTRN, IL32, HPRT1, MXI1, C1ORF35, SESN1, GLI3,
MED20, RCBTB2, PEG10, FAM49B, TMED5, NAA30, CDKN2C, ELOVL4, RHOA,
RAB6B, MBNL3, APPBP2, FBN2, FBXO3, ARL6IP5, FRS2, TIMMDC1, YIPF6,
MIEF2, SWAP70, NUDT15, FZD1, CD164, SMN2, ATP6V1D, SMN1, ATE1,
EIF4G2, CLIC4, UBA3, SP4, LCLAT1, VAMP3, MAPK8, ADAMTS3, PAICS,
EIF5A2, SLC25A18, TP53INP1 | 0.047 |
|
| D, KEGG pathway
analysisa |
|
| Accession
no. | Term | Count | Genes | P-value |
|
| hsa01100 | Metabolic
pathways | 10 | ACER2, SDHD, IDH1,
LCLAT1, ENOPH1, IDI1, HPRT1, PAICS, ATP6V1D, ACSL5 | 0.070 |
| hsa01130 | Biosynthesis of
antibiotics | 4 | SDHD, IDH1, IDI1,
PAICS | 0.064 |
| hsa05200 | Pathways in
cancer | 4 | FZD1, RHOA, MAPK8,
GLI3 | 0.234 |
| hsa04722 | Neurotrophin
signaling pathway | 3 | RHOA, MAPK8,
FRS2 | 0.096 |
| hsa04071 | Sphingolipid
signaling pathway | 3 | ACER2, RHOA,
MAPK8 | 0.096 |
| hsa04310 | Wnt signaling
pathway | 3 | FZD1, RHOA,
MAPK8 | 0.121 |
| hsa04145 | Phagosome | 3 | VAMP3, CTSS,
ATP6V1D | 0.138 |
| hsa03013 | RNA transport | 3 | EIF4G2, SMN2,
SMN1 | 0.172 |
| hsa05152 | Tuberculosis | 3 | RHOA, MAPK8,
CTSS | 0.180 |
| hsa04024 | cAMP signaling
pathway | 3 | RHOA, MAPK8,
GLI3 | 0.213 |
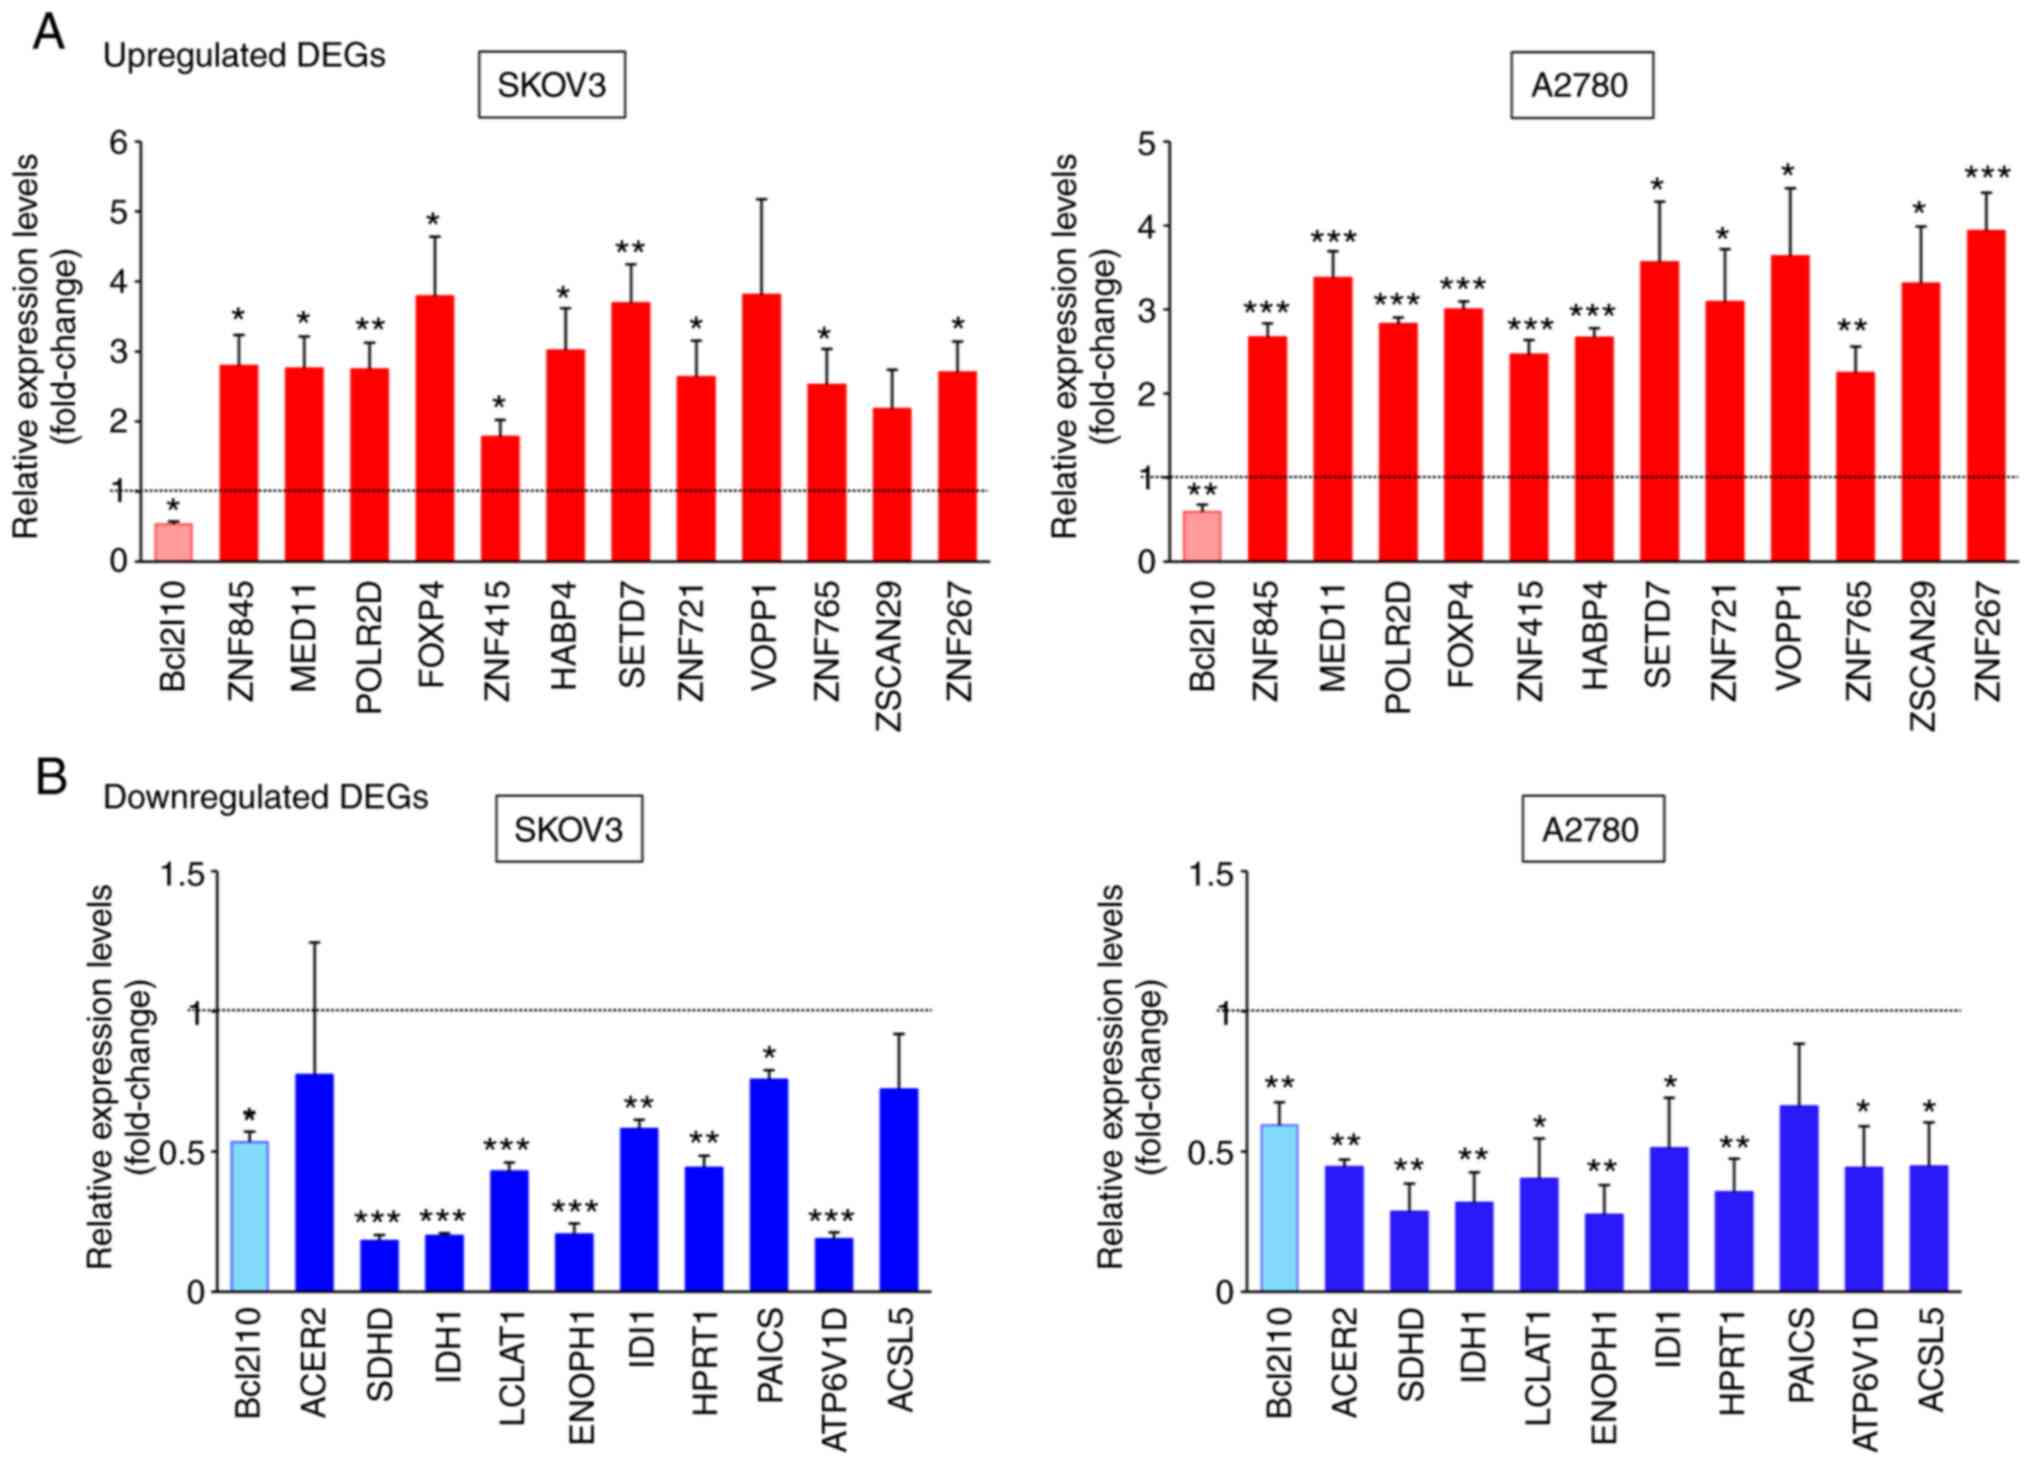
Validation of DEGs as potential
targets of Bcl2l10
To validate the reliability of the RNA-Seq data,
22/123 common DEGs in two ovarian cancer cell lines were selected,
and their expression levels after Bcl2l10-knockdown were examined
by RT-qPCR using different sets of RNA samples from those used for
RNA-Seq. Bcl2l10-knockdown was confirmed to be successful using
RT-qPCR (Fig. 2A and B). These 22
common DEGs included 12 upregulated genes associated with the
regulation of transcription (ZNF845, MED11, POLR2D, FOXP4, ZNF415,
HABP4, SETD7, ZNF721, VOPP1, ZNF765, ZSCAN29 and ZNF267) and 10
downregulated genes involved in metabolic pathways (ACER2, SDHD,
IDH1, LCLAT1, ENOPH1, IDI1, HPRT1, PAICS, ATP6V1D and ACSL5) in
SKOV3 and A2780 cells. The RT-qPCR data revealed that the
expression levels of all 12 commonly upregulated genes were
significantly higher in the Bcl2l10-suppressed cells than in the
control cells, and this finding was obtained for both ovarian
cancer cell lines (Fig. 2A). In
particular, the expression levels of SETD7 and VOPP1 were markedly
elevated by Bcl2l10-knockdown in both SKOV3 and A2780 cells
(Fig. 2A).
Subsequently, whether Bcl2l10-knockdown decreased
the expression levels of metabolism-associated genes was analyzed
by RT-qPCR. Among the 10 commonly downregulated genes that were
tested by RT-qPCR, the expression levels of 8 genes (SDHD, IDH1,
LCLAT1, ENOPH1, IDI1, HPRT1, PAICS and ATP6V1D) were significantly
decreased in the Bcl2l10-suppressed SKOV3 cells, whereas the
expression levels of 9 genes (ACER2, SDHD, IDH1, LCLAT1, ENOPH1,
IDI1, HPRT1, ATP6V1D and ACSL5) were significantly decreased in the
Bcl2l10-suppressed A2780 cells compared with their respective
control cells (Fig. 2B). In
particular, SDHD and IDH1 exhibited the greatest decrease in
expression after Bcl2l10-knockdown in both SKOV3 and A2780
cells.
To determine the association between Bcl2l10 and two
metabolism-associated enzymes, SDHD and IDH1, the protein
expression levels of SDHD and IDH1 were further examined after
Bcl2l10-knockdown. As determined by western blot analysis, the
protein expression levels of SDHD and IDH1 were significantly
decreased after Bcl2l10-knockdown in both SKOV3 and A2780 cells
(Fig. 3A and B). Additionally, the
alteration in FH expression was examined after Bcl2l10-knockdown,
since SDH, IDH1/2 and FH are all directly responsible for the
initiation of cancer in the presence of remodeled TCA cycle
(23), confirming that FH expression
was not affected by Bcl2l10-knockdown (Fig. 3A and B). These results suggested that
Bcl2l10 may be a substantial regulator of the TCA cycle.
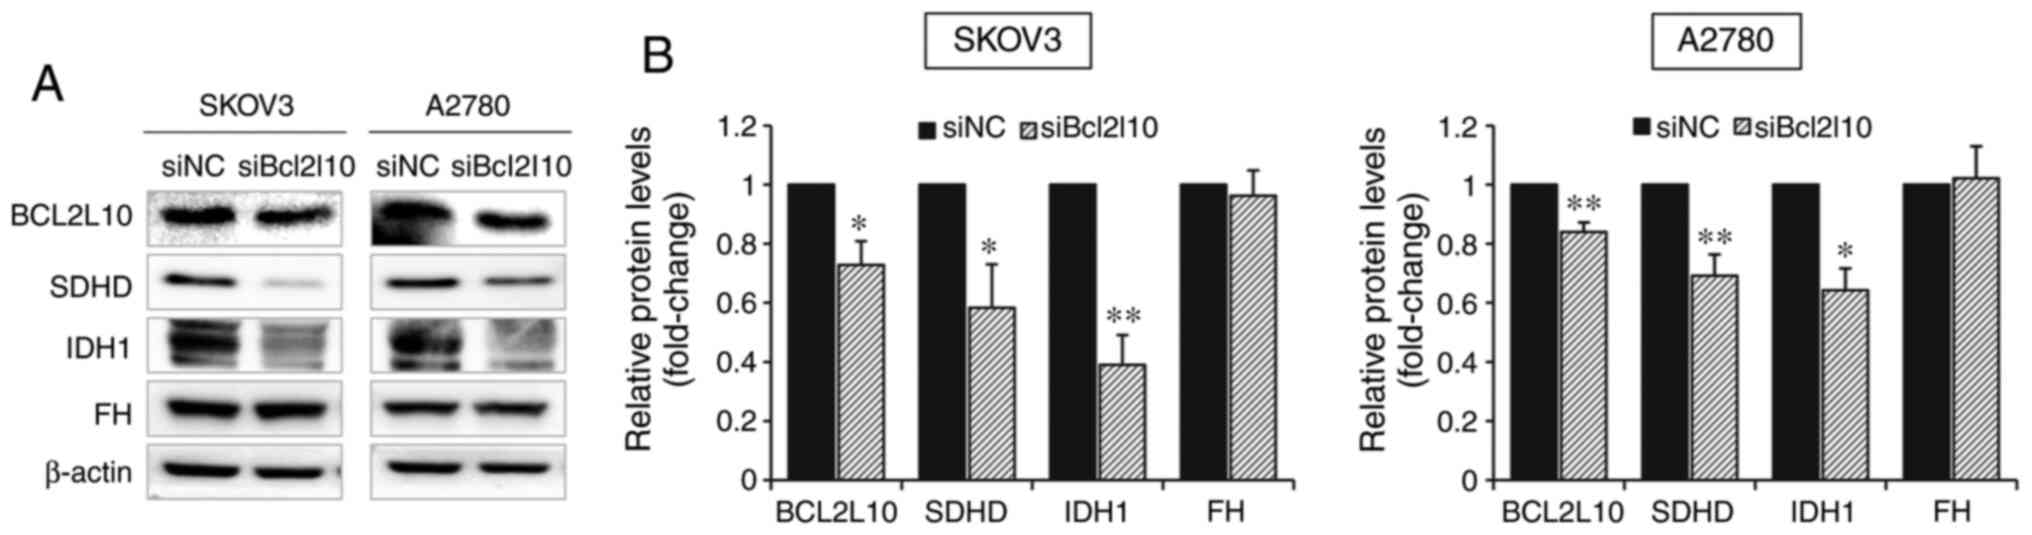 | Figure 3.Bcl2l10-knockdown significantly
decreases the protein expression levels of SDHD and IDH1. (A) SKOV3
and A2780 cells were transfected with siNC or siBcl2l10 and
harvested 48 h after transfection. The protein expression levels of
BCL2L10, SDHD, IDH1 and FH were measured by western blot analysis
using β-actin as an internal control gene. (B) Protein signals of
BCL2L10, SDHD, IDH1 and FH were measured and normalized to the
corresponding β-actin signals. The relative expression levels of
proteins were calculated by comparing all the normalized signals to
that of the negative control group. All the experiments were
repeated at least three times, and the data are expressed as the
mean ± SEM. *P<0.05 and **P<0.01 vs. siNC. si, small
interfering RNA; NC, negative control; Bcl2l10, Bcl-2-like-10;
SDHD, succinate dehydrogenase complex subunit D; IDH1, isocitrate
dehydrogenase 1; FH, fumarate hydratase. |
Bcl2l10-knockdown induces the
accumulation of succinate and isocitrate in ovarian cancer
cells
Based on the downregulation of SDHD and IDH1
expression after Bcl2l10-knockdown, whether Bcl2l10 regulated the
catalyzation of succinate and isocitrate in ovarian cancer cells
was further examined. After Bcl2l10-siRNA (siBcl2l10) treatment of
SKOV3 and A2780 cells for 48 h, 1×10⁶ cells from each
group were harvested and homogenized to measure altered metabolites
using colorimetric assay kits. The differentially expressed
metabolites in siBcl2l10-transfected cells were identified compared
with the negative control siRNA (siNC)-transfected cells. As a
result, it was revealed that Bcl2l10-knockdown increased the TCA
cycle intermediates succinate and isocitrate. The analysis
demonstrated that Bcl2l10-knockdown led to elevated levels of
succinate in both SKOV3 (187.86 µM in siNC-transfected cells vs.
199.47 µM in siBcl2l10-transfected cells) and A2780 cells (190.85
µM in siNC-transfected cells vs. 204.36 µM in siBcl2l10-transfected
cells; P<0.05) (Table VI).
Furthermore, the levels of isocitrate tended to increase in both
SKOV3 (190.27 µM in siNC-transfected cells vs. 201.07 µM in
siBcl2l10-transfected cells) and A2780 cells (180.89 µM in
siNC-transfected cells vs. 187.8 µM in siBcl2l10-transfected cells)
after Bcl2l10-knockdown (Table VI).
These results indicated that Bcl2l10 may affect the catalyzation of
succinate and isocitrate through the regulation of SDHD and IDH1
expression.
| Table VI.Changes in the concentrations of
succinate and isocitrate after Bcl2l10-knockdown. |
Table VI.
Changes in the concentrations of
succinate and isocitrate after Bcl2l10-knockdown.
|
| SKOV3 cells | A2780 cells |
|---|
|
|
|
|
|---|
|
| Average
concentration, µM |
| Average
concentration, µM |
|
|---|
|
|
|
|
|
|
|---|
| Metabolites | siNC | siBcl2l10 | P-value | siNC | siBcl2l10 | P-value |
|---|
| Succinate | 187.86 | 199.47 | 0.122 | 190.85 | 204.36 | 0.048 |
| Isocitrate | 190.27 | 201.07 | 0.419 | 180.89 | 187.80 | 0.698 |
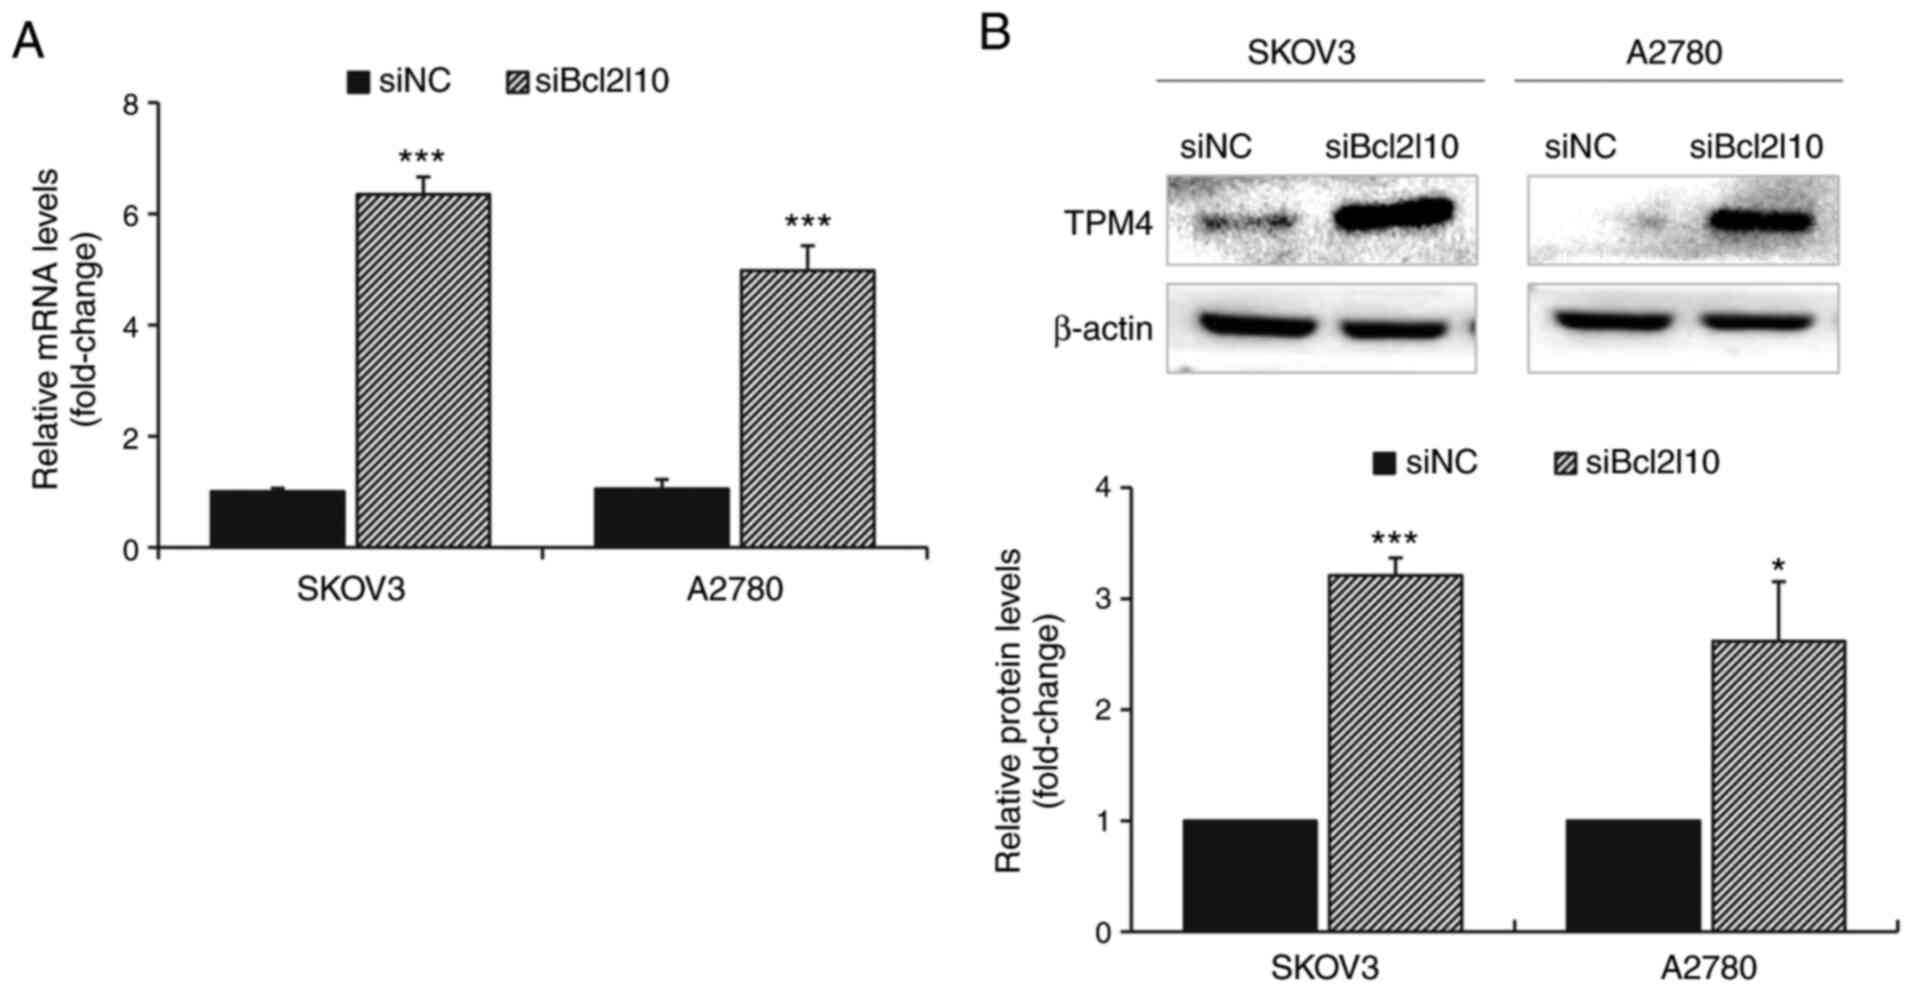
Bcl2l10-knockdown increases TPM4
expression in ovarian cancer cells
Notably, the current RNA-Seq analysis revealed that
among the common DEGs, TPM4 exhibited the greatest increase in
expression after Bcl2l10-knockdown in both SKOV3 and A2780 cells
(Table SI). Through validation by
RT-qPCR and western blot analysis, it was confirmed that TPM4
expression was significantly increased after Bcl2l10-knockdown at
both the mRNA and protein levels (Fig.
4). Based on the fact that TPM4 is involved in early
progression of ovarian cancer by altering the actin cytoskeleton
(24), these results suggested that
Bcl2l10 may also affect cytoskeletal regulation of ovarian cancer
cells with TPM4.
Discussion
Bcl2l10 functions as a tumor suppressor gene in
gastric cancer and hepatocellular carcinoma. In gastric cancer,
Bcl2l10 exhibits a hypermethylated status, which results in low
Bcl2l10 expression, and Bcl2l10-knockdown promotes cell
proliferation via activation of the PI3K-Akt signaling pathway
(25,26). In hepatocellular carcinoma, Bcl2l10
expression is downregulated, and the overexpression of Bcl2l10
suppresses the activation of JAK-STAT signaling (13). These previous studies imply that the
tumor suppressive roles of Bcl2l10 are mediated by different
mechanisms under different circumstances depending on the cellular
context. In ovarian cancer cells, there have been contradictory
results that Bcl2l10-suppressed cells exert oncogenic effects
despite their decreased expression levels of oncogenic AURKA
protein (18). Based on these
results, it may be possible that the effects of unknown downstream
genes whose expression is regulated by Bcl2l10 may be stronger than
those of AURKA expression. Thus, the present study aimed to
identify Bcl2l10-associated genes by RNA-Seq and demonstrated that
DEGs after Bcl2l10-knockdown were involved in transcriptional
regulation and energy metabolism in ovarian cancer cells.
Zinc finger proteins (ZNFs) are the largest family
of transcription factors in the human genome and are involved in
numerous cellular processes, including differentiation,
development, metabolism, apoptosis, autophagy and stemness
maintenance, due to the existence of different combinations of zinc
finger motifs (27). Previous studies
have reported that ZNFs regulate cancer progression as tumor
suppressor genes (28–30) or oncogenes (31–33). As
demonstrated by the current RNA-Seq analysis and subsequent
validation of the data, six ZNFs (ZNF845, ZNF415, ZNF721, ZNF765,
ZSCAN29 and ZNF267) were significantly upregulated by
Bcl2l10-knockdown. ZNF845 is overexpressed in radiation-induced
thyroid carcinoma (34), and ZNF415
is hypermethylated in pancreatic cancer cells (35). ZNF721 and ZNF765 are mutated in
peritoneal metastatic gastric adenocarcinoma and non-clear cell
renal cell carcinoma, respectively (36,37). The
upregulation of ZNF267 expression negatively regulates the
transcription of MMP-10 in activated hepatic stellate cells that
progress to liver fibrosis and promotes cancer cell proliferation
and migration in hepatocellular carcinoma (38,39).
Through these ZNFs, Bcl2l10 may induce broad changes in the
expression levels of undiscovered downstream genes and affect
cancer progression through multiple mechanisms. Additionally, the
validation of RNA-Seq data by RT-qPCR revealed that VOPP1 and SETD7
were the most highly upregulated transcription-associated genes in
both SKOV3 and A2780 cells, although no significant difference was
observed for upregulated VOPP1 expression in SKOV3 cells. VOPP1,
which was previously known as glioblastoma amplified and secreted
protein or EGFR-coamplified and overexpressed protein, is most
abundant in the thymus and ovary, and is overexpressed in several
types of human cancer, including gastric, head and neck, lung and
breast cancer (40–42). VOPP1-knockdown in squamous cell
carcinoma cells induces apoptosis via the intrinsic pathway
(43), whereas the overexpression of
VOPP1 promotes cell proliferation and migration in gastric cancer
with coamplification (42). The
upregulation of VOPP1 expression, a regulator of the apoptotic
pathway, after Bcl2l10-knockdown suggested a functional association
between Bcl2l10 and VOPP1 in mitochondria. As a lysine
methyltransferase, SETD7 catalyzes histone H3 lysine 4 (H3K4)
methylation followed by the activation of gene expression, which
leads to the regulation of several biological processes, such as
cell proliferation, differentiation and endoplasmic reticulum
stress (44). SETD7 has tumor
suppressor functions in gastric cancer (45), but acts as an oncogene in
hepatocellular carcinoma (46). These
results suggest that Bcl2l10 may induce target gene expression via
epigenetic reprogramming.
Notably, the current RNA-Seq analysis revealed that
among the common DEGs, TPM4 exhibited the greatest increase in
expression after Bcl2l10-knockdown in both SKOV3 and A2780 cells.
Through validation by RT-qPCR and western blot analysis, it was
confirmed that TPM4 expression was significantly increased after
Bcl2l10-knockdown at both the mRNA and protein levels. TPM4 is a
member of the tropomyosin family of proteins, which are major
structural proteins of the actin cytoskeleton, and mainly regulates
the stability of the cytoskeleton in non-muscle cells (47,48).
Several studies have demonstrated that TPM4 is expressed at high
levels in breast cancer (49),
ovarian cancer (50) and non-small
cell lung carcinoma (51), and at low
levels in squamous cervical cancer (52) and colon cancer (53). According to two-dimensional gel
electrophoresis protein profiles, TPM4 is considered a potential
marker for the progression of ovarian cancer and breast carcinoma
(24,54). A recent study demonstrated that the
overexpression of TPM4 in lung cancer cells promotes cell motility
by increasing F-actin assembly and has no effect on cell
proliferation (51). Therefore, the
current RNA-Seq results suggested that the significant increase in
cell motility after Bcl2l10-knockdown observed in our previous
study (18) may be caused by
modulation of F-actin assembly following TPM4 upregulation. These
results are consistent with our previous study that Bcl2l10
directly binds to cytoskeleton-associated proteins, such as actin
or tropomyosin, in mouse oocytes, as demonstrated by mass
spectrometry analysis (55), and
affects spindle assembly during mouse oocyte maturation by
regulating Tpx2 expression, a microtubule-binding protein, and
microtubule organizing center-associated proteins (15). Given the importance of the actin
cytoskeleton in the invasive and metastatic phenotypes of malignant
cancer cells (56), the association
between Bcl2l10 and TPM4 may provide new insight into the molecular
mechanism through which Bcl2l10 may regulate the actin cytoskeleton
in cancer progression.
The findings from the current RNA-Seq analysis
revealed that the commonly downregulated DEGs after
Bcl2l10-knockdown were mainly involved in metabolic pathways, as
demonstrated by the KEGG pathway analysis. In addition to functions
in apoptotic regulation, numerous proteins of the BCL-2 family, to
which Bcl2l10 belongs, reside in the mitochondria or translocate to
this organelle, which implies that these proteins are involved in
normal mitochondrial physiology and metabolism (57). As expected, several studies have
reported that BCL-2 family proteins also have non-apoptotic
functions associated with carbon substrate utilization (58), electron transport (59), metabolite import (60) and mitochondrial dynamics (57). Although the role of Bcl2l10 in
mitochondrial metabolism remains unknown, the present
identification of Bcl2l10 as an upstream gene of SDHD and IDH1,
which are key metabolic enzymes in the TCA cycle that affect the
production of oncometabolites, such as succinate, fumarate and
2-hydroxyglutarate (2-HG) (61),
indicated that Bcl2l10 may promote metabolic alterations in cancer
progression.
SDHD is one of the four subunits of the SDH complex,
which consists of SDHA, SDHB, SDHC and SDHD (62). As a component of the TCA cycle, the
SDH complex serves an important role in mitochondrial metabolism by
catalyzing the oxidation of succinate to fumarate and inducing
electron transport to ubiquinone in the electron transport chain
(62). Loss-of-function mutations in
SDH members have revealed their role as tumor suppressors in
several types of cancer, such as paraganglioma/pheochromocytoma,
thyroid cancer (63), ovarian cancer,
gastric cancer (64) and renal
carcinoma, through induction of the accumulation of succinate and
low levels of fumarate (65). The
accumulation of succinate increases migration, stem-like phenotypes
in thyroid carcinoma cells (63) and
angiogenesis through succinate receptor 1-mediated STAT3 and ERK
activation (64). In ovarian cancer,
dysregulation of SDH members due to genomic deletions occurs
frequently, and a high level of succinate is considered as a
potential metabolic biomarker for ovarian cancer (66,67). The
IDH family is composed of three isozymes (IDH1, IDH2 and IDH3). The
enzymatic activities of the wild-type and mutant forms of IDH1/IDH2
differ in the regulation of the TCA cycle (68). Wild-type IDH1 and IDH2 catalyze the
conversion of isocitrate to α-ketoglutarate (α-KG) at the same time
in the cytosol and mitochondria, respectively (68). Moreover, it has been reported that
IDH1 and IDH2 mutations confer novel enzymatic activity that
facilitates the conversion of α-KG to 2-HG, a potential
oncometabolite, in several types of cancer, including glioma,
leukemia and breast cancer (69–72).
Increased production of 2-HG due to IDH1/IDH2 mutations, which has
been observed in glioma and AML, is associated with the induction
of oncogenesis (69,73). In primary glioblastoma (GBM), a
univariate Cox regression analysis revealed that IDH mutation
status was significantly associated with overall survival, but not
with age and sex (74). IDH1
expression is upregulated in GBM (75,76), but
downregulated in breast cancer (77)
compared with in adjacent normal tissues. The loss of α-KG
resulting from IDH1 mutations or the knockdown of wild-type IDH1
leads to broad changes in H3K4 methylation that direct cancer cells
towards a more differentiated state and results in the inhibition
of proliferation in glioma cells (75). As aforementioned, Bcl2l10-knockdown in
the present study significantly increased SETD7 expression, which
also promotes H3K4 methylation (44).
These findings suggest that Bcl2l10 may cause broad changes in
histone methylation to regulate cancer progression.
Notably, SDHD-knockdown in thyroid cancer cells and
IDH1-knockdown in breast cancer cells does not affect the
proliferative capability of the cells, but promotes cell motility
(63,77). Increasing studies have proven that the
positive regulation of cell motility is mediated by increased
stabilization of hypoxia-inducible factor (HIF)-1α, which results
from the accumulation of succinate and α-KG in response to SDHD and
IDH1 inhibition (77,78). Although the induction of HIF-1α after
Bcl2l10-knockdown was not observed in the present study, the
aforementioned results suggest that the significant increase in
cell motility after Bcl2l10-knockdown detected in our previous
study (18) may be caused by the
accumulation of succinate and α-KG following the downregulation of
SDHD and IDH1 after Bcl2l10-knockdown.
Based on our previous results (18), the present study aimed to investigate
the mechanism through which Bcl2l10 may regulate cell proliferation
and migration in ovarian cancer cells, and revealed that Bcl2l10
may be a new regulator of cancer metabolism. The present study
found that the tumorigenic phenotypes in ovarian cancer cells after
Bcl2l10-knockdown were mediated by alterations in the activities of
key TCA cycle enzymes, SDHD and IDH1. Notably, Bcl2l10 is
associated with metabolic regulation in cancer (57). In the 1930s, Otto Warburg observed
that cancer cells prefer aerobic glycolysis over oxidative
phosphorylation even under normal oxygen circumstances, known as
the Warburg effect (79). The
phenomenon of these changes in cancer cells is called metabolic
reprogramming, which is considered a hallmark of cancer (80). The Warburg effect has been widely
accepted as a common feature of metabolic reprogramming. It has
been further postulated that this altered metabolism in cancer
cells is due to mitochondrial defects that inhibit the ability of
cells to oxidize glucose carbon to CO2 (81). However, in contrast to Warburg's
original hypothesis, increasing evidence (82,83)
obtained over the last decades has revealed that most cancer cells
exhibit unchanged mitochondrial activity to generate the energy
required for tumor growth and depend on mitochondrial metabolism as
well as glycolysis (84). Instead of
the Warburg effect, other studies have proposed two models as new
theories regarding the metabolic reprogramming in cancer cells.
First, tumor-associated genes may directly cause metabolic
alterations. For example, the major oncogenes c-Myc and HIF-1α are
known to promote the expression levels of glycolytic enzymes in
tumors and thus serve as master inducers of cancer glycolysis
(85), whereas the tumor suppressor
p53 directly inhibits the transcription of glucose transporters
Glut1 and Glut4, resulting in the downregulation of glucose uptake
(86). Based on all these findings,
enhanced transcriptional activity of c-Myc and HIF-1α and decreased
p53-mediated control in cancer cells cause upregulation of numerous
glycolytic enzymes, such as hexokinase II, phosphofructokinase 1,
triosephosphate isomerase 1 and lactate dehydrogenase A (87). Second, mutations or changes in the
expression levels of metabolic genes, such as SDH, IDH and FH, also
induce metabolic alterations followed by epigenetic reprogramming,
as aforementioned (61). In contrast
to the first model, the second model states that tumor-associated
gene mutations are a consequence of epigenetic reprogramming
(61), and the results of the present
study are consistent with the second model. In other words, the
alteration in the expression levels of SDHD and IDH1 due to
downregulation of the tumor suppressor Bcl2l10 may broadly activate
the expression levels of other tumor-associated genes through the
regulation of transcription factors independent of the Warburg
effect.
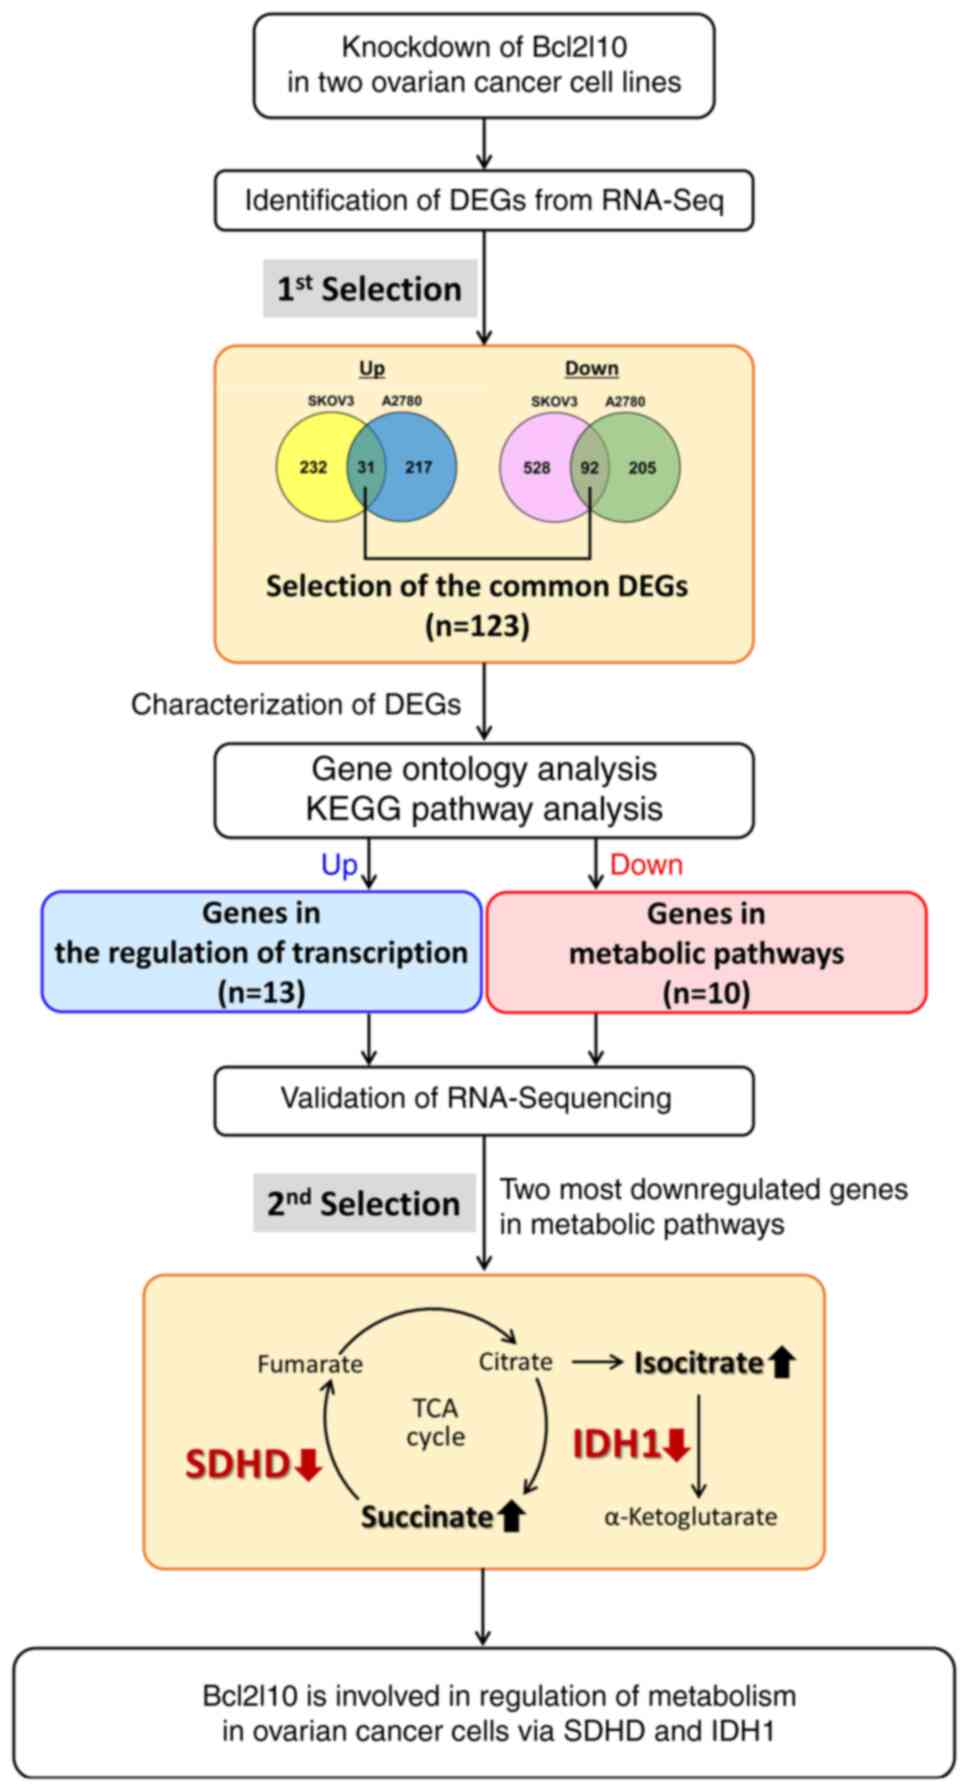
In conclusion, the current findings demonstrated
that Bcl2l10 exhibited tumor suppressive roles in ovarian cancer
cells via regulating numerous transcription factors and metabolic
genes. Functional analysis of these Bcl2l10-associated
transcription factors and their downstream genes may facilitate
obtaining insights into diverse functions of Bcl2l10 in various
cancer cells. To the best of our knowledge, the present study is
the first to report that Bcl2l10 may be involved in the regulation
of the TCA cycle in ovarian cancer cells. The schematic workflow of
the current study is shown in Fig.
5.
However, as aforementioned, Bcl2l10 is well known to
have different functions in different types of cancer. Therefore,
it is necessary to further observe the association between Bcl2l10
and the TCA cycle in other cancer cells to clarify the metabolic
regulation of Bcl2l10 in various tissues. Metabolic alteration is
one of the hallmarks of cancer and is an important part of cancer
research. Further investigation of the contribution of Bcl2l10 to
cancer metabolism, particularly the regulation of the TCA cycle,
may improve the future development of novel cancer treatments.
Supplementary Material
Supporting Data
Acknowledgements
Not applicable.
Funding
The present study was supported by the Basic Science
Research Program (grant no. NRF-2016R1A2B4013403) and the Bio &
Medical Technology Development program (grant no.
NRF-2017M3A9B4061854) of the National Research Foundation funded by
the Ministry of Science & ICT.
Availability of data and materials
All data generated or analyzed during this study are
included in this published article. The raw data (fastq files)
generated from RNA-Seq are available in the Gene Expression Omnibus
repository (accession no. GSE165766; http://www.ncbi.nlm.nih.gov/geo/query/acc.cgi?acc=GSE165766).
Authors' contributions
SYL and KAL contributed to conception and design of
the present study. SYL performed experiments and wrote the
manuscript. JK provided experimental materials and analyzed the
data. JK and KAL confirmed the authenticity of the data. KAL
provided conceptual advice and revised the manuscript. All authors
read and approved the final manuscript.
Ethics approval and consent to
participate
Not applicable.
Patient consent for publication
Not applicable.
Competing interests
The authors declare that they have no competing
interests.
Glossary
Abbreviations
Abbreviations:
|
DEG
|
differentially expressed gene
|
|
SDHD
|
succinate dehydrogenase complex
subunit D
|
|
IDH1
|
isocitrate dehydrogenase 1
|
|
Bcl2l10
|
Bcl2-like-10
|
References
|
1
|
Siegel RL, Miller KD, Fuchs HE and Jemal
A: Cancer Statistics, 2021. CA Cancer J Clin. 71:7–33. 2021.
View Article : Google Scholar : PubMed/NCBI
|
|
2
|
Siegel RL, Miller KD and Jemal A: Cancer
statistics, 2018. CA Cancer J Clin. 68:7–30. 2018. View Article : Google Scholar : PubMed/NCBI
|
|
3
|
Bray F, Ferlay J, Soerjomataram I, Siegel
RL, Torre LA and Jemal A: Global cancer statistics 2018: GLOBOCAN
estimates of incidence and mortality worldwide for 36 cancers in
185 countries. CA Cancer J Clin. 68:394–424. 2018. View Article : Google Scholar : PubMed/NCBI
|
|
4
|
Markowska A, Sajdak S, Markowska J and
Huczynski A: Angiogenesis and cancer stem cells: New perspectives
on therapy of ovarian cancer. Eur J Med Chem. 142:87–94. 2017.
View Article : Google Scholar : PubMed/NCBI
|
|
5
|
Boussios S, Abson C, Moschetta M, Rassy E,
Karathanasi A, Bhat T, Ghumman F, Sheriff M and Pavlidis N: Poly
(ADP-Ribose) polymerase inhibitors: Talazoparib in ovarian cancer
and beyond. Drugs R D. 20:55–73. 2020. View Article : Google Scholar : PubMed/NCBI
|
|
6
|
Levine B, Sinha SC and Kroemer G: Bcl-2
family members: Dual regulators of apoptosis and autophagy.
Autophagy. 4:600–606. 2008. View Article : Google Scholar
|
|
7
|
Inohara N, Gourley TS, Carrio R, Muñiz M,
Merino J, Garcia I, Koseki T, Hu Y, Chen S and Núñez G: Diva, a
Bcl-2 homologue that binds directly to Apaf-1 and induces
BH3-independent cell death. J Biol Chem. 273:32479–32486. 1998.
View Article : Google Scholar : PubMed/NCBI
|
|
8
|
Kang Y, Lee DC, Han J, Yoon S, Won M, Yeom
JH, Seong MJ, Ko JJ, Lee KA, Lee K and Bae J: NM23-H2 involves in
negative regulation of Diva and Bcl2L10 in apoptosis signaling.
Biochem Biophys Res Commun. 359:76–82. 2007. View Article : Google Scholar : PubMed/NCBI
|
|
9
|
Naumann U, Weit S, Wischhusen J and Weller
M: Diva/Boo is a negative regulator of cell death in human glioma
cells. FEBS Lett. 505:23–26. 2001. View Article : Google Scholar : PubMed/NCBI
|
|
10
|
Zhang H, Holzgreve W and De Geyter C:
Bcl2-L-10, a novel anti-apoptotic member of the Bcl-2 family,
blocks apoptosis in the mitochondria death pathway but not in the
death receptor pathway. Hum Mol Genet. 10:2329–2339. 2001.
View Article : Google Scholar : PubMed/NCBI
|
|
11
|
Cluzeau T, Robert G, Mounier N, Karsenti
JM, Dufies M, Puissant A, Jacquel A, Renneville A, Preudhomme C,
Cassuto JP, et al: BCL2L10 is a predictive factor for resistance to
azacitidine in MDS and AML patients. Oncotarget. 3:490–501. 2012.
View Article : Google Scholar : PubMed/NCBI
|
|
12
|
Nougarede A, Popgeorgiev N, Kassem L,
Omarjee S, Borel S, Mikaelian I, Lopez J, Gadet R, Marcillat O,
Treilleux I, et al: Breast cancer targeting through inhibition of
the endoplasmic reticulum-based apoptosis regulator Nrh/BCL2L10.
Cancer Res. 78:1404–1417. 2018. View Article : Google Scholar : PubMed/NCBI
|
|
13
|
Bai Y, Wang J, Han J, Xie XL, Ji CG, Yin
J, Chen L, Wang CK, Jiang XY, Qi W and Jiang HQ: BCL2L10 inhibits
growth and metastasis of hepatocellular carcinoma both in vitro and
in vivo. Mol Carcinog. 56:1137–1149. 2017. View Article : Google Scholar : PubMed/NCBI
|
|
14
|
Xu JD, Furuya T, Cao XX, Liu XL, Li QQ,
Wang WJ, Xu JW, Xu ZD, Sasaki K and Liu XP: Loss of BCL2L10 protein
expression as prognostic predictor for poor clinical outcome in
gastric carcinoma. Histopathology. 57:814–824. 2010. View Article : Google Scholar : PubMed/NCBI
|
|
15
|
Lee SY, Kim EY, Kim KH and Lee KA:
Bcl2l10, a new Tpx2 binding partner, is a master regulator of
Aurora kinase A in mouse oocytes. Cell Cycle. 15:3296–3305. 2016.
View Article : Google Scholar : PubMed/NCBI
|
|
16
|
Damodaran AP, Vaufrey L, Gavard O and
Prigent C: Aurora a kinase is a priority pharmaceutical target for
the treatment of cancers. Trends Pharmacol Sci. 38:687–700. 2017.
View Article : Google Scholar : PubMed/NCBI
|
|
17
|
Yan M, Wang C, He B, Yang M, Tong M, Long
Z, Liu B, Peng F, Xu L, Zhang Y, et al: Aurora-a kinase: A potent
oncogene and target for cancer therapy. Med Res Rev. 36:1036–1079.
2016. View Article : Google Scholar : PubMed/NCBI
|
|
18
|
Lee SY, Kwon J, Woo JH, Kim KH and Lee KA:
Bcl2l10 mediates the proliferation, invasion and migration of
ovarian cancer cells. Int J Oncol. 56:618–629. 2020.PubMed/NCBI
|
|
19
|
Livak KJ and Schmittgen TD: Analysis of
relative gene expression data using real-time quantitative PCR and
the 2(-Delta Delta C(T)) method. Methods. 25:402–408. 2001.
View Article : Google Scholar : PubMed/NCBI
|
|
20
|
Trapnell C, Pachter L and Salzberg SL:
TopHat: Discovering splice junctions with RNA-Seq. Bioinformatics.
25:1105–1111. 2009. View Article : Google Scholar : PubMed/NCBI
|
|
21
|
Quinlan AR and Hall IM: BEDTools: A
flexible suite of utilities for comparing genomic features.
Bioinformatics. 26:841–842. 2010. View Article : Google Scholar : PubMed/NCBI
|
|
22
|
Roberts A, Trapnell C, Donaghey J, Rinn JL
and Pachter L: Improving RNA-Seq expression estimates by correcting
for fragment bias. Genome Biol. 12:R222011. View Article : Google Scholar : PubMed/NCBI
|
|
23
|
Laurenti G and Tennant DA: Isocitrate
dehydrogenase (IDH), succinate dehydrogenase (SDH), fumarate
hydratase (FH): Three players for one phenotype in cancer? Biochem
Soc Trans. 44:1111–1116. 2016. View Article : Google Scholar : PubMed/NCBI
|
|
24
|
Bailey MJ, Shield-Artin KL, Oliva K, Ayhan
M, Reisman S and Rice GE: Stage-specific analysis of plasma protein
profiles in ovarian cancer: Difference in-gel electrophoresis
analysis of pooled clinical samples. J Carcinog. 12:102013.
View Article : Google Scholar : PubMed/NCBI
|
|
25
|
Mikata R, Fukai K, Imazeki F, Arai M,
Fujiwara K, Yonemitsu Y, Zhang K, Nabeya Y, Ochiai T and Yokosuka
O: BCL2L10 is frequently silenced by promoter hypermethylation in
gastric cancer. Oncol Rep. 23:1701–1708. 2010.PubMed/NCBI
|
|
26
|
Xu JD, Cao XX, Long ZW, Liu XP, Furuya T,
Xu JW, Liu XL, De Xu Z, Sasaki K and Li QQ: BCL2L10 protein
regulates apoptosis/proliferation through differential pathways in
gastric cancer cells. J Pathol. 223:400–409. 2011. View Article : Google Scholar : PubMed/NCBI
|
|
27
|
Jen J and Wang YC: Zinc finger proteins in
cancer progression. J Biomed Sci. 23:532016. View Article : Google Scholar : PubMed/NCBI
|
|
28
|
Cheng Y, Liang P, Geng H, Wang Z, Li L,
Cheng SH, Ying J, Su X, Ng KM, Ng MH, et al: A novel 19q13
nucleolar zinc finger protein suppresses tumor cell growth through
inhibiting ribosome biogenesis and inducing apoptosis but is
frequently silenced in multiple carcinomas. Mol Cancer Res.
10:925–936. 2012. View Article : Google Scholar : PubMed/NCBI
|
|
29
|
Harper J, Yan L, Loureiro RM, Wu I, Fang
J, D'Amore PA and Moses MA: Repression of vascular endothelial
growth factor expression by the zinc finger transcription factor
ZNF24. Cancer Res. 67:8736–8741. 2007. View Article : Google Scholar : PubMed/NCBI
|
|
30
|
Hu R, Peng G, Dai H, Breuer EK,
Stemke-Hale K, Li K, Gonzalez-Angulo AM, Mills GB and Lin SY:
ZNF668 functions as a tumor suppressor by regulating p53 stability
and function in breast cancer. Cancer Res. 71:6524–6534. 2011.
View Article : Google Scholar : PubMed/NCBI
|
|
31
|
Jen J, Lin LL, Chen HT, Liao SY, Lo FY,
Tang YA, Su WC, Salgia R, Hsu CL, Huang HC, et al: Oncoprotein
ZNF322A transcriptionally deregulates alpha-adducin, cyclin D1 and
p53 to promote tumor growth and metastasis in lung cancer.
Oncogene. 35:2357–2369. 2016. View Article : Google Scholar : PubMed/NCBI
|
|
32
|
Serra RW, Fang M, Park SM, Hutchinson L
and Green MR: A KRAS-directed transcriptional silencing pathway
that mediates the CpG island methylator phenotype. Elife.
3:e023132014. View Article : Google Scholar : PubMed/NCBI
|
|
33
|
Yang L, Zhang L, Wu Q and Boyd DD:
Unbiased screening for transcriptional targets of ZKSCAN3
identifies integrin beta 4 and vascular endothelial growth factor
as downstream targets. J Biol Chem. 283:35295–35304. 2008.
View Article : Google Scholar : PubMed/NCBI
|
|
34
|
Bang HS, Choi MH, Kim CS and Choi SJ: Gene
expression profiling in undifferentiated thyroid carcinoma induced
by high-dose radiation. J Radiat Res. 57:238–249. 2016. View Article : Google Scholar : PubMed/NCBI
|
|
35
|
Omura N, Li CP, Li A, Hong SM, Walter K,
Jimeno A, Hidalgo M and Goggins M: Genome-wide profiling of
methylated promoters in pancreatic adenocarcinoma. Cancer Biol
Ther. 7:1146–1156. 2008. View Article : Google Scholar : PubMed/NCBI
|
|
36
|
Durinck S, Stawiski EW, Pavia-Jimenez A,
Modrusan Z, Kapur P, Jaiswal BS, Zhang N, Toffessi-Tcheuyap V,
Nguyen TT, Pahuja KB, et al: Spectrum of diverse genomic
alterations define non-clear cell renal carcinoma subtypes. Nat
Genet. 47:13–21. 2015. View Article : Google Scholar : PubMed/NCBI
|
|
37
|
Liu H, Li F, Zhu Y, Li T, Huang H, Lin T,
Hu Y, Qi X, Yu J and Li G: Whole-exome sequencing to identify
somatic mutations in peritoneal metastatic gastric adenocarcinoma:
A preliminary study. Oncotarget. 7:43894–43906. 2016. View Article : Google Scholar : PubMed/NCBI
|
|
38
|
Schnabl B, Hu K, Muhlbauer M, Hellerbrand
C, Stefanovic B, Brenner DA and Schölmerich J: Zinc finger protein
267 is up-regulated during the activation process of human hepatic
stellate cells and functions as a negative transcriptional
regulator of MMP-10. Biochem Biophys Res Commun. 335:87–96. 2005.
View Article : Google Scholar : PubMed/NCBI
|
|
39
|
Schnabl B, Valletta D, Kirovski G and
Hellerbrand C: Zinc finger protein 267 is up-regulated in
hepatocellular carcinoma and promotes tumor cell proliferation and
migration. Exp Mol Pathol. 91:695–701. 2011. View Article : Google Scholar : PubMed/NCBI
|
|
40
|
Baras A and Moskaluk CA: Intracellular
localization of GASP/ECOP/VOPP1. J Mol Histol. 41:153–164. 2010.
View Article : Google Scholar : PubMed/NCBI
|
|
41
|
Baras A, Yu Y, Filtz M, Kim B and Moskaluk
CA: Combined genomic and gene expression microarray profiling
identifies ECOP as an upregulated gene in squamous cell carcinomas
independent of DNA amplification. Oncogene. 28:2919–2924. 2009.
View Article : Google Scholar : PubMed/NCBI
|
|
42
|
Gao C, Pang M, Zhou Z, Long S, Dong D,
Yang J, Cao M, Zhang C, Han S and Li L: Epidermal growth factor
receptor-coamplified and overexpressed protein (VOPP1) is a
putative oncogene in gastric cancer. Clin Exp Med. 15:469–475.
2015. View Article : Google Scholar : PubMed/NCBI
|
|
43
|
Baras AS, Solomon A, Davidson R and
Moskaluk CA: Loss of VOPP1 overexpression in squamous carcinoma
cells induces apoptosis through oxidative cellular injury. Lab
Invest. 91:1170–1180. 2011. View Article : Google Scholar : PubMed/NCBI
|
|
44
|
Wang H, Cao R, Xia L, Erdjument-Bromage H,
Borchers C, Tempst P and Zhang Y: Purification and functional
characterization of a histone H3-lysine 4-specific
methyltransferase. Mol Cell. 8:1207–1217. 2001. View Article : Google Scholar : PubMed/NCBI
|
|
45
|
Akiyama Y, Koda Y, Byeon SJ, Shimada S,
Nishikawaji T, Sakamoto A, Chen Y, Kojima K, Kawano T, Eishi Y, et
al: Reduced expression of SET7/9, a histone mono-methyltransferase,
is associated with gastric cancer progression. Oncotarget.
7:3966–3983. 2016. View Article : Google Scholar : PubMed/NCBI
|
|
46
|
Chen Y, Yang S, Hu J, Yu C, He M and Cai
Z: Increased expression of SETD7 promotes cell proliferation by
regulating cell cycle and indicates poor prognosis in
hepatocellular carcinoma. PLoS One. 11:e01549392016. View Article : Google Scholar : PubMed/NCBI
|
|
47
|
Manstein DJ and Mulvihill DP:
Tropomyosin-mediated regulation of cytoplasmic myosins. Traffic.
17:872–877. 2016. View Article : Google Scholar : PubMed/NCBI
|
|
48
|
Gunning PW, Hardeman EC, Lappalainen P and
Mulvihill DP: Tropomyosin-master regulator of actin filament
function in the cytoskeleton. J Cell Sci. 128:2965–2974. 2015.
View Article : Google Scholar : PubMed/NCBI
|
|
49
|
Kabbage M, Trimeche M, Ben Nasr H, Hammann
P, Kuhn L, Hamrita B and Chahed K: Tropomyosin-4 correlates with
higher SBR grades and tubular differentiation in infiltrating
ductal breast carcinomas: An immunohistochemical and
proteomics-based study. Tumour Biol. 34:3593–3602. 2013. View Article : Google Scholar : PubMed/NCBI
|
|
50
|
Tang HY, Beer LA, Tanyi JL, Zhang R, Liu Q
and Speicher DW: Protein isoform-specific validation defines
multiple chloride intracellular channel and tropomyosin isoforms as
serological biomarkers of ovarian cancer. J Proteomics. 89:165–178.
2013. View Article : Google Scholar : PubMed/NCBI
|
|
51
|
Zhao X, Jiang M and Wang Z: TPM4 promotes
cell migration by modulating F-actin formation in lung cancer. Onco
Targets Ther. 12:4055–4063. 2019. View Article : Google Scholar : PubMed/NCBI
|
|
52
|
Lomnytska MI, Becker S, Bodin I, Olsson A,
Hellman K, Hellström AC, Mints M, Hellman U, Auer G and Andersson
S: Differential expression of ANXA6, HSP27, PRDX2, NCF2, and TPM4
during uterine cervix carcinogenesis: Diagnostic and prognostic
value. Br J Cancer. 104:110–119. 2011. View Article : Google Scholar : PubMed/NCBI
|
|
53
|
Yang R, Zheng G, Ren D, Chen C, Zeng C, Lu
W and Li H: The clinical significance and biological function of
tropomyosin 4 in colon cancer. Biomed Pharmacother. 101:1–7. 2018.
View Article : Google Scholar : PubMed/NCBI
|
|
54
|
Li DQ, Wang L, Fei F, Hou YF, Luo JM,
Wei-Chen, Zeng R, Wu J, Lu JS, Di GH, et al: Identification of
breast cancer metastasis-associated proteins in an isogenic tumor
metastasis model using two-dimensional gel electrophoresis and
liquid chromatography-ion trap-mass spectrometry. Proteomics.
6:3352–3368. 2006. View Article : Google Scholar : PubMed/NCBI
|
|
55
|
Yoon SJ, Kim JW, Choi KH, Lee SH and Lee
KA: Identification of oocyte-specific diva-associated proteins
using mass spectrometry. Korean J Fertil Steril. 33:189–198.
2006.
|
|
56
|
Yamaguchi H and Condeelis J: Regulation of
the actin cytoskeleton in cancer cell migration and invasion.
Biochim Biophys Acta. 1773:642–652. 2007. View Article : Google Scholar : PubMed/NCBI
|
|
57
|
Gimenez-Cassina A and Danial NN:
Regulation of mitochondrial nutrient and energy metabolism by BCL-2
family proteins. Trends Endocrinol Metab. 26:165–175. 2015.
View Article : Google Scholar : PubMed/NCBI
|
|
58
|
Gimenez-Cassina A, Martinez-Francois JR,
Fisher JK, Szlyk B, Polak K, Wiwczar J, Tanner GR, Lutas A, Yellen
G and Danial NN: BAD-dependent regulation of fuel metabolism and
K(ATP) channel activity confers resistance to epileptic seizures.
Neuron. 74:719–730. 2012. View Article : Google Scholar : PubMed/NCBI
|
|
59
|
Perciavalle RM, Stewart DP, Koss B, Lynch
J, Milasta S, Bathina M, Temirov J, Cleland MM, Pelletier S,
Schuetz JD, et al: Anti-apoptotic MCL-1 localizes to the
mitochondrial matrix and couples mitochondrial fusion to
respiration. Nat Cell Biol. 14:575–583. 2012. View Article : Google Scholar : PubMed/NCBI
|
|
60
|
Malia TJ and Wagner G: NMR structural
investigation of the mitochondrial outer membrane protein VDAC and
its interaction with antiapoptotic Bcl-xL. Biochemistry.
46:514–525. 2007. View Article : Google Scholar : PubMed/NCBI
|
|
61
|
Wu W and Zhao S: Metabolic changes in
cancer: Beyond the Warburg effect. Acta Biochim Biophys Sin
(Shanghai). 45:18–26. 2013. View Article : Google Scholar : PubMed/NCBI
|
|
62
|
Huang S and Millar AH: Succinate
dehydrogenase: The complex roles of a simple enzyme. Curr Opin
Plant Biol. 16:344–349. 2013. View Article : Google Scholar : PubMed/NCBI
|
|
63
|
Ashtekar A, Huk D, Magner A, La Perle K,
Zhang X, Piruat JI, López-Barneo J, Jhiang SM and Kirschner LS:
Sdhd ablation promotes thyroid tumorigenesis by inducing a
stem-like phenotype. Endocr Relat Cancer. 24:579–591. 2017.
View Article : Google Scholar : PubMed/NCBI
|
|
64
|
Mu X, Zhao T, Xu C, Shi W, Geng B, Shen J,
Zhang C, Pan J, Yang J, Hu S, et al: Oncometabolite succinate
promotes angiogenesis by upregulating VEGF expression through
GPR91-mediated STAT3 and ERK activation. Oncotarget. 8:13174–13185.
2017. View Article : Google Scholar : PubMed/NCBI
|
|
65
|
Ricketts C, Woodward ER, Killick P, Morris
MR, Astuti D, Latif F and Maher ER: Germline SDHB mutations and
familial renal cell carcinoma. J Natl Cancer Inst. 100:1260–1262.
2008. View Article : Google Scholar : PubMed/NCBI
|
|
66
|
Aspuria PP, Lunt SY, Varemo L, Vergnes L,
Gozo M, Beach JA, Salumbides B, Reue K, Wiedemeyer WR, Nielsen J,
et al: Succinate dehydrogenase inhibition leads to
epithelial-mesenchymal transition and reprogrammed carbon
metabolism. Cancer Metab. 2:212014. View Article : Google Scholar : PubMed/NCBI
|
|
67
|
Zhang T, Wu X, Ke C, Yin M, Li Z, Fan L,
Zhang W, Zhang H, Zhao F, Zhou X, et al: Identification of
potential biomarkers for ovarian cancer by urinary metabolomic
profiling. J Proteome Res. 12:505–512. 2013. View Article : Google Scholar : PubMed/NCBI
|
|
68
|
Reitman ZJ and Yan H: Isocitrate
dehydrogenase 1 and 2 mutations in cancer: Alterations at a
crossroads of cellular metabolism. J Natl Cancer Inst. 102:932–941.
2010. View Article : Google Scholar : PubMed/NCBI
|
|
69
|
Turcan S, Rohle D, Goenka A, Walsh LA,
Fang F, Yilmaz E, Campos C, Fabius AW, Lu C, Ward PS, et al: IDH1
mutation is sufficient to establish the glioma hypermethylator
phenotype. Nature. 483:479–483. 2012. View Article : Google Scholar : PubMed/NCBI
|
|
70
|
Raynaud S, Carbuccia N, Colin C, Adélaïde
J, Mozziconacci MJ, Metellus P, Chinot O, Birnbaum D, Chaffanet M
and Figarella-Branger D: Absence of R140Q mutation of isocitrate
dehydrogenase 2 in gliomas and breast cancers. Oncol Lett.
1:883–884. 2010. View Article : Google Scholar : PubMed/NCBI
|
|
71
|
Rakheja D, Konoplev S, Medeiros LJ and
Chen W: IDH mutations in acute myeloid leukemia. Hum Pathol.
43:1541–1551. 2012. View Article : Google Scholar : PubMed/NCBI
|
|
72
|
Bleeker FE, Lamba S, Leenstra S, Troost D,
Hulsebos T, Vandertop WP, Frattini M, Molinari F, Knowles M,
Cerrato A, et al: IDH1 mutations at residue p.R132 (IDH1(R132))
occur frequently in high-grade gliomas but not in other solid
tumors. Hum Mutat. 30:7–11. 2009. View Article : Google Scholar : PubMed/NCBI
|
|
73
|
Dang L, White DW, Gross S, Bennett BD,
Bittinger MA, Driggers EM, Fantin VR, Jang HG, Jin S, Keenan MC, et
al: Cancer-associated IDH1 mutations produce 2-hydroxyglutarate.
Nature. 462:739–744. 2009. View Article : Google Scholar : PubMed/NCBI
|
|
74
|
Prasad B, Tian Y and Li X: Large-Scale
analysis reveals gene signature for survival prediction in primary
glioblastoma. Mol Neurobiol. 57:5235–5246. 2020. View Article : Google Scholar : PubMed/NCBI
|
|
75
|
Calvert AE, Chalastanis A, Wu Y, Hurley
LA, Kouri FM, Bi Y, Kachman M, May JL, Bartom E, Hua Y, et al:
Cancer-associated IDH1 promotes growth and resistance to targeted
therapies in the absence of mutation. Cell Rep. 19:1858–1873. 2017.
View Article : Google Scholar : PubMed/NCBI
|
|
76
|
Wahl DR, Dresser J, Wilder-Romans K,
Parsels JD, Zhao SG, Davis M, Zhao L, Kachman M, Wernisch S, Burant
CF, et al: Glioblastoma therapy can be augmented by targeting
IDH1-mediated NADPH biosynthesis. Cancer Res. 77:960–970. 2017.
View Article : Google Scholar : PubMed/NCBI
|
|
77
|
Liu WS, Chan SH, Chang HT, Li GC, Tu YT,
Tseng HH, Fu TY, Chang HY, Liou HH, Ger LP and Tsai KW: Isocitrate
dehydrogenase 1-snail axis dysfunction significantly correlates
with breast cancer prognosis and regulates cell invasion ability.
Breast Cancer Res. 20:252018. View Article : Google Scholar : PubMed/NCBI
|
|
78
|
Selak MA, Armour SM, MacKenzie ED,
Boulahbel H, Watson DG, Mansfield KD, Pan Y, Simon MC, Thompson CB
and Gottlieb E: Succinate links TCA cycle dysfunction to
oncogenesis by inhibiting HIF-alpha prolyl hydroxylase. Cancer
Cell. 7:77–85. 2005. View Article : Google Scholar : PubMed/NCBI
|
|
79
|
Warburg O: On the origin of cancer cells.
Science. 123:309–314. 1956. View Article : Google Scholar : PubMed/NCBI
|
|
80
|
Hanahan D and Weinberg RA: Hallmarks of
cancer: The next generation. Cell. 144:646–674. 2011. View Article : Google Scholar : PubMed/NCBI
|
|
81
|
Warburg O: On respiratory impairment in
cancer cells. Science. 124:269–270. 1956.PubMed/NCBI
|
|
82
|
Barbosa IA, Machado NG, Skildum AJ, Scott
PM and Oliveira PJ: Mitochondrial remodeling in cancer metabolism
and survival: Potential for new therapies. Biochim Biophys Acta.
1826:238–254. 2012.PubMed/NCBI
|
|
83
|
Moreno-Sanchez R, Rodriguez-Enriquez S,
Marin-Hernandez A and Saavedra E: Energy metabolism in tumor cells.
FEBS J. 274:1393–1418. 2007. View Article : Google Scholar : PubMed/NCBI
|
|
84
|
Koppenol WH, Bounds PL and Dang CV: Otto
Warburg's contributions to current concepts of cancer metabolism.
Nat Rev Cancer. 11:325–337. 2011. View Article : Google Scholar : PubMed/NCBI
|
|
85
|
Phan LM, Yeung SC and Lee MH: Cancer
metabolic reprogramming: Importance, main features, and potentials
for precise targeted anti-cancer therapies. Cancer Biol Med.
11:1–19. 2014.PubMed/NCBI
|
|
86
|
Schwartzenberg-Bar-Yoseph F, Armoni M and
Karnieli E: The tumor suppressor p53 down-regulates glucose
transporters GLUT1 and GLUT4 gene expression. Cancer Res.
64:2627–2633. 2004. View Article : Google Scholar : PubMed/NCBI
|
|
87
|
Marbaniang C and Kma L: Dysregulation of
glucose metabolism by oncogenes and tumor suppressors in cancer
cells. Asian Pac J Cancer Prev. 19:2377–2390. 2018.PubMed/NCBI
|