Introduction
Prostate cancer (PCa) is the fifth most common cause
of cancer-associated mortality among men worldwide (1). Digital rectal examination and
determination of prostate-specific antigen levels within the blood
are techniques that are commonly used to screen for PCa (2). If these techniques suggest the presence
of PCa, the diagnosis is confirmed using a transrectal biopsy
analysis (2,3). Current treatments for clinically
localized or advanced PCa include radical prostatectomy,
cryoablation, radiation therapy, brachytherapy and androgen
deprivation therapy (ADT) (2,4).
The androgens [testosterone (T) and
dihydrotestosterone] are hormones, which are required for the
development of the reproductive system and male secondary sex
characteristics (4,5). These hormones exert their physiological
actions via interaction with the androgen receptor (AR), which is a
ligand-dependent transcriptional factor belonging to the
superfamily of nuclear receptors (5).
Androgens serve an important role in the development and growth of
a normal prostate gland and in the proliferation of PCa cells
(6,7).
Therefore, ADT is often used as a first line treatment to control
advanced PCa (8). However, after 2–3
years of treatment, PCa develops resistance to ADT, resulting in
castration-resistant PCa (CRPC) (8).
Hypersensitivity, mutations, splicing variants or amplification of
the AR and intratumoral steroidogenesis have been indicated to be
mechanisms that may lead to androgen resistance (6). Steroidogenesis begins with the
translocation of cholesterol to the inner membrane of the
mitochondria via steroidogenic acute regulatory protein (9). In addition, cytochrome P450 family 11
subfamily A member 1 (CyP11A1), cytochrome P450 family 17 subfamily
A member 1 (CyP17A1), 3β hydroxysteroid dehydrogenase type 2 (3β
HSD2), 17β-hydroxysteroid dehydrogenase type 3 and 5α reductase
type 1 and 2 are the main enzymes that are required to complete
androgen de novo synthesis from cholesterol (9).
A number of previous studies have demonstrated that
steroidogenic cells expressing endothelin receptor increase
steroidogenesis when stimulated with endothelin-1 (ET-1) (10–12).
Furthermore, patients with metastatic CRPC have been reported to
exhibit increased ET-1 plasma levels compared with patients with
localized PCa and healthy individuals (13–17),
suggesting that ET-1 may contribute to the transition from
androgen-dependent PCa to CRPC. ET-1, which is a potent
vasoconstrictor peptide containing 21 amino acid residues, is
associated with a number of aspects of PCa progression, including
proliferation, escape from apoptosis, invasion, angiogenesis and
new bone formation (16,18,19).
Leydig cells have been indicated to express high
levels of endothelin receptors (12)
and increase basal T secretion when stimulated with ET-1 (10,11).
Additionally, endothelin receptor A (ETAR) activation by
ET-1 has been revealed to increase AR mRNA expression via c-myc in
androgen-independent LNCaP cells, contributing to androgenic
independence (20). However, to the
best of our knowledge, the role of endothelin receptors in
non-steroidogenic cells, including PCa cells, has not yet been
described. In the present study, an ET-1-dependent increase in the
expression levels of steroidogenic enzymes and an increase in AR
and T production in PCa cells were observed.
Materials and methods
Chemicals and materials
ET-1 was purchased from Sigma-Aldrich; Merck KGaA.
ET-1 receptor antagonists,
2-[(3R,6R,9S,12R,15S)-6-(1H-indol-3-ylmethyl)-9-(2-methylpropyl)-2,5,8,11,14-pentaoxo-12-propan-2-yl-1,4,7,10,13-pentazabicyclo[13.3.0]octadecan-3-yl]
acetic acid or cyclo(D-tryptamine-D-aspartic
acid-L-proline-D-valine-L-leucine) (BQ123) and
2,6-Dimethylpiperidinecarbonyl-γ-Methyl-Leu-Nin-(Methoxycarbonyl)-D-Trp-D-Nle,-N-[N-[N-[(2,6-Dimethyl-1-piperidinyl)carbonyl]-4-methyl-L-leucyl]-1-(methoxycarbonyl)-D-tryptophyl]-D-norleucine
sodium salt (BQ788) were purchased from Cayman Chemical Company and
bosentan was purchased from Sigma-Aldrich; Merck KGaA. The salts,
chloroform and alcohols were obtained from MilliporeSigma and
Hank's buffer was obtained from Thermo Fisher Scientific, Inc.
Endothelin receptor and AR
blockade
Cells were incubated with BQ123 (ETAR
selective antagonist; 1 µM), BQ788 [endothelin B receptor
(ETBR) selective antagonist; 1 µM] or bosentan
(ETAR and ETBR dual antagonist; 1 µM) for 30
min at 37°C with 5% CO2. In all experiments, DMSO 0.1%
was used.
Cell culture
PCa cells from androgen-dependent lymph nodal
metastases (LNCaP) and PCa cells from bone metastases (PC3) were
obtained from American Type Culture Collection. LNCaP cells, clone
FDG (CRL1740), were maintained in RPMI-1640 medium (Gibco; Thermo
Fisher Scientific, Inc.) and PC3 cells (CRL1435) were maintained in
DMEM F12 medium (Gibco; Thermo Fisher Scientific, Inc.). Both media
were supplemented with 10% FBS (Thermo Fisher Scientific, Inc.), 1%
penicillin, 1% streptomycin and 0.05% amphotericin B (Corning,
Inc.). All cell cultures were maintained at 37°C in a humidified
atmosphere with 5% CO2. The media of PC3 cells were
replaced with phenol red-free RPMI (Gibco; Thermo Fisher
Scientific, Inc.) supplemented with 10% activated charcoal
(Sigma-Aldrich; Merck KGaA)-treated FBS, 1% streptomycin, 0.05%
amphotericin B and 1% penicillin 24 h before the different
treatments. Afterwards, cells were washed with PBS three times and
harvested.
Tissue microarrays (TMAs)
A TMA was constructed with 5-µm sections of formalin
(10% v/v)-fixed for 24 h at room temperature and paraffin-embedded
PCa samples from male patients (age range, 47–80 years; mean age,
63.7 years) with different Gleason Score (GS) (21) from the biopsy archive of our
institutional Pathology Department (Clinical Hospital of the
University of Chile, Santiago, Chile). All samples were diagnosis
biopsies collected in different years (March 2016-January 2018)
with a confirmed diagnosis and GS. The sample inclusion criterion
was: PCa confirmed. All protocols for tissue archive use and
processing have been approved by the institutional Ethical
Committee of Faculty of Medicine, University of Chile (approval
nos. 135-2015 and 083-2020). For diagnosis biopsies, patients were
asked to sign a general consent when biopsies were obtained. For
the use of the archive of biopsies from the Pathology Service, a
signed authorization of the director of the Department of
Pathology, University of Chile (authorization 03012016; Santiago,
Chile) is required. TMAs with cores of 1 mm in diameter, including
7 samples with a low GS (GS<7), 14 samples with an intermediate
GS (GS=7) and 11 samples with a high GS (GS>7) were obtained and
evaluated by a pathologist.
Immunohistochemistry
TMA tissue sections were deparaffinized and
rehydrated in decreasing concentrations of ethanol and distilled
water [xylene (×2), ethanol 100% (×2), ethanol 95%, ethanol 70% and
distilled water], and incubated for 40 min at 95°C in antigen
recovery buffer (10 mM citrate buffer, pH 6.0). After cooling,
endogenous peroxidase was inhibited by incubation with 0.3%
H2O2 for 30 min and samples were blocked with
2.5% horse serum (Vector Laboratories, Inc.) for 30 min at room
temperature. Then, sections were incubated with primary antibody
against ETAR (dilution, 1:300; cat. no. PA3-065; Thermo
Fisher Scientific, Inc.) or ETBR (dilution, 1:800; cat.
no. PA3-066; Thermo Fisher Scientific, Inc.) overnight at 4°C.
Subsequently, the samples were washed and incubated with secondary
antibody conjugated to the HRP enzyme for 1 h at room temperature
(ready to use; anti-rabbit-mouse-IgG; cat. no. PK-7200; Vector
Laboratories, Inc.). Then, samples were washed and incubated with
ABC amplification system for 30 min at room temperature (ready to
use; cat. no. PK-7 200; Vector Laboratories, Inc.). Finally, the
chromogenic substrate 3,3′-diaminobenzidine (DAB) was added.
Furthermore, the nuclei were stained with hematoxylin (ScyTek
Laboratories, Inc.) for 1 min at room temperature. Images were
obtained using a Leica DM2500 light microscope (Leica Microsystems
GmbH), digitized and the DAB signal was quantified by ImageJ 1.51w
software (National Institutes of Health), using the IHC toolbox
plugin (https://imagej.nih.gov/ij/plugins/ihc-toolbox/index.html)
and plotted using GraphPad Prism version 7.1 (GraphPad Software,
Inc.). For semi-quantitative analysis of immunohistochemistry
results, the gray level transformation method was implemented,
using the logarithmic transformation technique. The digitized
images were processed through gray level transformation techniques,
since it operates directly on the pixels. The image involves 256
levels of gray, so in the histogram on the horizontal axis it
ranges from 0 to 255 levels of gray. On the other hand, the
vertical axis differs from the number of pixels in the image. The
Log (255/average color/grays in the selected area) was determined
as previously described (22).
RNA extraction and quantification
Total RNA was isolated from cells using
TRIzol® (Thermo Fisher Scientific, Inc.), chloroform,
isopropanol and 75% ethanol. Subsequently, nuclease free water
(diethylpyrocarbonate-treated) was used to re-suspend extracted
RNA. The purity and concentration of RNA were determined by
spectrophotometry at 260/280 nm using a BioTeK Synergy HT plate
reader (BioTek Instruments, Inc.).
Reverse transcription-quantitative PCR
(RT-qPCR)
A total of 1,000 ng total RNA from each sample was
used for cDNA synthesis using the 5X All-In-One RT MasterMix kit
(25°C for 10 min, 42°C for 15 min and 85°C for 5 min, 1 cycle;
Applied Biological Materials Inc.). Subsequently, 50 ng/ml were
amplified by qPCR using the Brilliant II SYBR Green qPCR Master Mix
kit (95°C for 10 min, 1 cycle; 95°C for 15 min, 60°C for 15 min and
72°C for 15 min, 40 cycles; 95°C for 15 min, 65°C for 15 min and
95°C for 15 min, 1 cycle; Agilent Technologies, Inc.). RT-qPCR
oligonucleotides are shown in Table
I. The housekeeping gene Pumilio was used to normalize data and
the results were analyzed using the ΔΔCq method (23). To facilitate comparison, data were
referred to those cells that express the highest levels of the
receptor. PC3 cells expressed the highest levels of ETAR
mRNA and protein, so the expression levels of ETAR of
LNCaP cells were compared with PC3 cells. By contrast, LNCaP cells
expressed the highest levels of ETBR mRNA and protein,
so ETBR expression levels of PC3 cells were compared
with LNCaP cells.
 | Table I.Reverse transcription-quantitative
PCR oligonucleotides. |
Table I.
Reverse transcription-quantitative
PCR oligonucleotides.
| Gene | Forward
(5′-3′) | Reverse
(5′-3′) |
|---|
|
ETAR |
GAACATCTTAAGCAGCGTCGAG |
ACCGATGTAATCCATGAGCAGT |
|
ETBR |
GCTTGCTTCATCCCGTTCAGA |
CTTCCCGTCTCTGCTTTAGGTG |
| ET-1 |
CAGGGCTGAAGACATTATGGAGA |
CATGGTCTCCGACCTGGTTT |
| Pumilio |
CGGTCGTCCTGAGGATAAAA |
CGTACGTGAGGCGTGAGTAA |
Intracellular calcium measurement
PC3 cells were grown on 25-mm diameter glass
coverslips and kept in DMEM F12 medium for 24 h. Subsequently, the
cells were washed with PBS and loaded with 2 µM Fluor-4
acetoxymethyl ester (Fluo4/AM; Thermo Fisher Scientific, Inc.) at
room temperature for 15 min. Subsequently, the cells were
maintained in Hank's Balanced Salt Solution at a final volume of
500 µl containing 142 mM NaCl, 5.6 mM KCl, 1 mM MgCl2, 2
mM CaCl2, 0.34 mM Na2HPO4, 0.44 mM
KH2PO4, 4.2 mM NaHCO3, 10 mM HEPES
and 5.6 mM glucose. On the one hand, 100 nM ET-1 was added at 60
sec after reaction was initiated with Fluo4/AM, at room
temperature, to cells previously incubated with DMSO or with
selective antagonists for endothelin receptors, at 37°C for 30 min.
In all experiments DMSO (0.1%) was used. On the other hand, 17 mM
carbachol (positive control) was added at 245 sec after reaction
was initiated with Fluo4AM, at room temperature, to cells
preincubated with BQ123 at 37°C for 30 min. The kinetics recording
was carried out for 300 sec and the fluorescence intensity was
measured in an AxioCam MRm (Carl Zeiss AG) coupled to a Carl Zeiss
AG inverted fluorescence microscope AxioVert. A1 equipped for
epifluorescence and the ImageJ 1.51w software (National Institutes
of Health) was used.
Indirect immunofluorescence
PC3 and LNCaP cells were grown on 12-mm diameter
glass coverslips seeded at a confluence of 60–70%. After 24–48 h,
the cells were fixed with a fixing solution (4% paraformaldehyde)
for 30 min at room temperature, washed and blocked with 3% BSA
(Winkler, Ltd.) in PBS-glycine for 30 min at room temperature.
Cells were incubated overnight at 4°C with the primary antibodies
against ETAR (dilution, 1:200; cat. no. PA3-065; Thermo
Fisher Scientific, Inc.) and ETBR (dilution, 1:200; cat.
no. PA3-066; Thermo Fisher Scientific, Inc.), washed and incubated
for 30 min at 37°C with the secondary antibody Alexa Fluor 594
(dilution, 1:500; cat. no. A21207; Thermo Fisher Scientific, Inc.).
DAPI (dilution, 1:10,000; cat. no. sc3598; Santa Cruz
Biotechnology, Inc.) was used for nuclear staining for 7 min at
room temperature. The images were obtained using a Leica D2500
fluorescence microscope (Leica Microsystems GmbH).
Western blotting
Proteins obtained from cell lines were extracted
using RIPA buffer (20 mM Tris-HCl, 150 mM NaCl, 1 mM EDTA, 1% v/v
NP-40, 1% w/v sodium deoxycholate, 2.5 mM
Na3PO4, 1 mM b-glycerophosphate and 1 mM
Na3VO4, pH 7.4) with a protease inhibitor
cocktail (Roche Diagnostics). The homogenate was centrifuged at
16,708 × g for 15 min at 4°C. Finally, the supernatant was
quantified using a Bradford assay. A total of 25 µg of protein was
loaded per lane, separated by SDS-PAGE (10 or 12% polyacrylamide
for ETAR and ETBR), and transferred to a
nitrocellulose membrane, except for detection of 3β HSD2, for which
protein was transferred to a PVDF membrane. The membranes were
blocked at room temperature with 5% BSA (Winkler, Ltd.) or milk of
0.2% TBS-Tween for 90 min and exposed to the primary antibody
overnight at 4°C. After washing, the binding of the primary
antibodies was detected with secondary antibodies conjugated with
the HRP enzyme for 90 min at room temperature, and detected using
EZ-ECL chemiluminescence kit (Biological Industries) and a Vilber
Lourmat equipment (Fusion FX5-XT 826.WL/superbright serial number
15200393; Vilber). Primary and secondary antibodies for western
blotting are shown in Tables II and
III, respectively. The
densitometric analysis of western blot bands was performed using
ImageJ v1.51 software (National Institutes of Health).
| Table II.Primary antibodies for western
blotting. |
Table II.
Primary antibodies for western
blotting.
| Primary
antibody | Supplier | Cat. no. | Species | Dilution |
|---|
|
ETAR | Thermo Fisher
Scientific, Inc. | PA3-065 | Rabbit
anti-human | 1:1,000 |
|
ETBR | Thermo Fisher
Scientific, Inc. | PA3-066 | Rabbit
anti-human | 1:1,000 |
| ET-1 | Santa Cruz
Biotechnology, Inc. | sc-517436 | Mouse
anti-human | 1:500 |
| CyP11A1 | Abcam | ab-75497 | Rabbit
anti-human | 1:1,000 |
| CyP17A1 | Merck KGaA. | ABC392 | Rabbit
anti-human | 1:1,000 |
| AKR1C2 | Thermo Fisher
Scientific, Inc. | PA5-36572 | Rabbit
anti-human | 1:500 |
| 3β HSD2 | Thermo Fisher
Scientific, Inc. | PA5-27791 | Rabbit
anti-human | 1:1,000 |
| AR | Abcam | ab-9474 | Mouse
anti-human | 1:1,000 |
| Actin | MP Biomedicals,
LLC | 691002 | Mouse
anti-human | 1:5,000 |
| Table III.Secondary antibodies. |
Table III.
Secondary antibodies.
| Secondary
antibody | Supplier | Cat. no. | Dilution |
|---|
| Anti-rabbit | Jackson
ImmunoResearch Laboratories, Inc. | 111-035-003 | 1:10,000 |
| Anti-mouse | Jackson
ImmunoResearch Laboratories, Inc. | 115-035-003 | 1:10,000 |
Determination of T levels in cell
culture medium
PC3 cells were grown on 6-well plates in RPMI medium
free of phenol red with 10% androgen-free FBS. After 24 h, DMSO
(control) or endothelin receptor antagonist was added for 30 min at
37°C, and then 100 nM ET-1 was added every 24 h at 37°C. In all
experiments, DMSO (0.1%) was used. After 96 h, the culture medium
was removed and centrifuged at 1,000 × g for 5 min at room
temperature. The number of viable cells was quantified in each
condition. Parameter Testosterone Assay (cat. no. KGE010; R&D
Systems, Inc.) was used for T determination in culture supernatant
according to the manufacturer's protocols. The assay was based on a
competitive binding technique. A total of 50 µl of a monoclonal
antibody specific for T (excluding non-specific binding wells) was
added for binding the anti-mouse antibody coated microplate and
incubated with shaking for 1 h at room temperature. After three
washes with wash buffer (400 µl), 100 µl calibrator (non-specific
binding wells and B0, zero standard), 100 µl standard, control or
sample (remaining wells) were added. Subsequently, 50 µl conjugated
T was incorporated into each well, and incubated for 3 h at room
temperature on a horizontal orbital microplate shaker at 37 × g
After three washes with wash buffer, 200 µl of the substrate were
added for 30 min at room temperature. Afterwards, 50 µl of the stop
solution was added to stop the reaction. Finally, the optical
density was determined within 30 min by spectrophotometry at 450 nm
using the BioTeK Synergy HT plate reader (BioTek Instruments,
Inc.).
Statistical analysis
Plots were obtained using the GraphPad Prism 7.1
software (GraphPad Software, Inc.). Data are presented as the mean
± SD of at least three independent experiments for RT-qPCR and
western blotting. Mann Whitney or Kruskal-Wallis (Dunn's multiple
comparisons test) test was carried out. The box plots represent the
signal intensity of ETAR and ETBR in each
group. The points outside the box represent the outliers. The
number of samples analyzed was 32 for low GS (<7), 14 for
intermediate GS (=7) and 11 for high GS (>7). The bar shows the
mean ± SD. P≤0.05 was considered to indicate a statistically
significant difference.
Results
Expression levels of ETAR
and ETBR in TMAs of samples
In the present study, quantitative
immunohistochemistry for ETAR and ETBR was
performed on constructed TMAs. Intracellular staining of
ETAR and ETBR was observed in PCa samples
(Fig. 1A and C). Furthermore,
semi-quantification analysis indicated that the intensity of
ETAR immunostaining was significantly higher in samples
with low GS (Kruskal-Wallis test; P<0.05) compared with in
samples with intermediate GS (Fig. 1A and
B). No changes in ETBR were observed to be
associated with GS in primary tumor samples (Fig. 1C and D). However, in benign prostatic
hyperplasia samples, used as a non-neoplastic control,
ETAR was revealed to be located in epithelial and
stromal cells (Fig. S1A), and
ETBR was revealed to be primarily located in epithelial
cells (Fig. S1B).
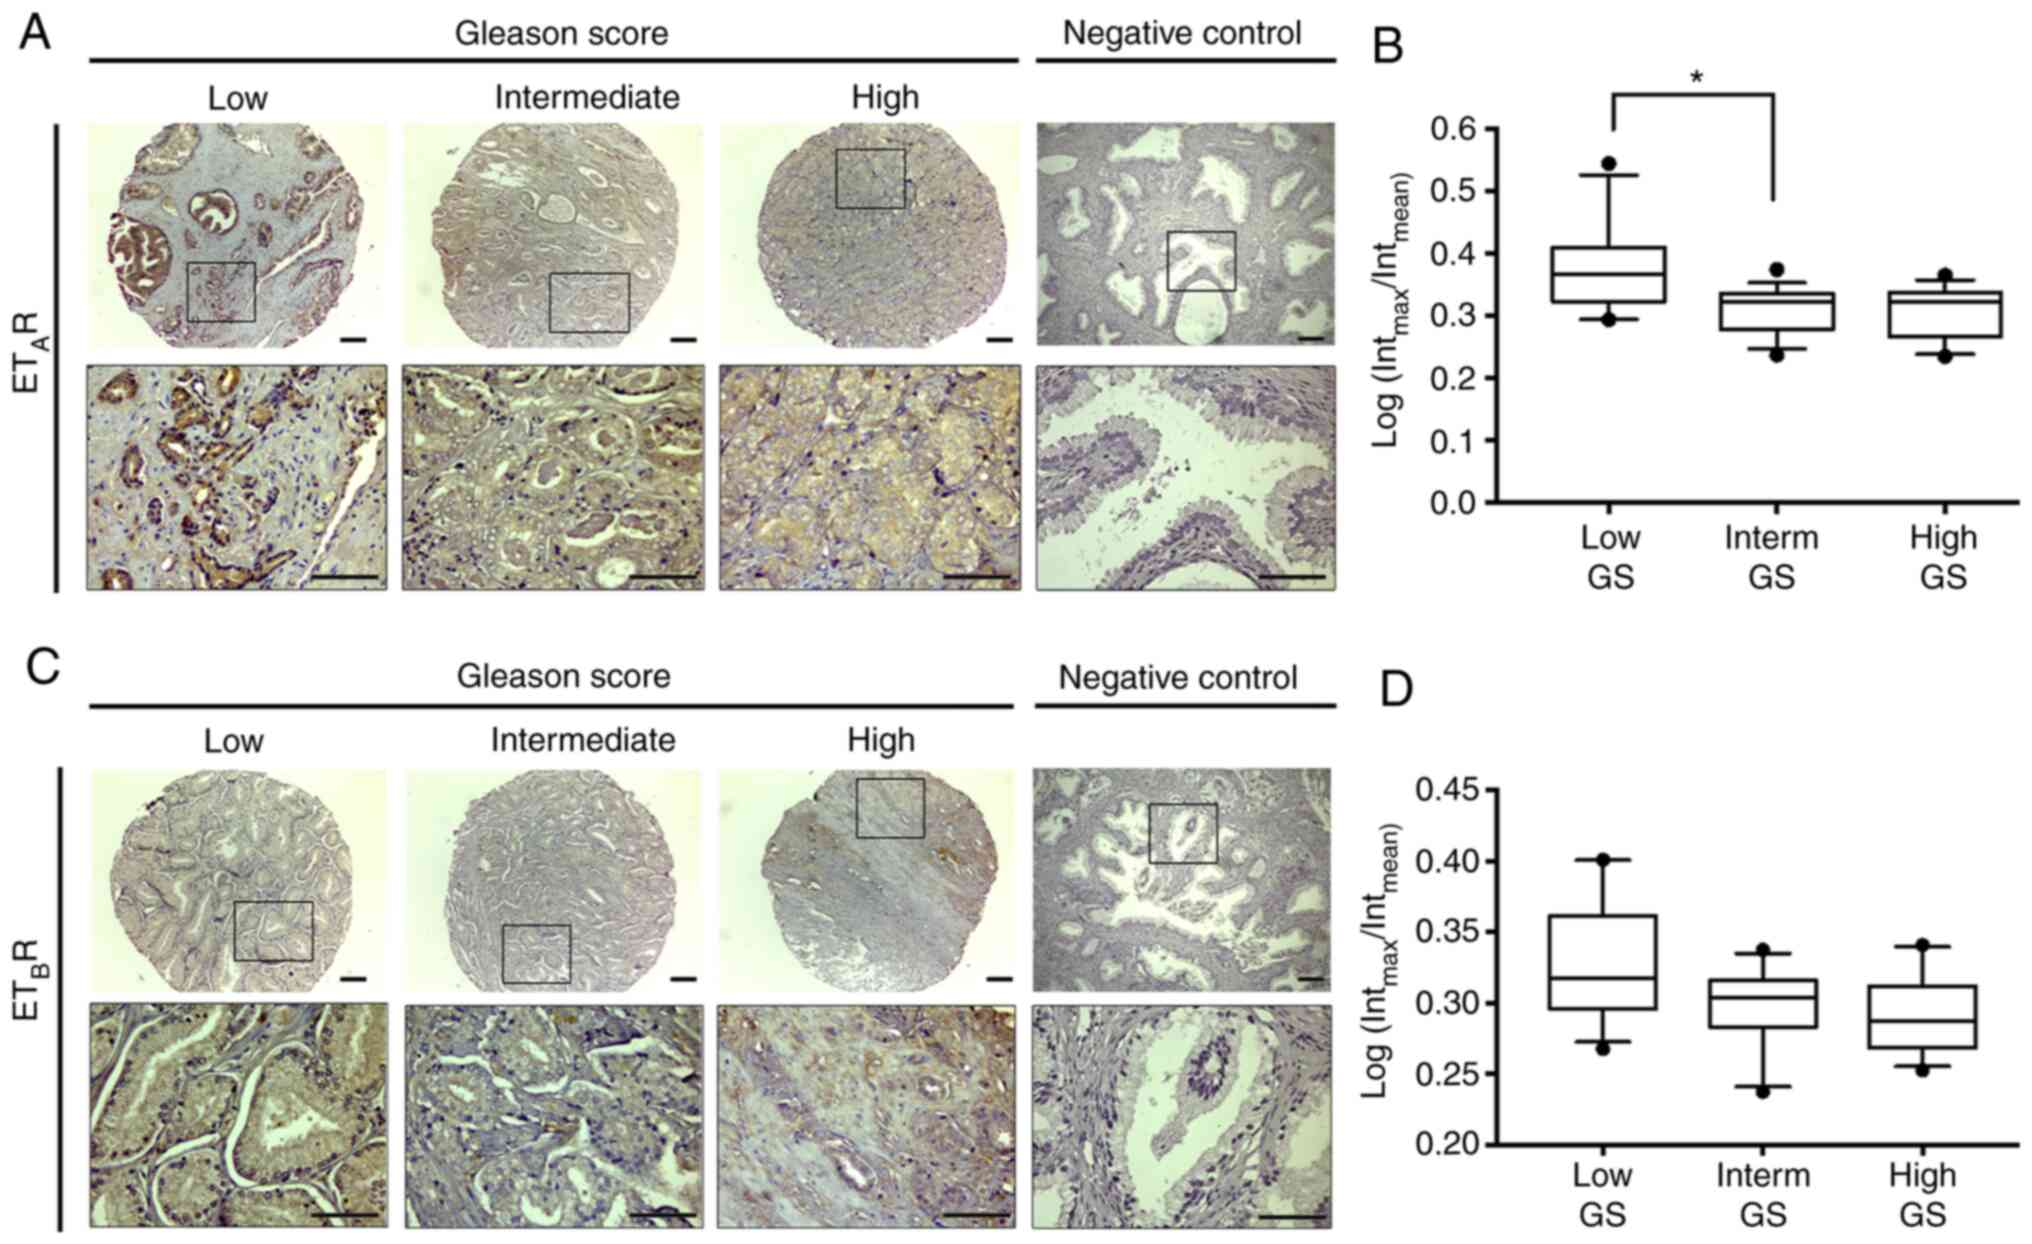 | Figure 1.Expression levels of
ETAR/ETBR in TMAs from PCa samples. The
images indicate the expression levels of
ETAR/ETBR in TMAs of PCa samples with low,
intermediate, and high GS. (A) Immunohistochemistry analysis of
ETAR. (B) Semi-quantification of the DAB signal. (C)
Immunohistochemistry analysis of ETBR. (D)
Semi-quantification of the DAB signal. The box plots represent the
signal intensity of ETAR and ETBR in each
group. The points outside the box represent the outliers. Total
number of samples analyzed, n=32; low GS (<7), n=7; intermediate
GS (=7), n=14; and high GS (>7), n=11. The box plots show the
mean ± SD. *P<0.05 (Kruskal-Wallis test/Dunn's multiple
comparisons test). Scale bar, 100 µm. PCa, prostate cancer; GS,
Gleason Score; ETAR, endothelin A receptor;
ETBR, endothelin B receptor; ET-1, endothelin-1; TMA,
tissue microarray; DAB, 3,3′-diaminobenzidine; Interm,
intermediate. |
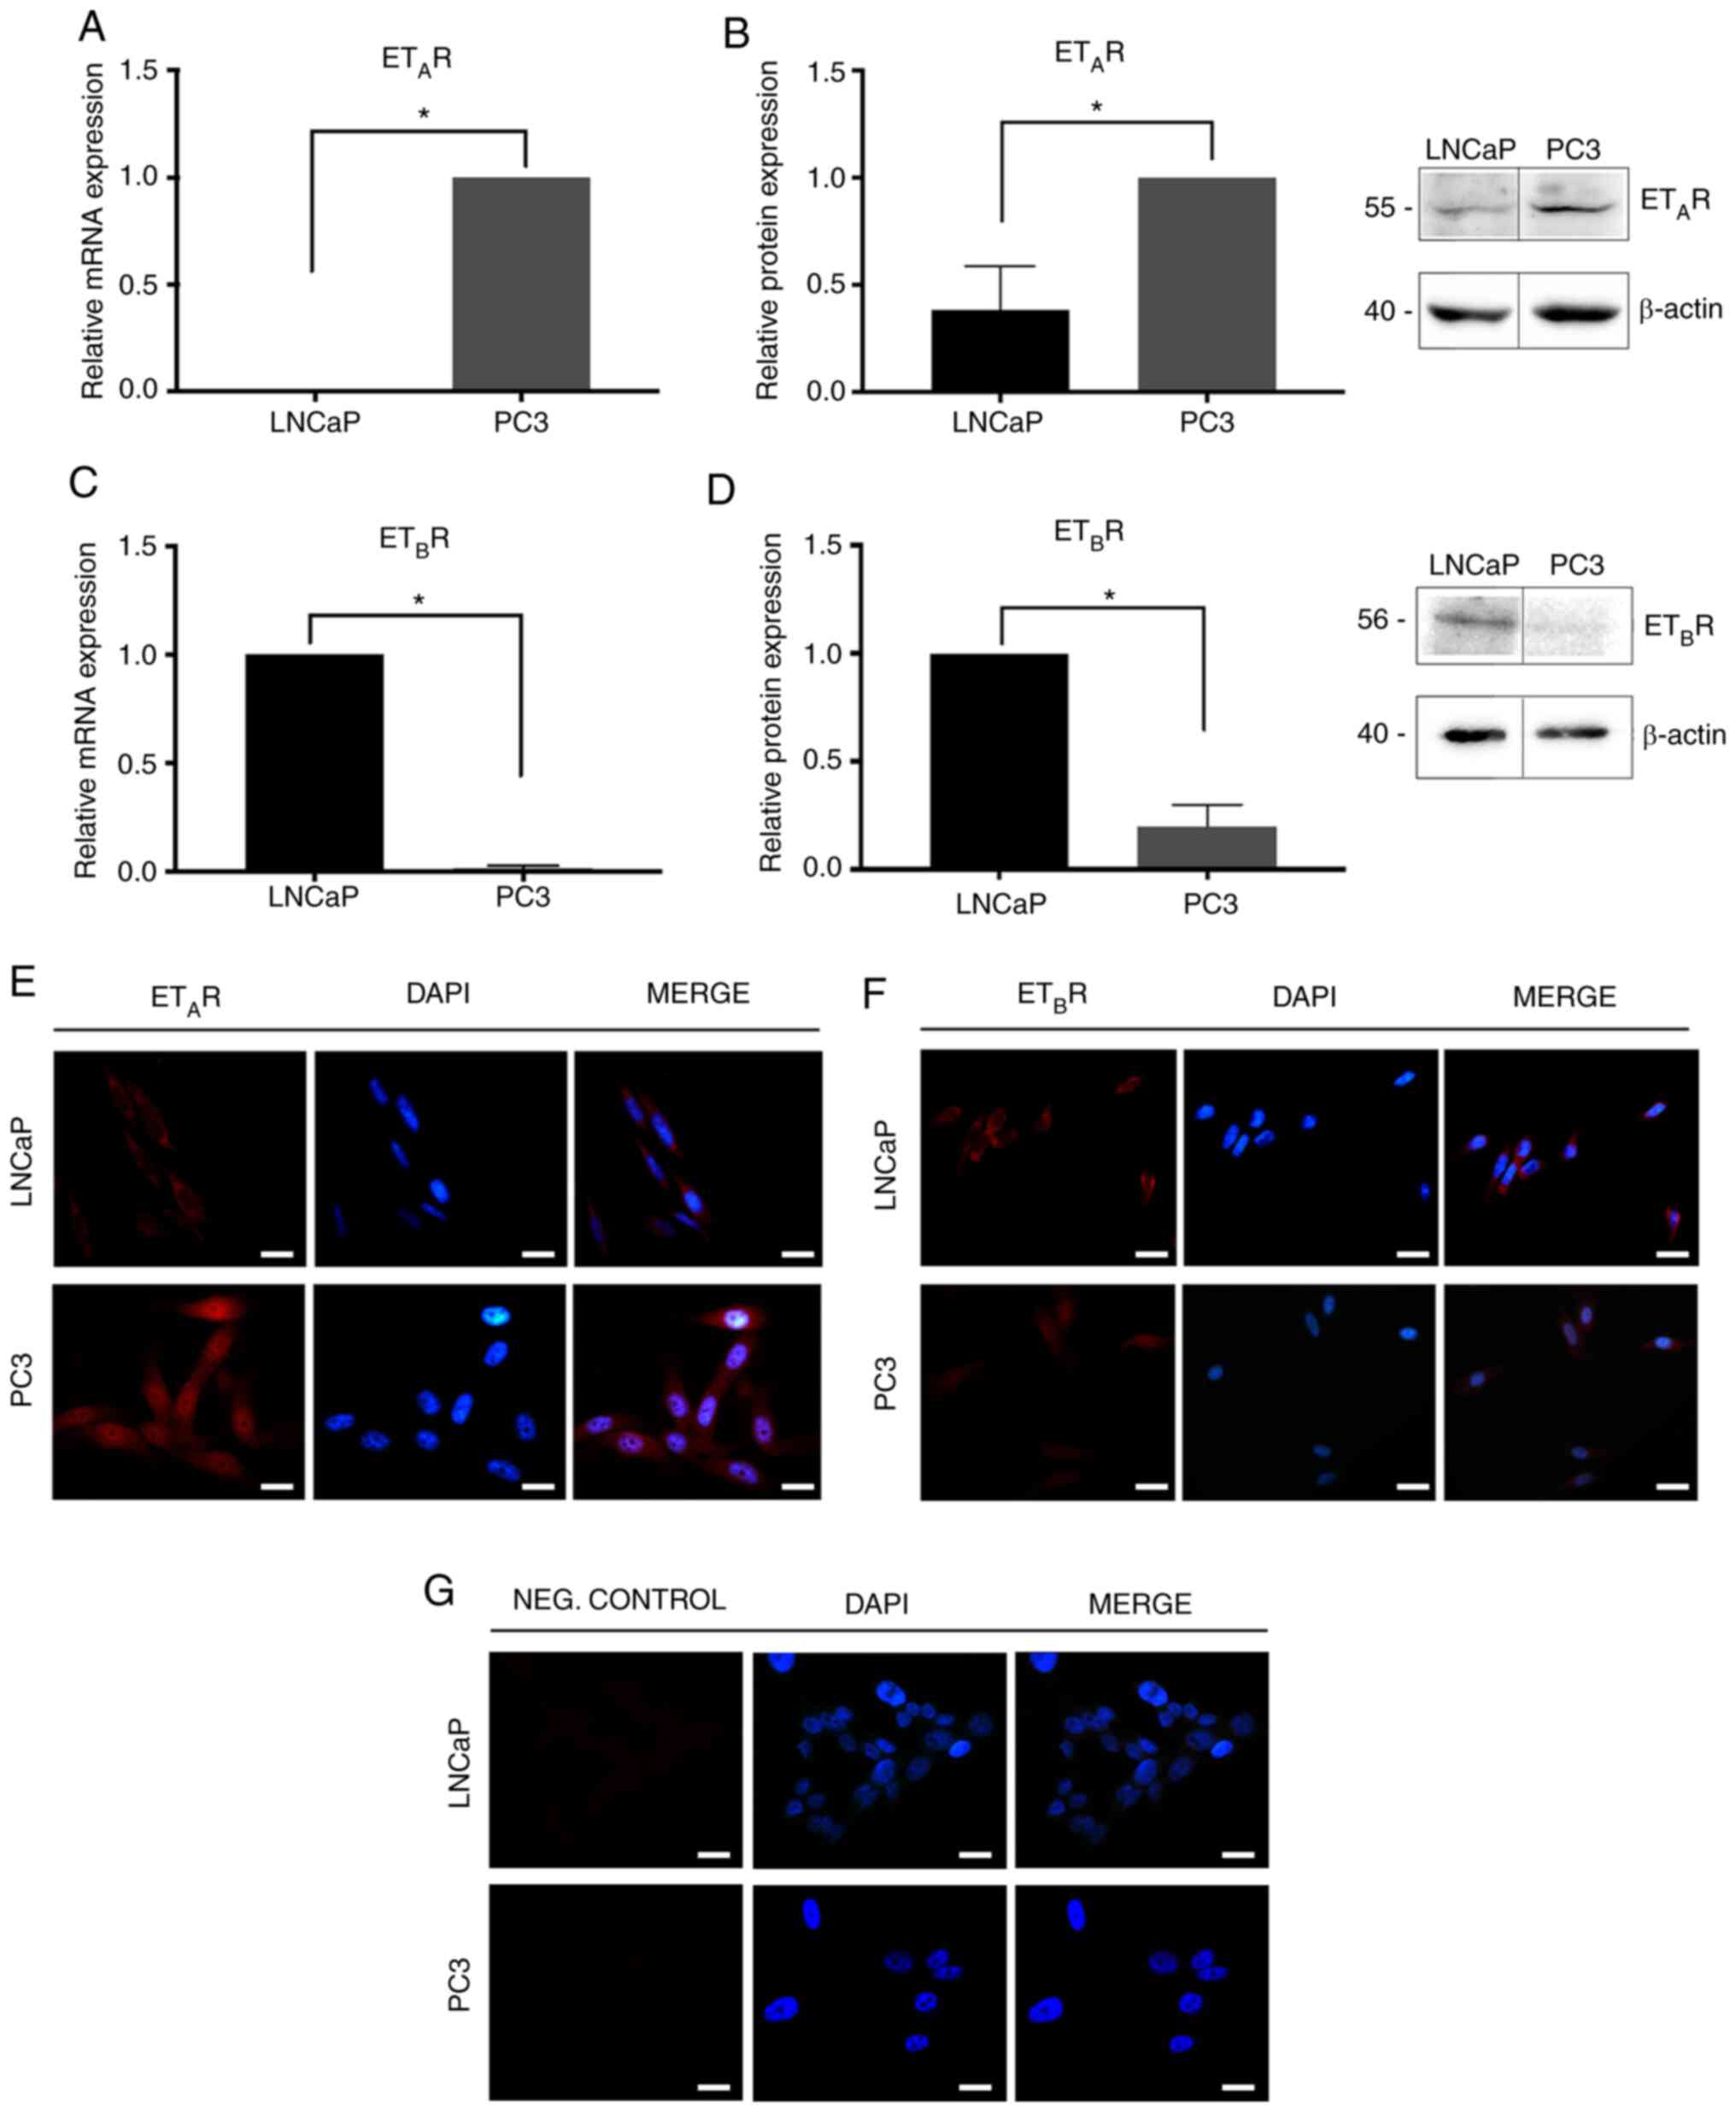
Expression levels of ET-1,
ETAR and ETBR in PCa cell lines
Basal expression levels of ET-1, ETAR and
ETBR in LNCaP and PC3 cells were determined using
RT-qPCR and western blotting. In addition, ETAR and
ETBR levels were also determined by immunofluorescence.
PC3 cells were demonstrated to exhibit the highest levels of
ETAR and ET-1 expression at the mRNA (ETAR;
Mann-Whitney test; P=0.05; Fig. 2A;
ET-1; Mann-Whitney test; P=0.05; Fig.
3A) and protein levels (ETAR; Mann-Whitney test;
P<0.05; Fig. 2B and E; ET-1
Mann-Whitney; P=0.05; Fig. 3B). By
contrast, LNCaP cells were revealed to express increased levels of
ETBR mRNA (ETBR; Mann-Whitney test; P=0.05;
Fig. 2C) and protein
(ETBR; Mann-Whitney test; P=0.05; Fig. 2D and F) compared with PC3 cells.
Negative controls are shown in Fig.
2G.
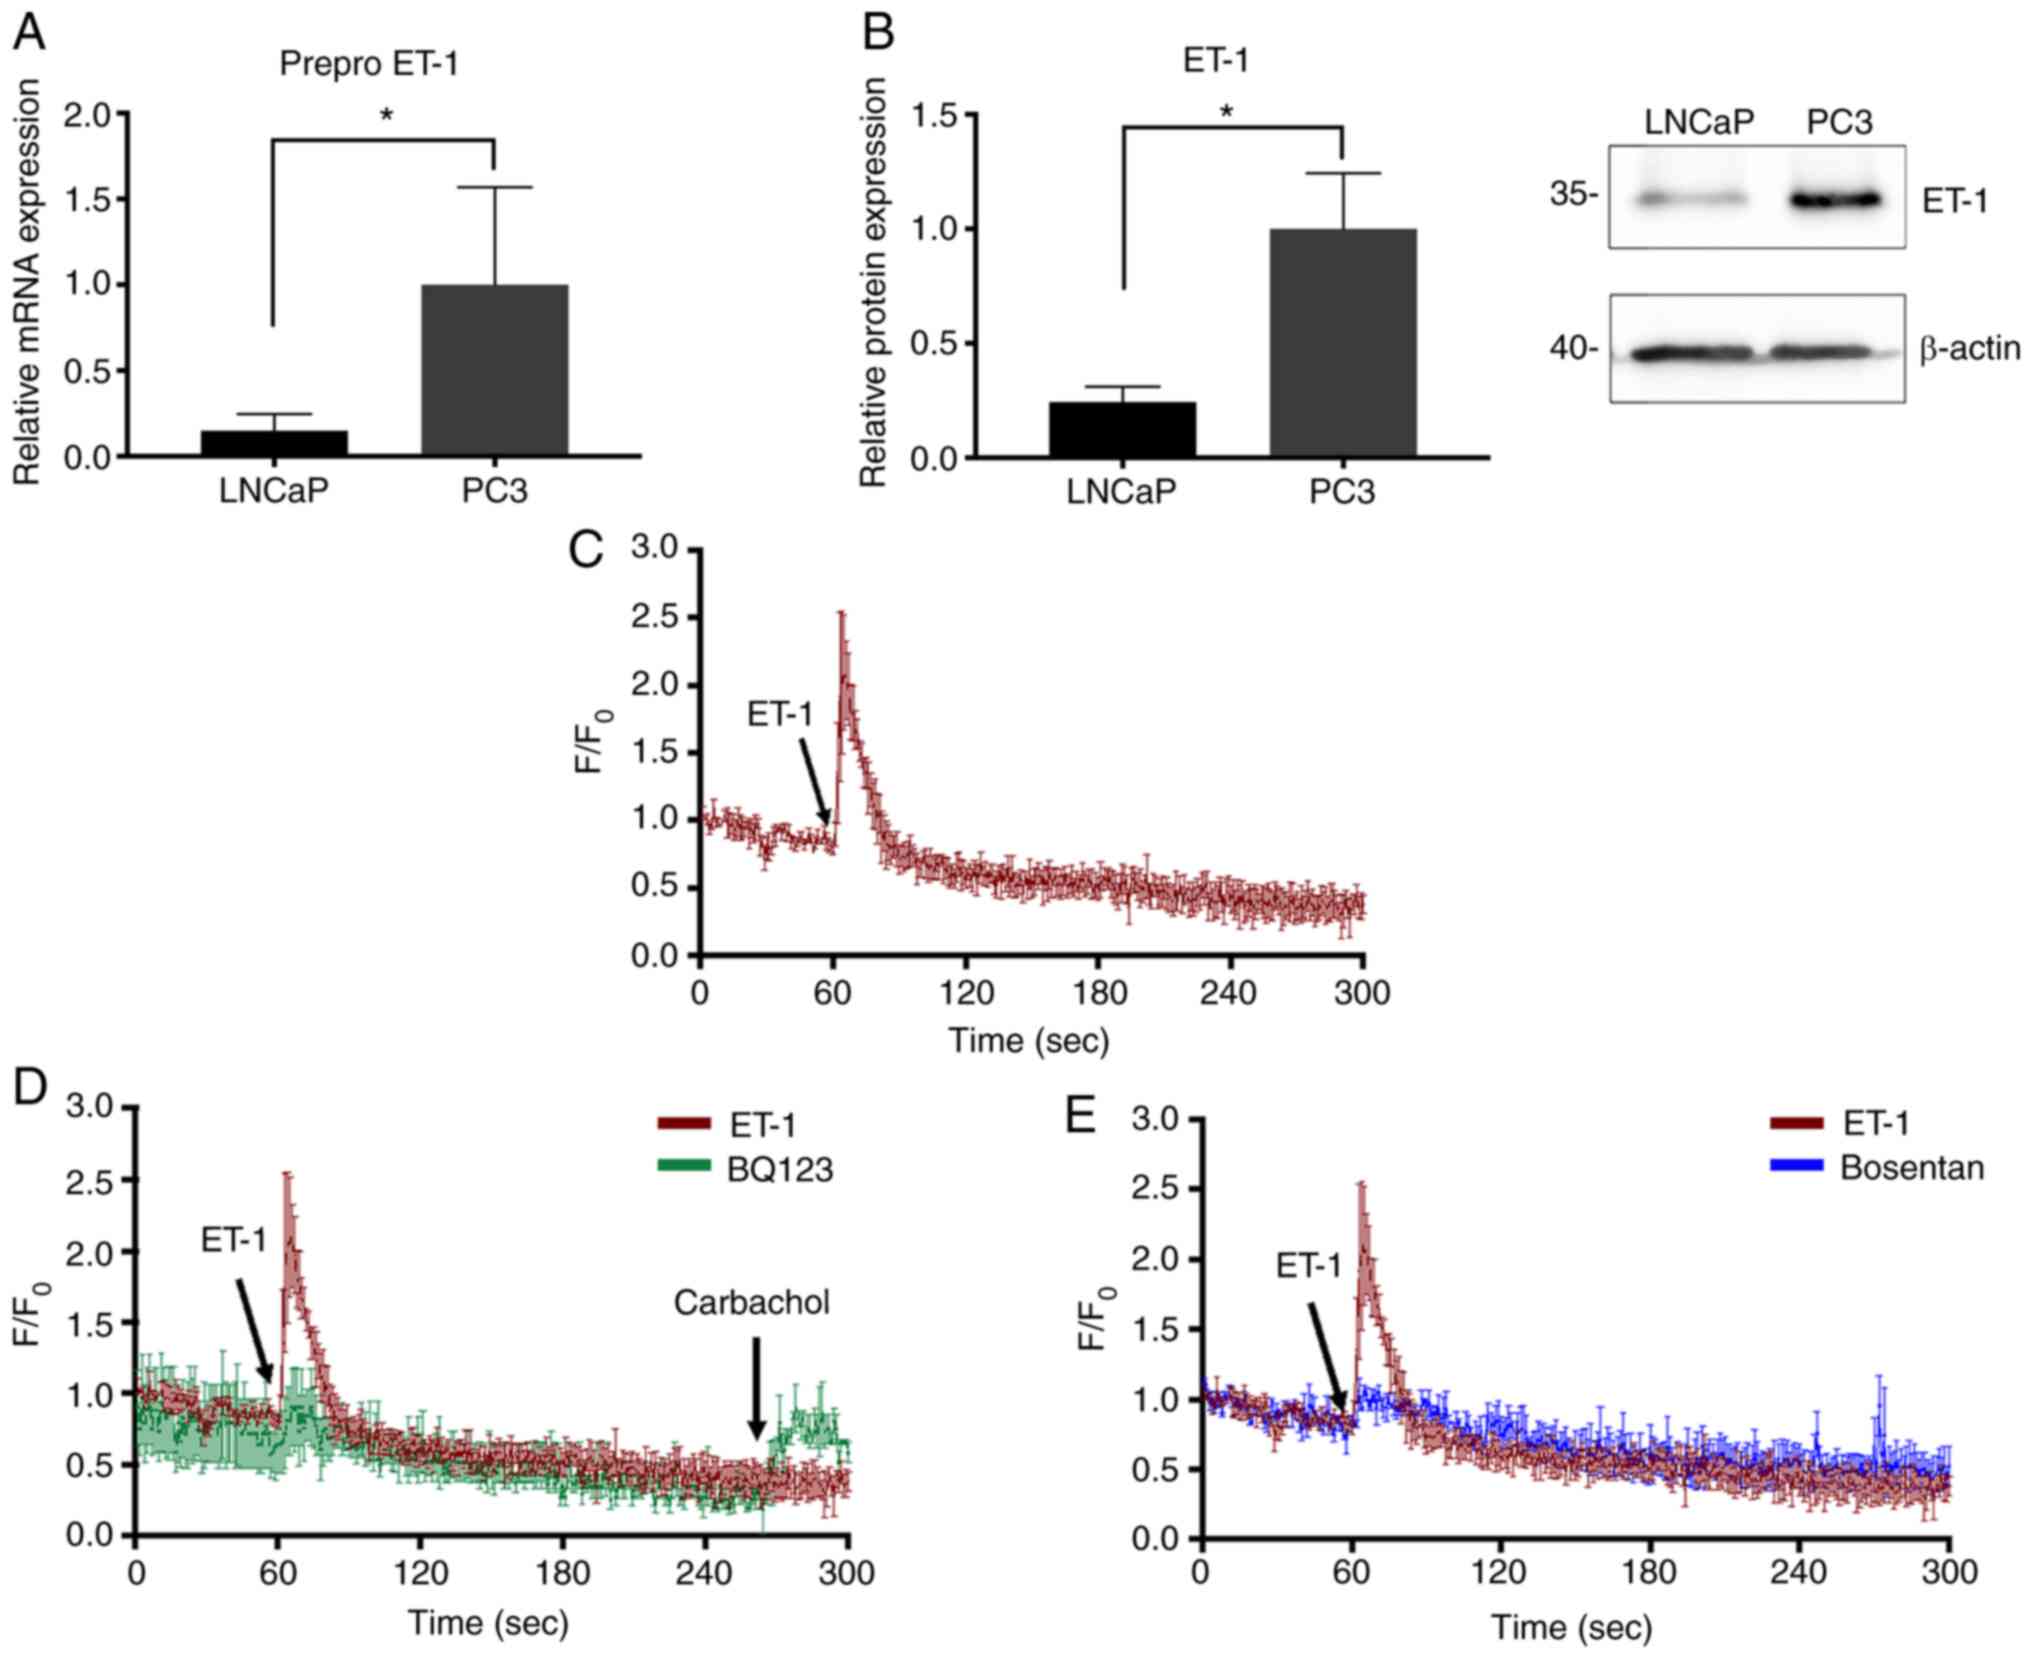 | Figure 3.ET-1 expression and effect of ET-1 on
calcium signaling in PCa cells. (A) Prepro-ET-1 mRNA expression
normalized to Pumilio compared with PC3 cells. (B) ET-1 protein
expression in PC3 and LNCaP cells. Quantification was normalized to
β-actin and PC3 cells. (C) Addition of 100 nM ET-1. (D) Cells were
incubated with 1 µM BQ123 and stimulated with ET-1. After 240 sec,
cells were stimulated with carbachol. (E) Cells were incubated with
1 µM Bosentan and stimulated with ET-1. Data are presented as the
mean ± SD (n=3 independent experiments). *P<0.05 (Mann-Whitney
test). The values 35 and 40 correspond to mass units (kDa).
F/F0, relative fluorescence intensity; PCa, prostate
cancer; ET-1, endothelin-1; BQ123,
2-[(3R,6R,9S,12R,15S)-6-(1H-indol-3-ylmethyl)-9-(2-methylpropyl)-2,5,8,11,14-pentaoxo-12-propan-2-yl-1,4,7,10,13-pentazabicyclo[13.3.0]octadecan-3-yl]
acetic acid. |
Intracellular Ca2+
measurement revealed that activity of ETAR is induced by
ET-1 in PC3 cells
Since ETAR is a Gq protein-coupled
receptor (15,17), the activity of this receptor was
evaluated via intracellular calcium measurement. The results in
Fig. 3C indicated that activation of
ETAR by ET-1 induced an intracellular Ca2+
transient signal, which was reflected as an increase in relative
fluorescence intensity (F/F0) when adding ET-1 at 60 sec compared
with carbachol (positive control; Fig.
3D), suggesting the exit of calcium from the endoplasmic
reticulum and/or the subsequent entry of calcium from the
extracellular medium. This effect was inhibited by a selective
antagonist for ETAR, BQ123 (Fig. 3D), and the non-selective antagonist
Bosentan (Fig. 3E).
Effect of ET-1 on the expression
levels of steroidogenic pathway enzymes and AR in PC3 cells
In the present study, the effect of ET-1 on the
enzymes of the steroidogenic pathway in PC3 cells was investigated.
The effect was not determined in LNCaP cells since PC3 cells
expressed higher levels of ET-1 and ETAR. Therefore, by
using PC3 cells, the effects could be observed more clearly. It was
demonstrated that ET-1 treatment increased the expression levels of
CyP11A1 (Kruskal-Wallis test; P<0.05; Fig. 4A and B-D), 3β HSD2 (Kruskal-Wallis
test; P<0.05; Fig. 4A and H-J) and
AR (Kruskal-Wallis test; P<0.05; Fig.
5A-C) in PC3 cells compared with the control without ET-1.
Blocking ET-1 receptors with BQ123 and/or Bosentan prevented the
stimulatory effect of ET-1 on the expression of CyP11A1 (ET-1/BQ123
+ ET-1; Kruskal-Wallis test; P<0.001; Fig. 4B), 3β HSD2 (ET-1/Bosentan + ET-1;
Kruskal-Wallis test; P<0.05; Fig.
4J) and AR (ET-1/BQ123 + ET-1; Kruskal-Wallis test; P<0.01;
Fig. 5B; ET-1/Bosentan + ET-1;
Kruskal-Wallis test; P<0.05; Fig.
5D). Additionally, blocking ETBR with BQ788
decreased, with respect to ET-1, the expression levels of 3β HSD2
(ET-1/BQ788 + ET-1; Kruskal-Wallis test; P<0.05; Fig. 4I). There were no changes observed in
CyP17A1 and aldo-keto reductase family member C2 (AKR1C2) protein
expression in the three antagonist treatment groups, with respect
to ET-1 (Fig. 4E-G and K-M). The
aforementioned results demonstrated that ET-1 may regulate the
protein expression levels of CyP11A1, 3β HSD2 and AR via
ETAR or ETBR.
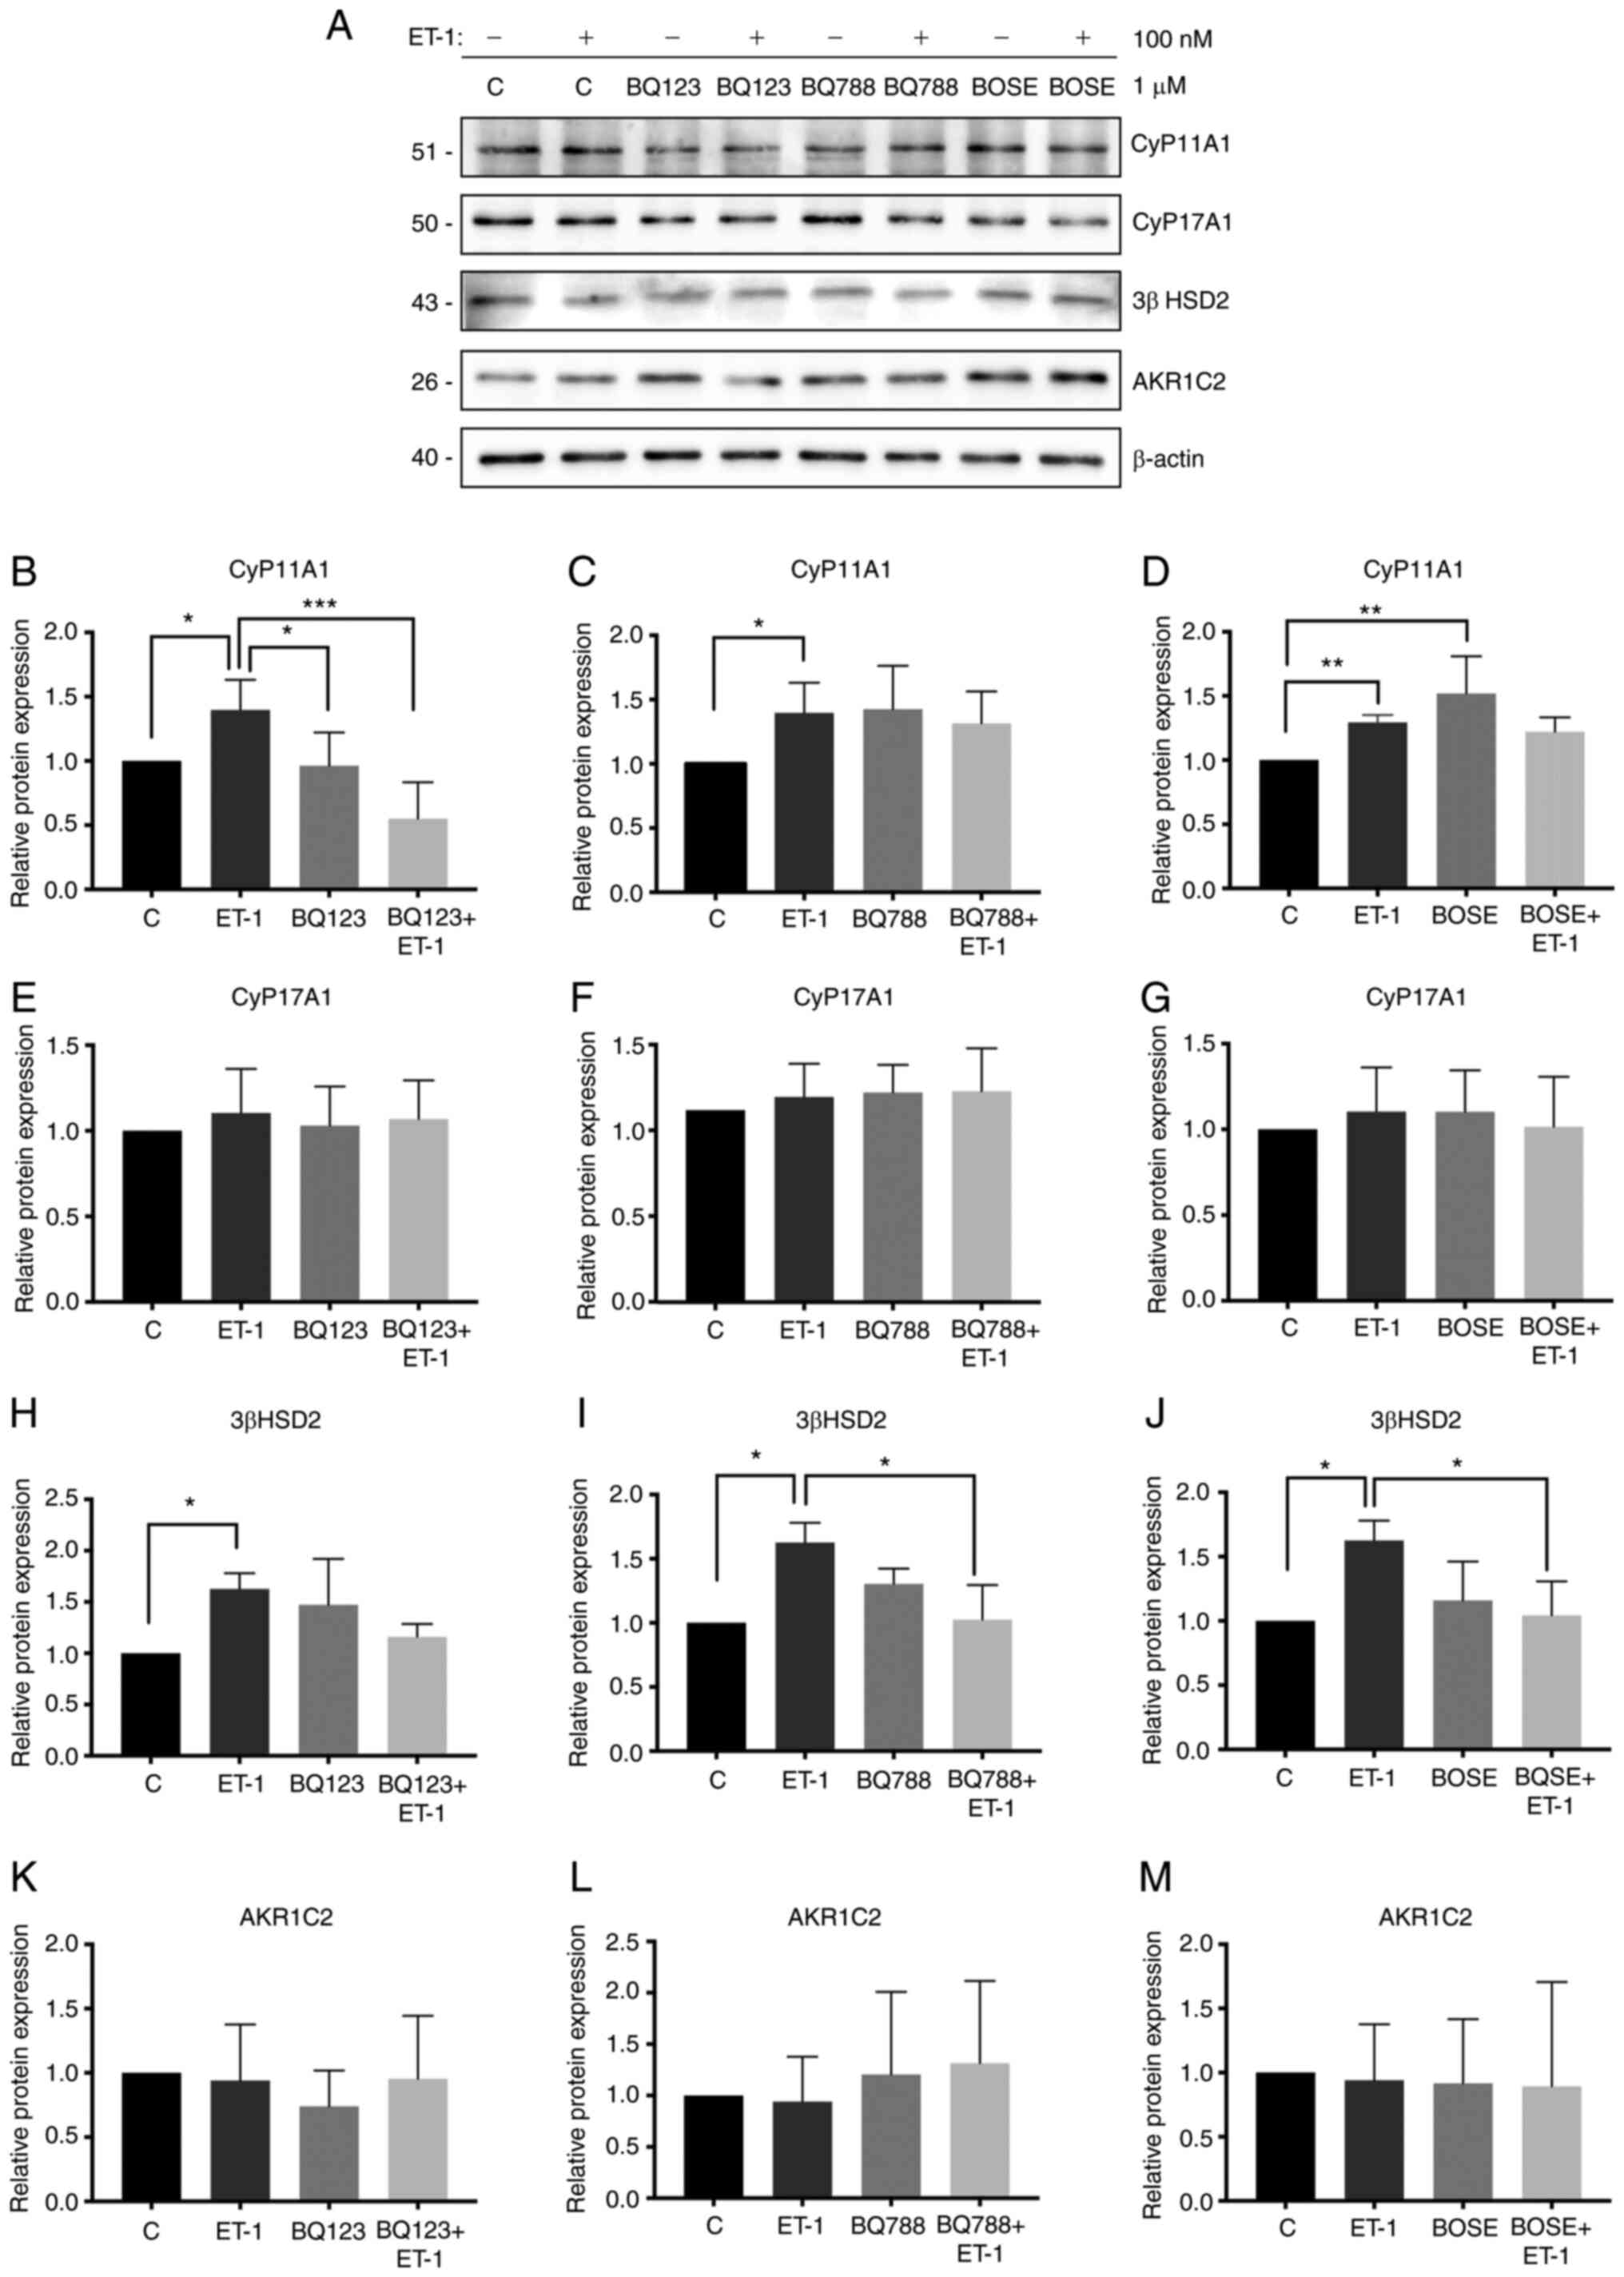 | Figure 4.Effect of ET-1 on the expression
levels of steroidogenic enzymes. (A) Lysed PC3 cells were analyzed
by western blotting and membranes were incubated with antibodies
against CyP11A1, CyP17A1, 3β HSD2, AKR1C2 and β-actin. (B) Protein
expression levels of CyP11A1 in the presence or absence of BQ123.
(C) Protein expression levels of CyP11A1 in the presence or absence
of BQ788. (D) Protein expression levels of CyP11A1 in the presence
or absence of BOSE. (E) Protein expression levels of CyP17A1 in the
presence or absence of BQ123. (F) Protein expression levels of
CyP17A1 in the presence or absence of BQ788. (G) Protein expression
levels of CyP17A1 in the presence or absence of BOSE. (H) Protein
expression levels of 3β HSD2 in the presence or absence of BQ123.
(I) Protein expression levels of 3β HSD2 in the presence or absence
of BQ788. (J) Protein expression levels of 3β HSD2 in the presence
or absence of BOSE. (K) Protein expression levels of AKR1C2 in the
presence or absence of BQ123. (L) Protein expression levels of
AKR1C2 in the presence or absence of BQ788. (M) Protein expression
levels of AKR1C2 in the presence or absence of BOSE. Quantification
was normalized to β-actin and control PC3 cells. Data are presented
as the mean ± SD (n=3 independent experiments). *P<0.05,
**P<0.01, ***P<0.001 (Kruskal Wallis test/Dunn's multiple
comparisons test). The values 51, 50, 43, 26 and 40 correspond to
mass units (kDa). ET-1, endothelin-1; BQ123,
2-[(3R,6R,9S,12R,15S)-6-(1H-indol-3-ylmethyl)-9-(2-methylpropyl)-2,5,8,11,14-pentaoxo-12-propan-2-yl-1,4,7,10,13-pentazabicyclo[13.3.0]octadecan-3-yl]
acetic acid; BQ788,
2,6-Dimethylpiperidinecarbonyl-γ-Methyl-Leu-Nin-(Methoxycarbonyl)-D-Trp-D-Nle,-N-[N-[N-[(2,6-Dimethyl-1-piperidinyl)carbonyl]-4-methyl-L-leucyl]-1-(methoxycarbonyl)-D-tryptophyl]-D-norleucine
sodium salt; BOSE, bosentan; CyP11A1, cytochrome P450 family 11
subfamily A member 1; CyP17A1, cytochrome P450 family 17 subfamily
A member 1; AKR1C2, aldo-keto reductase family member C2; 3β HSD2,
3β-hydroxysteroid dehydrogenase/isomerase 2. |
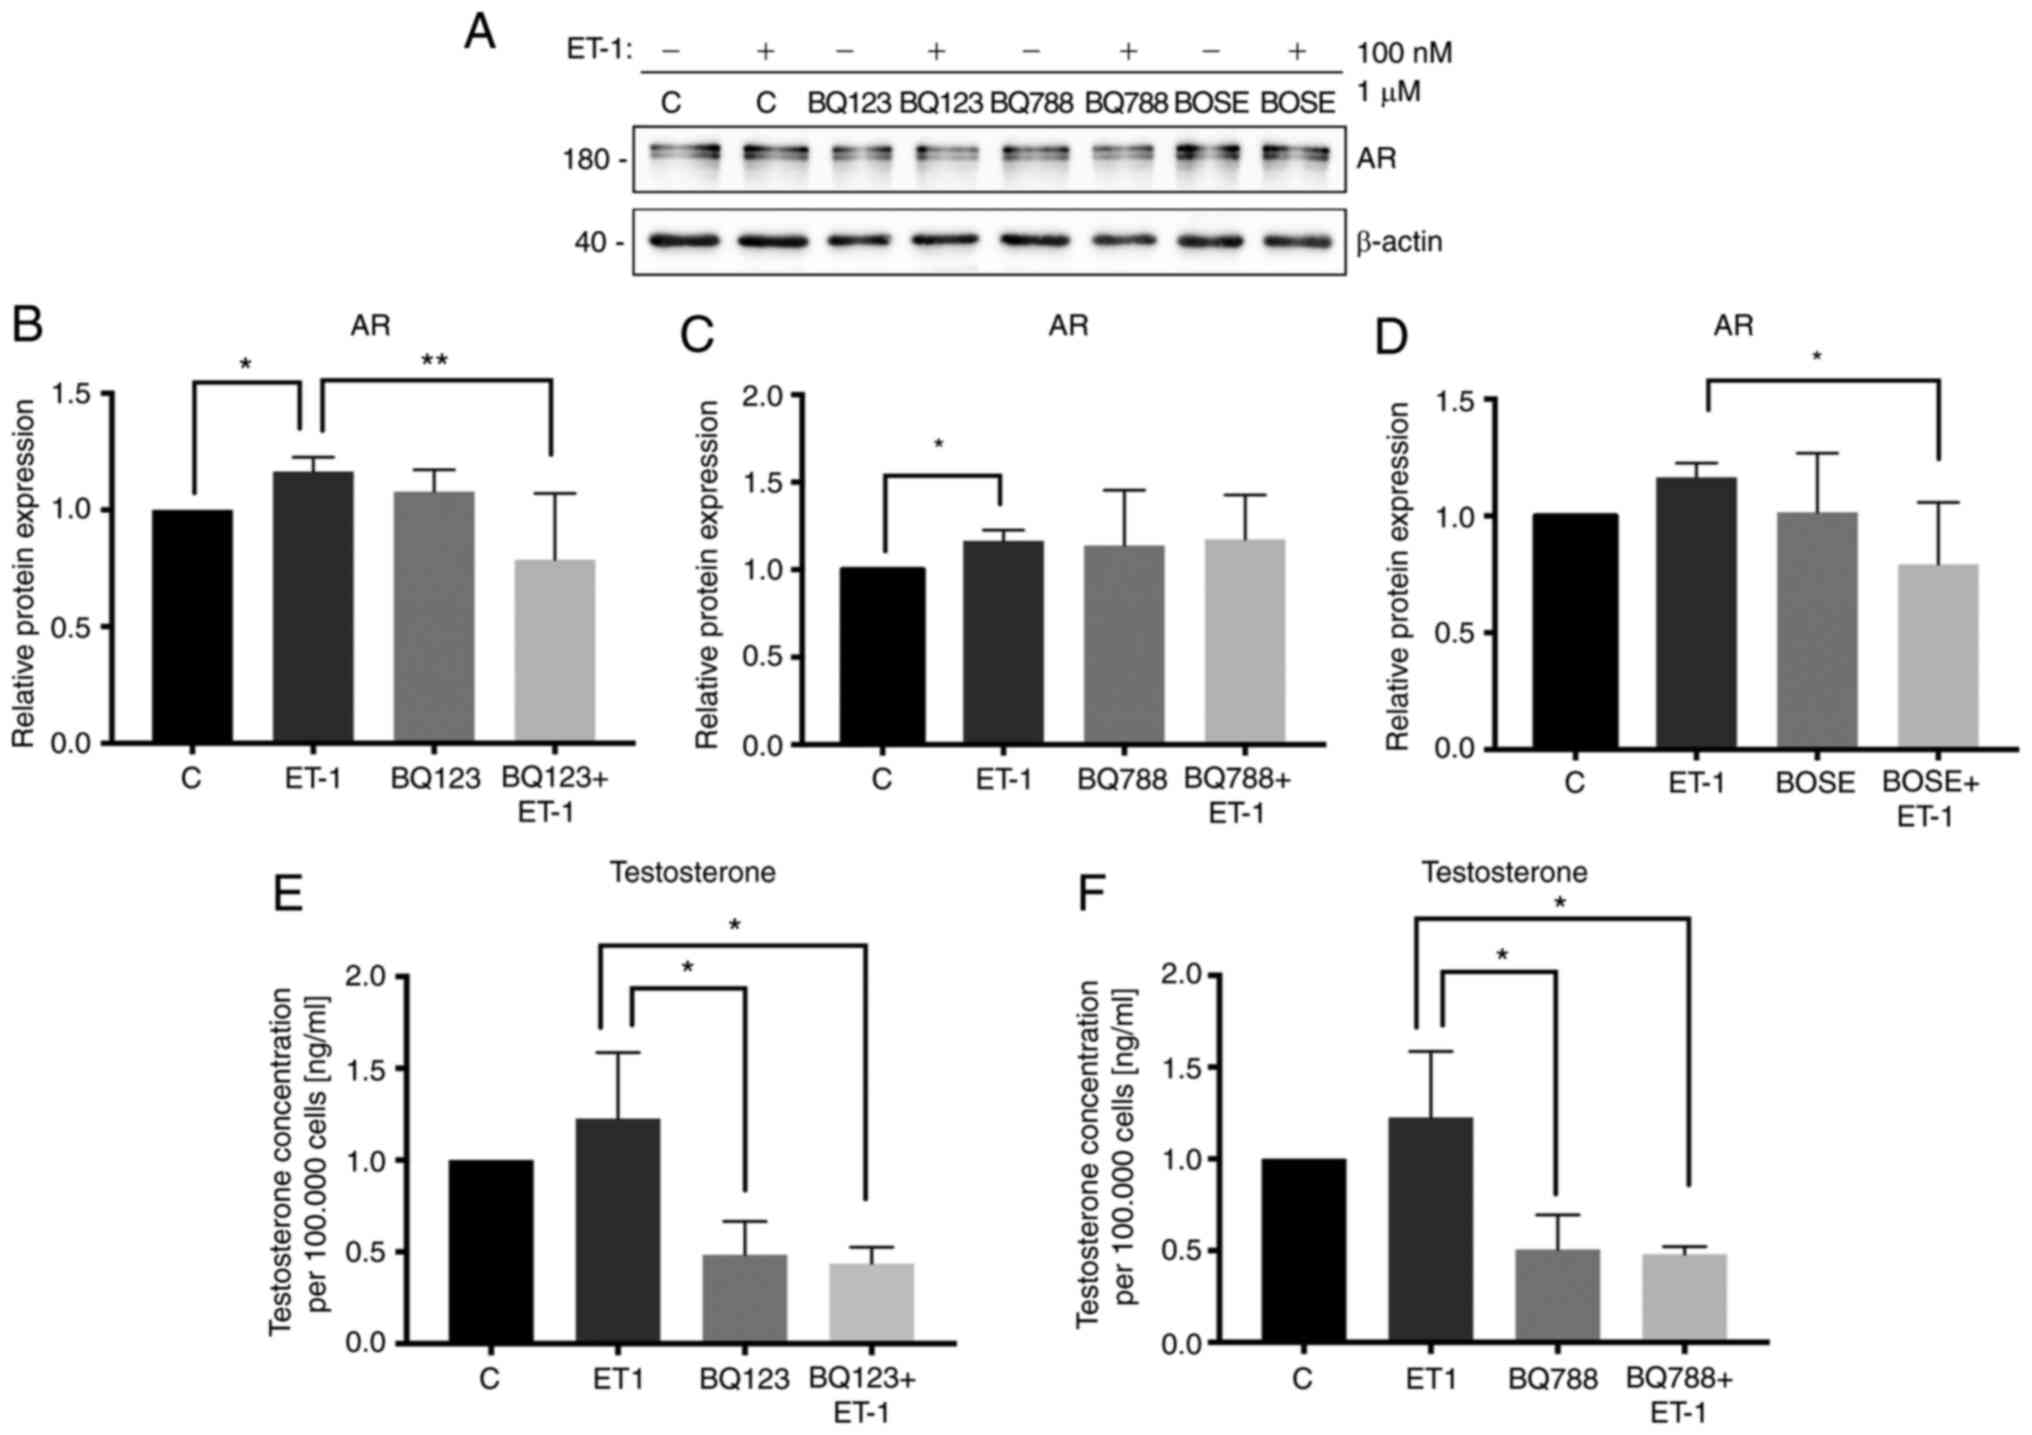 | Figure 5.Effect of ET-1 on expression levels
of AR and testosterone secretion. (A) Lysed PC3 cells were analyzed
by western blotting and membranes were incubated with antibodies
against AR and β-actin. (B) Protein expression levels of AR in the
presence or absence of BQ123. (C) Protein expression levels of AR
in the presence or absence of BQ788. (D) Protein expression levels
of AR in the presence or absence of BOSE. Quantification was
normalized to β-actin and control PC3 cells. The cells were
stimulated with 100 nM ET-1 and previously incubated with BQ123 or
BQ788 for 96 h. (E) Testosterone secretion in presence or absence
of BQ123. (F) Testosterone secretion in presence or absence of
BQ788. Data are presented as the mean ± SD (n=3 independent
experiments). *P<0.05, **P<0.01 (Kruskal Wallis test/Dunn's
multiple comparisons test). Quantification was normalized to
control PC3 cells. The values 180 and 40 correspond to mass units
(kDa). ET-1, endothelin-1; BQ123,
2-[(3R,6R,9S,12R,15S)-6-(1H-indol-3-ylmethyl)-9-(2-methylpropyl)-2,5,8,11,14-pentaoxo-12-propan-2-yl-1,4,7,10,13-pentazabicyclo[13.3.0]octadecan-3-yl]
acetic acid; BQ788,
2,6-Dimethylpiperidinecarbonyl-γ-Methyl-Leu-Nin-(Methoxycarbonyl)-D-Trp-D-Nle,-N-[N-[N-[(2,6-Dimethyl-1-piperidinyl)carbonyl]-4-methyl-L-leucyl]-1-(methoxycarbonyl)-D-tryptophyl]-D-norleucine
sodium salt; BOSE, bosentan; AR, androgen receptor. |
Effect of ET-1 on T secretion in PC3
cells
To determine if the increase in the expression
levels of steroidogenic enzymes was associated with the
steroidogenic process, T production was evaluated in PC3 cells.
Blocking of endothelin receptors was indicated to induce a decrease
in T concentration (ET-1/BQ123 + ET-1; Kruskal-Wallis test;
P<0.05; Fig. 5E; ET-1/BQ788 +
ET-1; Kruskal-Wallis test; P<0.05; Fig. 5F).
Discussion
ADT is the first-line treatment for patients with
localized and advanced PCa (4).
However, patients with PCa may develop resistance and this can lead
to CRPC (8,9). Upregulation of the expression levels of
androgen biosynthesis enzymes has been identified in tissues from
patients with CRPC (9). Additionally,
high plasma concentrations of ET-1 have been reported in patients
with CRPC (13–17). It has been previously proposed that
ET-1 may contribute to the transition from androgen-sensitive PCa
to CRPC (24). However, to the best
of our knowledge, the factors that may promote androgen resistance
are yet to be determined. In 2009, Lee et al (20) demonstrated that ET-1 increases c-myc
expression via ETAR, leading to increased AR expression
in PCa cells within androgen-free medium. Furthermore,
steroidogenic cell lines expressing endothelin receptor have been
previously indicated to increase basal T secretion following ET-1
stimulation (10,11).
The present study determined the expression levels
of ETAR and ETBR in PCa TMAs, including in
samples with different GSs (<7, 7 and >7). The results
demonstrated that low GS samples exhibited higher ETAR
expression compared with intermediate GS samples, indicating that
in primary tumors from patients without treatment, the expression
levels of ETAR were decreased and may be associated with
the progression of PCa. Upregulation of ETAR and ET-1
expression has been demonstrated in the early stages of PCa
(16) and higher expression levels of
ETAR and ET-1 are associated with advanced tumor stage
(25). Furthermore,
androgen-sensitive cells (LNCaP) cultured in androgen-deprived
medium for 5 months have been indicated to exhibit increased levels
of ETAR and ET-1 mRNA, suggesting that this axis may
serve an important role in the progression of PCa to CRPC (26). However, in the present study, no
variation of ETBR was observed in PCa samples with
different GSs. Previous immunohistochemical studies of prostate
adenocarcinoma tissue have revealed the decreased expression of
ETBR compared with ETAR levels (27,28).
In the present study, the expression levels of
ETAR, ETBR and ET-1 were also measured in PCa
cell lines, indicating that the androgen-insensitive cell line PC3
expressed the highest mRNA and protein levels of ETAR
and ET-1. LNCaP cells expressed higher levels of ETBR
compared with PC3 cells. ETBR is a receptor, which is
mainly expressed in prostatic epithelial cells and is associated
with the regulation of extracellular ET-1 via lysosomal degradation
(29). The present study indicated
that androgen-sensitive LNCaP cells expressed lower levels of ET-1
but higher levels of ETBR compared with PC3 cells, which
was in agreement with previous studies (17,30). These
results suggested that the ET-1 axis may serve a role in PCa
progression and may contribute to the development of androgen
resistance.
The activity of ETs is mediated by the activation of
ETAR and ETBR, which are Gq protein-coupled
receptors (15,17). Therefore, the present study revealed
an expected increase in intracellular calcium in ET-1-stimulated
PC3 cells. Accordingly, this effect was suppressed by preincubating
the cells with endothelin receptor antagonists (BQ123 and
Bosentan).
The ET-1 signaling pathway may be associated with
the transition to an androgen-insensitive stage in patients with
PCa (24). This can be hypothesized
as an increase in AR expression in LNCaP cells after 3 months of
androgen deprivation has been previously reported (20). However, the effect of ET-1 on
steroidogenesis in non-steroidogenic cells, such as PCa cells, is
yet to be determined. Therefore, the basal expression of
steroidogenic pathway enzymes in PCa cell lines was examined in the
present study.
Steroidogenesis is a physiological process, which
mainly occurs in the adrenal glands and gonads (31,32), and
different enzymes, including CyP11A1, CyP17A1, 3β HSD2,
17β-hydroxysteroid dehydrogenase type 3 and steroid 5 α-reductase
1, are involved in T production. Steroidogenesis can be acute or
chronically regulated depending on the tissue type, and both types
of regulation are controlled by different factors or hormones
(31,33). An increase in the expression levels of
enzymes that are involved in the synthesis of androgens, including
CyP11A1, CyP17A1 and 3β HSD1, has been demonstrated in samples from
patients with advanced PCa (9,34,35). Therefore, the effect of ET-1 on
CyP11A1, CyP17A1, AKR1C2, 3β HSD2 and AR was evaluated in the
present study. The results indicated that CyP11A1, 3β HSD2 and AR
protein expression increased with ET-1 treatment and this effect
was attenuated by a selective (BQ123) and non-selective antagonist
(Bosentan) of the endothelin receptor. Other enzymes of the
steroidogenic pathway could be tested, and this point could be
considered a limitation of the present study. However, the enzymes
evaluated in the present study are those showing significant
expression changes in tissues of patients with CRPC (9). In addition, endothelin receptor blockade
induces a decrease of T concentration in the culture medium of PC3
cells. In 2006, Alimirah et al (36), reported that both PC3 and DU145 cells
effectively express AR. Their study revealed that this receptor
does not have the same characteristics of normal AR and, depending
on the antibodies used, which bind to different regions of AR, it
is possible to find double bands in these cell lines (36). Some of the results regarding the
levels of the AR and T may be reproduced in DU145 cells (PCa cells
from brain metastasis), since they express ETAR (data
not shown) and AR and produce T (37). To the best of our knowledge, the
aforementioned results are the first to indicate that ET-1
regulates steroidogenesis via ETAR or ETBR in
PC3 cells. On the other hand, there are cell lines derived from
vertebral (VCaP) and lymphonodular (LAPC4) metastases of patients
with PCa refractory to hormone therapy; however, these cell lines
exhibit high levels of AR and androgen sensitivity (38). The objective of the present study was
to analyze the effect of ET-1 in an androgen-insensitive cell line
(PC3), in which high expression levels of ETAR were
observed.
The results of the present study indicated that ET-1
may serve an important role in the production of T in PCa cells via
the canonical pathway as the main pathway for T synthesis in PCa.
Changes in the protein expression levels of steroidogenic enzymes
may be induced by ET-1 or ETAR via two potential
mechanisms: A cyclic AMP (cAMP)/protein kinase A (PKA)-dependent
signaling pathway or a cAMP-independent signaling pathway with
protein kinase C involvement. These signaling pathways may allow
phosphorylation of transcriptional factors (steroidogenic factor 1,
GATA binding protein 4 or cAMP responsive element binding protein),
which are associated with the transcription of encoding genes for
steroidogenic enzymes (31,39,40).
However, cAMP/PKA signaling has been indicated to be the main
regulatory mechanism for steroidogenesis, since the
cAMP-independent pathways are usually associated with the
modulation or enhancement of the biosynthetic process, acting
synergistically with PKA (31,33).
These findings suggested that ET-1, via the
activation of its receptors, may be actively associated with T
production in PCa. This mechanism may contribute to the progression
of PCa to CRPC, which indicated that ET-1 and its receptors may be
potential therapeutic targets that can be used in the treatment of
advanced PCa.
Supplementary Material
Supporting Data
Acknowledgements
The authors would like to thank Ms. Graciela Caroca
(Department of Basic and Clinical Oncology, Faculty of Medicine,
University of Chile, Santiago 8380453, Chile) for their excellent
technical assistance.
Funding
The present study was supported by the following
grants: FONDECYT grant nos. 1151214, 1140417, 1201704, 1160889 and
1190406. URedes grant no. URC-007/17, University of Chile grant
nos. ENL22/19 and ENL23/19, and scholarships from the National
Research and Development Agency (ANID) 21160703 and 21160886.
Availability of data and materials
The datasets used and/or analyzed during the
current study are available from the corresponding author on
reasonable request.
Authors' contributions
MJT performed the experimental design, experiments
and statistical analysis, and wrote the manuscript. FLM
participated in the design of testosterone measurement and drafted
the manuscript. DH helped with the experimental design and writing
of the manuscript. SI designed and helped in the
immunohistochemical assays. AL assisted in the performance of some
reverse transcription-quantitative PCR experiments of enzymes of
the steroidogenic pathway. PL participated in intracellular calcium
measurement design. EAC participated in the experimental design and
helped to draft the manuscript. JT helped with the experimental
design. HRC designed the general study and assisted in the writing
of the manuscript. HRC and EAC confirm the authenticity of all the
raw data. All authors read and approved the final manuscript.
Ethics approval and consent to
participate
All protocols for tissue collection, use and
processing have been approved by the institutional Ethical
Committee of Faculty of Medicine, University of Chile (approvals
nos. 135-2015 and 083-2020; Authorization for biopsy archive use of
the Department of Pathology, University of Chile, 03012016,
Santiago, Chile).
Patient consent for publication
Not applicable.
Competing interests
The authors declare that they have no competing
interests.
References
|
1
|
Bray F, Ferlay J, Soerjomataram I, Siegel
RL, Torre LA and Jemal A: Global cancer statistics 2018: GLOBOCAN
estimates of incidence and mortality worldwide for 36 cancers in
185 countries. CA Cancer J Clin. 68:394–424. 2018. View Article : Google Scholar : PubMed/NCBI
|
|
2
|
Shah RB and Zhou M: Recent advances in
prostate cancer pathology: Gleason grading and beyond. Pathol Int.
66:260–272. 2016. View Article : Google Scholar : PubMed/NCBI
|
|
3
|
Shariat SF and Roehrborn CG: Using biopsy
to detect prostate cancer. Rev Urol. 10:262–280. 2008.PubMed/NCBI
|
|
4
|
Perlmutter MD and Lepor M: Androgen
deprivation therapy in the treatment of advanced prostate cancer.
Rev Urol. 9 (Suppl 1):S3–S8. 2007.PubMed/NCBI
|
|
5
|
Kaarbø M, Klokk TI and Saatcioglu F:
Androgen signaling and its interactions with other signaling
pathways in prostate cancer. Bioessays. 29:1227–1238. 2007.
View Article : Google Scholar
|
|
6
|
Anantharaman A and Friedlander TW:
Targeting the androgen receptor in metastatic castrate-resistant
prostate cancer: A review. Urol Oncol. 34:356–367. 2016. View Article : Google Scholar : PubMed/NCBI
|
|
7
|
Lonergan PE and Tindall DJ: Androgen
receptor signaling in prostate cancer development and progression.
J Carcinog. 10:202011. View Article : Google Scholar : PubMed/NCBI
|
|
8
|
Shore ND, Abrahamsson PA, Anderson J,
Crawford ED and Lange P: New considerations for ADT in advanced
prostate cancer and the emerging role of GnRH antagonists. Prostate
Cancer Prostatic Dis. 16:7–15. 2012. View Article : Google Scholar : PubMed/NCBI
|
|
9
|
Armandari I, Hamid AR, Verhaegh G and
Schalken J: Intratumoral steroidogenesis in castration-resistant
prostate cancer : A target for therapy. Prostate Int. 2:105–113.
2014. View Article : Google Scholar : PubMed/NCBI
|
|
10
|
Conte D, Questino P, Fillo S, Nordio M,
Isidori A and Romanelli F: Endothelin stimulates testosterone
secretion by rat leydig cells. J Endocrinol. 136:R1–R4. 1993.
View Article : Google Scholar : PubMed/NCBI
|
|
11
|
Stojilkovic SS: Endothelin receptors and
gonadal function: An invited commentary. Eur J Endocrinol.
135:391–393. 1996. View Article : Google Scholar : PubMed/NCBI
|
|
12
|
Ergün S, Harneit S, Paust HJ, Mukhopadhyay
AK and Holstein AF: Endothelin and endothelin receptors A and B in
the human testis. Anat Embryol (Berl). 199:207–214. 1999.
View Article : Google Scholar
|
|
13
|
Kopetz ES, Nelson JB and Carducci MA:
Endothelin-1 as a target for therapeutic intervention in prostate
cancer. Invest New Drugs. 20:173–182. 2002. View Article : Google Scholar : PubMed/NCBI
|
|
14
|
Grant K, Loizidou M and Taylor I:
Endothelin-1: A multifunctional molecule in cancer. Br J Cancer.
88:163–166. 2003. View Article : Google Scholar : PubMed/NCBI
|
|
15
|
Zonnenberg BA and Voest EE: The role of
endothelin in hormone-refractory prostate cancer. Eur Urol. (Suppl
2):9–14. 2003. View Article : Google Scholar
|
|
16
|
Montironi R, Mazzucchelli R, Barbisan F,
Stramazzotti D, Santinelli A, Lòpez Beltran A, Cheng L, Montorsi F
and Scarpelli M: Immunohistochemical expression of Endothelin-1 and
Endothelin-A and Endothelin-B receptors in high-grade prostatic
intraepithelial neoplasia and prostate cancer. Eur Urol.
52:1682–1690. 2007. View Article : Google Scholar : PubMed/NCBI
|
|
17
|
Niko B: Involvement of ion channels in
Endothelin-1-induced signalling in human prostate cancer cells. J
Clin Toxicol. 02:1–13. 2012.
|
|
18
|
Russell FD and Davenport AP: Secretory
pathways in endothelin synthesis. Br J Pharmacol. 126:391–398.
1999. View Article : Google Scholar : PubMed/NCBI
|
|
19
|
Barton M and Yanagisawa M: Endothelin: 20
years from discovery to therapy. Can J Physiol Pharmacol.
86:485–498. 2008. View Article : Google Scholar : PubMed/NCBI
|
|
20
|
Lee JG, Zheng R, McCafferty-Cepero JM,
Burnstein KL, Nanus DM and Shen R: Endothelin-1 enhances the
expression of the androgen receptor via activation of the c-myc
pathway in prostate cancer cells. Mol Carcinog. 48:141–149. 2009.
View Article : Google Scholar : PubMed/NCBI
|
|
21
|
Gleason DF: Histologic grading of prostate
cancer: A perspective. Hum Pathol. 23:273–279. 1992. View Article : Google Scholar : PubMed/NCBI
|
|
22
|
Baidoo E and Kontoh AK: Implementation of
gray level image transformation techniques. Int J Mod Educ Comput
Sci. 10:44–53. 2018. View Article : Google Scholar
|
|
23
|
Livak KJ and Schmittgen TD: Analysis of
relative gene expression data using real-time quantitative PCR and
the 2(-Delta Delta C(T)) method. Methods. 25:402–408. 2001.
View Article : Google Scholar : PubMed/NCBI
|
|
24
|
Whyteside AR, Hinsley EE, Lambert LA,
McDermott PJ and Turner AJ: ECE-1 influences prostate cancer cell
invasion via ET-1-mediated FAK phosphorylation and ET-1-independent
mechanisms. Can J Physiol Pharmacol. 88:850–854. 2010. View Article : Google Scholar : PubMed/NCBI
|
|
25
|
Papanikolaou S, Bravou V, Papadaki H and
Gyftopoulos K: The role of the endothelin axis in promoting
epithelial to mesenchymal transition and lymph node metastasis in
prostate adenocarcinoma. Urol Ann. 9:372–379. 2017. View Article : Google Scholar : PubMed/NCBI
|
|
26
|
D'Antonio JM, Ma C, Monzon FA and Pflug
BR: Longitudinal analysis of androgen deprivation of prostate
cancer cells identifies pathways to androgen independence.
Prostate. 68:698–714. 2008. View Article : Google Scholar
|
|
27
|
Godara G, Pecher S, Jukic DM, D'Antonio
JM, Akhavan A, Nelson JB and Pflug BR: Distinct patterns of
endothelin axis expression in primary prostate cancer. Urology.
70:209–215. 2007. View Article : Google Scholar : PubMed/NCBI
|
|
28
|
Gohji K, Kitazawa S, Tamada H, Katsuoka Y
and Nakajima M: Expression of endothelin receptor a associated with
prostate cancer progression. J Urol. 165:1033–1036. 2001.
View Article : Google Scholar : PubMed/NCBI
|
|
29
|
Nelson JB and Carducci MA: The role of
endothelin-1 and endothelin receptor antagonists in prostate
cancer. BJU Int. 85 (Suppl 2):S45–S48. 2000. View Article : Google Scholar : PubMed/NCBI
|
|
30
|
Liu J and Liu X: Knockdown of ET-1 gene
can inhibit the proliferation, invasion of human prostate cancer
cell. Biomed Res. 28:3377–3382. 2017.PubMed/NCBI
|
|
31
|
Miller WL: Steroidogenic enzymes. Endocr
Dev. 13:1–18. 2008. View Article : Google Scholar : PubMed/NCBI
|
|
32
|
Yazawa T, Imamichi Y, Sekiguchi T,
Miyamoto K, Uwada J, Khan MRI, Suzuki N, Umezawa A and Taniguchi T:
Transcriptional regulation of ovarian steroidogenic genes: Recent
findings obtained from stem cell-derived steroidogenic cells.
Biomed Res Int. 2019:89730762019. View Article : Google Scholar : PubMed/NCBI
|
|
33
|
Stocco DM, Wang XJ, Jo Y and Manna PR:
Multiple signaling pathways regulating steroidogenesis and
steroidogenic acute regulatory protein expression: More complicated
than we thought. Mol Endocrinol. 19:2647–2659. 2005. View Article : Google Scholar : PubMed/NCBI
|
|
34
|
Bennett NC, Hooper JD, Lambie D, Lee CS,
Yang T, Vesey DA, Samaratunga H, Johnson DW and Gobe GC: Evidence
for steroidogenic potential in human prostate cell lines and
tissues. Am J Pathol. 181:1078–1087. 2012. View Article : Google Scholar : PubMed/NCBI
|
|
35
|
Mostaghel EA, Solomon KR, Pelton K,
Freeman MR and Montgomery RB: Impact of circulating cholesterol
levels on growth and intratumoral androgen concentration of
prostate tumors. PLoS One. 7:e300622012. View Article : Google Scholar : PubMed/NCBI
|
|
36
|
Alimirah F, Chen J, Basrawala Z, Xin H and
Choubey D: DU-145 and PC-3 human prostate cancer cell lines express
androgen receptor: Implications for the androgen receptor functions
and regulation. FEBS Lett. 580:2294–2300. 2006. View Article : Google Scholar : PubMed/NCBI
|
|
37
|
Herrera D, Orellana-Serradell O, Villar P,
Torres MJ, Paciucci R, Castellón EA and Contreras HR: Silencing of
the transcriptional factor ZEB1 alters the steroidogenic pathway,
and increases the concentration of testosterone and DHT in DU145
cells. Oncol Rep. 41:1275–1283. 2019.PubMed/NCBI
|
|
38
|
van Bokhoven A, Varella-Garcia M, Korch C,
Johannes WU, Smith EE, Miller HL, Nordeen SK, Miller GJ and Lucia
MS: Molecular characterization of human prostate carcinoma cell
lines. Prostate. 57:205–225. 2003. View Article : Google Scholar : PubMed/NCBI
|
|
39
|
Ruggiero C and Lalli E: Impact of ACTH
signaling on transcriptional regulation of steroidogenic genes.
Front Endocrinol (Lausanne). 7:242016. View Article : Google Scholar : PubMed/NCBI
|
|
40
|
Bremer AA and Miller WL: Regulation of
steroidogenesis. Cell Endocrinol Heal Dis. 207–227. 2014.
View Article : Google Scholar
|