Introduction
Thyroid cancer accounts for approximately 1% of all
human malignancies and 90% of endocrine malignancies (1). Papillary thyroid cancer (PTC) is the
most common pathological type and accounts for approximately 70–80%
of all thyroid cancers (2–5). Most PTCs can be treated with thyroid
surgery alone or combined with radioactive iodine therapy. Although
numerous genetic changes have been revealed in thyroid cancer, the
molecular mechanism of PTC progression has not been fully studied.
Therefore, further study of the mechanism by which PTC occurs and
develops is urgently needed.
Centrosomes are the microtubule-organizing centers
of animal cells that ensure normal behavior of chromosomes during
mitosis, so their number must be precisely controlled (6). The mutant products of some
protooncogenes and tumor suppressor genes can directly affect the
functional and structural integrity of centrosomes (7,8). Previous
studies have revealed that centrosomal aberrancies promote
tumorigenesis, indicating that centrosome amplification is closely
related to the development of cancer (9,10). In
addition, centrosome amplification is suspected to represent an
early event of tumorigenesis (11).
Research has confirmed that centrosomal aberrancies are prevalent
in breast (12,13), colon (6), bladder (14), pancreatic (15), prostate (16) as well as other cancer cell lines.
Some studies have reported that the number of
centrioles is strictly regulated by centrosomal protein 63 (Cep63),
Cep152, Cep131 and polo-like kinase 4 (Plk4) through the ubiquitin
(Ub)-proteasome protein degradation system (6,17,18). As the precursor of centrosomes, Cep63
is located on chromosome 3q22.2 and encodes a 63-kDa protein with
six coiled-coil domains; it is known for its ability to bind Cep152
to form the annular structural base of the centrosome (19). A previous study (20) revealed that Cep63 is involved in
spindle assembly and DNA damage after spindle inactivation, binding
to centrosomes and regulating mitosis, and additionally causes
chromosomal instability and aberrations that lead to poor prognosis
and potentially cancer-related overexpression. Cep63 has been
revealed to promote the development and evolution of tumors
(21); however, the relationship
between Cep63 and PTC development remains unclarified. In the
present study, Cep63 was knocked out via CRISPR/Cas9 technology to
clarify its influence on TPC-1 cell behavior. The effects of Cep63
on the Janus kinase/signal transducer and activator of
transcription 3 (JAK/STAT3) signaling pathway in TPC-1 cells was
further investigated.
Materials and methods
Patient tissue samples
To study the clinicopathological function of Cep63
in PTC, a total of 140 patients were recruited from the Department
of Thyroid Surgery of the First Affiliated Hospital of Zhengzhou
University (Zhengzhou, China) from November 2019 to March 2020 and
participated in the trial. Inclusion criteria were patients with
pathologically confirmed PTC, and exclusion criteria were patients
with confirmed PTC who had received other treatments prior to
surgery. There were 39 males and 101 females. The mean age of these
patients was 51.89±0.7850 years (n=140). All participating patients
were informed about the study and signed informed consent forms.
The present study was also approved (approval no. 2019-KY-313) by
the Ethics Committee for Scientific Research and Clinical Trial of
the First Affiliated Hospital of Zhengzhou University and conducted
in accordance with The Declaration of Helsinki Principles (version
2013). A total of 140 tumor tissues and 140 paired normal thyroid
tissues were collected and stored in a refrigerator at −80°C
immediately after being obtained from patients with confirmed PTC
undergoing thyroid surgery at The First Affiliated Hospital of
Zhengzhou University.
Cell line and cell culture
The human PTC cell line TPC-1 was kindly provided by
Dr Ye Lei of Shanghai Ruijin Hospital (Shanghai, China). To provide
an experimental basis for studying the functions of Cep63, the
CRISPR/Cas9 technique (Shanghai GeneChem Co., Ltd.) was used to
construct a stable Cep63 knockout TPC-1 cell line. Cas-Designer, a
web-based tool for choice of CRISPR-Cas9 target sites (http://www.rgenome.net/cas-designer/),
was used to design the CEP63-sgRNA sequence. CEP63-sgRNA is located
in the third exon of the CEP63 gene. The sequence of the
CEP63-sgRNA was as follows: AGCTTCAGAAAAAGCAAATG. The transfected
Cas9 plasmid, CEP63-sgRNA, is a custom-made product commissioned by
Shanghai GeneChem Co., Ltd. There were two mutant genotypes in
CEP63 allele with deletion of DNA level at the target action site.
The corresponding deletion sequences were AATTCCCTCATTTG and AT.
Cells were maintained in RPMI-1640 culture medium (Beijing Solarbio
Science & Technology Co., Ltd.) supplemented with 10% fetal
bovine serum (FBS; Gemini Bio-Products, Inc.) and incubated at 37°C
in a humidified atmosphere containing 5% CO2. In the
experiments with inhibitor interference, cells in the experimental
group were cultured at 37°C in complete medium containing 10 nmol/l
LY2784544 (GlpBio Technology, Inc.), while the culture medium of
cells in the control group contained an equal concentration of
dimethyl sulfoxide (DMSO).
Colony formation assay
TPC-1 cells were digested and plated in the culture
dish at a concentration of 400 cells/well. The cells were divided
into the TPC-1 group and the Cep63-KO group, with 3 replicates in
each group. The cells were thoroughly mixed and incubated at 37°C,
and the medium was replaced with fresh medium every 2 days. When
the cultured cells had formed visible cell colonies (>50
cells/colony), the cells were fixed with 4% paraformaldehyde for 20
min at room temperature, and stained with 0.2% crystal violet for
30 min at room temperature. Cell counting was performed using a
light microscope at a magnification of ×4 and IBM SPSS 21.0 was
used for statistical analysis.
Cell Counting Kit-8 (CCK-8) assay
Suspensions of digested cells in the logarithmic
growth phase were uniformly inoculated into 96-well plates at a
density of 1×10⁴ cells/ml, and 100 µl of the suspension
was added to each well to establish 3 replicate wells. After the
cells were completely attached to the bottom of the wells, 10 µl of
CCK-8 detection reagent (Dojindo Molecular Technologies, Inc.) was
added to each well. The culture plate was placed at 37°C and
incubated for 2 h. Then, the culture plate was placed in a
Universal Microplate Reader and the absorbance was measured at 450
nm.
Cell cycle analysis and apoptosis
assay
The following protocol was followed for cell cycle
analysis: Logarithmic growth phase cells were seeded in a culture
flask. The cells were harvested by digestion with a trypsin
solution containing 0.25% EDTA. The cell concentration was adjusted
to 1×10⁶ cells/ml. One ml of the cell suspension was
centrifuged at 100 × g for 3 min at room temperature; the upper
layer of medium was removed, and cell suspension was fixed in 500
µl cold 70% ethanol at 4°C overnight. Then, the cells were washed
with PBS to remove the fixation solution. The prepared 500 µl
PI/RNase A staining solution (Nanjing KeyGen Biotech Co., Ltd.) was
added to the cells, which were incubated in the dark for 30 min at
room temperature and then detected by flow cytometry (model: XL-MCL
ADC; Beckman Coulter, Inc.). The following protocol was followed
for the apoptosis assay: The cells were digested with trypsin
without EDTA and counted at approximately 2×10⁵
cells/ml. Next, subsequent staining was performed with the same
volume of Annexin V-FITC and propidium iodide (PI) for 15 min at
room temperature. The procedures were performed with an Annexin
V-FITC Apoptosis Detection Kit (cat. no. KGA105-KGA108; Nanjing
KeyGen Biotech Co., Ltd.) in accordance with the kit instructions.
GraphPad Prism 6.0 (GraphPad Prism Software, Inc.) was used for
analysis.
Transwell invasion assay
The Transwell assay was performed with 24-well
culture plates and the matching Transwell upper chamber inserts (8
µm pore size; Corning Inc.). Matrigel matrix (BD Biosciences) was
prediluted in serum-free RPMI-1640 medium and evenly spread in the
upper chamber at 37°C for 4 h; the plates were then incubated in
the incubator at 37°C for 6 h. A total of 2×10⁴ cells
was mixed into 200 µl of serum-free RPMI-1640 medium and inoculated
into the upper chambers, and 600 µl of RPMI-1640 medium
supplemented with 10% FBS was added to the lower chambers. The
Transwell inserts were fixed with 4% paraformaldehyde for 15 min
and stained with 0.1% crystal violet for 30 min at room
temperature. Finally, the migrated cells were counted using a
fluorescence inverted microscope (Olympus Corporation) at a
magnification of ×200.
Wound healing assay
Cells were uniformly inoculated in a 6-well plate at
a concentration of 5×10⁵ cells/well. When the cells were
cultured to >95% confluence, sterile tips were used to create a
scratch in each well. Next, the suspended cell fragments were
removed by washing with sterile PBS, and the cells were cultured in
serum-free RPMI-1640 medium at 37°C for 24 h. Then, images of the
healing of the cell scratches at the same position in each well
were captured using a light inverted microscope (Olympus
Corporation) at a magnification of ×10. The area of the wound was
assessed by ImageJ 1.42q software (National Institutes of Health),
and the ratio of the area covered by the cells after migration to
the area of the wound at the beginning of the experiment was
calculated to compare the migration ability of the cells.
Reverse transcription-quantitative
(RT-q)PCR analysis
Total RNA was isolated from TPC-1 cells and nude
mouse tissues with TRIzol reagent (Invitrogen; Thermo Fisher
Scientific, Inc.) following the manufacturer's instructions. Total
RNA was reversely transcribed to cDNA with a RevertAid First Strand
cDNA Synthesis Kit (Takara Bio, Inc.) according to the
manufacturer's protocol. Each reaction for quantitative analysis
was performed according to the instructions for SYBR®
Green Fast qPCR Mix (Wuhan Servicebio Technology Co., Ltd.). The
PCR cycles were performed as follows: One cycle at 95°C for 10 min,
40 cycles at 95°C for 15 sec, 60°C for 60 sec, and one final cycle
at 72°C for 10 min, followed by cooling to 4°C. β-actin was used as
the reference standard for each cDNA sample. The primer sequences
were as follows: β-actin forward, 5′-CACCCAGCACAATGAAGATCAAGAT-3′
and reverse, 5′-CCAGTTTTTAAATCCTGAGTCAAGC-3′; and Cep63 forward,
5′-AGGAAGGCTCTGGCTGAACAAT-3′ and reverse,
5′-GTCATTAGCCCGCTCCAGTTT-3′. The mRNA expression levels were
calculated as relative fold changes based on the 2−ΔΔCq
method (22).
Western blotting
The TPC-1 cells were lysed in RIPA lysis buffer
(Leagene, China). Protein concentration was determined by the BCA
assay. Each lane was loaded with 10 µl protein. Protein from each
sample was isolated by 10% SDS-PAGE (Leagene Biotech Co., Ltd.) and
transferred to a PVDF membrane (EMD Millipore), followed by
blocking in 5% milk for 2 h at room temperature. The membrane was
incubated with the primary antibodies Cep63 (1:2,000; product code
ab235513; Abcam), JAK2 (1:5,000; product code ab108596; Abcam),
p-JAK (1:2,000; product code ab32101; Abcam), STAT3 (1:1,000;
product no. 9139T; Cell Signaling Technology, Inc.), p-STAT3
(1:2,000; product no. 9145T; Cell Signaling Technology, Inc.) and
actin (1:1,000; cat. no. GB12001; Wuhan Servicebio Technology Co.,
Ltd.) overnight at 4°C and washed 3 times with TBS containing 0.1%
Tween-20 (Leagene Biotech Co., Ltd.) at room temperature. Then, the
membrane was incubated with an HRP-conjugated IgG secondary
antibody (cat. nos. SA00001-2 and SA00001-1; ProteinTech Group,
Inc.) for 1 h at room temperature and visualized with an ECL
detection kit (Thermo Fisher Scientific, Inc.). The protein
expression levels were assessed by band densities using
AlphaEaseFC™ 4.0 (ProteinSimple) software.
In vivo tumorigenicity assay in nude
mice
A total of 20 female BALB/c nude mice (4 weeks old;
~16–18 g) purchased from Beijing Vital River Laboratory Animal
Technology Co., Ltd. were used to establish the animal model of
subcutaneous neoplasia. Based on animal welfare considerations, the
mice were housed in specific pathogen-free housing at 27°C with a
humidity of 50% and a 14/10-h light/night cycle. Food and water
were continuously provided throughout the day at Henan Key
Laboratory for Pharmacology of Liver Diseases. Each mouse was
subcutaneously inoculated in the right flank in a total volume of
200 µl resuspension solution at a density of 1×10⁷
cells/ml. The mice were weighed and their health and behaviour were
observed once a day. They were sacrificed by cervical dislocation
after CO2 anesthesia (flow rate of CO2:
16.67% volume displacement/min) when body weight loss >2 g or
the maximum diameter of the tumor was over 20 mm. None of the mice
had any other special conditions or other causes of death during
the study. Finally, the tumor growth and inhibition rates were
calculated. The animal trials lasted a total of two weeks. The
present study was approved (approval no. 2019-KY-313) by the Ethics
Committee for Scientific Research and Clinical Trial of the First
Affiliated Hospital of Zhengzhou University (Zhengzhou, China).
Statistical analysis
GraphPad Prism 6.0 (GraphPad Prism software, Inc.,
USA) was used for analysis. Data comparisons between two groups
were performed with unpaired Student's t-test, comparisons between
tumor and adjacent non-tumor tissues were performed with paired
t-test. Comparisons among multigroups were performed with one-way
analysis of variance (ANOVA), and then Bonferroni test was applied
as a post hoc test. The results are presented as the means ±
standard deviations (SDs). The association between the Cep63
expression level and potential pathological factors was assessed
with the chi-square test. P<0.05 was considered to indicate a
statistically significant difference. The experiments were repeated
in triplicate.
Results
Cep63 is highly expressed in PTC
tissues
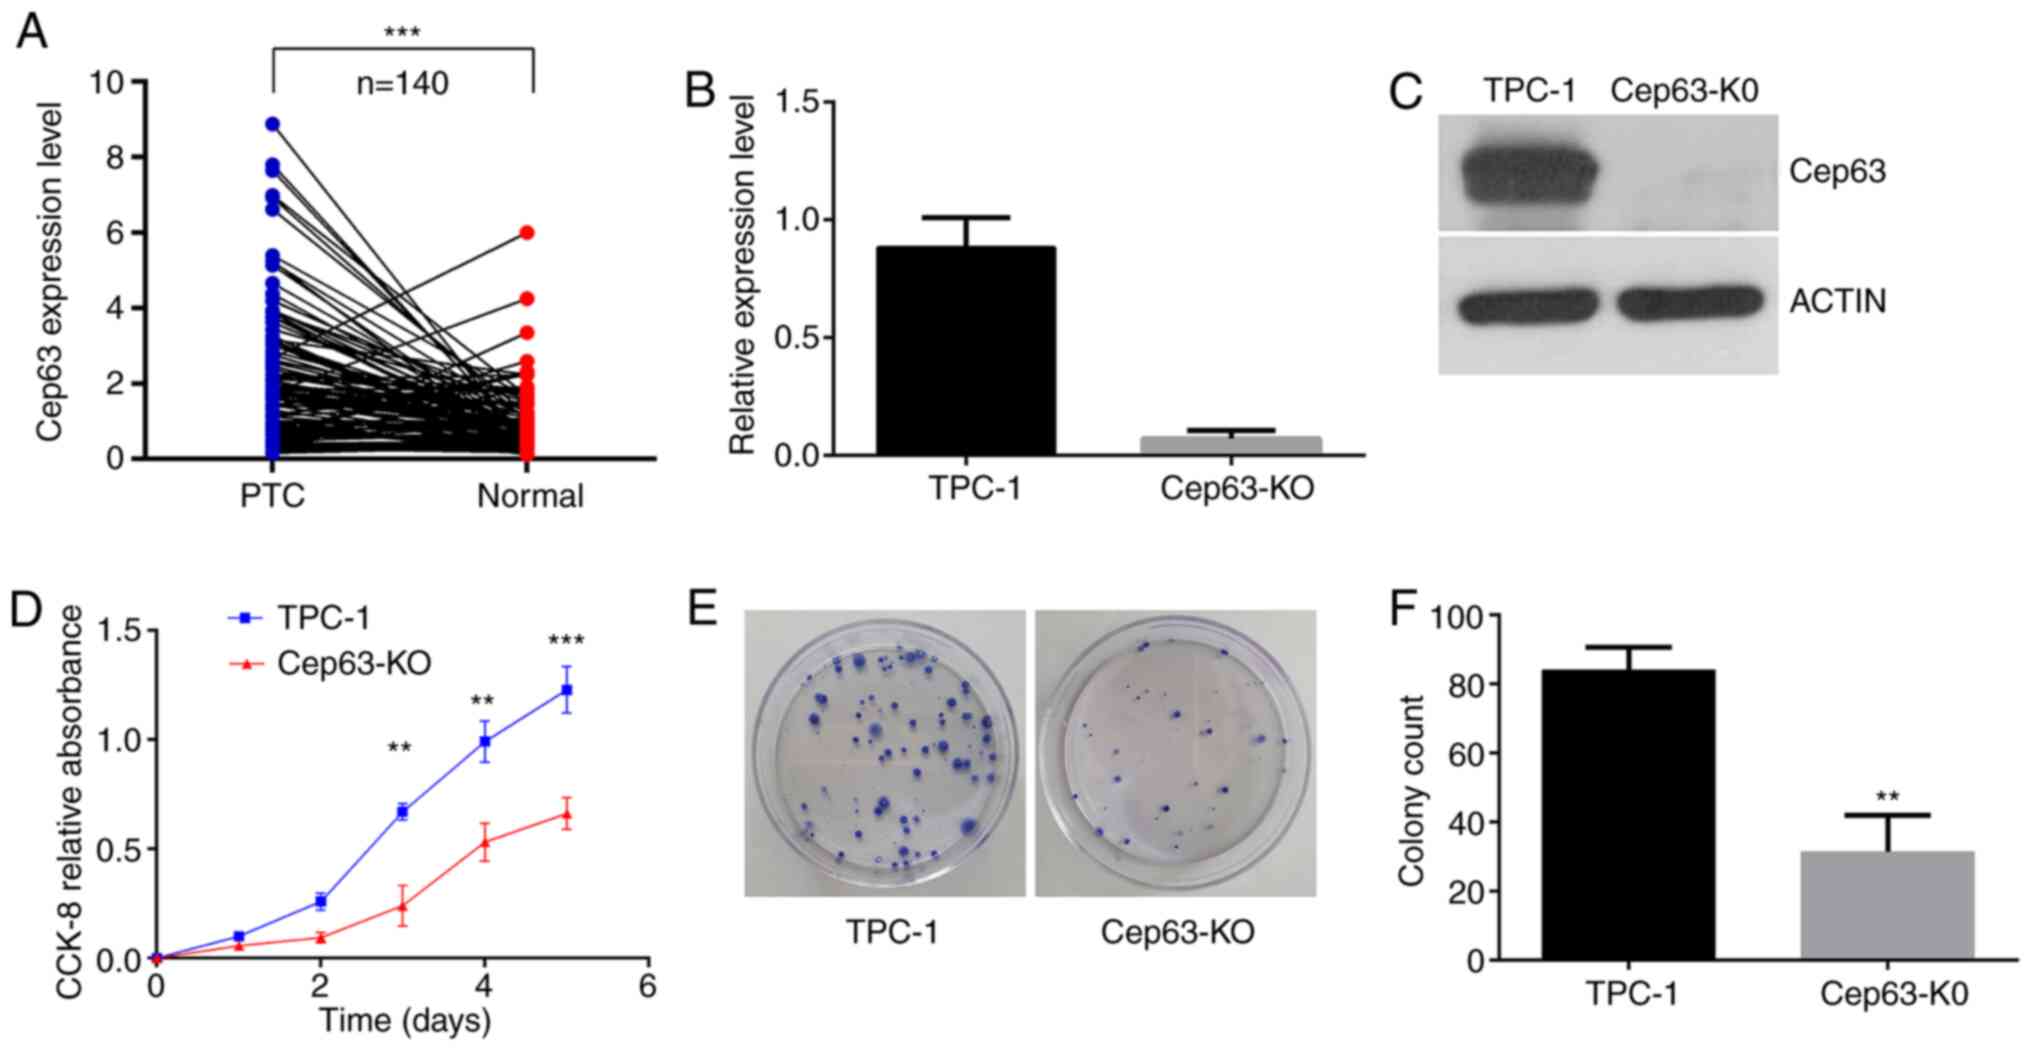
The results in Fig. 1A
revealed that Cep63 expression was significantly higher in PTC
tissues than in normal thyroid tissues. According to the eighth
edition of the American Joint Committee on Cancer/Union for
International Cancer Control tumor-node-metastasis staging system
(TNM-8) (23,24) and using the median expression level of
Cep63 as the cutoff point, the patients were divided into the
high-expression and low-expression groups and the relationship
between the expression level of Cep63 and the clinicopathological
features was further analyzed. A significant association was
revealed between high Cep63 expression and lymph node metastasis of
PTC (P=0.017) (Table I). However, the
age, sex, tumor size, TNM stage and BRAF mutation status of the
patients were not significantly associated with the Cep63
expression level (P>0.05). In general, Cep63 is highly expressed
in PTC and is probably involved in the progression of PTC.
 | Table I.Association between Cep63 expression
and clinicopathological features in papillary thyroid cancer. |
Table I.
Association between Cep63 expression
and clinicopathological features in papillary thyroid cancer.
|
|
| Cep63
expression |
|
|---|
|
|
|
|
|
|---|
| Variables | No. of cases | High | Low | P-value |
|---|
| Sex |
|
|
| 0.346 |
|
Male | 39 | 17 | 22 |
|
|
Female | 101 | 53 | 48 |
|
| Age (years) |
|
|
| 0.73 |
|
<55 | 84 | 43 | 41 |
|
|
≥55 | 56 | 27 | 29 |
|
| Tumor size
(cm) |
|
|
| 0.17 |
|
<2 | 82 | 37 | 45 |
|
| ≥2 | 58 | 33 | 25 |
|
| Lymph node
metastasis |
|
|
| 0.017 |
| No | 62 | 24 | 38 |
|
|
Yes | 78 | 46 | 32 |
|
| TNM stage |
|
|
| 0.368 |
| I | 97 | 46 | 51 |
|
| II | 34 | 19 | 15 |
|
|
III–IV | 9 | 5 | 4 |
|
| BRAF mutation |
|
|
| 0.338 |
| No | 37 | 16 | 21 |
|
|
Yes | 103 | 54 | 49 |
|
Knockout of Cep63 in TPC-1 cells
To explore the function of Cep63 in TPC-1 cells,
CRISPR/Cas9 editing was used to construct Cep63-KO cell line.
RT-qPCR and western blotting were used to assess the expression of
Cep63 at the protein and mRNA levels, respectively, to verify the
knockout efficiency in these cells. The results of these analyses
revealed that Cep63 expression was abolished in the Cep63-KO cell
line generated by CRISPR/Cas9 editing of TPC-1 cells (Fig. 1B and C).
Knockout of Cep63 inhibits the
proliferation of TPC-1 cells
The CCK-8 method was used to assess the
proliferation ability of the two groups of cells. Comparison
between the two groups revealed that the growth trend of Cep63-KO
cells was relatively mild and that the growth rate of these cells
was significantly lower than that of TPC-1 cells (P<0.001;
Fig. 1D), indicating that Cep63
knockout inhibited the proliferation of TPC-1 cells. In addition,
TPC-1 cell colony formation rate of 21±0.95% and the Cep63-KO cell
colony formation rate of 7.83±1.53% were significantly different
(P<0.01; Fig. 1E and F),
indicating that Cep63 knockout obviously reduced the rate of colony
formation of TPC-1 cells.
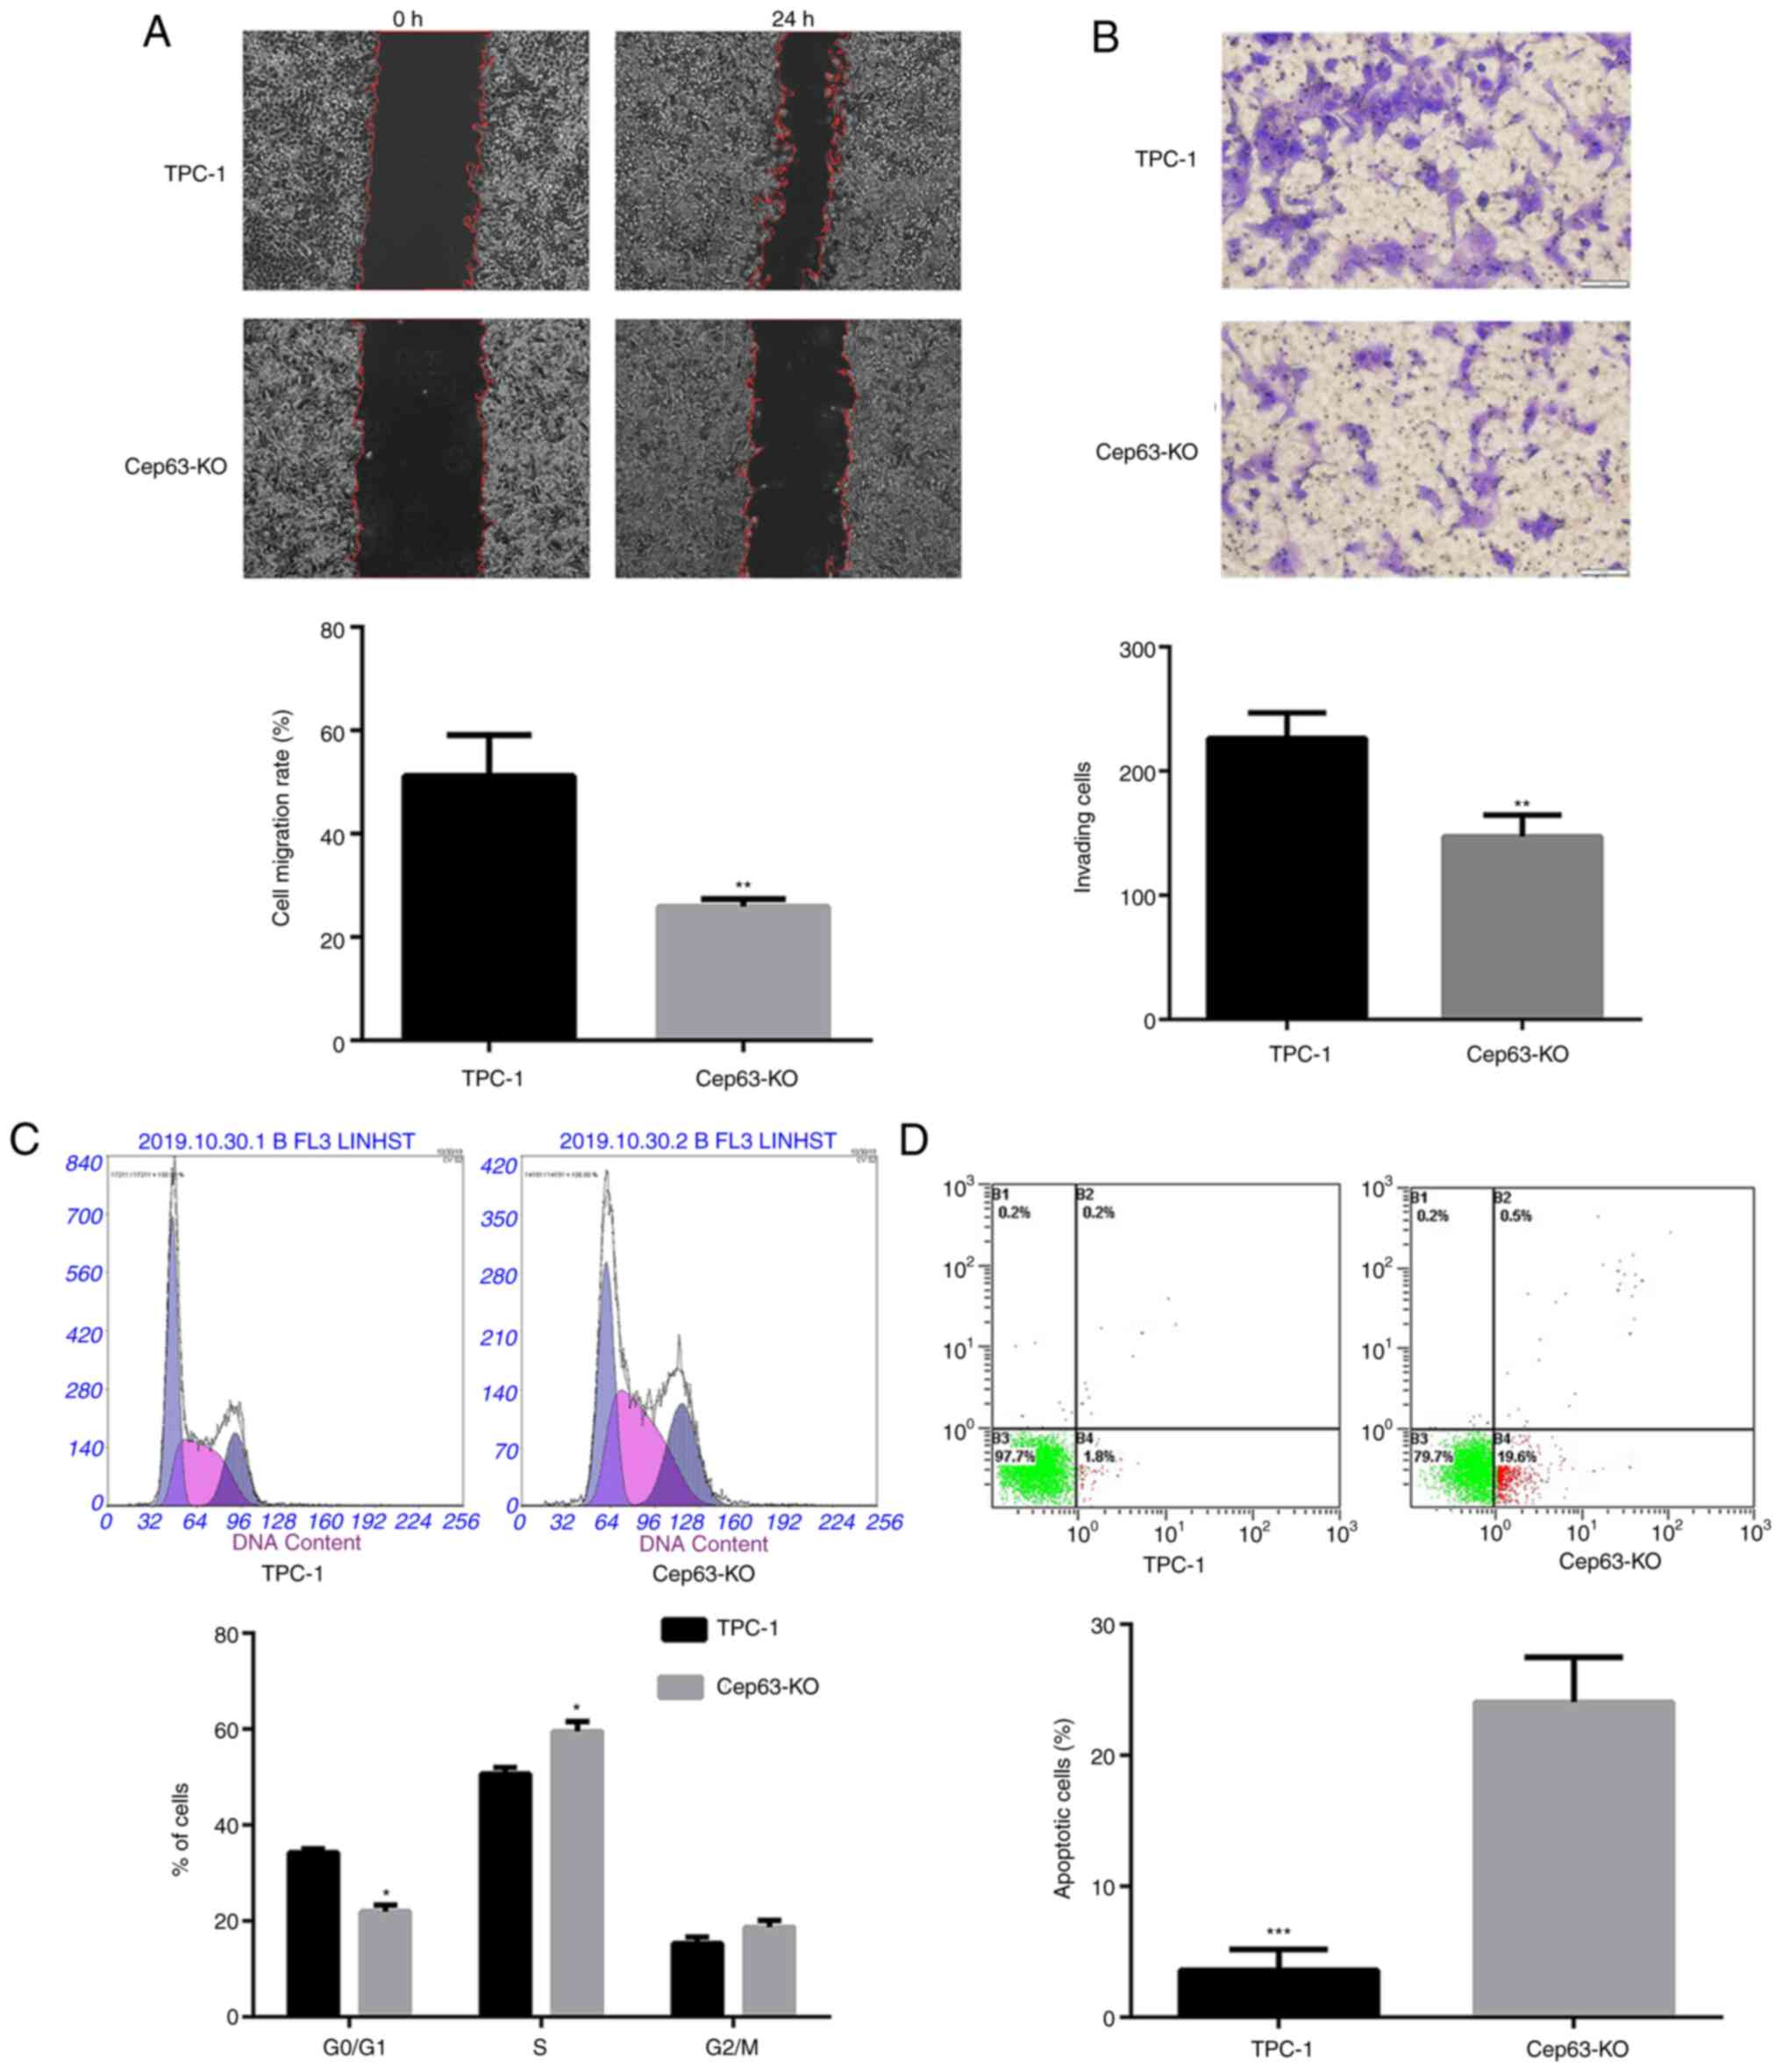
Knockout of Cep63 suppresses the
migration and invasion of TPC-1 cells
The effect of Cep63 knockout on the functional
characteristics of TPC-1 cells was evaluated by cell migration and
invasion experiments. Cep63 knockout reduced the cell migration
rate by 25.31% compared with that of TPC-1 cells (P<0.01;
Fig. 2A). In addition, after Cep63
knockout, the number of cells penetrating the Transwell membrane
was significantly lower than that of TPC-1 cells (147.0±10.12 and
226.3±11.89; P<0.01) (Fig. 2B).
These data indicated that Cep63 mediated the malignant invasion and
migration of TPC-1 cells.
Knockout of Cep63 induces S-phase cell
cycle arrest and promotes the apoptosis of TPC-1 cells
The flow cytometric results revealed that compared
with TPC-1 cells, Cep63-KO cells exhibited a significantly
decreased population in the G0/G1 phase and a
significantly increased population in the S phase (Fig. 2C). These results indicated that the
transition of TPC-1 cells from the G0/G1
phase to the S phase was significantly (P<0.05) increased after
Cep63 knockout, suggesting that Cep63 may play an important role in
regulating the cell cycle in TPC-1 cells. Furthermore, the
apoptotic rate of Cep63-KO cells was significantly increased
compared with that of TPC-1 cells (20.1 and 2%, respectively;
Fig. 2D), indicating the important
role of Cep63 in mediating the apoptosis of TPC-1 cells.
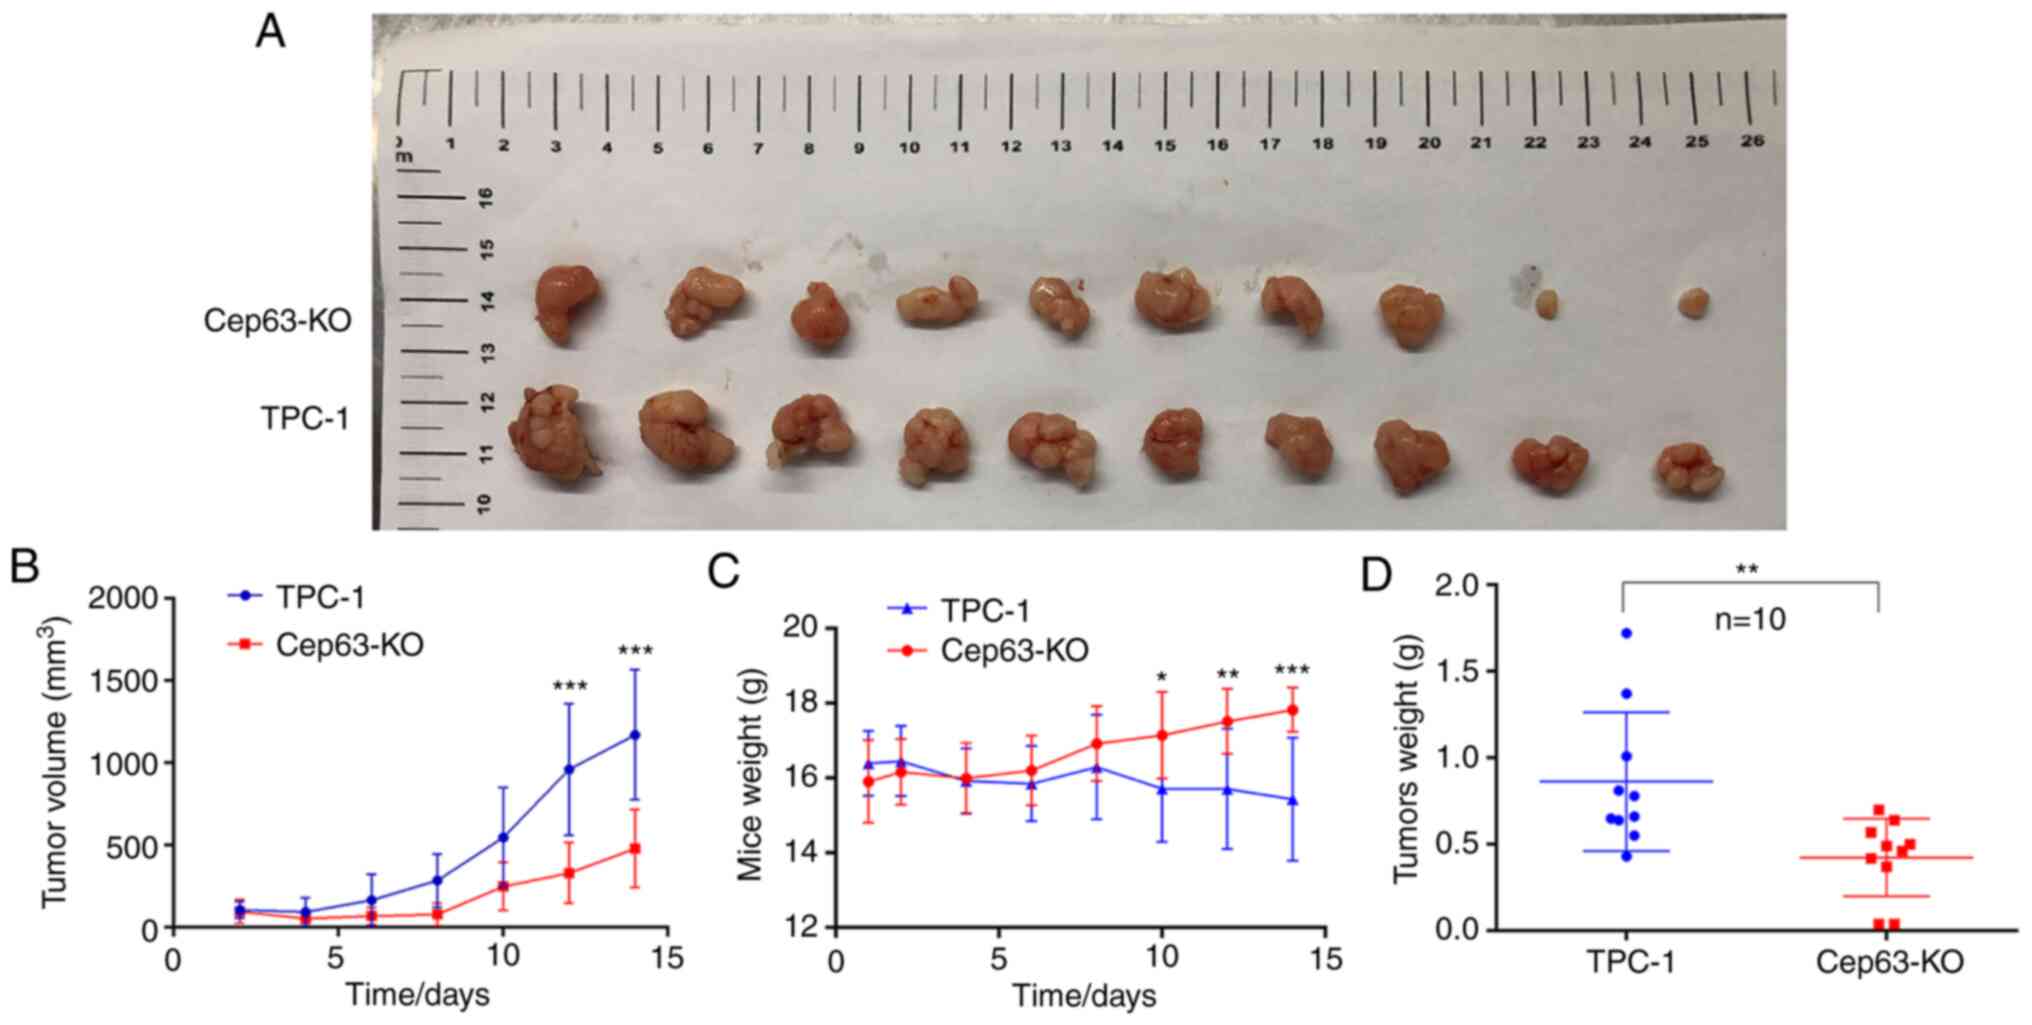
Cep63 stimulates tumor proliferation
activity in vivo
The effect of Cep63 on the growth of TPC-1 cells was
confirmed in vivo by a subcutaneous tumor formation assay in
nude mice. The tumors in the Cep63-KO group had smaller volumes and
grew more slowly than those in the TPC-1 group (P<0.001;
Fig. 3A and B). The weight of tumors
followed a similar pattern: The tumors in the Cep63-KO group
weighed significantly less than those in the TPC-1 group
(P<0.01; Fig. 3D), indicating that
Cep63 also actively regulated the growth of TPC-1 cells in
vivo. Furthermore, these results vividly revealed that as the
tumors grew, the weight of the mice in the TPC-1 group decreased
significantly, while that of the mice in the Cep63-KO group
increased gradually (P<0.001; Fig.
3C). It was hypothesized that this pattern may have resulted
from cachexia caused by the malignant proliferation behavior of
TPC-1 cells in mice, which also indicated that Cep63 mediated the
malignant proliferation of TPC-1 cells.
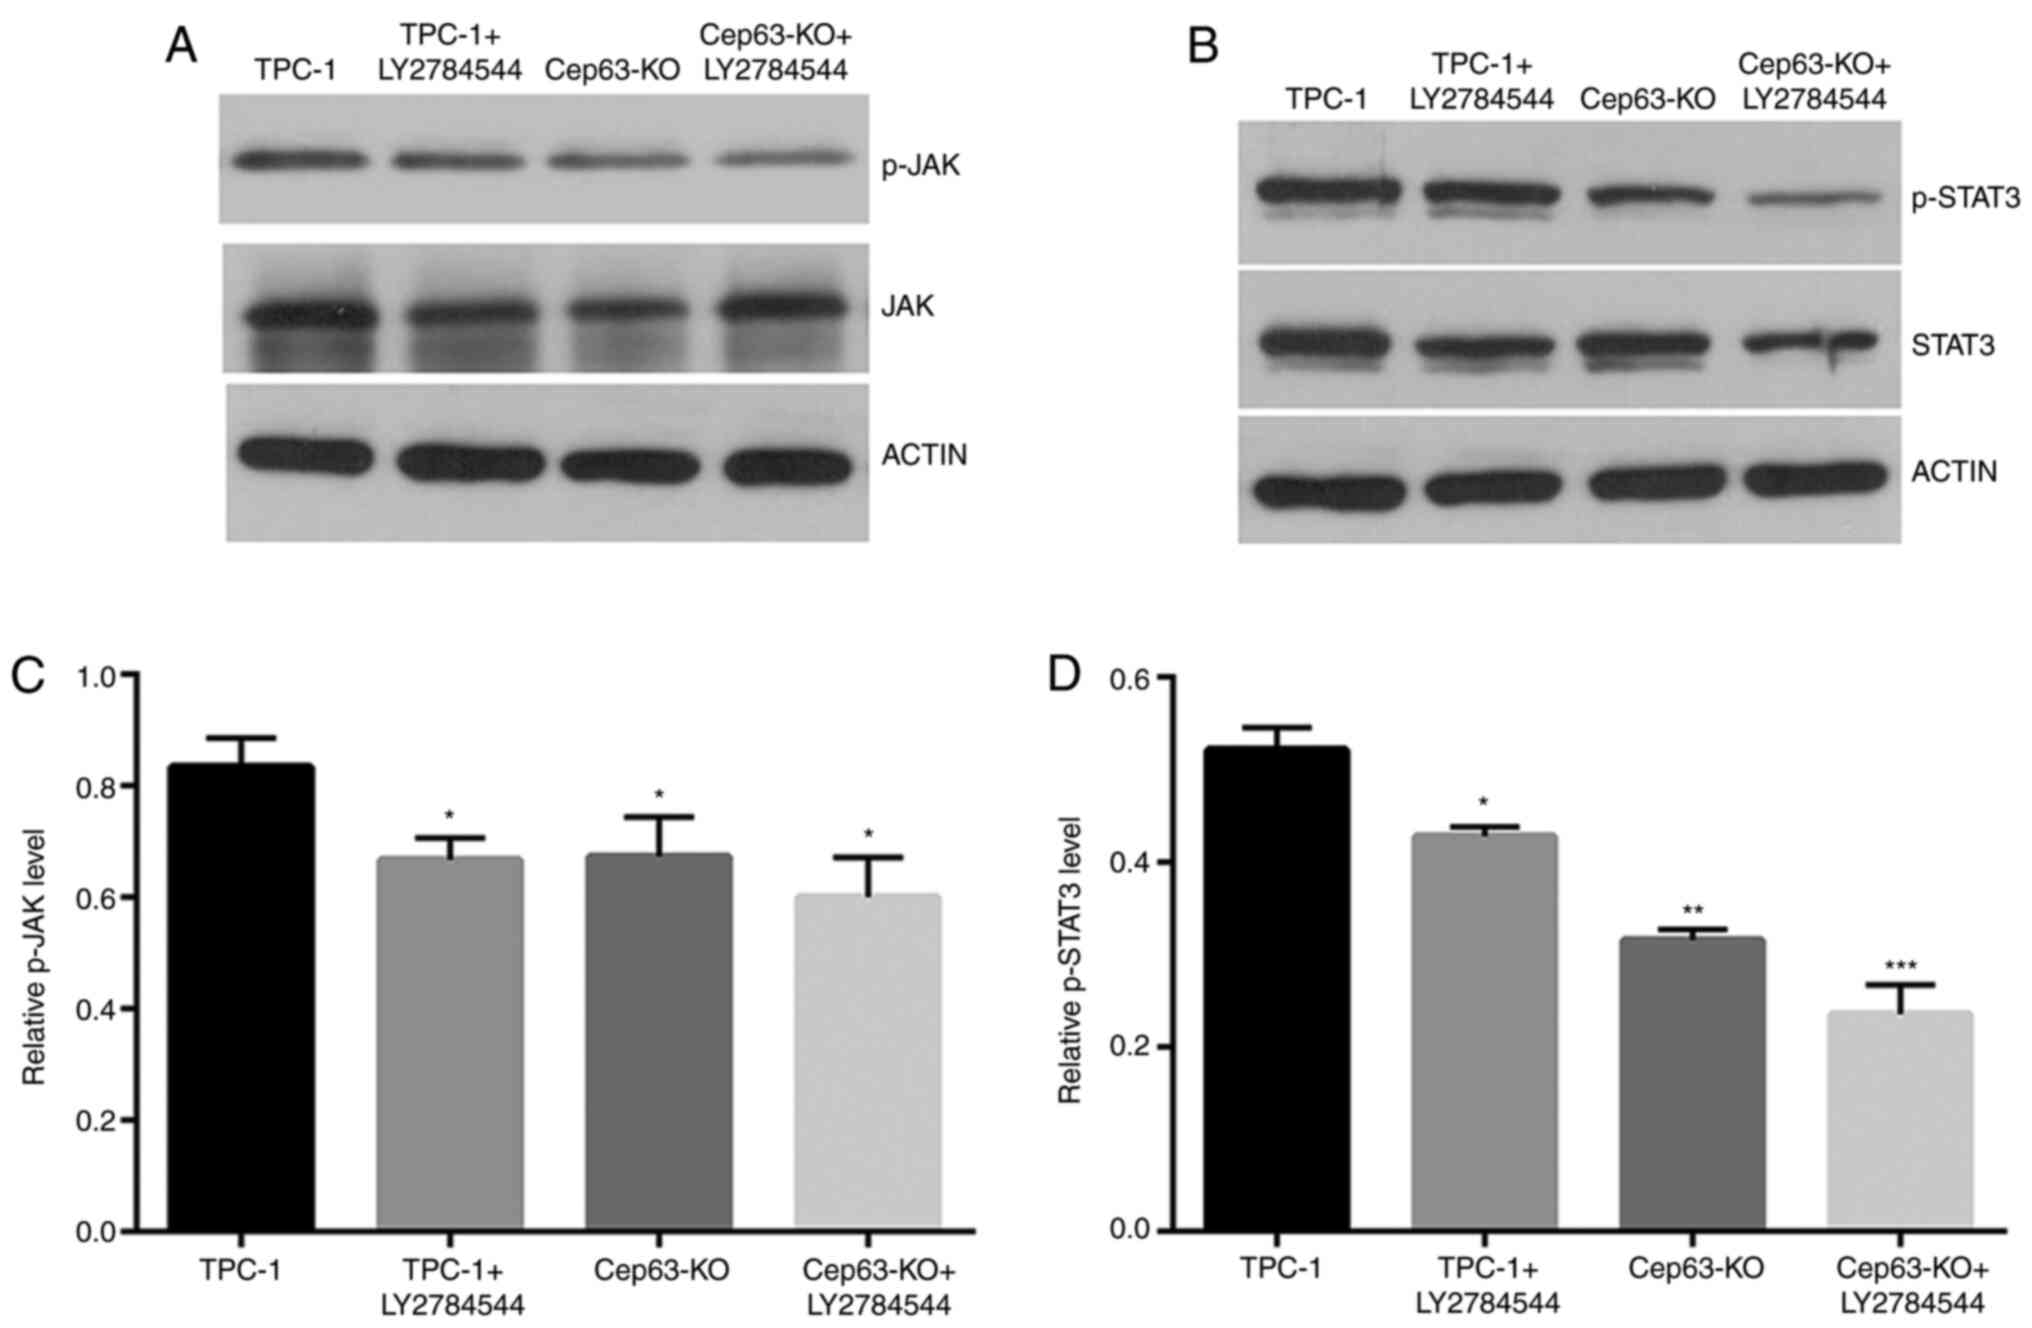
JAK/STAT3 signaling pathway may be
involved in the Cep63-mediated malignant behavior of TPC-1
cells
The expression of the JAK/STAT3 pathway was studied
through western blotting to explore the molecular mechanism of
Cep63 in TPC-1 cells. The p-JAK and p-STAT3 levels were decreased
by 11.6 and 33.0%, respectively, in Cep63-KO group compared with
TPC-1 group (Fig. 4). After treatment
with the JAK inhibitor LY2784544 for 24 h in TPC-1+LY2784544 group,
as expected, the protein levels of p-JAK and p-STAT3 were
significantly decreased by 25.2 and 27.6% compared with the TPC-1
cell group, respectively. The results indicated that JAK/STAT3 may
be involved in the Cep63-mediated malignant behavior of TPC-1
cells.
Discussion
Centrosomal proteins play an important role in
molecular recognition in the regulation of cell function and
activity. These proteins may be important in human tumorigenesis
and provide new targets for the diagnosis and treatment of tumors
(25,26). A previous study (19) demonstrated that Cep63 promotes the
replication of centrioles and that Cep63 knockout causes
centrosomal distortion, chromosomal entanglement and telomere
clustering defects, indicating that centrosomes mediate the
regulation of the DNA damage response.
The Cep63 expression was strongly upregulated in PTC
tissues and lymph node metastasis was associated with high Cep63
expression; these results were consistent with an oncogenic role
for the Cep63 gene in PTC. BCPAP is a mutant cell line, which was
initially selected, however, since other types of cell lines, such
as BCPAP, could not be obtained through effective ways, and
considering that the TPC-1 cell line has been widely used in
previous research (27), the TPC-1
cell line was finally selected and focus was addressed on the
effect of the CEP63 gene on the TPC-1 cell line. The biological
function of Cep63 was further studied in subsequent experiments. It
was revealed that the proliferation, migration and invasion of
Cep63-KO cells was significantly suppressed compared with that of
TPC-1 cells, and that Cep63 knockout promoted cell cycle
progression from the G0/G1 phase to the S
phase. The data also revealed that Cep63 knockout promoted TPC-1
cell apoptosis. In vivo experiments further confirmed that
Cep63 knockout decreased the growth rate and size of tumors
compared with those in the TPC-1 group and even resulted in a
significant difference in the weight of mice between two groups.
The present study revealed that Cep63 promoted TPC-1 cell
proliferation, migration and invasion and inhibited apoptosis both
in vivo and in vitro, consistent with results
identifying Cep63 as an oncogene (21) and indicating the key role of Cep63 in
PTC. However, due to COVID-19 and other unavoidable reasons, it has
not been possible to collect xenograft tumor tissues in time to
continue the detection of tumor markers.
The JAK/STAT3 signaling pathway is a widely
recognized carcinogenic pathway and plays a key role in mediating
proliferation, invasion and migration in some cancers (28,29). STAT3
has been revealed to be targeted by the signaling of numerous
receptor and nonreceptor tyrosine kinases in cancer cells. In
addition, it is a transcription factor that regulates the
expression of a wide range of genes and recruits tumor
progression-promoting immune cells into the tumor microenvironment
(30). After Cep63 knockout or JAK
inhibitor treatment in TPC-1 cells, the expression levels of both
p-JAK and p-STAT3 were decreased, consistent with earlier reports
(31–33) that STAT3 is upregulated in human PTC
tissues and that the JAK/STAT3 pathway plays a role in promoting
the proliferation and migration of cancers. These data indicated
that the JAK/STAT3 signaling pathway may be involved in the
Cep63-mediated malignant biological behavior of TPC-1 cells. In a
previous study (34), a degree of
difference was detected in the expression of overall JAK and STAT3
as well as phosphorylated JAK and STAT3, and the difference was
statistically significant. During the experiment, every effort was
made to keep other controllable factors consistent, and it was
initially hypothesized that the expression difference of Cep63 may
affect the expression of JAK and STAT3 proteins. However, the
specific molecular mechanism still needs to be further studied.
In conclusion, the results of the present study
revealed that blocking the expression of Cep63 inhibited the
proliferation, migration and invasion and promoted apoptosis of
TPC-1 cells and that the JAK/STAT pathway may be strongly involved.
The preliminary discussion of the role of Cep63 in promoting the
malignant behavior of TPC-1 cells was provided, and it was
suggested that Cep63 may be a potential oncogene for PTC cell line
TPC-1. There have been no studies on the relationship between Cep63
and thyroid cancer progression, to the best of our knowledge. The
BCPAP cell line is going to be obtained in order to study whether
the tumor-promoting role of Cep63 is BRAF-dependent or not. Since
other pathological types of thyroid cancers are relatively rare
clinically, a certain number of clinical specimens cannot be
collected in the short term at present. In future, other types of
thyroid cancers will be gradually collected, and then the
relationship between other types of thyroid cancers and the
expression of Cep63 will be examined.
Acknowledgements
The authors would like to thank Professor Qingduan
Wang (Henan Key Laboratory for Pharmacology of Liver Diseases) for
proofreading the article and Dr Youmei Peng (Henan Key Laboratory
for Pharmacology of Liver Diseases) for the guidance in the animal
experiments.
Funding
The present study was supported by Technological
Innovation Team Project of Henan Province (grant no. 19IRTSTHN002),
The Thousand Talents Science and Technology Innovation Leading
Talents Subsidy Project of Central Plains (grant no. 194200510011),
the Major Scientific Research Projects of Traditional Chinese
Medicine in Henan Province (grant no. 20-21ZYZD14) and the
Cultivation of Young and Middle-aged Health Science and Technology
Innovation Leading Talents in Henan Province (grant no.
YXKC2020015).
Availability of data and materials
The datasets generated during and/or analyzed during
the current study are available from the corresponding author on
reasonable request.
Authors' contributions
CL and FY prepared the manuscript and designed the
study. RM, LZ, GD and DN performed the experiments, analyzed the
data and performed the literature research. DY was responsible for
the process design, manuscript review for important intellectual
content and integrity assurance of the whole study. All authors
read and approved the final manuscript.
Ethics approval and consent to
participate
All the experiments in the present study were
approved (approval no. 2019-KY-313) by the Ethics Committee for
Scientific Research and Clinical Trial of the First Affiliated
Hospital of Zhengzhou University (Zhengzhou, China). Written
informed consent was obtained from all patients prior to enrollment
in the present study.
Patient consent for publication
Not applicable.
Competing interests
The authors declare that they have no competing
interests.
References
|
1
|
Wang S, Wu J, Ren J, Vlantis AC, Li MY,
Liu SYW, Ng EKW, Chan ABW, Luo DC, Liu Z, et al: MicroRNA-125b
interacts with Foxp3 to induce autophagy in thyroid cancer. Mol
Ther. 26:2295–2303. 2018. View Article : Google Scholar : PubMed/NCBI
|
|
2
|
Yin D, Wu W, Li M, Wang QE, Li H, Wang Y,
Tang Y and Xing M: DKK3 is a potential tumor suppressor gene in
papillary thyroid carcinoma. Endocr Relat Cancer. 20:507–514. 2013.
View Article : Google Scholar : PubMed/NCBI
|
|
3
|
Dalal V, Kaur M and Bansal A: Papillary
carcinoma thyroid with anastomosing channels: An unusual
morphology. J Lab Physicians. 9:140–142. 2017. View Article : Google Scholar : PubMed/NCBI
|
|
4
|
Siegel RL, Miller KD and Jemal A: Cancer
statistics, 2017. CA Cancer J Clin. 67:7–30. 2017. View Article : Google Scholar : PubMed/NCBI
|
|
5
|
Schneider DF and Chen H: New developments
in the diagnosis and treatment of thyroid cancer. CA Cancer J Clin.
63:374–394. 2013. View Article : Google Scholar : PubMed/NCBI
|
|
6
|
Kim DH, Ahn JS, Han HJ, Kim HM, Hwang J,
Lee KH, Cha-Molstad H, Ryoo IJ, Jang JH, Ko SK, et al: Cep131
overexpression promotes centrosome amplification and colon cancer
progression by regulating Plk4 stability. Cell Death Dis.
10:5702019. View Article : Google Scholar : PubMed/NCBI
|
|
7
|
Fukasawa K: Oncogenes and tumour
suppressors take on centrosomes. Nat Rev Cancer. 7:911–924. 2007.
View Article : Google Scholar : PubMed/NCBI
|
|
8
|
Brinkley BR: Managing the centrosome
numbers game: From chaos to stability in cancer cell division.
Trends Cell Biol. 11:18–21. 2001. View Article : Google Scholar : PubMed/NCBI
|
|
9
|
Levine MS, Bakker B, Boeckx B, Moyett J,
Lu J, Vitre B, Spierings DC, Lansdorp PM, Cleveland DW, Lambrechts
D, et al: Centrosome amplification is sufficient to promote
spontaneous tumorigenesis in mammals. Dev Cell. 40:313–322.e5.
2017. View Article : Google Scholar : PubMed/NCBI
|
|
10
|
Coelho PA, Bury L, Shahbazi MN,
Liakath-Ali K, Tate PH, Wormald S, Hindley CJ, Huch M, Archer J,
Skarnes WC, et al: Over-expression of Plk4 induces centrosome
amplification, loss of primary cilia and associated tissue
hyperplasia in the mouse. Open Biol. 5:1502092015. View Article : Google Scholar : PubMed/NCBI
|
|
11
|
Maric I, Viaggi S, Caria P, Frau DV, Degan
P and Vanni R: Centrosomal and mitotic abnormalities in cell lines
derived from papillary thyroid cancer harboring specific gene
alterations. Mol Cytogenet. 4:262011. View Article : Google Scholar : PubMed/NCBI
|
|
12
|
Pannu V, Mittal K, Cantuaria G, Reid MD,
Li X, Donthamsetty S, McBride M, Klimov S, Osan R, Gupta MV, et al:
Rampant centrosome amplification underlies more aggressive disease
course of triple negative breast cancers. Oncotarget.
6:10487–10497. 2015. View Article : Google Scholar : PubMed/NCBI
|
|
13
|
Denu RA, Zasadil LM, Kanugh C, Laffin J,
Weaver BA and Burkard ME: Centrosome amplification induces high
grade features and is prognostic of worse outcomes in breast
cancer. BMC Cancer. 16:472016. View Article : Google Scholar : PubMed/NCBI
|
|
14
|
Kawamura K, Izumi H, Ma Z, Ikeda R,
Moriyama M, Tanaka T, Nojima T, Levin LS, Fujikawa-Yamamoto K,
Suzuki K and Fukasawa K: Induction of centrosome amplification and
chromosome instability in human bladder cancer cells by p53
mutation and cyclin E overexpression. Cancer Res. 64:4800–4809.
2004. View Article : Google Scholar : PubMed/NCBI
|
|
15
|
Xie S, Qin J, Liu S, Zhang Y, Wang J, Shi
X, Li D, Zhou J and Liu M: Cep70 overexpression stimulates
pancreatic cancer by inducing centrosome abnormality and
microtubule disorganization. Sci Rep. 6:212632016. View Article : Google Scholar : PubMed/NCBI
|
|
16
|
Li J, Xuan JW, Khatamianfar V, Valiyeva F,
Moussa M, Sadek A, Yang BB, Dong BJ, Huang YR and Gao WQ: SKA1
over-expression promotes centriole over-duplication, centrosome
amplification and prostate tumourigenesis. J Pathol. 234:178–189.
2014. View Article : Google Scholar : PubMed/NCBI
|
|
17
|
Nigg EA, Cajanek L and Arquint C: The
centrosome duplication cycle in health and disease. FEBS Lett.
588:2366–2372. 2014. View Article : Google Scholar : PubMed/NCBI
|
|
18
|
Watanabe Y, Honda S, Konishi A, Arakawa S,
Murohashi M, Yamaguchi H, Torii S, Tanabe M, Tanaka S, Warabi E and
Shimizu S: Autophagy controls centrosome number by degrading Cep63.
Nat Commun. 7:135082016. View Article : Google Scholar : PubMed/NCBI
|
|
19
|
Buim ME, Soares FA, Sarkis AS and Nagai
MA: The transcripts of SFRP1,CEP63 and EIF4G2 genes are frequently
downregulated in transitional cell carcinomas of the bladder.
Oncology. 69:445–454. 2005. View Article : Google Scholar : PubMed/NCBI
|
|
20
|
Smith E, Dejsuphong D, Balestrini A,
Hampel M, Lenz C, Takeda S, Vindigni A and Costanzo V: An ATM- and
ATR-dependent checkpoint inactivates spindle assembly by targeting
CEP63. Nat Cell Biol. 11:278–285. 2009. View Article : Google Scholar : PubMed/NCBI
|
|
21
|
Loffler H, Fechter A, Matuszewska M,
Saffrich R, Mistrik M, Marhold J, Hornung C, Westermann F, Bartek J
and Krämer A: Cep63 recruits Cdk1 to the centrosome: Implications
for regulation of mitotic entry, centrosome amplification, and
genome maintenance. Cancer Res. 71:2129–2139. 2011. View Article : Google Scholar : PubMed/NCBI
|
|
22
|
Livak KJ and Schmittgen TD: Analysis of
relative gene expression data using real-time quantitative PCR and
the 2(-Delta Delta C(T)) method. Methods. 25:402–408. 2001.
View Article : Google Scholar : PubMed/NCBI
|
|
23
|
Zhi J, Wu Y, Hu L, Zhao J, Liu H, Ruan X,
Hou X, Zhang J, Zheng X and Gao M: Assessment of the prognostic
value and N1b changes of the eighth TNM/AJCC staging system for
differentiated thyroid carcinoma. Int J Clin Oncol. 25:59–66. 2020.
View Article : Google Scholar : PubMed/NCBI
|
|
24
|
Kim TH, Kim YN, Kim HI, Park SY, Choe JH,
Kim JH, Kim JS, Oh YL, Hahn SY, Shin JH, et al: Prognostic value of
the eighth edition AJCC TNM classification for differentiated
thyroid carcinoma. Oral Oncol. 71:81–86. 2017. View Article : Google Scholar : PubMed/NCBI
|
|
25
|
Li S, Hu X, Cui S and He D: Novel
centrosome protein, TCC52, is a cancer-testis antigen. Cancer Sci.
99:2274–2279. 2008. View Article : Google Scholar : PubMed/NCBI
|
|
26
|
Kumar A, Rajendran V, Sethumadhavan R and
Purohit R: CEP proteins: The knights of centrosome dynasty.
Protoplasma. 250:965–983. 2013. View Article : Google Scholar : PubMed/NCBI
|
|
27
|
Yin DT, Xu J, Lei M, Li H, Wang Y, Liu Z,
Zhou Y and Xing M: Characterization of the novel tumor-suppressor
gene CCDC67 in papillary thyroid carcinoma. Oncotarget.
7:5830–5841. 2016. View Article : Google Scholar : PubMed/NCBI
|
|
28
|
Liang C, Zhao T, Li H, He F, Zhao X, Zhang
Y, Chu X, Hua C, Qu Y, Duan Y, et al: Long Non-coding RNA ITIH4-AS1
accelerates the proliferation and metastasis of colorectal cancer
by activating JAK/STAT3 signaling. Mol Ther Nucleic Acids.
18:183–193. 2019. View Article : Google Scholar : PubMed/NCBI
|
|
29
|
Khanna P, Lee JS, Sereemaspun A, Lee H and
Baeg GH: GRAMD1B regulates cell migration in breast cancer cells
through JAK/STAT and Akt signaling. Sci Rep. 8:95112018. View Article : Google Scholar : PubMed/NCBI
|
|
30
|
Yu H, Lee H, Herrmann A, Buettner R and
Jove R: Revisiting STAT3 signalling in cancer: New and unexpected
biological functions. Nat Rev Cancer. 14:736–746. 2014. View Article : Google Scholar : PubMed/NCBI
|
|
31
|
Notarangelo T, Sisinni L, Trino S, Calice
G, Simeon V and Landriscina M: IL6/STAT3 axis mediates resistance
to BRAF inhibitors in thyroid carcinoma cells. Cancer Lett.
433:147–155. 2018. View Article : Google Scholar : PubMed/NCBI
|
|
32
|
Chang Q, Bournazou E, Sansone P, Berishaj
M, Gao SP, Daly L, Wels J, Theilen T, Granitto S, Zhang X, et al:
The IL-6/JAK/Stat3 feed-forward loop drives tumorigenesis and
metastasis. Neoplasia. 15:848–862. 2013. View Article : Google Scholar : PubMed/NCBI
|
|
33
|
Bi CL, Zhang YQ, Li B, Guo M and Fu YL:
MicroRNA-520a-3p suppresses epithelial-mesenchymal transition,
invasion, and migration of papillary thyroid carcinoma cells via
the JAK1-mediated JAK/STAT signaling pathway. J Cell Physiol.
234:4054–4067. 2019. View Article : Google Scholar : PubMed/NCBI
|
|
34
|
Lu J, Zhang L, Zhou H, Du Z and Zhang G:
Silencing of Girdin suppresses the malignant behavior of colorectal
carcinoma cells. Oncol Rep. 40:887–894. 2018.PubMed/NCBI
|