Introduction
Ovarian cancer (OV) is the leading cause of
mortality among gynecological malignancies worldwide (1,2).
Despite progress in cytoreductive surgery, chemotherapy and
targeted therapies, the overall 5-year survival rate remains low,
at 45–50% across all stages, particularly among patients who
present with advanced-stage disease (3–5). A
major limitation in improving patient outcomes is the absence of
reliable biomarkers and actionable molecular targets that can aid
early detection, guide treatment selection or predict prognosis
(6,7). Consequently, there is a need to
elucidate the transcriptional programs that drive OV initiation,
progression and therapeutic resistance.
Transcription factors (TFs) are key regulators of
gene expression networks governing cell proliferation (8,9),
epithelial-mesenchymal transition (EMT) (10,11),
invasion (12,13) and stress adaptation (14). Aberrant TF activity is implicated in
the pathogenesis of numerous malignancies (15), where TFs often reprogram cellular
states to sustain tumor growth and dissemination; for example, in
ovarian cancer, the lineage TF PAX8 cooperates with MECOM/PRDM3 to
drive oncogenic transcriptional programs and sustain in vivo
tumor growth (16). However, in OV,
TF-driven oncogenic circuits have undergone comparatively less
systematic investigation than alterations in signaling pathways or
genetic mutations (17,18). Identifying TFs that are consistently
dysregulated and defining downstream targets may provide novel
insights into and uncover previously unrecognized therapeutic
vulnerabilities.
Zinc finger and BTB domain-containing 7A (ZBTB7A,
also known as LRF or Pokemon) is a member of the POK family of
transcriptional regulators (19–21).
ZBTB7A has been reported to function as either an oncogene or a
tumor suppressor in a context-dependent manner (21). In some cancers, ZBTB7A enhances
proliferation, metabolic adaptation and resistance to apoptosis,
whereas in others it appears to constrain tumorigenesis (22). Despite these diverse roles, the
relevance of ZBTB7A in OV has remained largely unexplored. To date,
to the best of our knowledge, there has been little evidence
addressing whether ZBTB7A contributes to ovarian tumor progression
(23), what downstream
transcriptional programs it engages, and whether these programs
have prognostic or therapeutic importance.
The present study aimed to investigate the role of
ZBTB7A in OV. Specifically, the current study assessed the clinical
relevance of ZBTB7A in OV and aimed to delineate the molecular
circuitry through which ZBTB7A may promote malignant phenotypes,
including the investigation of cytokine receptor-like factor 1
(CRLF1) as a candidate downstream effector.
Materials and methods
Gene Expression Omnibus (GEO) datasets
and differential expression analysis
Public gene expression profiles were retrieved from
four GEO datasets (https://www.ncbi.nlm.nih.gov/geo): GSE26712 (24), GSE160626, GSE143897 (25) and GSE119168 (26). Briefly, GSE26712 is an Affymetrix
microarray cohort consisting of primary ovarian tumor specimens
from patients (late-stage, high-grade disease) and healthy
controls. GSE160626 is an RNA sequencing (RNA-seq) cohort comparing
platinum-sensitive and platinum-resistant ovarian cancer cases,
which also includes ‘normal ovary’ samples; however, the GEO
metadata does not specify whether these normal samples were
obtained from healthy donors or from the non-malignant (adjacent)
tissues of patients. GSE143897 is an RNA-seq dataset of
patient-derived ovarian cancer samples (primary tumors, ascites and
post-treatment tissues) and was used accordingly (not as a strict
tumor-vs.-normal ovary comparison). GSE119168 includes
patient-derived high-grade serous ovarian cancer omental tumor
tissues and non-malignant controls, which were normal fallopian
tube tissues from patients with benign gynecological conditions.
Datasets included both ovarian tumor and normal ovarian tissue
samples (n=309), with GSE26712 containing 176 sample (OV=166 and
normal controls=10), GSE160626 containing 17 sample (OV=9 and
normal controls=8), GSE143897 containing 90 sample (OV=78 and
normal controls=12) and GSE119168 containing 26 sample (OV=12 and
normal controls=14).
Raw expression matrices were downloaded and
processed in R (version 4.5.2; http://www.r-project.org/). Differential expression
analysis was performed using the Bioconductor packages GEOquery
(version 2.78.0; http://bioconductor.org/packages/release/bioc/html/GEOquery.html)
and limma (version 3.66.0; http://bioconductor.org/packages/release/bioc/html/limma.html).
GEOquery was used to programmatically retrieve GEO data, and limma
was used for linear modeling and differential expression testing.
Differentially expressed genes (DEGs) were identified using
thresholds of adjusted P<0.05 and |log2 fold change|
>1. Overlapping DEGs across datasets were visualized by Venn
diagrams and representative volcano plots, which were created using
the ggplot2 package (version 3.4.4; http://cran.r-project.org/package=ggplot2) in R
(version stated above; Bioconductor release 3.22). In addition,
ZBTB7A and CRLF1 pan-cancer expression was retrieved from TNMplot
(https://tnmplot.com/), using its pan-cancer
RNA-seq module integrating The Cancer Genome Atlas (TCGA) data; the
tumor and tissue-matched healthy samples were provided by the
TNMplot pipeline, in which normal tissues are automatically matched
to tumor types according to tissue of origin and anatomical
annotation. Statistical comparisons were performed using the
Mann-Whitney U test implemented in TNMplot. Kaplan-Meier overall
survival (OS) analysis was performed in Gene Expression Profiling
Interactive Analysis (GEPIA; http://gepia.cancer-pku.cn/) based on TCGA-OV RNA-seq
data, using median expression as the cut-off (high vs. low, 50/50%)
and the log-rank test to assess significance. Correlation analyses
between ZBTB7A and candidate target genes were performed using the
Pearson correlation coefficient based on transcriptomic data from
TCGA-OV cohort (GEPIA).
Survival and Cox regression
analyses
OS time was defined as the interval from the date of
initial diagnosis to death or last follow-up; patients alive at the
last follow-up were censored. OS data were obtained from TCGA-OV
dataset (n=379 patients). Expression levels of ZBTB7A and CRLF1
were dichotomized into high and low groups according to the median
mRNA expression value. Age was treated as a continuous variable.
Tumor grade was dichotomized into low grade (G1-G2) and high grade
(G3-G4, borderline grade and grade could not be assessed).
Univariate Cox proportional hazards models were first used to
estimate hazard ratios (HRs) and 95% confidence intervals (CIs) for
ZBTB7A and CRLF1. Multivariate Cox models were then constructed to
assess whether ZBTB7A and CRLF1 were independent prognostic
factors, adjusting for age and tumor grade, which were included
a priori as clinically established prognostic covariates to
control for potential confounding effects irrespective of their
univariate significance. Stage information was not available for
the majority of cases in TCGA-OV dataset and therefore could not be
included as a covariate. All analyses were performed using R
(version 4.5.2) or Python (version 3.11; Python Software
Foundation; http://www.python.org/) and two-sided
P<0.05 was considered to indicate a statistically significant
difference.
Human Protein Atlas (HPA)
Protein expression data were obtained from the HPA
(https://www.proteinatlas.org/).
Immunohistochemistry images of ZBTB7A in normal ovary tissues and
ovarian cancer tissues were retrieved from HPA.
Single-cell RNA-seq analysis
Single-cell transcriptomic data from OV samples were
obtained from the GEO (GSE154600) (27). According to the original
publication, the dataset consists of 10X Genomics single-cell RNA
sequencing from five cases of high-grade serous ovarian carcinoma
(HGSOC), yielding a total of 42,000 tumor-associated cells. These
samples represent infiltrated HGSOC with extensive genomic
instability and heterogeneous tumor microenvironment composition.
Raw count matrices were processed using Seurat (v4.3) in R
(https://satijalab.org/seurat/;
http://github.com/satijalab/seurat).
Cells were subjected to standard quality control filtering;
specifically, cells expressing <200 genes or >6,000 genes
were excluded to remove low-quality cells and potential doublets.
In addition, cells with mitochondrial gene content >10% were
removed. Genes detected in <3 cells were excluded from
downstream analyses. After quality control, the filtered gene
expression matrix was normalized using the LogNormalize method with
a scaling factor of 10,000. Cells were filtered for quality
control, normalized and subjected to principal component analysis
using RunPCA (implemented in Seurat and relying on standard R
routines for singular value decomposition). Specifically, RunUMAP
(UMAP), FindNeighbors and FindClusters in Seurat package v4.3.0 in
R were used for dimensionality reduction and cluster
identification. Module scoring was performed using AddModuleScore
(Seurat package v4.3.0 in R version 4.5.2) function to calculate
EMT scores based on the Molecular Signatures Database (MSigDB)
HALLMARK_EPITHELIAL_MESENCHYMAL_TRANSITION gene set; migration
score using a curated migration gene signature including VIM, FN1,
ITGA5, ITGB1, MMP2, MMP9 and CXCL8; and proliferation score using
the MSigDB HALLMARK_G2M_CHECKPOINT and HALLMARK_E2F_TARGETS gene
sets. These Hallmark gene sets were obtained from the Human MSigDB
v2025.1.Hs http://www.gsea-msigdb.org/gsea/msigdb). Tumor
epithelial cells were stratified into ZBTB7A-high and ZBTB7A-low
groups based on the normalized single-cell expression levels of
ZBTB7A, with cells above the median expression value classified as
ZBTB7A-high and those below as ZBTB7A-low. Pathway enrichment
analysis at the single-cell level was performed using the GSVA R
package (version 1.46.0; http://bioconductor.org/packages/GSVA). Gene sets were
obtained from MSigDB (https://www.gsea-msigdb.org/)., including the Hallmark
Wnt/β-catenin and Hippo signaling pathways. Differential pathway
activities between ZBTB7A-high and ZBTB7A-low tumor cells were
subsequently compared.
Cell lines and culture conditions
The human ovarian epithelial cell line IOSE80 was
obtained from The Cell Bank of Type Culture Collection of The
Chinese Academy of Sciences, and the OV cell lines (SKOV3, OVCAR3,
A2780 and CAOV3) were obtained from American Type Culture
Collection. 293T cells were also obtained from American Type
Culture Collection. IOSE80, SKOV3 and OVCAR3 cells were maintained
in RPMI-1640 (cat. no. 11875–093; Gibco, Thermo Fisher Scientific,
Inc.) supplemented with 10% FBS (cat. no. 10099-141; Gibco, Thermo
Fisher Scientific, Inc.) and 1% penicillin/streptomycin (cat. no.
15140-122; Gibco, Thermo Fisher Scientific, Inc.). A2780 cells were
maintained in RPMI-1640 supplemented with 10% FBS and 2 mM
L-glutamine (cat. no. 25030-081; Gibco, Thermo Fisher Scientific,
Inc.). CAOV3 and 293T cells were cultured in Dulbecco's Modified
Eagle Medium (cat. no. 11965-092; Gibco, Thermo Fisher Scientific,
Inc.) supplemented with 10% FBS. All cells were incubated at 37°C
in a humidified atmosphere containing 5% CO2.
Plasmid construction
For ZBTB7A overexpression (ZBTB7A-OE), the
full-length human ZBTB7A coding sequence (CDS) was amplified by PCR
from a cDNA library generated in our laboratory from 293T cells.
Briefly, 293T cell RNA was extracted using TRIzol reagent (cat. no.
15596026; Invitrogen; Thermo Fisher Scientific, Inc.) and
reverse-transcribed using the SuperScript™ IV First-Strand
Synthesis System (cat. no. 18091050; Invitrogen; Thermo Fisher
Scientific, Inc.), according to the manufacturer's instructions, to
generate the cDNA library. PCR amplification was performed using
Q5® High-Fidelity DNA Polymerase (cat. no. M0491; New
England Biolabs, Inc.). The CDS was confirmed to match the
reference sequence (NM_015898.4). Primers were designed to
introduce HindIII and XhoI restriction sites for
directional cloning. The primer sequences were as follows: Forward
primer, 5′-CCCAAGCTTATGGACGACGACGACGACG-3′; reverse primer,
5′-CCGCTCGAGTCAGGCGGCTGCTGCTG-3′. PCR was carried out under the
following thermocycling conditions: Initial denaturation at 98°C
for 30 sec; followed by 35 cycles of denaturation at 98°C for 10
sec, annealing at 60°C for 20 sec and extension at 72°C for 90 sec;
followed by a final extension at 72°C for 2 min.
The PCR-amplified fragment was digested with
HindIII and XhoI restriction enzymes (New England
Biolabs, Inc.) and subcloned into the mammalian expression vector
pcDNA3.1 (cat. no. V79520; Invitrogen; Thermo Fisher Scientific,
Inc.). For transient transfection, OVCAR3 cells were seeded in
6-well plates at a density of 2.0×10⁵ cells/well and
allowed to adhere overnight. The cells were transfected with
ZBTB7A-OE plasmid or the corresponding empty pcDNA3.1 vector
(negative control) using Lipofectamine® 3000
transfection reagent (Invitrogen, Thermo Fisher Scientific)
according to the manufacturer's protocol. Briefly, 2.5 µg plasmid
DNA was used per well and transfection was performed at 37°C for 6
h, after which the medium was replaced with fresh complete medium.
Cells were collected or subjected to subsequent experiments 24–48 h
post-transfection (24 h for RT-qPCR; 48 h for western blotting),
unless otherwise specified.
In addition, the CRLF1 promoter region, encompassing
−900 to +100 bp relative to the transcription start site (TSS), was
amplified by PCR using genomic DNA extracted from 293T cells as the
template. Genomic DNA was isolated using a commercial genomic DNA
extraction kit (TIANamp Genomic DNA Kit; Tiangen Biotech Co.,
Ltd.), according to the manufacturer's instructions. PCR
amplification was performed using a high-fidelity DNA polymerase
(Q5 High-Fidelity DNA Polymerase). Primers were designed to
introduce KpnI and XhoI restriction sites at the
5′-ends for directional cloning. The primer sequences were as
follows: Forward, 5′- GCGCGGGGTACCTTTTTCCGTGGCGGGGTGTGAATA G-3′;
reverse, 5′-CCGCGCCTCGAGGGCGGTGGCGCAGGGCGCGG-3′. PCR was carried
out under the following thermocycling conditions: Initial
denaturation at 98°C for 30 sec; followed by 35 cycles of
denaturation at 98°C for 10 sec, annealing at 72°C for 20 sec and
extension at 72°C for 30 sec; followed by a final extension at 72°C
for 2 min. The PCR product was digested with KpnI and
XhoI restriction enzymes (New England Biolabs, Inc.), and
was subsequently subcloned into the pGL3-Basic luciferase reporter
vector (Promega Corporation). This reporter construct was used for
luciferase assays.).
Small interfering RNA (siRNA)
knockdown
For knockdown, RNA interference experiments were
performed using chemically synthesized siRNAs. Validated siRNAs
targeting ZBTB7A (si-ZBTB7A) and CRLF1 (si-CRLF1), as well as a
scrambled negative control (NC) siRNA (si-NC), were purchased from
Shanghai GenePharma Co., Ltd. The sequences were as follows:
si-ZBTB7A, sense 5′-GGCGACGUGGUGAUCCUGGdTdT-3′, antisense
5′-CCAGGAUCACCACGUCGCCdTdT-3′; si-CRLF1, sense
5′-CACGCUGGAUAUCCUGGAUdTdT-3′, antisense
5′-GUGCGACCUAUAGGACCUAdTdT-3′; and si-NC, sense
5′-UUCUCCGAACGUGUCACGUdTdT-3′ and antisense
5′-ACGUGACACGUUCGGAGAAdTdT-3′. For siRNA transfection, A2780 cells
were seeded in 6-well plates at a density of 2.0×10⁵
cells/well and allowed to adhere overnight. The cells were then
transfected with si-ZBTB7A, si-CRLF1 or si-NC using Lipofectamine
3000 according to the manufacturer's protocol. Briefly, siRNAs were
used at a final concentration of 50 nM/well and transfection was
performed at 37°C for 6 h, after which the medium was replaced with
fresh complete medium. Knockdown efficiency was evaluated 24 h
after transfection by RT-quantitative PCR (RT-qPCR) and western
blotting.
RNA extraction and RT-qPCR
Total RNA was extracted from IOSE80, SKOV3, OVCAR3,
A2780 and CAOV3 cells by using TRIzol Reagent according to the
manufacturer's protocol. RNA concentration and purity were assessed
using a NanoDrop One Spectrophotometer (NanoDrop; Thermo Fisher
Scientific, Inc.), and only samples with A260/A280 ratios between
1.8 and 2.0 were used for subsequent experiments. RT was performed
using the PrimeScript™ RT Reagent Kit with gDNA Eraser (cat. no.
RR047A; Takara Bio, Inc.) according to the manufacturer's
instructions. Briefly, 1 µg total RNA was treated with gDNA Eraser
to remove genomic DNA contamination, followed by first-strand cDNA
synthesis in a total reaction volume of 20 µl. qPCR was performed
using PowerUp™ SYBR™ Green Master Mix (cat. no. A25742; Applied
Biosystems, Thermo Fisher Scientific) on ABI 7500 Fast Real-Time
PCR System (Applied Biosystems; Thermo Fisher Scientific, Inc.).
The thermocycling conditions were as follows: Initial UDG
activation at 50°C for 2 min and initial denaturation at 95°C for 2
min, followed by 40 cycles of denaturation at 95°C for 15 sec and
annealing/extension at 60°C for 1 min. A melting curve analysis was
conducted post-amplification to verify the specificity of the PCR
products. All reactions were performed in triplicate. Expression
levels were normalized to GAPDH as the endogenous control. The
relative quantification of gene expression was calculated using the
2−ΔΔCq method (28). The
following primers were used and synthesized by Sangon Biotech Co.,
Ltd.: ZBTB7A, forward 5′-GCAACATCTGCAAGGTCCGCTT-3′, reverse
5′-TCTTCAGGTCGTAGTTGTGGGC-3′; CRLF1, forward
5′-GAGACCTTCCTCCACACCAACT-3′, reverse 5′-CATAGGGCGTAAAGAGAGCCAG-3′;
and GAPDH, forward 5′-GTCTCCTCTGACTTCAACAGCG-3′, reverse
ACCACCCTGTTGCTGTAGCCAA-3′.
Western blotting
Total protein was extracted from IOSE80, SKOV3,
OVCAR3, A2780 and CAOV3 cell using RIPA lysis buffer (cat. no.
P0013B; Beyotime Biotechnology) supplemented with protease and
phosphatase inhibitors (cat. nos. 04693159001 and 04906837001;
Roche Diagnostics). Lysates were incubated on ice for 30 min with
vortexing every 10 min, then centrifuged at 12,000 × g for 15 min
at 4°C to collect the supernatant. Western blotting was performed
as described in our previous study (29). Briefly, protein concentrations were
determined using a BCA Protein Assay Kit (cat. no. 23225; Thermo
Fisher Scientific, Inc.) following the manufacturer's instructions.
Subsequently, proteins (~20 µg) were separated by SDS-PAGE on 8%
gels and transferred onto PVDF membranes, which were blocked in 5%
non-fat milk in Tris-buffered saline with 0.1% Tween-20 (TBST) for
1 h at room temperature. The membranes were then incubated
overnight at 4°C with the following primary antibodies: Anti-ZBTB7A
(rabbit polyclonal; cat. no. ab70208; 1:1,000; Abcam), anti-CRLF1
(rabbit polyclonal; cat. no. ab211438; 1:1,000; Abcam),
phosphorylated (p)-AKT (rabbit monoclonal; cat. no. 4060; 1:1,000;
Cell Signaling Technology, Inc.), AKT (rabbit monoclonal; cat. no.
4691; 1:1,000; Cell Signaling Technology, Inc.) and anti-GAPDH
(mouse monoclonal; cat. no. ab8245; 1:5,000; Abcam). After three
10-min washes in TBST, the membranes were incubated for 1 h at room
temperature with HRP-conjugated goat anti-rabbit IgG (cat. no.
7074; 1:5,000) or goat anti-mouse IgG (cat. no. 91196; 1:5,000)
secondary antibodies (both from Cell Signaling Technology, Inc.).
Protein bands were visualized using ECL reagent (cat. no. 32106;
Thermo Fisher Scientific, Inc.) and images were captured using the
ChemiDoc XRS+ imaging system (Bio-Rad Laboratories, Inc.). Band
intensities were semi-quantified using ImageJ software (version
1.53c; National Institutes of Health), and GAPDH was used as an
internal loading control.
Prediction of ZBTB7A downstream target
genes
Target genes were predicted using three
complementary TF-target prediction resources: hTFtarget (https://guolab.wchscu.cn/hTFtarget/#!/),
GRID (https://www.grid.ac/), and ChIP-Atlas
(https://chip-atlas.org). For hTFtarget and GRID,
predicted targets of ZBTB7A were retrieved based on curated
TF-target regulatory relationships. For ChIP-Atlas, ZBTB7A ChIP-seq
datasets were queried using the ‘Target Genes’ function with
default parameters. Candidate genes consistently identified across
all three databases were considered high-confidence ZBTB7A
downstream targets. The position weight matrix of ZBTB7A was
retrieved from the JASPAR database (https://jaspar.genereg.net), and promoter annotations
were obtained from the Eukaryotic Promoter Database (EPD;
http://epd.epfl.ch).
Cell Counting Kit-8 (CCK-8)
Cell viability was assessed using CCK-8 (cat. no.
CK04-11; Dojindo Laboratories, Inc.) according to the
manufacturer's instructions. Briefly, OV cells (OVCAR3 or A2780)
were seeded into 96-well plates at a density of 2×10³
cells/well in 100 µl complete medium and allowed to adhere
overnight. At the indicated time points (0, 24, 48 and 72 h), 10 µl
CCK-8 solution was added to each well and incubated for 2 h at 37°C
in a humidified incubator containing 5% CO2. Absorbance
was measured at 450 nm using a microplate reader (BioTek Synergy
H1; Agilent Technologies, Inc.). Each condition was tested in
triplicate and experiments were repeated independently at least
three times.
EdU assay
Cell proliferation was assessed using the Click-iT™
EdU Alexa Fluor™ 488 Imaging Kit (cat. no. C10337; Invitrogen;
Thermo Fisher Scientific, Inc.) according to the manufacturer's
protocol. Briefly, A2780 and OVCAR3 cells were seeded into 24-well
plates containing sterile glass coverslips at a density of
5×10⁴ cells/well and cultured overnight. The following
day, the cells were incubated with 10 µM EdU working solution for 2
h at 37°C under 5% CO2. Subsequently, the cells were
fixed with 4% paraformaldehyde for 15 min at room temperature and
permeabilized with 0.5% Triton X-100 in PBS for 20 min. The
Click-iT reaction cocktail containing Alexa Fluor 488 azide was
then added and allowed to react in the dark for 30 min at room
temperature. After washing, the nuclei were counterstained with
DAPI (5 µg/ml) for 10 min at room temperature. Coverslips were
mounted onto glass slides using anti-fade mounting medium and
images were captured using a fluorescence microscope (Leica DMi8 or
equivalent; Leica Microsystems, Inc.).
Colony formation assay
Clonogenic potential was evaluated using a standard
crystal violet staining assay. Briefly, A2780 and OVCAR3 cells were
seeded into 6-well plates at a low density of 500 cells/well, and
incubated for 10–14 days under standard culture conditions (37°C,
5% CO2). During this period, the culture medium was
replaced every 3–4 days to ensure optimal growth. Once visible
colonies (≥50 cells/colony) had formed, the plates were gently
washed twice with PBS and colonies were fixed with 4%
paraformaldehyde for 15 min at room temperature. After fixation,
the cells were stained with 0.1% crystal violet solution (prepared
in 20% methanol; MilliporeSigma) for 20–30 min at room temperature,
followed by thorough rinsing with distilled water to remove excess
stain. Finally, the plates were air-dried and images were
captured.
Transwell migration assays
Cell migration ability was evaluated using 24-well
Transwell chambers with 8.0-µm pore polycarbonate membranes (cat.
no. 3422; Costar, Corning, Inc.). Briefly, the cells were
serum-starved for 12 h prior to seeding. Subsequently,
~1×10⁵ OVCAR3 cells suspended in 200 µl serum-free
medium were added to the upper chamber of each insert, whereas 600
µl complete medium containing 10% FBS was placed in the lower
chamber as a chemoattractant. After incubation for 24 h at 37°C in
a humidified incubator with 5% CO2, non-migrating cells
on the upper surface of the membrane were gently removed using a
cotton swab. Migrated cells on the lower surface were fixed with 4%
paraformaldehyde for 15 min at room temperature and then stained
with 0.1% crystal violet for 20 min. The membranes were rinsed
gently with PBS and allowed to air dry. Images of stained cells in
at least five randomly selected fields per insert were captured
under a light microscope (×200 magnification; Olympus
Corporation).
Chromatin immunoprecipitation
(ChIP)-qPCR
ChIP was performed as previously described with
minor modifications (30). Briefly,
OVCAR3 cells were crosslinked with 1% formaldehyde at room
temperature for 10 min and quenched with 125 mM glycine for 5 min
at room temperature. The cells were then washed with cold PBS,
lysed with ChIP lysis buffer provided in the Magna ChIP™ A/G
Chromatin Immunoprecipitation Kit (cat. no. 17–10085;
MilliporeSigma) and chromatin was sheared by sonication on ice
using a Bioruptor sonicator (Diagenode SA) with 30 sec on/30 sec
off cycles for a total of 10–15 min (fixed-frequency sonication;
instrument settings: High power), to generate an average DNA
fragment size of 200–500 bp. Equal amounts of chromatin
(corresponding to 20 µg DNA per immunoprecipitation) were incubated
overnight at 4°C with anti-ZBTB7A (2 µg per reaction; cat. no.
ab70208; Abcam) or normal rabbit IgG as a negative control (2 µg
per reaction; cat. no. ab171870; Abcam). Immunocomplexes were
captured using 25 µl Protein A/G magnetic beads (cat. no. 88802;
Thermo Fisher Scientific, Inc.) for 2 h at 4°C with rotation. The
beads were sequentially washed with low-salt buffer (20 mM Tris-HCl
(pH 8.1), 150 mM NaCl, 2 mM EDTA, 1% Triton X-100, 0.1% SDS),
high-salt buffer (same as low-salt but with 500 mM NaCl), LiCl
buffer (10 mM Tris-HCl (pH 8.1), 250 mM LiCl, 1 mM EDTA, 1% NP-40,
1% sodium deoxycholate) and TE buffer (10 mM Tris-HCl (pH 8.0), 1
mM EDTA). Crosslinks were reversed at 65°C overnight, and the
samples were then treated with RNase A (0.2 mg/ml) at 37°C for 30
min, followed by proteinase K (0.2 mg/ml) at 55°C for 2 h.
Subsequently, DNA was purified and subjected to qPCR using SYBR
Green Master Mix (cat. no. A25742; Applied Biosystems; Thermo
Fisher Scientific, Inc.) on an ABI 7500 Fast Real-Time PCR System
(Applied Biosystems; Thermo Fisher Scientific, Inc.), under the
following thermocycling conditions: Initial denaturation at 95°C
for 2 min, followed by 40 cycles at 95°C for 15 sec and 60°C for 30
sec. Primer sequences used for ChIP-qPCR were as follows: CRLF1
promoter (ZBTB7A-binding region), forward
5′-ATCTCTGTGTACAAGGGTGCT-3′, reverse 5′-TTTCTAGGGAGGGTGGGAGTC-3′.
ChIP enrichment was calculated as percentage of input (%Input)
using the formula: %Input=100×2(Cq_Input-Cq_IP) ×
dilution factor.
Luciferase reporter assay
To assess the transcriptional regulation of CRLF1 by
ZBTB7A, a dual-luciferase reporter assay was conducted using the
Dual-Luciferase® Reporter Assay System (cat. no. E1910;
Promega Corporation). The 1 kb promoter region of CRLF1 (−900 to
+100 bp relative to the TSS) was cloned into the pGL3-Basic vector
(Promega Corporation) using KpnI and XhoI restriction
sites to generate the firefly luciferase reporter plasmid
(CRLF1-Luc). Full-length human ZBTB7A cDNA was cloned into the
pcDNA3.1(+) expression vector to generate the ZBTB7A-OE construct.
Subsequently, 293T cells were seeded in 24-well plates at a density
of 1.5×10⁵ cells/well and cultured overnight. The cells
were then co-transfected with 400 ng pGL3-CRLF1-Luc reporter
construct, 100 ng pRL-TK Renilla luciferase control vector
(cat. no. E2241; Promega Corporation) and 500 ng either
ZBTB7A-pcDNA3.1 or empty pcDNA3.1 vector (as a control) using
Lipofectamine 3000 transfection reagent, according to the
manufacturer's instructions. After 48 h of incubation, the cells
were harvested and luciferase activity was measured using the
Dual-Luciferase Reporter Assay System on a luminometer (GloMax
20/20; Promega Corporation). Firefly luciferase activity was
normalized to Renilla luciferase activity to control for
transfection efficiency. All experiments were performed in
triplicate and repeated at least three times independently.
Statistical analysis
All statistical analyses were performed using
GraphPad Prism 9.0 (Dotmatics). Quantitative data are presented as
the mean ± SD from at least three independent experiments.
Two-group comparisons were evaluated using the unpaired two-tailed
Student's t-test. Comparisons among multiple groups were performed
using one-way analysis of variance followed by Tukey's post hoc
test. P<0.05 was considered to indicate a statistically
significant difference. All experiments were independently repeated
at least three times to ensure reproducibility.
Results
ZBTB7A is upregulated in OV and is
associated with adverse OS
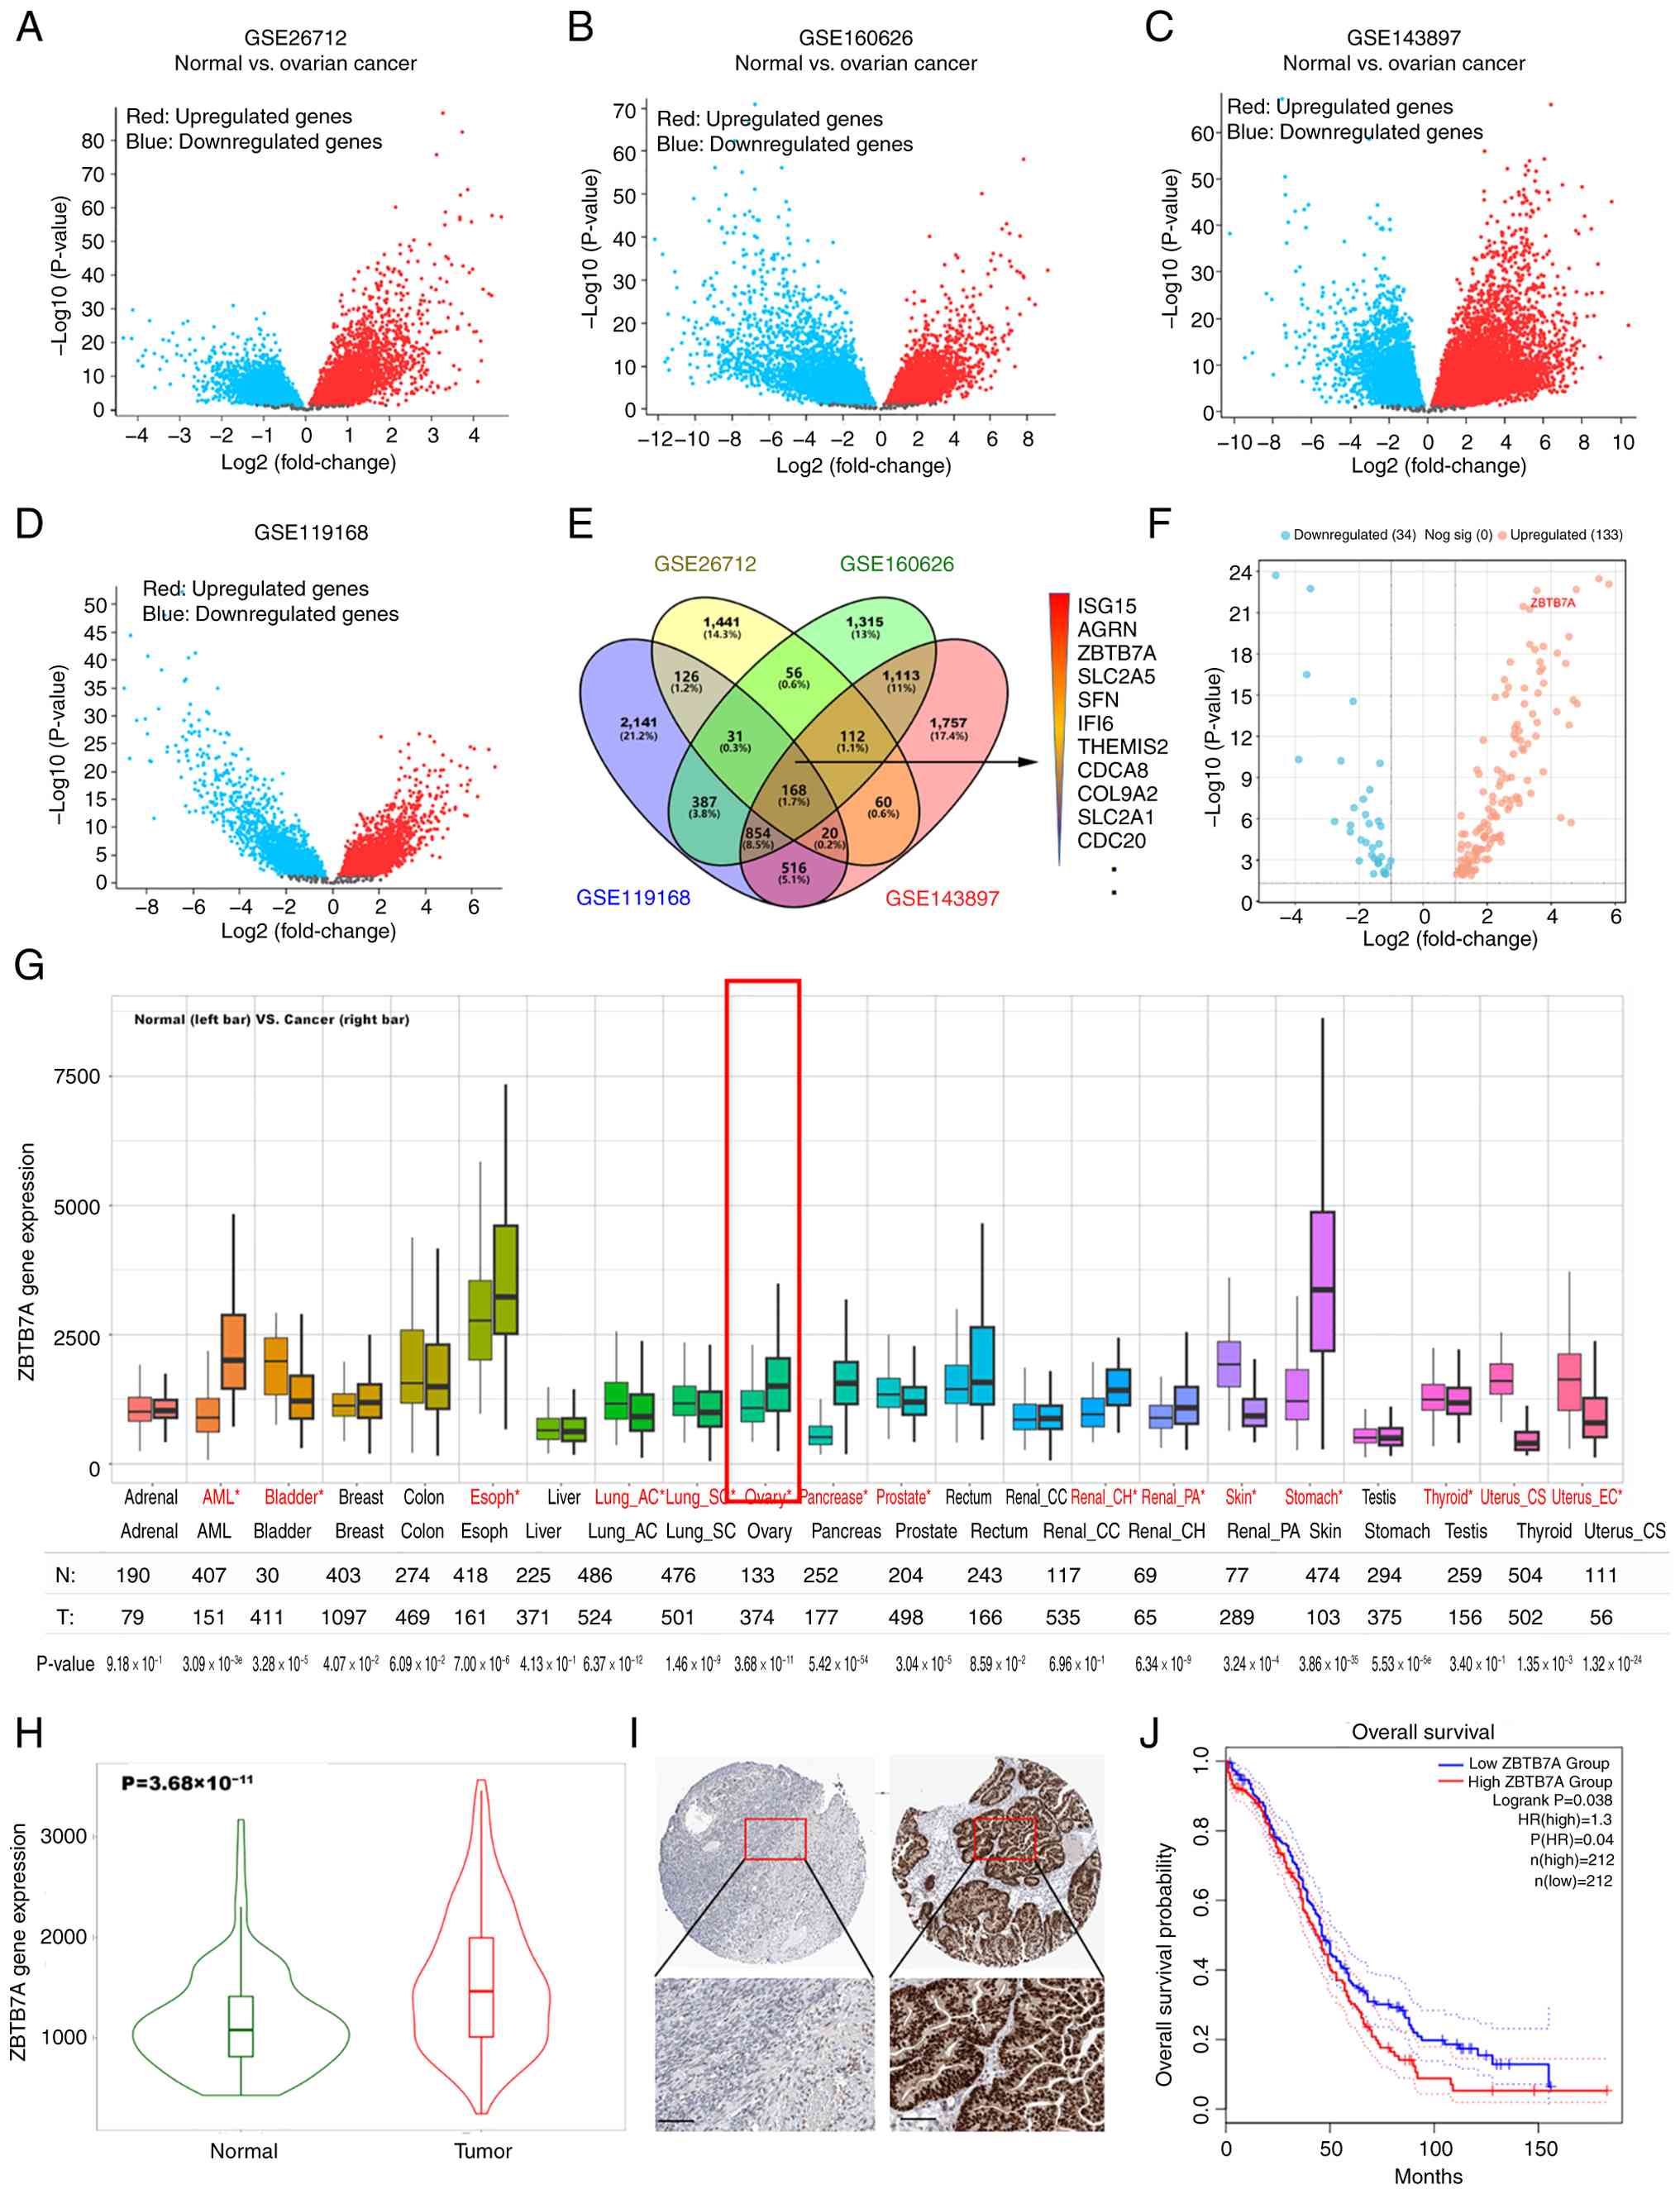
To identify DEGs in OV, four independent OV GEO
datasets (GSE26712, GSE160626, GSE143897 and GSE119168) were
analyzed. Each dataset revealed widespread transcriptional changes
between tumor and normal tissues (Fig.
1A-D). By intersecting the results, 168 common dysregulated
genes across all four cohorts were obtained. Among these, ZBTB7A
appeared consistently upregulated and was highlighted in a
representative volcano plot (Fig.
1F). To further evaluate the clinical relevance of ZBTB7A, its
expression was examined in pan-cancer datasets. As shown in
Fig. 1G, ZBTB7A was broadly
elevated across multiple tumor types, with OV showing one of the
most significant increases. A direct comparison of tumor and
healthy ovarian samples (TNMplot) confirmed this result, showing a
significant increase in ZBTB7A expression in ovarian tumor samples
(Fig. 1H). Protein-level evidence
was obtained from the Human Protein Atlas (HPA) dataset, where
immunohistochemistry images indicated stronger nuclear staining of
ZBTB7A in OV samples relative to healthy ovarian tissues (Fig. 1I). Consistently, Kaplan-Meier
survival analysis revealed that higher ZBTB7A expression was
significantly associated with a shorter OS (log-rank P=0.038;
Fig. 1J). Overall, these results
demonstrated that ZBTB7A was significantly upregulated in OV and
could serve as a marker of poor prognosis. Univariate and
multivariate Cox regression analyses using TCGA-OV cohort further
identified ZBTB7A expression as an independent prognostic factor
for OS after adjustment for age and tumor grade (Table I).
 | Table I.Univariate and multivariate Cox
regression analyses for overall survival in The Cancer Genome
Atlas-ovarian cancer cohort. |
Table I.
Univariate and multivariate Cox
regression analyses for overall survival in The Cancer Genome
Atlas-ovarian cancer cohort.
| Variable | Model | HR | 95% CI | P-value |
|---|
| ZBTB7A (high vs.
low) | Univariate | 1.38 | 1.01–1.88 | 0.042 |
| ZBTB7A (high vs.
low) | Multivariate
(adjusted for age and grade) | 1.43 | 1.05–1.96 | 0.024 |
| CRLF1 (high vs.
low) | Univariate | 1.33 | 0.98–1.81 | 0.070 |
| CRLF1 (high vs.
low) | Multivariate
(adjusted for age and grade) | 1.39 | 1.02–1.90 | 0.036 |
| Age (per
1-year) | Multivariate
(including ZBTB7A, age and grade) | 1.02 | 1.01–1.04 | 0.003 |
| Age (per
1-year) | Multivariate
(including CRLF1, age and grade) | 1.02 | 1.01–1.04 | 0.0048 |
Single-cell analysis localizes ZBTB7A
to tumor cells and links it to aggressive programs
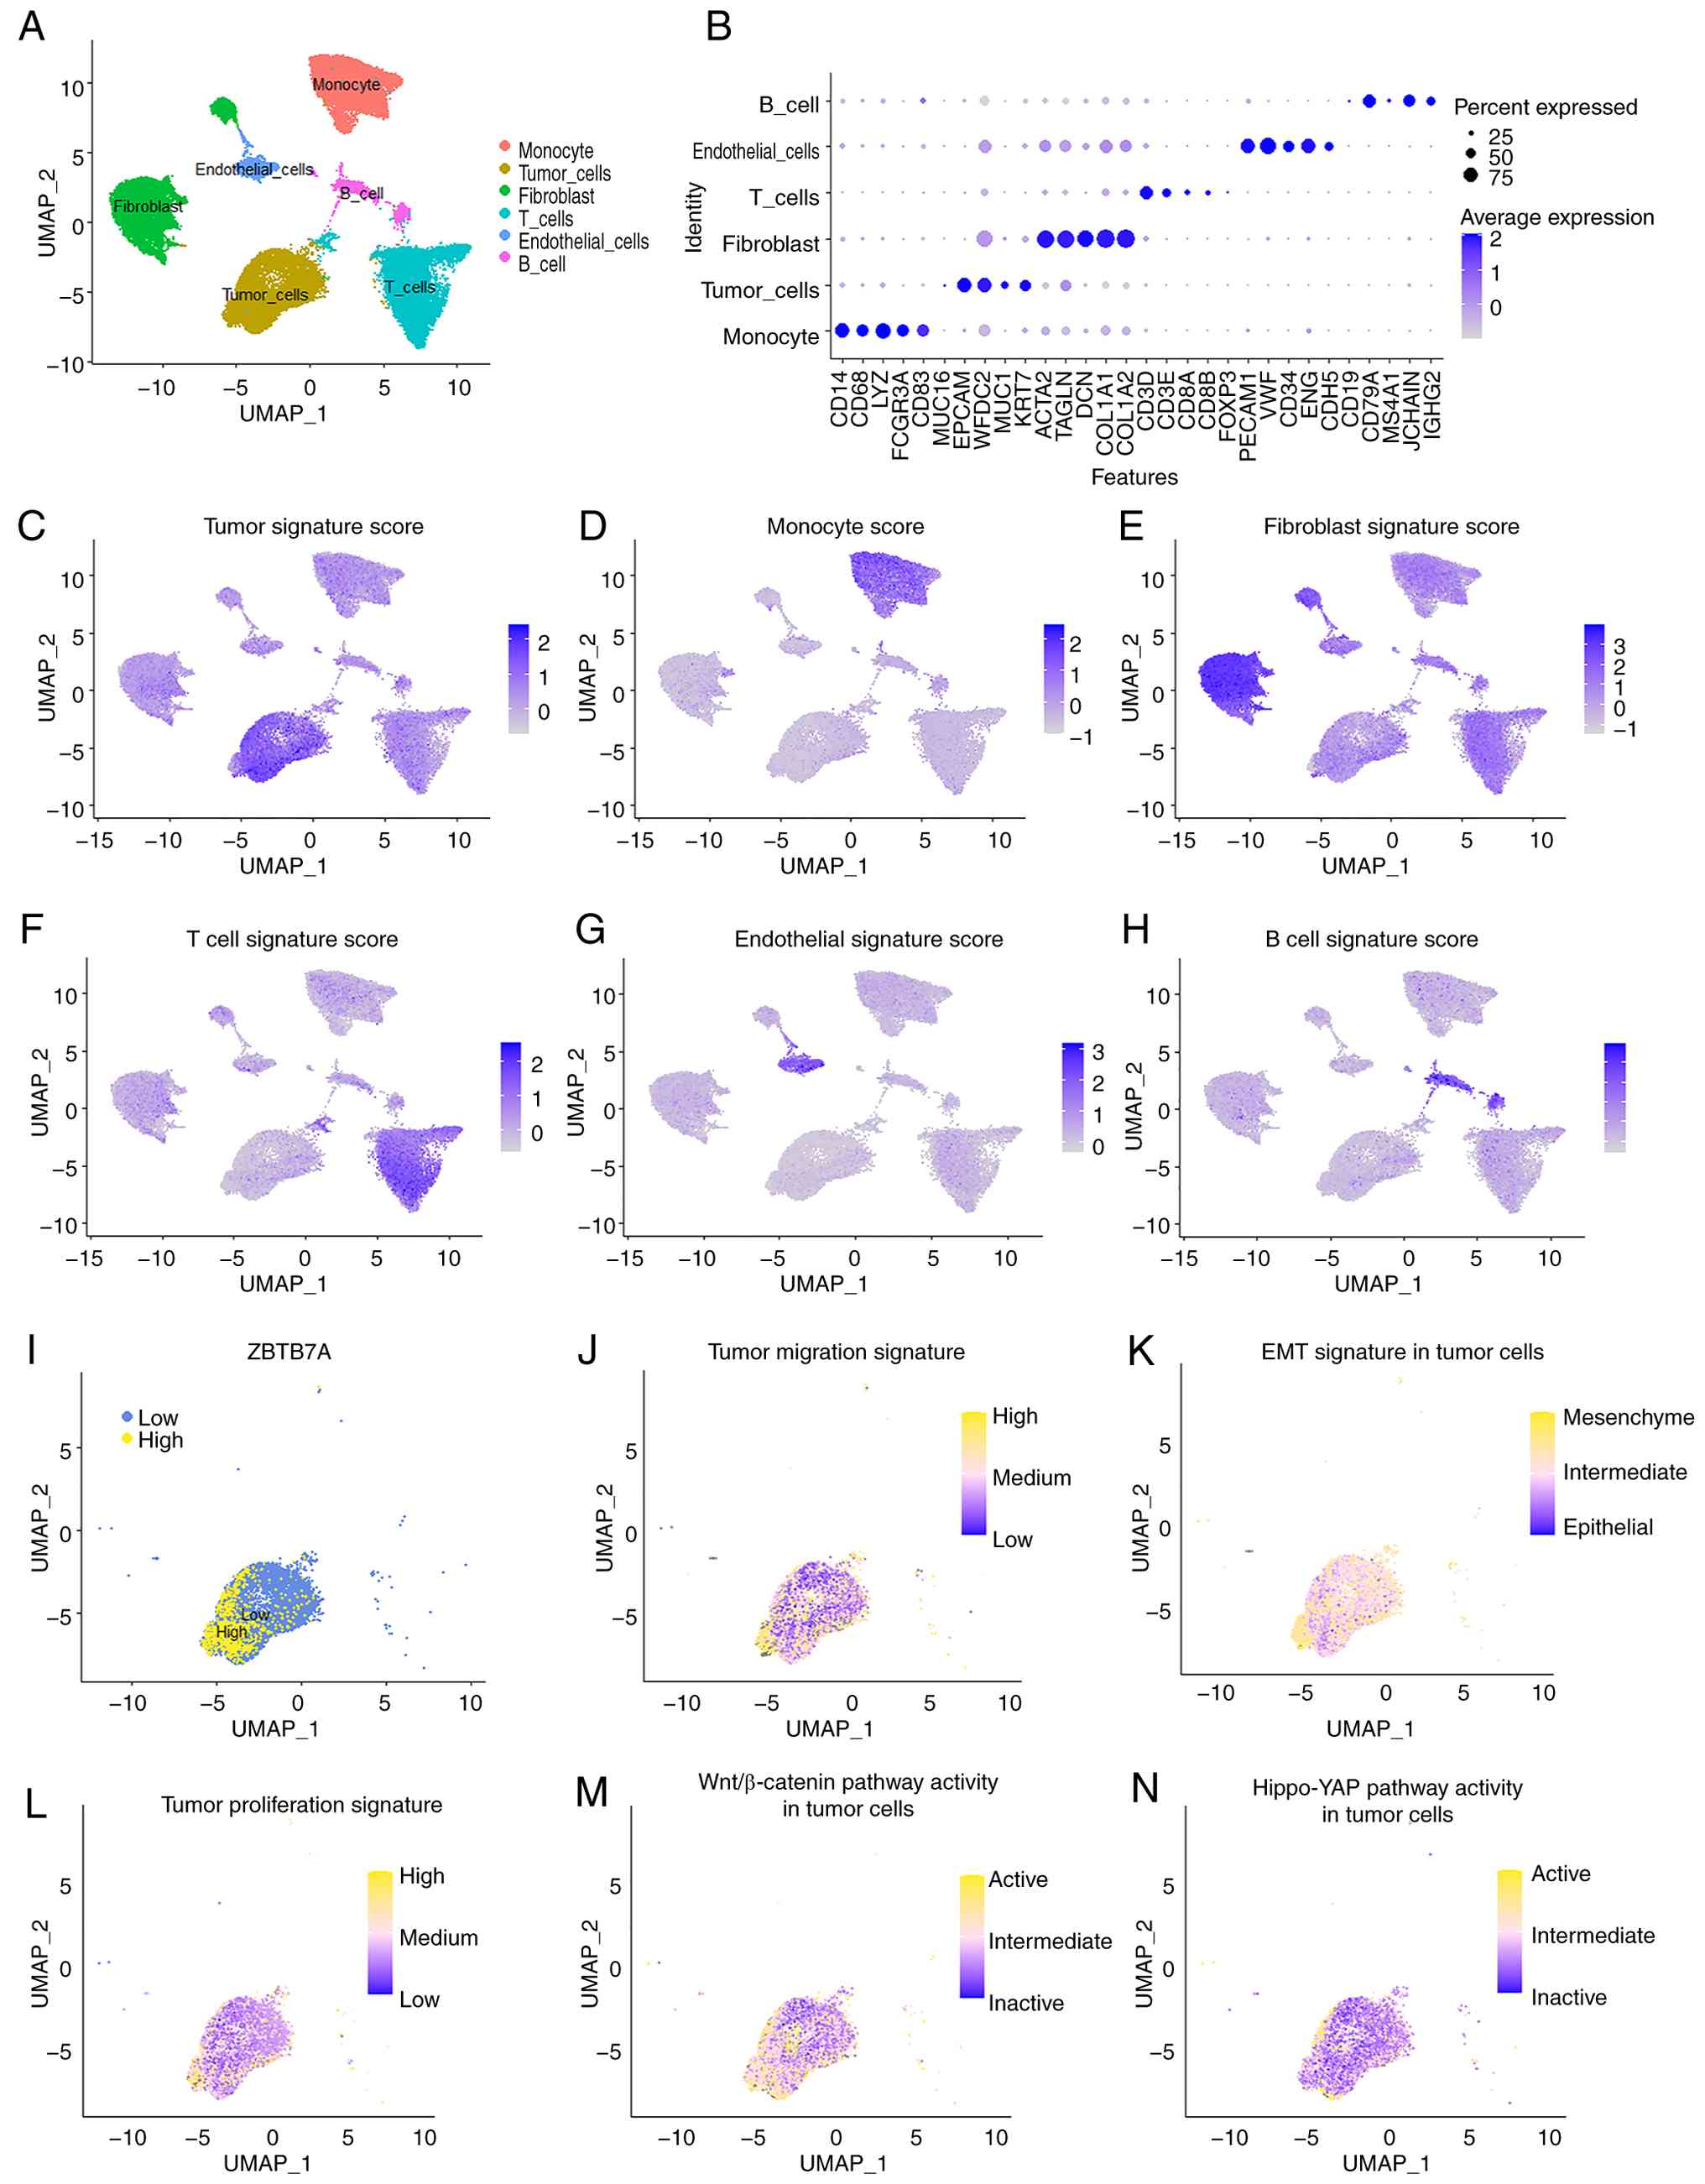
To further characterize the cellular distribution
and functional associations of ZBTB7A in OV, a single-cell RNA-seq
dataset of ovarian tumors was analyzed. UMAP clustering identified
the major cell populations, including malignant epithelial cells,
fibroblasts, endothelial cells, monocytes, T cells and B cells,
each defined by canonical marker expression (Fig. 2A and B). Module scoring confirmed
that the annotated clusters captured expected lineage-specific
signatures (Fig. 2C-H). Next,
downstream analyses were restricted to the malignant epithelial
(tumor) compartment, and tumor cells were stratified into
ZBTB7A-high and ZBTB7A-low groups (Fig.
2I). Notably, tumor cells exhibiting high ZBTB7A expression
displayed markedly increased scores for migration, EMT and
proliferation compared with ZBTB7A-low counterparts (Fig. 2J-L). Pathway enrichment at the
single-cell level further supported these associations. ZBTB7A-high
tumor cells showed higher activities of the Wnt/β-catenin and
Hippo-YAP signaling pathways, both of which are well known to drive
OV progression (Fig. 2M and N).
Together, these analyses demonstrate that within the tumor cell
compartment, high ZBTB7A may mark an aggressive transcriptional
state characterized by enhanced motility, EMT, proliferative drive
and activation of malignancy-associated pathways.
ZBTB7A promotes the proliferation and
migration of OV cells
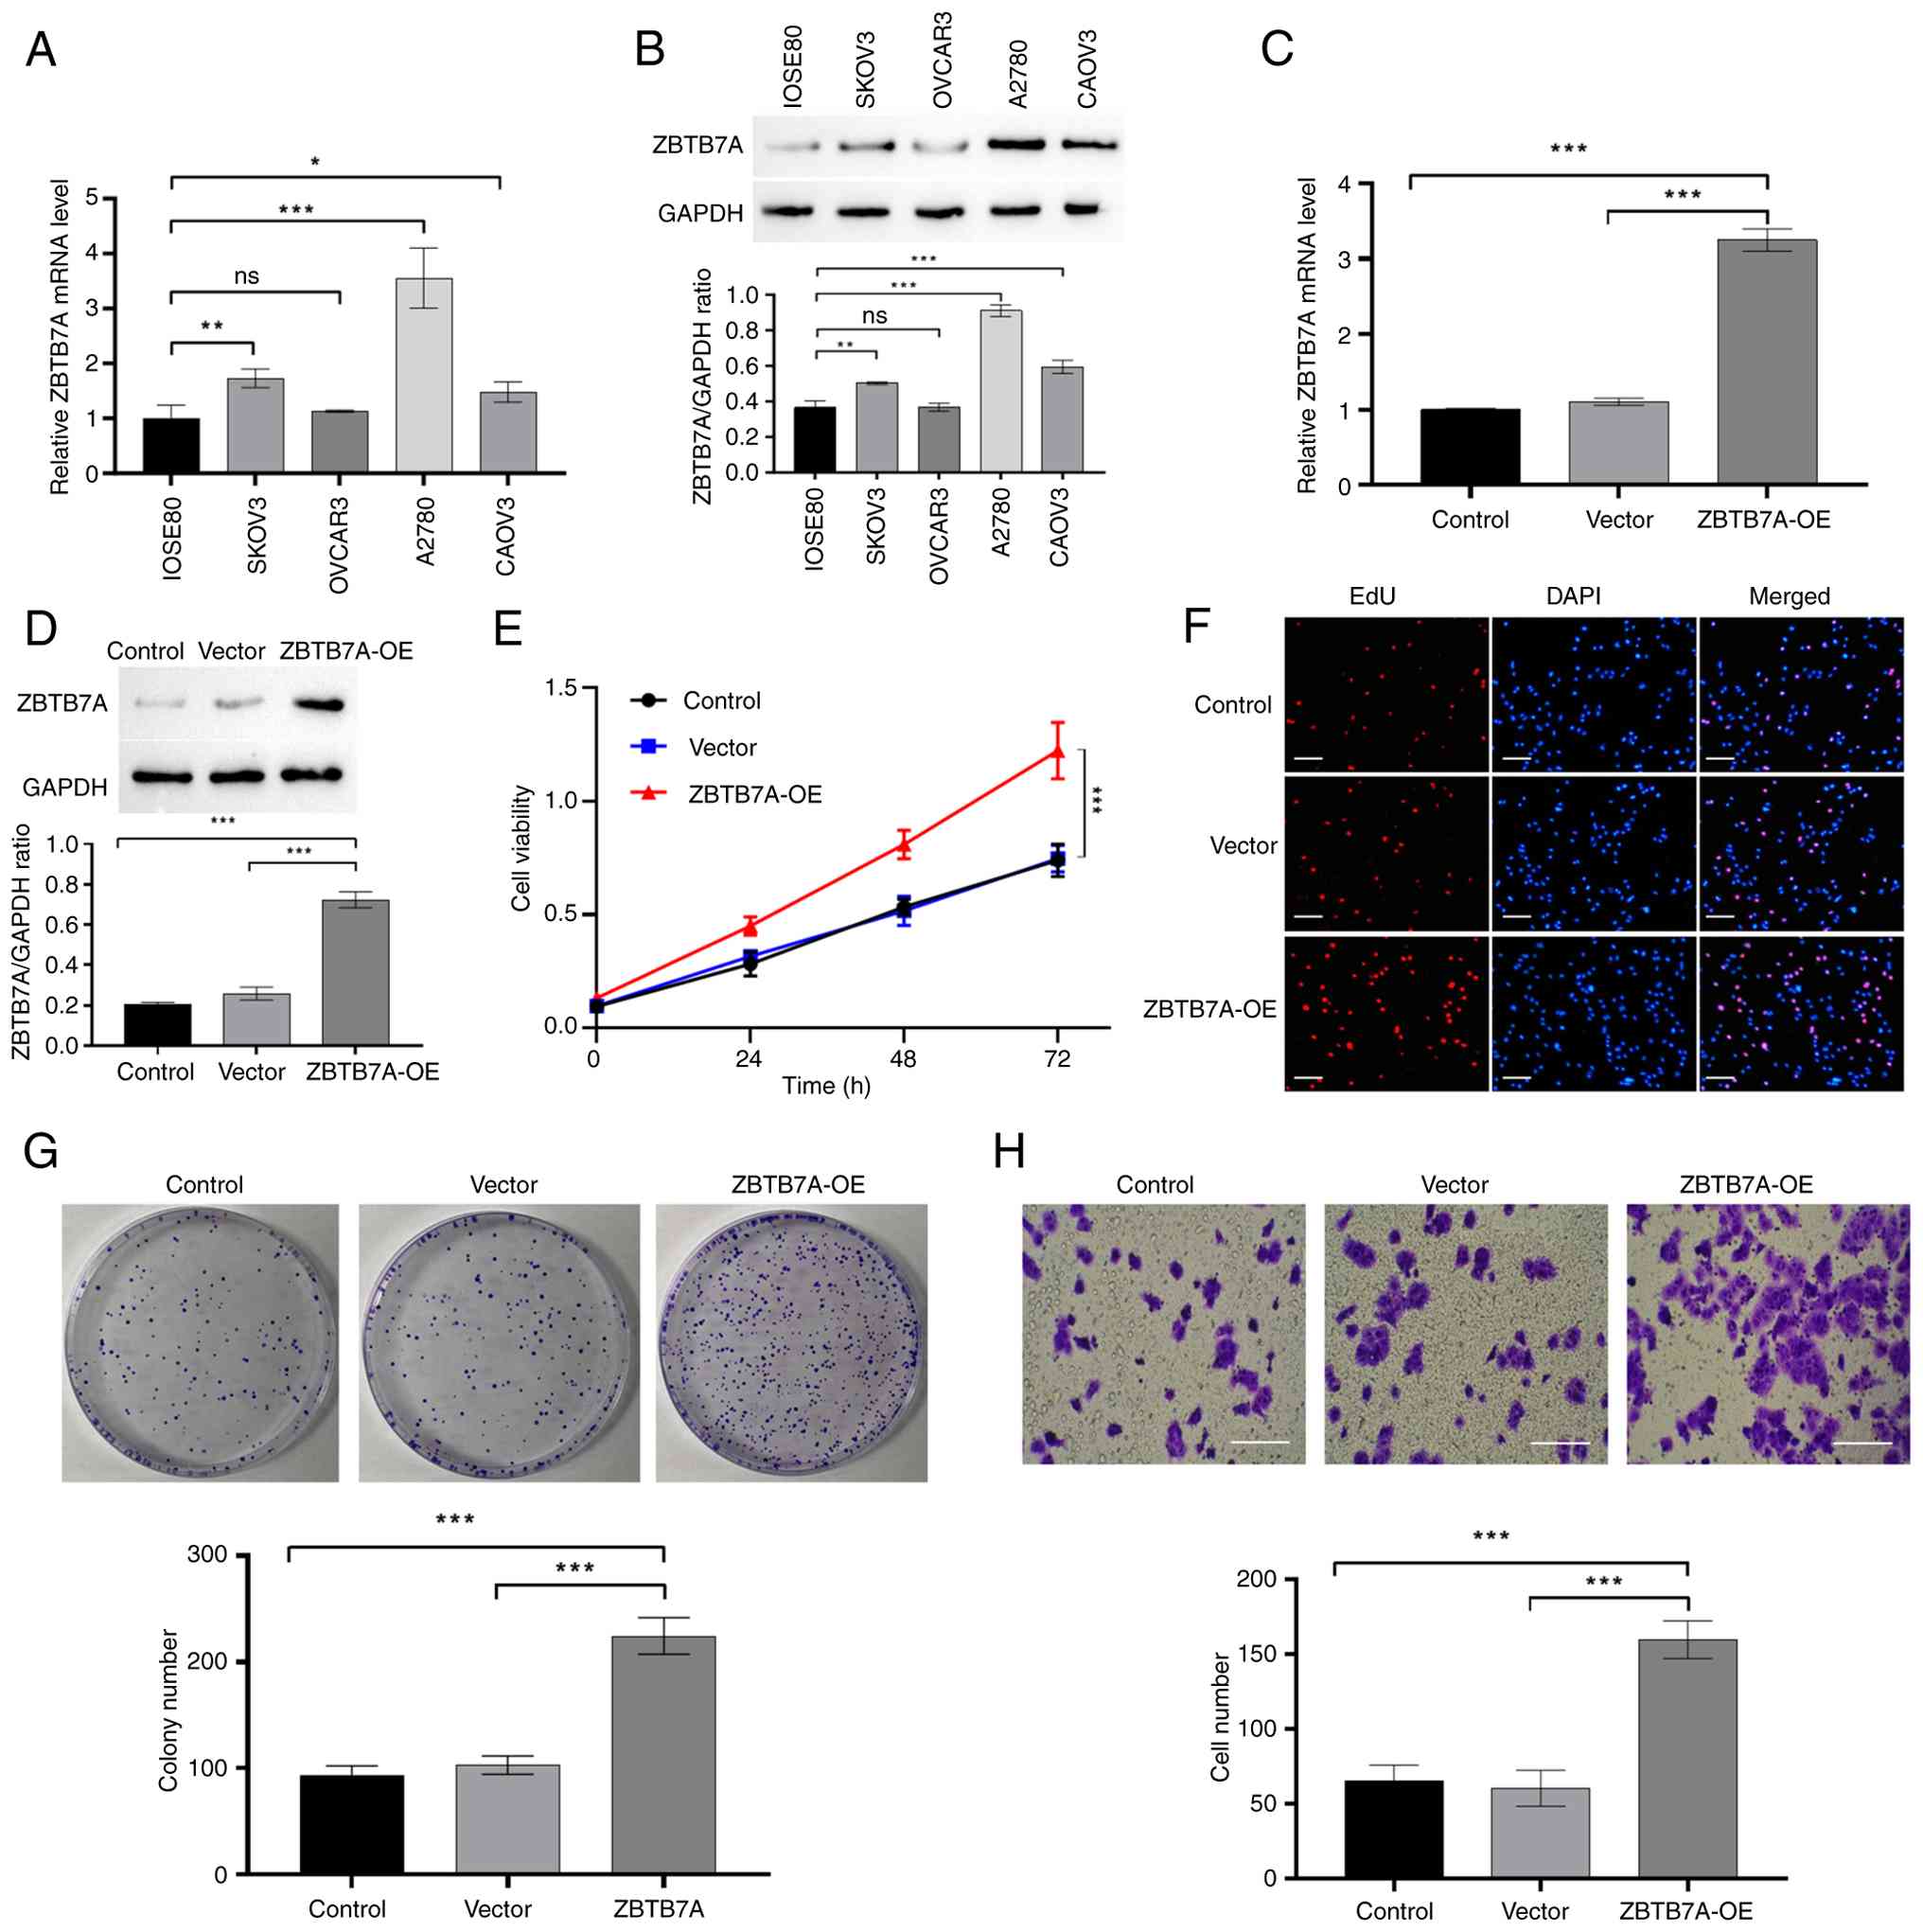
To determine the functional role of ZBTB7A in OV
cells, the endogenous expression of ZBTB7A across a panel of human
ovarian cell lines was first examined, including the normal ovarian
surface epithelial line IOSE80, and the OV cell lines SKOV3,
OVCAR3, A2780 and CAOV3. RT-qPCR and western blotting revealed that
ZBTB7A was expressed at varying levels across these cells, with
relatively high expression in A2780 and the lowest expression
observed in OVCAR3 cells among the OV cell lines (Fig. 3A and B). Subsequently, OVCAR3 cells,
which showed the lowest basal ZBTB7A expression, were selected for
overexpression experiments, and successful overexpression was
confirmed at both the mRNA and protein levels (Fig. 3C and D).
Functionally, overexpression of ZBTB7A in OVCAR3
cells markedly promoted malignant phenotypes. In the CCK-8 assay,
ZBTB7A-OE cells displayed a clear, time-dependent increase in
viability compared with that in the vector control group (Fig. 3E). The EdU incorporation assay
further confirmed this proliferative advantage, as ZBTB7A-OE cells
exhibited a higher proportion of EdU-positive nuclei, reflecting
enhanced DNA synthesis and cell-cycle progression (Fig. 3F). To extend these findings, a
colony formation assay was performed, which demonstrated that
ZBTB7A significantly increased clonogenic potential, with
overexpressing cells forming a greater number of larger colonies
compared with that in the control group. In addition, the Transwell
assay showed a significant increase in the number of migrating
cells in the ZBTB7A-OE group, indicating that ZBTB7A may promote a
more migratory phenotype (Fig. 3H).
Taken together, these gain-of-function experiments indicated that
ZBTB7A-OE could enhance cell viability, proliferation, clonogenic
survival and motility, supporting a pro-oncogenic role for ZBTB7A
in OV.
ZBTB7A knockdown suppresses the
proliferation and migration of OV cells
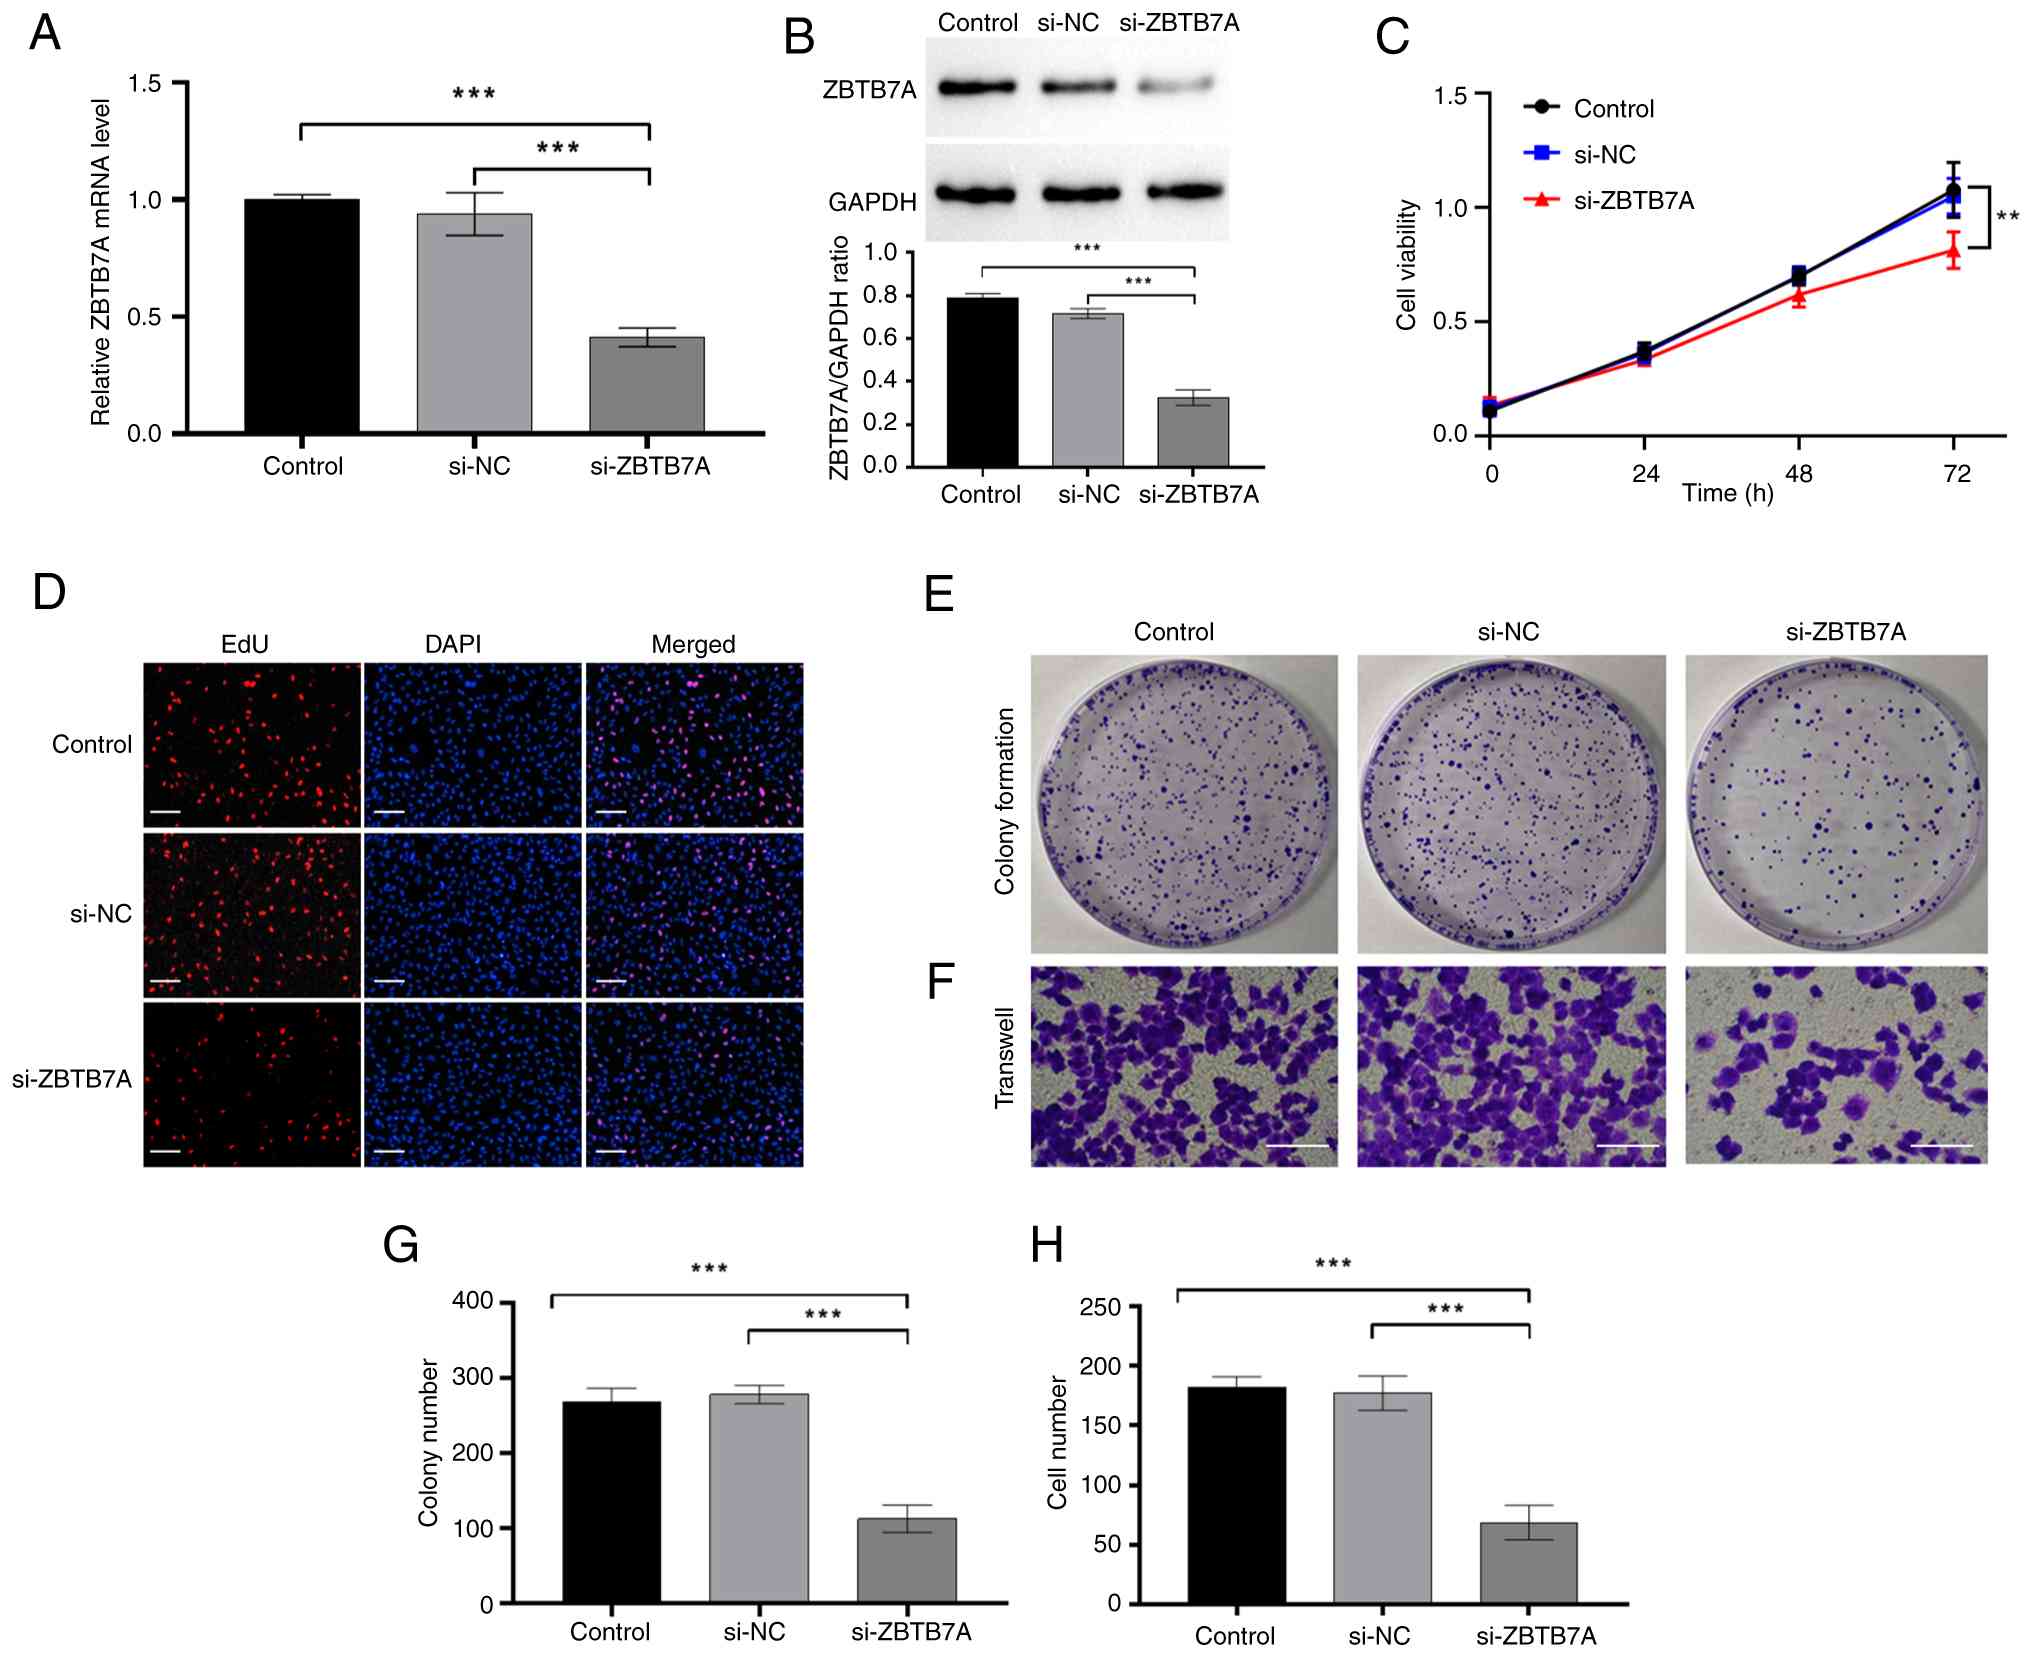
To complement the overexpression studies, the
present study investigated the effects of ZBTB7A loss-of-function.
Basal expression profiling indicated that A2780 cells expressed
relatively high levels of ZBTB7A, and were therefore selected for
knockdown experiments. Transfection with si-ZBTB7A effectively
reduced both the mRNA and protein levels of ZBTB7A, as confirmed by
RT-qPCR and western blotting (Fig. 4A
and B).
Functionally, silencing ZBTB7A significantly
impaired OV cell behaviors. In the CCK-8 assays, si-ZBTB7A A2780
cells exhibited markedly reduced viability compared with that in
the si-NC cells (Fig. 4C). The EdU
assay further confirmed diminished proliferative activity, with a
lower proportion of EdU-positive nuclei following ZBTB7A knockdown
(Fig. 4D). Moreover, long-term
colony formation assays revealed a significant reduction in both
the number and size of colonies, indicating a loss of clonogenic
potential in si-ZBTB7A A2780 cells (Fig. 4E). Similarly, the Transwell assay
showed that ZBTB7A knockdown markedly decreased the number of
migrating A2780 cells, reflecting impaired motility (Fig. 4F). Semi-quantitative analyses
consistently supported these inhibitory effects (Fig. 4G and H). Together, these results
provided strong evidence that ZBTB7A was required for promoting the
proliferation, clonogenic survival and migration of OV cells,
reinforcing its role as an oncogenic driver.
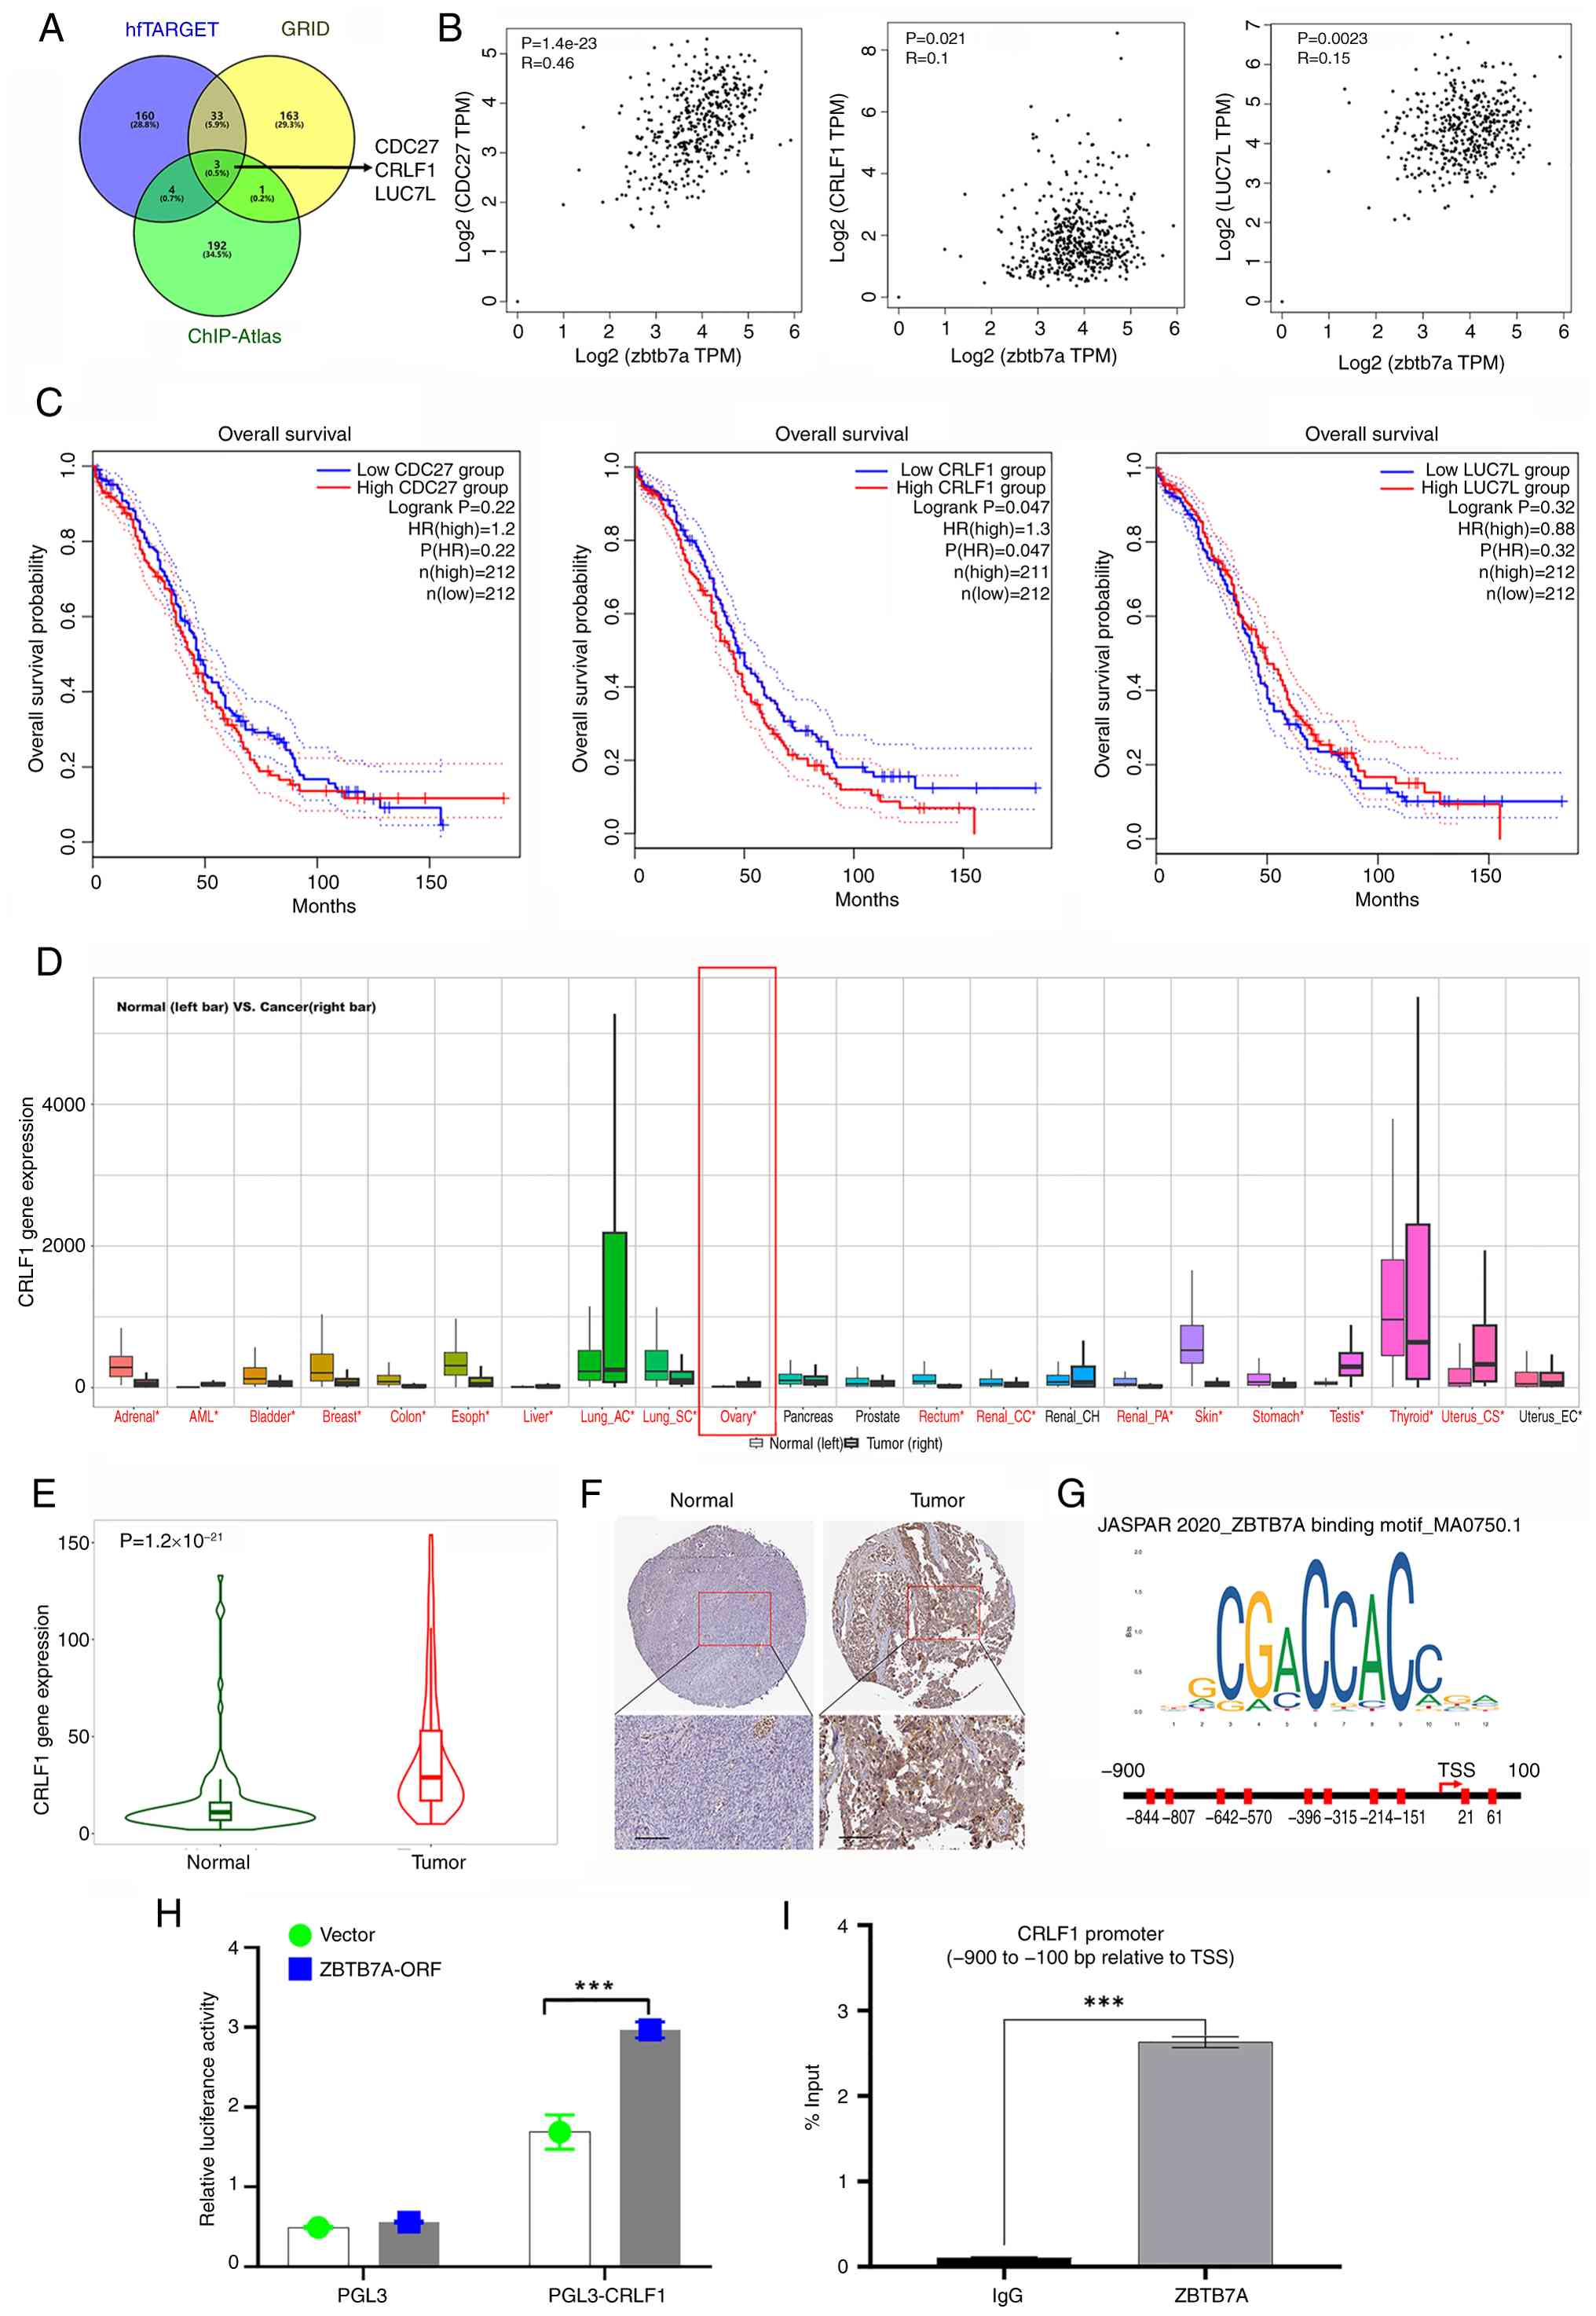
CRLF1 is identified as a downstream
target of ZBTB7A and is clinically relevant in OV
Given that ZBTB7A is a classical TF, the present
study aimed to predict its potential downstream targets. To
identify these targets, the findings of three complementary
TF-target prediction platforms were combined: hfTarget, GRID and
ChIP-Atlas. Cross-database intersection analysis revealed three
overlapping candidate genes: CDC27, CRLF1 and LUC7L, which were
consistently predicted to be regulated by ZBTB7A. Subsequently, the
correlation between these candidates and ZBTB7A was analyzed in
TCGA-OV cohort. The results revealed that CDC27 expression
exhibited a moderate positive correlation with ZBTB7A, whereas
CRLF1 and LUC7L showed weak but significant correlations with
ZBTB7A, suggesting that they may indeed be co-regulated (Fig. 5B). The prognostic value of these
candidates was then assessed. Kaplan-Meier analysis revealed that
higher expression of CRLF1, but not CDC27 or LUC7L, was
significantly associated with a poorer OS in patients with OV
(Fig. 5C). Notably, survival
analysis revealed that only CRLF1 mirrored the clinical outcome
pattern of ZBTB7A. Based on this concordance between expression,
correlation and prognostic outcome, CRLF1 was selected as the most
relevant downstream candidate for further analysis. Next, CRLF1
expression was also analyzed in pan-cancer datasets. As shown in
Fig. 5D, CRLF1 was elevated in
several tumor types, with OV displaying one of the most significant
increases. Consistent with this, direct comparison between ovarian
tumor and healthy samples confirmed significantly increased CRLF1
expression (Fig. 5E).
In univariate Cox regression, high ZBTB7A expression
was associated with an increased risk of death (HR=1.38, 95% CI:
1.01–1.88, P=0.042), and high CRLF1 expression showed a similar
trend, but this was not significant (HR=1.33, 95% CI: 0.98–1.81)
(Table I). To determine whether
ZBTB7A and CRLF1 are independent prognostic factors, multivariate
Cox models adjusting for age and tumor grade were further
constructed. High ZBTB7A expression remained significantly
associated with poor OS (HR=1.43, 95% CI: 1.05–1.96, P=0.024), as
did high CRLF1 expression (HR=1.39, 95% CI: 1.02–1.90, P=0.036).
Age was also independently associated with OS (HR per 1-year
increase=1.02, P<0.005), whereas tumor grade did not reach
statistical significance in this cohort. These data indicated that
both ZBTB7A and CRLF1 serve as independent adverse prognostic
biomarkers in OV (Table I).
In addition, protein-level evidence from the HPA
database further supported these findings: Immunohistochemistry
revealed stronger CRLF1 staining in ovarian tumor tissues compared
with in normal ovarian tissues (Fig.
5F). To further investigate the transcriptional regulation of
CRLF1 by ZBTB7A, the binding motif of ZBTB7A was obtained from the
JASPAR database, and the CRLF1 promoter region (−900 to +100 bp
relative to the TSS) was defined based on the EPD. Potential
ZBTB7A-binding sites within this promoter region were subsequently
identified through motif scanning analysis (Fig. 5G). Subsequently, the 1 kb region of
the CRLF1 promoter was cloned into the pGL3 vector to perform a
luciferase assay, and the ZBTB7A open reading frame was cloned into
the pcDNA3 vector for co-transfection into 293T cells. As shown in
Fig. 5H, cells transfected with the
CRLF1 promoter construct exhibited markedly higher luciferase
activity compared with the empty vector control. Notably, ZBTB7A-OE
further enhanced CRLF1 promoter activity, whereas no increase was
observed in the pGL3 empty vector group (Fig. 5H). Moreover, ChIP-qPCR analysis
demonstrated significant enrichment of ZBTB7A at the CRLF1 promoter
region (−900 to −100 bp relative to the TSS), indicating that
ZBTB7A may directly occupy the CRLF1 promoter in OVCAR3 cells
(Fig. 5I). Together, these results
demonstrated that ZBTB7A may directly enhance CRLF1 transcriptional
activity through promoter binding, thereby establishing CRLF1 as a
functional downstream effector that mediates the oncogenic role of
ZBTB7A in OV.
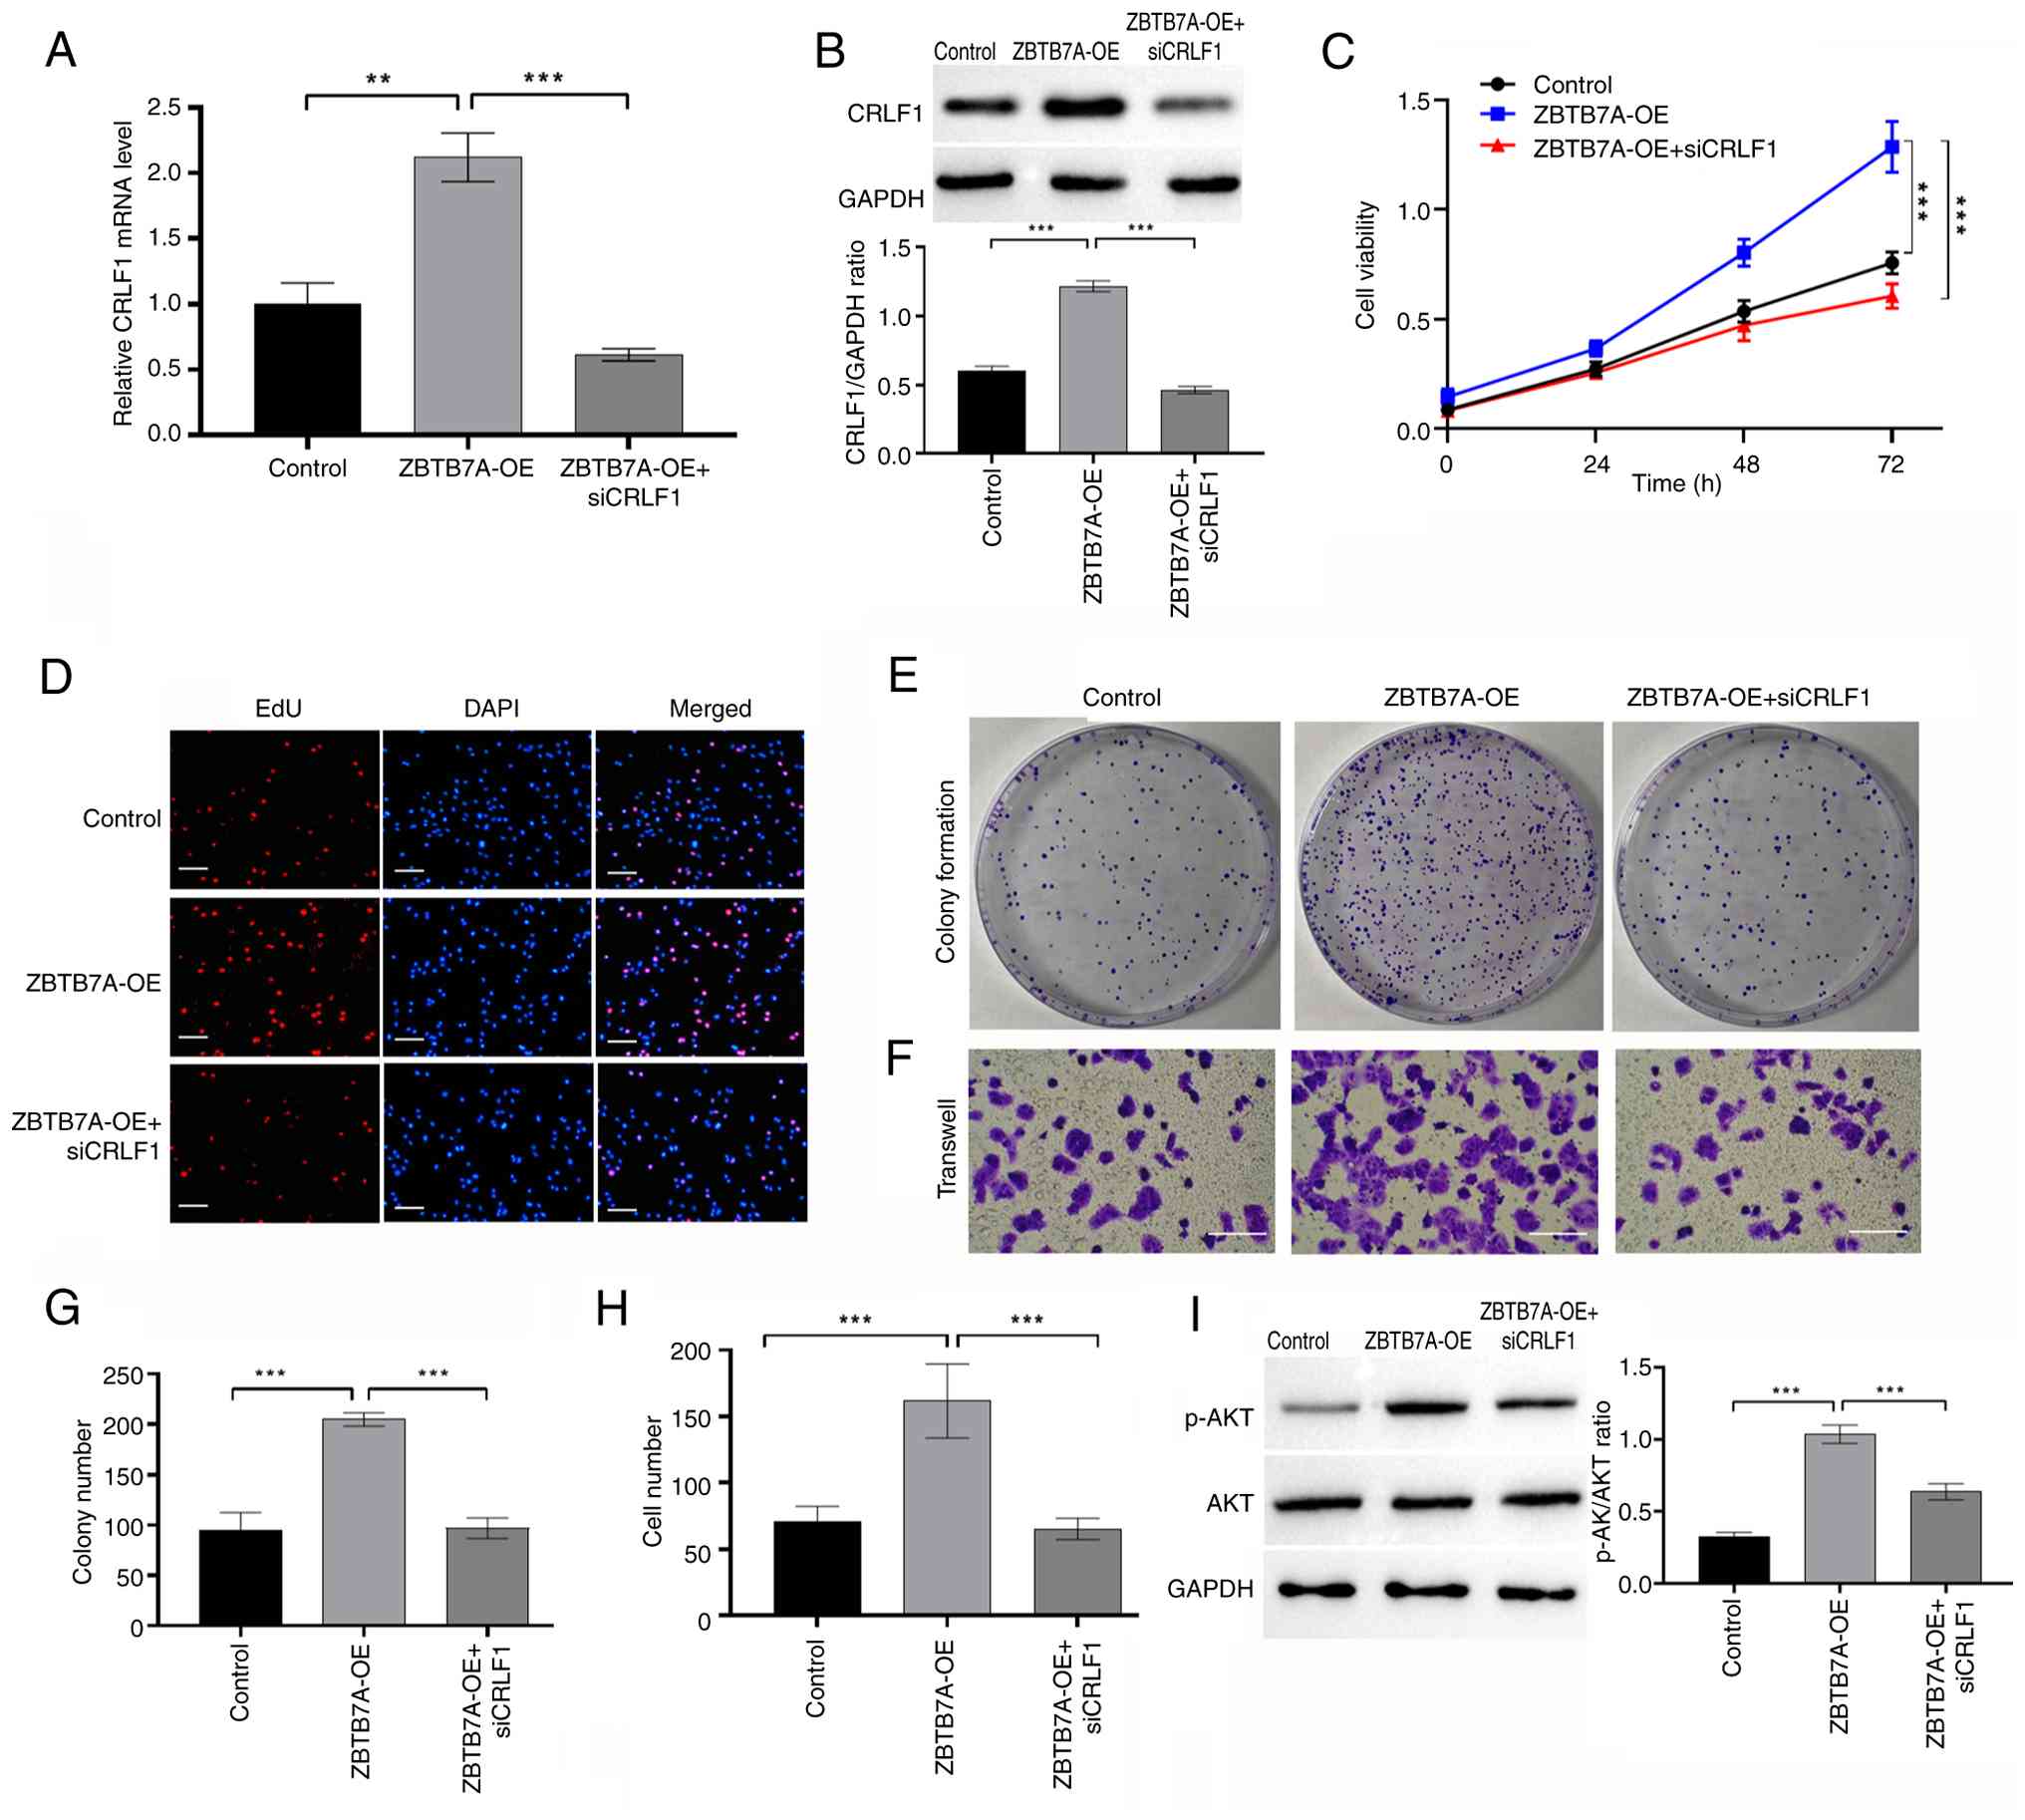
CRLF1 mediates the oncogenic effects
of ZBTB7A in OV cells
To assess whether CRLF1 acts downstream of ZBTB7A,
its expression was examined following ZBTB7A-OE in OVCAR3 cells.
Both RT-qPCR and western blotting confirmed that ZBTB7A-OE led to a
significant increase in CRLF1 mRNA and protein levels (Fig 6A and B). Conversely, targeted
knockdown of CRLF1 using a siRNA efficiently reduced its expression
(Fig. S1), as verified by RT-qPCR
and western blotting. Functional assays showed that knockdown of
CRLF1 significantly attenuated the oncogenic phenotypes induced by
ZBTB7A. Specifically, cells were co-transfected with the ZBTB7A-OE
plasmid and siCRLF1, and the CCK-8 assay demonstrated that CRLF1
knockdown attenuated the enhanced cell viability induced by
ZBTB7A-OE (Fig. 6C). Furthermore,
the EdU assay confirmed that siCRLF1 blocked the ZBTB7A-OE-induced
increase in DNA synthesis and proliferative activity (Fig. 6D). The colony formation assay
further revealed that CRLF1 knockdown diminished both the number
and size of colonies induced by ZBTB7A-OE (Fig. 6E). Finally, a Transwell migration
assay showed that siCRLF1 markedly suppressed the pro-migratory
effect of ZBTB7A-OE on OVCAR3 cells (Fig. 6F). Semi-quantitative analyses
consistently demonstrated that CRLF1 knockdown largely reversed the
proliferation and migration mediated by ZBTB7A (Fig. 6G and H). To further elucidate the
downstream signaling mechanism, the activation status of the
PI3K/AKT pathway was examined. Western blot analysis showed that
ZBTB7A-OE significantly increased the levels of phosphorylated AKT,
whereas CRLF1 knockdown markedly attenuated AKT phosphorylation
without affecting total AKT expression (Fig. 6I). These findings indicated that
CRLF1 may be required for ZBTB7A-induced activation of AKT
signaling. Collectively, these results identified CRLF1 as a
functional downstream effector of ZBTB7A and highlighted that the
oncogenic properties of ZBTB7A in OV are mediated, at least in
part, through its regulation of CRLF1.
Discussion
OV remains a high-mortality malignancy characterized
by late diagnosis, rapid intraperitoneal dissemination, marked
molecular heterogeneity and frequent development of therapeutic
resistance. These challenges highlight the need for new biological
entry points beyond current strategies (2,5).
Because TFs orchestrate the gene-expression states underlying
proliferation, EMT and metastatic competence, delineating
TF-centered circuits offers a plausible route to biomarkers and
tractable downstream targets (31).
In the current study, ZBTB7A was identified as a TF that was
aberrantly upregulated in OV. Integrative analyses across
independent patient cohorts demonstrated that elevated ZBTB7A
expression was associated with a poor OS. Moreover, single-cell
transcriptomic profiling revealed that ZBTB7A-high malignant cells
were enriched for proliferative, migratory and EMT-related gene
programs. Consistent with these transcriptomic features, gain and
loss-of-function experiments revealed that ZBTB7A could promote
cell viability, colony formation and migration, whereas ZBTB7A
knockdown reduced these phenotypes. Mechanistically, ZBTB7A
activated CRLF1 transcription, and CRLF1 silencing attenuated the
ZBTB7A-driven increases in cell proliferation and migration.
Collectively, these findings support a model in which a
ZBTB7A/CRLF1 transcriptional axis promotes OV aggressiveness.
TFs serve a pivotal role in the oncogenic programs
of OV, directing cellular identity, survival, proliferation and
plasticity in response to intrinsic mutations and extrinsic
environmental signals (8,9). Increasing evidence has indicated that
OV cells rely on transcriptional regulators to maintain their
malignant phenotypes and adapt to therapeutic stress. For example,
paired box 8, a lineage-specific TF essential, is frequently
amplified in high-grade serous OV, and regulates genes involved in
metabolism and proliferation (16,32).
Similarly, FOXM1 promotes G2/M transition and genomic
stability, and its upregulation is associated with poor survival
and platinum resistance (33,34).
Canonical EMT regulators such as SNAI1, TWIST1 and ZEB1 suppress
epithelial markers, and facilitate dissemination and immune evasion
(35–37). The findings of the present study
revealed that ZBTB7A may act as an oncogenic TF, identifying it as
an upstream regulator associated with poor clinical outcomes and
aggressive cellular phenotypes. Unlike classical EMT TFs that
function through direct suppression of epithelial genes such as
cadherin-1, in the present study, ZBTB7A was shown to act as a
transcriptional activator. The results revealed that it upregulated
CRLF1, a secreted CRLF previously linked to pro-survival signaling
in neuronal and fibrotic contexts (38). The oncogenic role of CRLF1 remains
poorly characterized; however, emerging evidence suggests its
involvement in activating the JAK-STAT, PI3K/AKT and MAPK/ERK
signaling pathways, which are known to contribute to OV
progression, stemness and chemoresistance (39,40).
CRLF1 is a secreted glycoprotein that forms heterodimeric
complexes, most notably with cardiotrophin-like cytokine factor 1,
to activate gp130 and ciliary neurotrophic factor receptor
signaling (41), ultimately
engaging JAK-STAT, MAPK/ERK and PI3K/AKT pathways (40). These pathways are frequently
hyperactivated in OV and contribute to key malignant properties
such as cell survival, migration, stemness maintenance and
resistance to chemotherapy. Although the role of CRLF1 in OV
remains poorly characterized, emerging evidence suggests its
involvement in activating the JAK-STAT, PI3K/AKT, and MAPK/ERK
signaling pathways, prompting further investigation into its
potential oncogenic function (40,42).
To the best of our knowledge, the present study provided the first
evidence that CRLF1 is transcriptionally induced by ZBTB7A and
mediates key oncogenic outputs downstream of ZBTB7A. Silencing
CRLF1 significantly impaired ZBTB7A-driven cell proliferation and
motility, indicating that CRLF1 is not merely a transcriptional
target but a functionally important downstream effector. Given the
role of CRLF1 in cytokine signaling, these findings suggest that
ZBTB7A-driven CRLF1 expression may reinforce a tumor-promoting
autocrine/paracrine microenvironment, allowing cancer cells to
co-opt developmental cytokine circuits for malignant gain.
Despite these insights, the present study has
several limitations. First, although it was demonstrated that
ZBTB7A transcriptionally activates CRLF1 and that CRLF1 contributes
to downstream oncogenic function, the precise downstream signaling
pathways through which CRLF1 exerts these effects remain
incompletely elucidated. Second, the in vitro assays
provided mechanistic insights into the role of the ZBTB7A/CRLF1
axis in promoting OV cell proliferation and migration; however, the
absence of an in vivo study limits the full assessment of
its functional relevance in the native tumor microenvironment.
Future studies will therefore focus on in vivo validation of
the ZBTB7A/CRLF1 axis. These will include OV xenograft models using
cells with stable ZBTB7A-OE or knockdown and/or CRLF1 silencing to
assess tumor growth, tumor burden and survival outcomes. In
addition, orthotopic or intraperitoneal implantation models will be
employed to better recapitulate OV dissemination and ascites
formation. Third, the broader clinical applicability of ZBTB7A or
CRLF1 as biomarkers or therapeutic targets requires further
evaluation in larger, well-annotated patient cohorts and diverse
preclinical models. In addition, the survival analyses were
strengthened by providing HR and 95% CI values, and multivariate
Cox regression models adjusted for key clinical variables (age and
tumor grade), which confirmed that ZBTB7A and CRLF1 may be
independent predictors of poor OS in TCGA-OV. However, the
unavailability of tumor stage information was acknowledged in the
pan-cancer dataset used, which represents a limitation of the
prognostic analysis.
In conclusion, the current study identified ZBTB7A
as a clinically relevant TF that drives OV aggressiveness through
transcriptional activation of CRLF1. Through integrative analyses
spanning patient data, single-cell mapping and functional
experiments, the results revealed that the ZBTB7A/CRLF1 axis may
not only be associated with poor prognosis, but could also
mechanistically contribute to tumor growth and migration. These
findings underscore the importance of transcriptional networks in
shaping malignant phenotypes and raise the possibility that CRLF1
or its downstream signaling components may serve as novel
therapeutic entry points.
Supplementary Material
Supporting Data
Acknowledgements
Not applicable.
Funding
Funding: No funding was received.
Availability of data and materials
The data generated in the present study may be
requested from the corresponding author.
Authors' contributions
XH conceptualized the present study, performed the
experiments, analyzed the data and wrote the original draft. YC
conceptualized the present study, and reviewed and edited the
manuscript. XH and YC confirm the authenticity of all the raw data.
Both authors read and approved the final manuscript.
Ethics approval and consent to
participate
Not applicable.
Patient consent for publication
Not applicable.
Competing interests
The authors declare that they have no competing
interests.
References
|
1
|
Wang L, Zhang Q, Wang X, Dong Z, Liu S,
Wang Q, Zhang Z and Xing J: Therapeutic landscape of ovarian
cancer: Recent advances and emerging therapies. Biomark Res.
13:1032025. View Article : Google Scholar : PubMed/NCBI
|
|
2
|
Shah M, Chen TY, Ison G, Fiero MH, Zhang
H, Gao X, Neilson M, Goldberg KB, Nair A, Ricks TK, et al: Overall
survival and the evolving benefit-risk assessment for poly
(ADP-ribose) polymerase inhibitors in advanced ovarian cancer. J
Clin Oncol. 43:2218–2227. 2025. View Article : Google Scholar : PubMed/NCBI
|
|
3
|
Aggarwal R, Sheikh A, Akhtar M, Ghazwani
M, Hani U, Sahebkar A and Kesharwani P: Understanding gold
nanoparticles and their attributes in ovarian cancer therapy. Mol
Cancer. 24:882025. View Article : Google Scholar : PubMed/NCBI
|
|
4
|
Wu C, Chen D, Stout MB, Wu M and Wang S:
Hallmarks of ovarian aging. Trends Endocrinol Metab. 36:418–439.
2025. View Article : Google Scholar : PubMed/NCBI
|
|
5
|
Gupta R, Kumar R, Penn CA and Wajapeyee N:
Immune evasion in ovarian cancer: Implications for immunotherapy
and emerging treatments. Trends Immunol. 46:166–181. 2025.
View Article : Google Scholar : PubMed/NCBI
|
|
6
|
Wang Z, Liu Y and Yang Q: Navigating PARP
inhibitor resistance in ovarian cancer: Bridging mechanistic
insights to clinical translation. Curr Treat Options Oncol.
26:797–819. 2025. View Article : Google Scholar : PubMed/NCBI
|
|
7
|
Therachiyil L, Bhat AA and Uddin S:
Claudins in ovarian cancer: Emerging biomarkers and therapeutic
targets. Tissue Barriers. Aug 13–2025.(Epub ahead of print).
PubMed/NCBI
|
|
8
|
Wang Y, He S, Huang Q, Yang J, Yang C and
Ding J: The roles of YY1 in reproductive system: an overview. Chem
Biol Interact. 417:1115602025. View Article : Google Scholar : PubMed/NCBI
|
|
9
|
Liu J, Wang H, Wan H, Yang J, Gao L, Wang
Z, Zhang X, Han W, Peng J, Yang L and Hong L: NEK6 dampens FOXO3
nuclear translocation to stabilize C-MYC and promotes subsequent de
novo purine synthesis to support ovarian cancer chemoresistance.
Cell Death Dis. 15:6612024. View Article : Google Scholar : PubMed/NCBI
|
|
10
|
Wu A, Li S, Feng C, He R, Wu R, Hu Z,
Huang J, Wang W, Huang L and Qiu L: Fn14 Controls the
SIRT2-Mediated deacetylation of slug to inhibit the metastasis of
epithelial ovarian cancer. Adv Sci (Weinh). 12:e25015522025.
View Article : Google Scholar : PubMed/NCBI
|
|
11
|
Zhao F, Liu G, Xiong L, Yao L, Wang L and
Zhang Z: Effect of sufentanil on the proliferation, apoptosis, and
epithelial-mesenchymal transition of ovarian cancer cells by
regulating the SMAD3/SNAIL signaling pathway. J Mol Histol.
56:992025. View Article : Google Scholar : PubMed/NCBI
|
|
12
|
Vikramdeo KS, Miree O, Anand S, Sharma A,
Srivastava SK, Singh S, Rocconi RP and Singh AP: MYB/AKT3 axis is a
key driver of ovarian cancer growth, aggressiveness, and
chemoresistance. J Ovarian Res. 18:1792025. View Article : Google Scholar : PubMed/NCBI
|
|
13
|
Fu Z, Chen K, Zheng F, Gong W, Chao D and
Lu C: FCGBP promotes ovarian cancer progression via activation of
IL-6/JAK-STAT signaling pathway. J Transl Med. 23:8272025.
View Article : Google Scholar : PubMed/NCBI
|
|
14
|
Lin J, Liu H, Fukumoto T, Zundell J, Yan
Q, Tang CA, Wu S, Zhou W, Guo D, Karakashev S, et al: Targeting the
IRE1α/XBP1s pathway suppresses CARM1-expressing ovarian cancer. Nat
Commun. 12:53212021. View Article : Google Scholar : PubMed/NCBI
|
|
15
|
Hasan A, Khan NA, Uddin S, Khan AQ and
Steinhoff M: Deregulated transcription factors in the emerging
cancer hallmarks. Semin Cancer Biol. 98:31–50. 2024. View Article : Google Scholar : PubMed/NCBI
|
|
16
|
Bleu M, Mermet-Meillon F, Apfel V, Barys
L, Holzer L, Bachmann Salvy M, Lopes R, Amorim Monteiro Barbosa I,
Delmas C, Hinniger A, et al: PAX8 and MECOM are interaction
partners driving ovarian cancer. Nat Commun. 12:24422021.
View Article : Google Scholar : PubMed/NCBI
|
|
17
|
Cheng Q, Li L and Yu M: Construction and
validation of a transcription factors-based prognostic signature
for ovarian cancer. J Ovarian Res. 15:292022. View Article : Google Scholar : PubMed/NCBI
|
|
18
|
Nameki RA, Chang H, Yu P, Abbasi F, Lin X,
Reddy J, Haro M, Fonseca MA, Freedman ML, Drapkin R, et al:
Rewiring of master transcription factor cistromes during high-grade
serous ovarian cancer development. bioRxiv. Apr 12–2023.(Epub ahead
of print). PubMed/NCBI
|
|
19
|
Xiang X, Mao J, Tang D, Huang H and Tang
H: The ZBTB family in cardiac development and diseases. Biochem
Biophys Res Commun. 771:1520262025. View Article : Google Scholar : PubMed/NCBI
|
|
20
|
Zhou Y, Chen X and Zu X: ZBTB7A as a
therapeutic target for cancer. Biochem Biophys Res Commun.
736:1508882024. View Article : Google Scholar : PubMed/NCBI
|
|
21
|
Gupta S, Singh AK, Prajapati KS, Kushwaha
PP, Shuaib M and Kumar S: Emerging role of ZBTB7A as an oncogenic
driver and transcriptional repressor. Cancer Lett. 483:22–34. 2020.
View Article : Google Scholar : PubMed/NCBI
|
|
22
|
Maeda T, Hobbs RM and Pandolfi PP: The
transcription factor Pokemon: A new key player in cancer
pathogenesis. Cancer Res. 65:8575–8578. 2005. View Article : Google Scholar : PubMed/NCBI
|
|
23
|
Yue R, Chen Y, Lai W and Wei W: miR-106b
exerts tumor suppressive functions in ovarian carcinoma by directly
targeting ZBTB7A. Minerva Med. 112:657–658. 2021. View Article : Google Scholar : PubMed/NCBI
|
|
24
|
Bonome T, Levine DA, Shih J, Randonovich
M, Pise-Masison CA, Bogomolniy F, Ozbun L, Brady J, Barrett JC,
Boyd J and Birrer MJ: A gene signature predicting for survival in
suboptimally debulked patients with ovarian cancer. Cancer Res.
68:5478–5486. 2008. View Article : Google Scholar : PubMed/NCBI
|
|
25
|
Arend RC, Scalise CB, Gordon ER, Davis AM,
Foxall ME, Johnston BE, Crossman DK and Cooper SJ: Metabolic
alterations and WNT signaling impact immune response in HGSOC. Clin
Cancer Res. 28:1433–1445. 2022. View Article : Google Scholar : PubMed/NCBI
|
|
26
|
Zhang Z, Zhan Q, Eckert M, Zhu A,
Chryplewicz A, De Jesus DF, Ren D, Kulkarni RN, Lengyel E, He C and
Chen M: RADAR: Differential analysis of MeRIP-seq data with a
random effect model. Genome Biol. 20:2942019. View Article : Google Scholar : PubMed/NCBI
|
|
27
|
Geistlinger L, Oh S, Ramos M, Schiffer L,
LaRue RS, Henzler CM, Munro SA, Daughters C, Nelson AC, Winterhoff
BJ, et al: Multiomic analysis of subtype evolution and
heterogeneity in high-grade serous ovarian carcinoma. Cancer Res.
80:4335–4345. 2020. View Article : Google Scholar : PubMed/NCBI
|
|
28
|
Livak KJ and Schmittgen TD: Analysis of
relative gene expression data using real-time quantitative PCR and
the 2(−Delta Delta C(T)) Method. Methods. 25:402–408. 2001.
View Article : Google Scholar : PubMed/NCBI
|
|
29
|
Zhou Q, Tang H, Wang Y, Hua Y, Ouyang X
and Li L: Hyperoside mitigates PCOS-associated adipogenesis and
insulin resistance by regulating NCOA2-mediated PPAR-ү
ubiquitination and degradation. Life Sci. 364:1234172025.
View Article : Google Scholar : PubMed/NCBI
|
|
30
|
Wang S, Wang C, Hu Y, Li X, Jin S, Liu O,
Gou R, Zhuang Y, Guo Q, Nie X, et al: ZNF703 promotes tumor
progression in ovarian cancer by interacting with HE4 and
epigenetically regulating PEA15. J Exp Clin Cancer Res. 39:2642020.
View Article : Google Scholar : PubMed/NCBI
|
|
31
|
Du G, Huang X, Su P, Yang Y, Chen S, Huang
T and Zhang N: The role of SOX transcription factors in prostate
cancer: Focusing on SOX2. Genes Dis. 12:1016922025. View Article : Google Scholar : PubMed/NCBI
|
|
32
|
Luo Y, Liu X, Chen Y, Tang Q, He C, Ding
X, Hu J, Cai Z, Li X, Qiao H and Zou Z: Targeting PAX8 sensitizes
ovarian cancer cells to ferroptosis by inhibiting glutathione
synthesis. Apoptosis. 29:1499–1514. 2024. View Article : Google Scholar : PubMed/NCBI
|
|
33
|
Liu C, Barger CJ and Karpf AR: FOXM1: A
multifunctional oncoprotein and emerging therapeutic target in
ovarian cancer. Cancers (Basel). 13:30652021. View Article : Google Scholar : PubMed/NCBI
|
|
34
|
Battistini C, Kenny HA, Zambuto M, Nieddu
V, Melocchi V, Decio A, Lo Riso P, Villa CE, Gatto A, Ghioni M, et
al: Tumor microenvironment-induced FOXM1 regulates ovarian cancer
stemness. Cell Death Dis. 15:3702024. View Article : Google Scholar : PubMed/NCBI
|
|
35
|
Taki M, Abiko K, Baba T, Hamanishi J,
Yamaguchi K, Murakami R, Yamanoi K, Horikawa N, Hosoe Y, Nakamura
E, et al: Snail promotes ovarian cancer progression by recruiting
myeloid-derived suppressor cells via CXCR2 ligand upregulation. Nat
Commun. 9:16852018. View Article : Google Scholar : PubMed/NCBI
|
|
36
|
Liu J, Shu G, Wu A, Zhang X, Zhou Z,
Alvero AB, Mor G and Yin G: TWIST1 induces proteasomal degradation
of beta-catenin during the differentiation of ovarian cancer
stem-like cells. Sci Rep. 12:156502022. View Article : Google Scholar : PubMed/NCBI
|
|
37
|
Sestito R, Tocci P, Roman C, Di Castro V
and Bagnato A: Functional interaction between endothelin-1 and
ZEB1/YAP signaling regulates cellular plasticity and metastasis in
high-grade serous ovarian cancer. J Exp Clin Cancer Res.
41:1572022. View Article : Google Scholar : PubMed/NCBI
|
|
38
|
Looyenga BD, Resau J and MacKeigan JP:
Cytokine receptor-like factor 1 (CRLF1) protects against
6-hydroxydopamine toxicity independent of the gp130/JAK signaling
pathway. PLoS One. 8:e665482013. View Article : Google Scholar : PubMed/NCBI
|
|
39
|
Pasquin S, Laplante V, Kouadri S, Milasan
A, Mayer G, Tormo AJ, Savin V, Sharma M, Martel C and Gauchat JF:
Cardiotrophin-like cytokine increases macrophage-foam cell
transition. J Immunol. 201:2462–2471. 2018. View Article : Google Scholar : PubMed/NCBI
|
|
40
|
Yu ST, Zhong Q, Chen RH, Han P, Li SB,
Zhang H, Yuan L, Xia TL, Zeng MS and Huang XM: CRLF1 promotes
malignant phenotypes of papillary thyroid carcinoma by activating
the MAPK/ERK and PI3K/AKT pathways. Cell Death Dis. 9:3712018.
View Article : Google Scholar : PubMed/NCBI
|
|
41
|
Crisponi L, Buers I and Rutsch F: CRLF1
and CLCF1 in development, health and disease. Int J Mol Sci.
23:9922022. View Article : Google Scholar : PubMed/NCBI
|
|
42
|
Yu ST, Sun BH, Ge JN, Shi JL, Zhu MS, Wei
ZG, Li TT, Zhang ZC, Chen WS and Lei ST: CRLF1-MYH9 interaction
regulates proliferation and metastasis of papillary thyroid
carcinoma through the ERK/ETV4 axis. Front Endocrinol (Lausanne).
11:5352020. View Article : Google Scholar : PubMed/NCBI
|