


Genomic analysis of invasion-metastasis-related factors in pancreatic cancer cells
- Authors:
- Published online on: January 1, 2010 https://doi.org/10.3892/etm_00000034
- Pages: 211-216
Abstract
Introduction
One of the most lethal features of pancreatic cancer is its apparent capacity for early invasion and metastasis to the liver and other organs. Apart from surgery, there is no effective therapy and even resected patients usually die within one year postoperatively. Reasons for the poor prognosis include the occurrence of local recurrences and/or distant metastasis after surgery. However, to date, the cellular and molecular mechanisms of the invasion-metastasis of pancreatic cancer remain unclear. Detection of the factors related to the differences in potential for invasion and metastasis of cancer cells could provide useful information for the development of new therapeutic methods to prevent the invasion and metastasis of pancreatic cancer.
To investigate the mechanisms of invasion-metastasis of pancreatic cancer, two hamster pancreatic cancer cell lines with a different potential for invasion and metastasis, PC-1 with a low potential and PC-1.0 with a high potential after intrapancreatic transplantation, were established from a pancreatic ductal carcinoma induced by N-nitrosobis (2-oxopropyl) amine (BOP) in a Syrian golden hamster in our previous investigation (1,2).
cDNA microarray is a new emerging technique in the post genomic era. Large-scale analysis of gene expression with cDNA microarray allows us to evaluate the gene expression profiles of hundreds to tens of thousands of genes in a single experiment (3). Therefore, the cDNA microarray is a promising tool to provide new insight into the mechanisms of cancer invasion and metastasis.
In the present study, we analyzed alteration in the invasion-metastasis-related gene expression patterns of 27,000 genes in highly invasive and metastatic pancreatic cancer cells (PC-1.0) in comparison to weakly invasive and metastatic pancreatic cancer cells (PC-1) utilizing powerful cDNA microarray technology.
Materials and methods
Cell lines and cell culture
Two hamster pancreatic cancer cell lines, weakly invasive and metastatic cells (PC-1) and highly invasive and metastatic cells (PC-1.0) were used. The PC-1 cell line was established from pancreatic ductal/ductular adenocarcinomas induced by BOP in a Syrian golden hamster (1). The PC-1.0 cell line was established from a subcutaneous tumor produced after inoculation of PC-1 cells (2). In vitro, PC-1 cells grow mainly as island-like cell colonies, whereas PC-1.0 cells exhibit the growth pattern of single cells. In vivo, local expansion of PC-1 cells and local invasion of PC-1.0 cells are observed (1,2).
The PC-1 and PC-1.0 cells were incubated in RPMI-1640 (Gibco-BRL, Grand Island, NY, USA), supplemented with 10% fetal bovine serum (Bioserum, Victoria, Australia), 100 U/ml penicillin G and 100 μg/ml streptomycin at 37°C in a humidified atmosphere of 5% CO2/95% air.
Preparation of total RNA
Total RNA of the PC-1.0 and PC-1 cells was extracted using the TRIzol reagent according to the manufacturer's instructions (Invitrogen). After TRIzol purification, RNA was further purified with RNeasy mini spin column kit (Qiagen, Valencia, CA, USA). The concentration and qualify of the RNA were assessed via spectrophotometry and agarose gel electrophoresis.
cDNA microarray and statistical analysis of data
Preparation of fluorescent dye-labeled DNA and hybridizations was performed according to the protocol of the reagent/kit manufacturers and previously reported methods (4). Briefly, RNA was reverse-transcribed into cDNA with Oligo(dT)15 (Promega) as primer and Superscript II choice for cDNA synthesis (Invitrogen) and subsequently labeled in red (Cy5) or in green (Cy3) (Amersham Pharmacia Biotech). Cy5- and Cy3-labeled cDNA was purified with a PCR purification kit (Qiagen). DNA was mixed with 30 μl hybridization solution prior to loading onto a rat gene microarray (Capitalbio Inc., Beijing, P.R. China) which included 27,000 transcripts (Oligo library, Rat Genome version 3.0.5; Qiagen). Arrays were hybridized at 42°C overnight. The experiments were performed twice with reverse dye-labeled cDNA.
The microarray plates were scanned by LuxScan 10KA dual pathways laser scanner (Capitalbio), and images were analyzed through GenePix Pro 4.0 image analysis software (Axon Instruments Co.). Genes were considered to be differentially expressed, integrated ratio of two experiments, at a change in increase (>3.00) or decrease (<0.33) in the ratio of expression levels between PC-1.0 and PC-1 cells.
Statistical analysis was carried out with the t-test, and the expression of a given gene was considered changed when the difference between means was significant (P<0.01).
Reverse transcriptase-polymerase chain reaction (RT-PCR)
Total RNA was isolated from PC-1.0 and PC-1 cells, and an aliquot of 1 μg of total RNA from each sample was reverse-transcribed to cDNA using the SuperScript II kit (Life Technologies, Inc.) as previously described (5). The primers used for PCR amplification in this study are listed in Table I. Amplification was run for 30 cycles at 95°C for 5 min, 95°C for 40 sec, 55°C for 30 sec, 72°C for 1 min and finally extended at 72°C for 7 min.
Gene Ontology and Pathway analysis of differentially expressed genes
Using the Gene Ontology tool from http://www.pantherdb.org, the differentially expressed genes were automatically assembled to categories of Biological process, Molecular function and Cellular component. Biologically related networks were automatically assembled from identified genes on microarrays by the BioRag (http://www.biorag.org), which enables the analysis of pathways among interested genes according to Kegg (http://www.genome.ad.jp/kegg) or GenMAPP (http://www.genmapp.org). The Fisher's exact test was performed to detect the significantly regulated gene and pathway, A P-value <0.01 was considered significantly overrepresented.
Results
Differentially expressed genes identified by cDNA microarray in the highly (PC-1.0) and weakly (PC-1) invasive and metastatic pancreatic cancer cells
To clarify the differentially expressed genes between highly (PC-1.0) and weakly (PC-1) invasive and metastatic cells, the expression level for each gene in the two pancreatic cancer cell lines was compared. Of the 27,000 genes analyzed through microarray experiments, a total of 141 genes revealed differential expression using a fold ratio >3 as the criteria for cut-off. Of the 141 genes, the expression of 46 genes (32.6%) was markedly increased in the highly invasive and metastatic cells (PC-1.0) as compared with the weakly invasive and metastatic cells (PC-1) (Table II). On the other hand, the expression of 95 genes (67.4%) was significantly decreased in the highly invasive and metastatic cells (PC-1.0) as compared with the weakly invasive and metastatic cells (PC-1) (Table III). The ratio represented the expression value in PC-1.0 cells compared with the expression level in PC-1 cells.
Table II.Genes up-regulated in highly invasive and metastatic cells (PC-1.0) compared with weakly invasive and metastatic cells (PC-1). |
Table III.Genes down-regulated in highly invasive and metastatic cells (PC-1.0) compared with weakly invasive and metastatic cells (PC-1). |
Validation of selected genes with RT-PCR
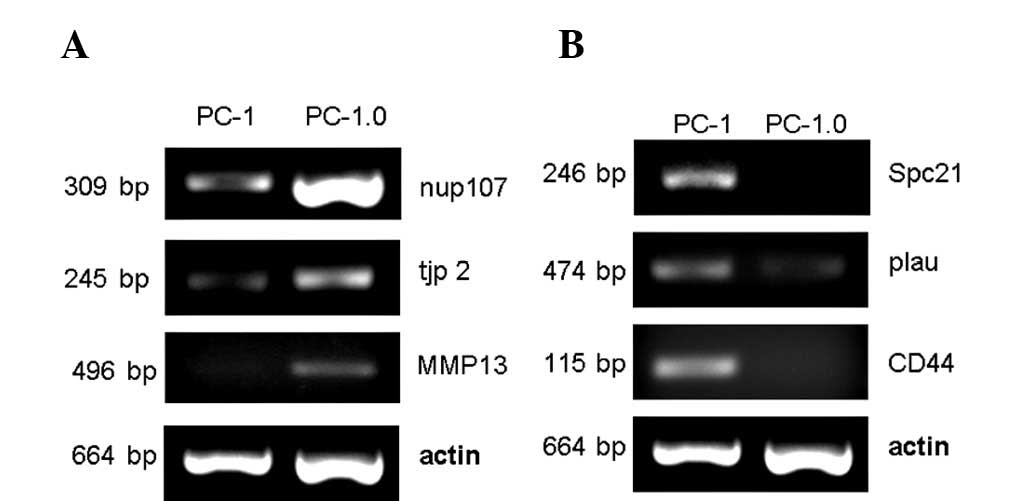
To verify the reliability of the microarray data, we selected three up-regulated genes (nup107, tjp2 and MMP13) and three down-regulated genes (Spc21, plau and CD44) to measure their expression levels by RT-PCR. The results were very similar to the cDNA microarray data on these genes and supported the reliability of our expression data (Fig. 1).
Gene Ontology and Pathway analysis of differentially expressed genes
Gene Ontology (GO) and Pathway analysis was applied in order to generate groups of genes that belong to similar biological processes correlated with invasion and metastasis of pancreatic cancer cells.
The differentially expressed genes between highly (PC-1.0) and weakly (PC-1) invasive and metastatic cells were summarized in Molecular function, Biological process and Cellular component, respectively. These are the three types of categories of GO analysis. The ten most correlated (the lowest P-value) GO categories of Molecular function, Biological Process and Cellular Component are presented in Tables IV, V and VI, respectively.
In addition, Pathway analysis of differentially expressed genes was also applied using the public database (Kegg and GenMAPP). The ten most correlated pathways obtained from the Kegg and GenMAPP are listed in Tables VII and VIII, respectively.
The complete data of the GO and Pathway analysis is available upon request.
Discussion
To date, there have been some reports regarding the molecular mechanisms involved in the development of pancreatic cancer, including some reports utilizing cDNA microarray (6,7). However, thus far, most of these cDNA microarray studies have focused on the differences between pancreatic cancer tissue and normal tissue (8); few studies have investigated the mechanism of invasion and metastasis in pancreatic cancer cells using highly and weakly invasive and metastatic pancreatic cancer cell lines. Yet, these tissue samples have considerable disadvantages. They are highly complex and are usually composed of several different cell types and extracellular matrices; for example, non-neoplastic pancreatic tissue includes ductal and acinar cells, various neuroendocrine cells and mesenchymal cells. Thus, one has to be aware that using samples of tissue homogenates does not simply mean a comparison of neoplastic vs. non-neoplastic epithelial cells, but a complex mixture of genes of diverse origin, some of them deriving from epithelial cells. In contrast, one advantage of using cancer cell lines is that pure tumor cells are tested without any contamination from surrounding stromal elements.
In particular, the highly (PC-1.0) and weakly (PC-1) invasive and metastatic pancreatic cancer cell lines, which are established from the experimental pancreatic cancer model in our previous study (1,2), show an obviously different potential for invasion and metastasis (9,10). Therefore, this cell line model is suitable for the investigation of invasion-metastasis-related specific factors in pancreatic cancer.
In the present study, using cDNA microarray analysis, we found that a total of 141 genes were differentially expressed between the PC-1.0 and PC-1 cells, including 46 up-regulated genes and 95 down-regulated genes. We selected several differentially expressed genes (nup107, tjp-2, MMP-13, Spc21, plau and CD44) for validation by RT-PCR. The results of RT-PCR were in accordance with those of the cDNA microarray analysis. In addition, several of the identified genes (i.e., MMP-13, plau and CD44) have been previously reported to be correlated with invasion and metastasis (11–13), and the other differentially expressed genes (i.e., nup107, tjp-2 and Spc21) have not been reported to be associated with the invasion-metastasis of pancreatic cancer.
Of the identified genes not previously reported to be associated with the invasion-metastasis of pancreatic cancer, Nup107 is a critical component of the nucleoporin 107–160 subcomplex, which is the key building block of the nuclearpore complex (NPC). From yeast to humans, the function of NPC is the regulation of nuclear import and export (14). The Nup107–160 complex thus additionally offers an attractive point for regulation of nuclear pore complex assembly (15). Although nup107 has been identified from the comparison of gene expression in highly and weakly invasive and metastatic pancreatic cancer cells in the present study, the molecular mechanism of involvement of nup107 in the invasion-metastasis of pancreatic cancer needs to be further tested and assessed.
Several studies have demonstrated that tight junction proteins (TJPs) associate with each other and directly and/or indirectly to actin filaments (16) and also recruit factors involved in signal transduction and the regulation of proliferation and differentiation (17). The zonula occludens (ZO) protein is one of the tight junction proteins and belongs to the membrane associated guanylate kinase-like (MAGUK) protein family. It includes three members, TJP1/ZO-1, TJP2/ZO-2 and TJP3/ZO-3 (18). mRNA levels of ZO-2 were found to be elevated in tumor tissues compared with controls using quantitative PCR. Moreover, ZO-2 exhibits a 23-amino acid truncation at the N-terminus, which may play a role in limiting tumor development in pancreatic cells. In another investigation, ZO-2 was found to be associated with the progression of breast cancer (19).
Moreover, Spc21 was identified as a down-regulated gene in this study, suggesting that dysregulation of this gene is likely to be associated with the invasion and metastasis of pancreatic cancer cells. Fish and ISH analysis for this gene demonstrated a significant correlation between genetic deletion and corresponding mRNA down-regulation, raising the possibility that the Spc21 gene may play a putative role as a tumor suppressor (20). However, little is known about the biological role of this gene, although it belongs to the peptidase S26B family and functions as part of the signal peptidase complex (20).
In conclusion, our results suggest that a highly organized and structured process of invasion and metastasis exists in the pancreas. Analysis of gene expression profiles by cDNA microarray can provide useful information for clarifying the mechanism underlying the invasion and metastasis of pancreatic cancer cells. Furthermore, the identification of invasion-metastasis-specific genes may allow us to develop new therapeutic and diagnostic targets for the invasion-metastasis of pancreatic cancer.
Acknowledgements
This study was supported by a grant-in-aid from the China Postdoctoral Science Foundation (no. 20060390302). We thank Professor Hideo Baba for the kind gift of PC-1 and PC-1.0 cell lines.