Introduction
Sepsis is defined as the systemic inflammatory
response to infection and is one of the leading causes of mortality
in critically ill patients despite the application of numerous
antibiotics and resuscitation therapies (1). Sepsis syndromes could be classified as
systemic inflammatory response syndromes (SIRSs), sepsis, severe
sepsis and septic shock according to the American College of Chest
Physicians and the Society of Critical Care first published Care
(2). In addition, the incidence of
sepsis is increasing worldwide. In the USA the current incidence of
sepsis is ~3 in 1,000 people, whereas severe sepsis leads to at
least 200,000 deaths per year (3).
Furthermore, severe sepsis and septic shock account for 30–50% of
hospital-reported mortality (4).
Recently, consensus on the treatment of sepsis includes advanced
supportive care in the intensive care unit and use of bundle
therapies (5). However, due to the
non-specific nature of the signs and symptoms of sepsis, the
diagnosis and treatment of sepsis are complicated.
Recently, numerous studies have been performed to
identify the pathogenesis of sepsis (6–8). A
number of biomarkers can be used in the diagnosis of sepsis,
however, none of them has sufficient specificity or sensitivity in
the clinical setting (9–11). C-reactive protein (CRP) and
procalcitonin (PCT) have been widely used because of their
relatively better specificity and prognostic capability (12–14). The
concentration of CRP is <0.8 mg/l and can increase 1,000-fold in
response to an acute-phase stimulus (15). CRP is a protein that is synthesized
in the liver and rises in response to inflammation (16). Moreover, it may help macrophages
remove microorganisms by binding the phospholipid components
(17). Nowadays, CRP is also treated
as a biomarker for evaluating sepsis severity and prognosis or to
monitor treatment response (12).
PCT, which is produced by parafollicular cells of the thyroid and
neuroendocrine cells of the lungs and the intestines is a 116 amino
acid polypeptide precursor of the hormone calcitonin. PCT was first
linked to infectious disease by Assicot et al (18) and was formally proposed as an
adjunctive diagnostic biomarker in 2008 (19). It is maintained at a low level in
healthy people and increases 1,000-fold during active infection
(20). Furthermore, there are also
several meta-analyses demonstrating that PCT could be used as a
diagnostic marker in sepsis (21,22).
Nevertheless, there is currently no gold biomarker
that exists as a marker of sepsis. Thus, identification of a new
biomarker is urgently required. In order to further identify the
molecular pathogenesis of sepsis, microarray data were firstly
downloaded, then the raw data were analyzed to construct a
protein-protein interaction (PPI) network. Subsequently,
differentially expressed clusters in the PPI network were
identified and significantly enriched pathways and functions of the
genes in the clusters were also screened. Finally, potential
molecular markers were identified using the support vector machine
(SVM) method.
Materials and methods
Obtaining and preprocessing of mRNA
expression profile data
The mRNA expression profiles of sepsis and
non-sepsis samples were obtained from the National Center of
Biotechnology Information Gene Expression Omnibus database. The
access number was GSE12624 (http://www.ncbi.nlm.nih.gov/geo/query/acc.cgi?acc=GSE12624)
and the datasets of 36 samples with septic shock following trauma
(sepsis samples) and 34 samples without septic shock following
trauma (non-sepsis samples) were used for further analysis. The
platform used here was called GPL4204 GE Healthcare/Amersham
Biosciences CodeLink UniSet Human I Bioarray. The original data at
probe symbol level were first converted into expression values at
gene symbol level. Next, missing data was imputed and median data
normalization was performed using robust multichip averaging
(23). Besides, principal component
analysis (PCA) (24), which was used
as a computational procedure for biomarker identification and for
the classification of multiclass gene expression was performed to
identify the difference between sepsis and non-sepsis samples.
PPI network construction
PPIs illustrate valuable information for the
elucidation of cellular function, and protein interaction studies
have been developed to be a focal point of recent biomolecular
research. The Human Protein Reference Database (HPRD) (25) is a novel protein information resource
illustrating various features of proteins, including the domain
architecture, molecular function, tissue expression, subcellular
localization, enzyme-substrate correlation and PPIs. In the present
study, all the human PPI pairs in HPRD were initially collected.
Next, the Pearson correlation coefficients for all the interacting
genes were calculated based on their expression values under the
sepsis and non-sepsis status with a coefficient <0.5 used as the
cut-off criterion. This was done to obtain the PPI networks under
these two statuses. Furthermore, Cytoscape (26) was used to visualize the PPI networks
in order to further observe the correlation between genes.
Hierarchical clustering and analysis
of covariance (ANCOVA) global test for differentially expressed
clusters
Hierarchical clustering is a method of cluster
analysis that seeks to build a hierarchy of clusters (27). Euclidean distance was selected as a
measure of distance between pairs of genes in the PPI network. The
present study used the package hclust (http://CRAN.R-project.org/package=gplots) in R
language to perform the hierarchical clustering of two PPI
networks, with the requirement that each cluster should have had
>5 genes. Finally, Package GlobalAncova in R language was
employed to identify the differentially expressed cluster using the
ANCOVA global test (28), which
focuses on phenotype effects and gene-phenotype interactions.
P<0.05 was defined as a threshold.
Enrichment analysis of differentially
expressed clusters
In order to study differentially expressed clusters
at the functional level, Gene Ontology (GO) functional enrichment
(29) and Kyoto Encyclopedia of Gene
and Genomes (30) pathway enrichment
analyses were performed using the Database for Annotation,
Visualization and Integrated Discovery (DAVID) software (31). DAVID software has been widely used to
identify biological processes involving a given list of genes. In
the present study, a fold change discovery of ≤0.05 was set as the
cut-off criterion for enrichment analysis.
Identification of molecular markers by
the SVM method
The SVM method has been demonstrated to be an useful
classification and regression method that uses machine learning
theory to maximize the predictive accuracy while avoiding
overfitting of data (32).
Differential clusters were initially ranked according to their P-
and F-values (F test), and the cluster with the highest P-value was
then defined as the class feature. Secondly, the SVM method was
employed to classify the samples using the ksvm function in the
kernlab package in R language, and the 10-fold cross-validation
method was performed to evaluate the classification results. A
feature selection error rate of <0.1 was selected as the
criteria.
Results
Preprocessing of mRNA expression
profile data
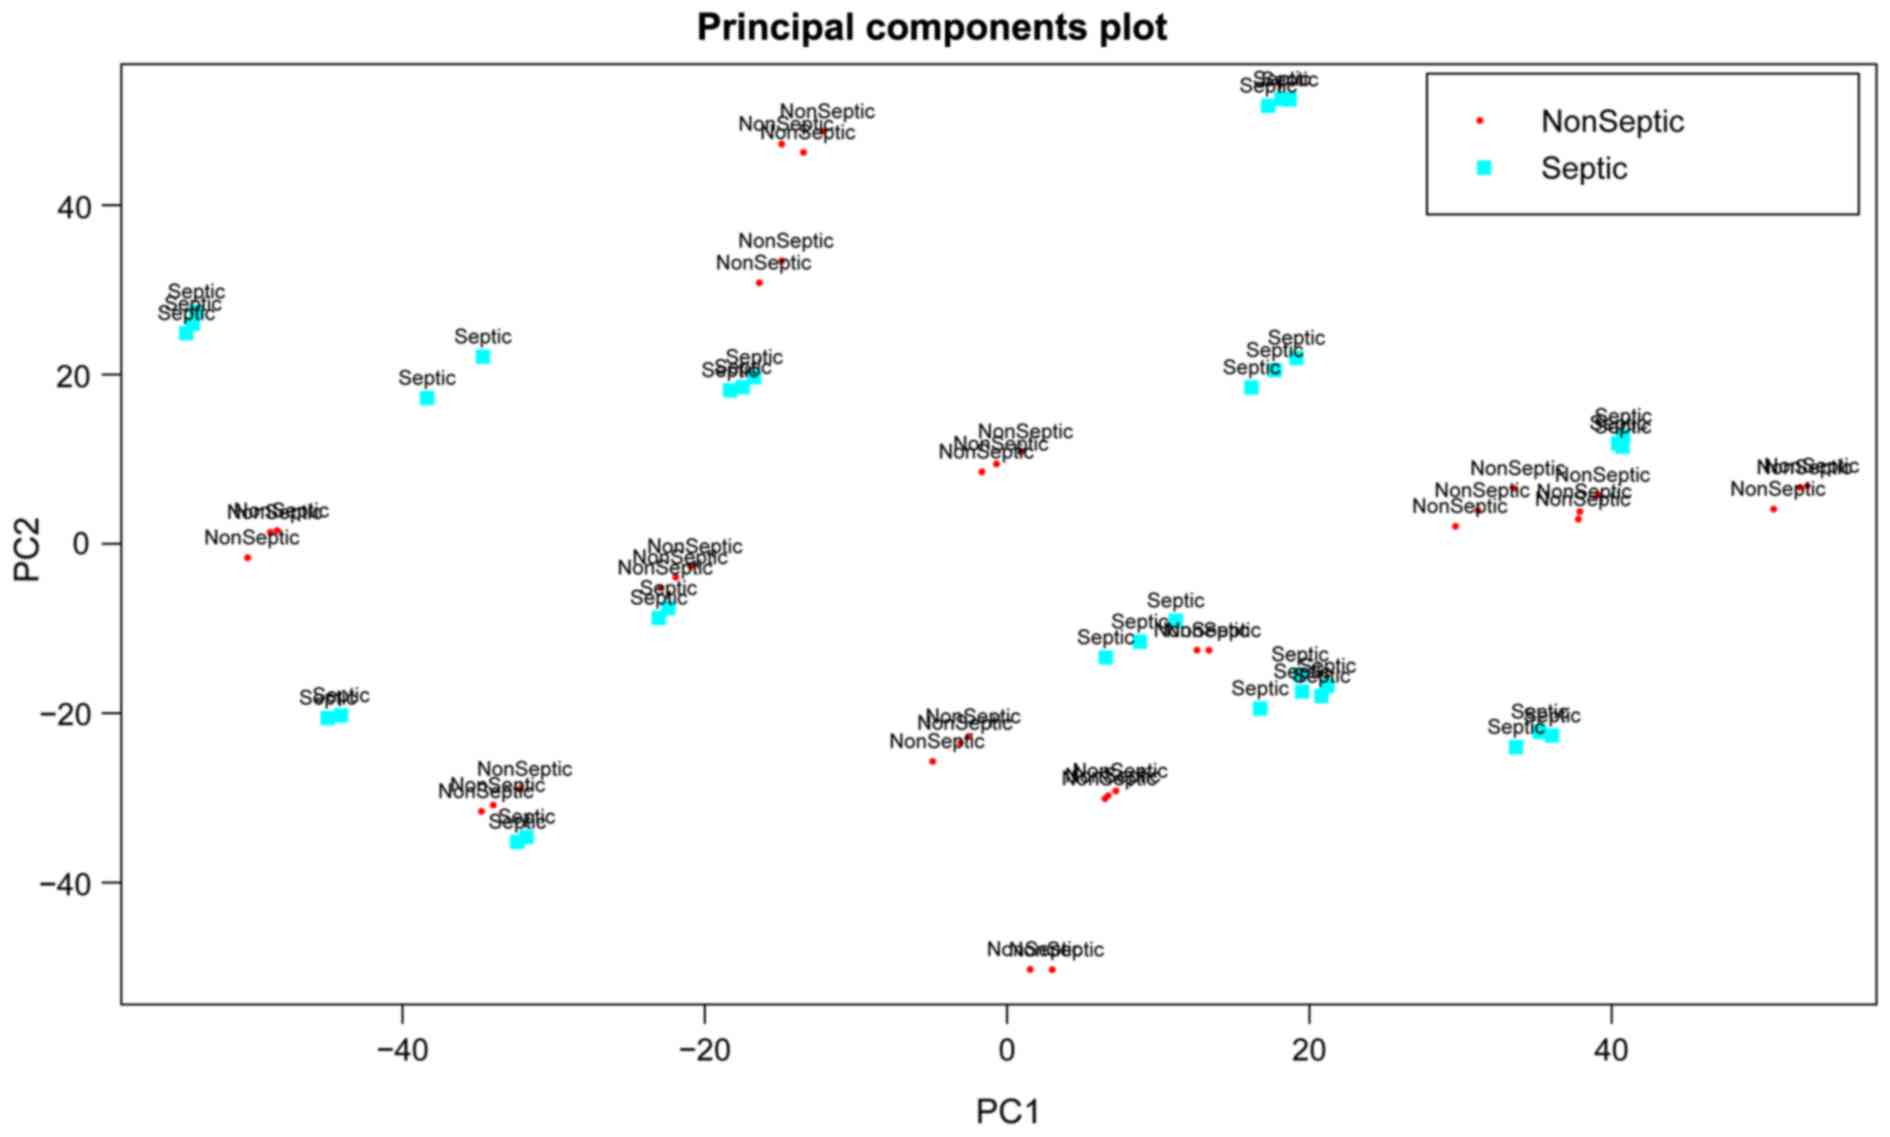
A total of 7,672 genes were obtained after
preprocessing of the mRNA expression profile data. PCA analysis
based on gene expression values revealed that sepsis samples had a
great similarity with non-sepsis samples (Fig. 1). Therefore, further bioinformatics
analyses were conducted to identify the molecular markers for
distinguishing sepsis samples from non-sepsis samples.
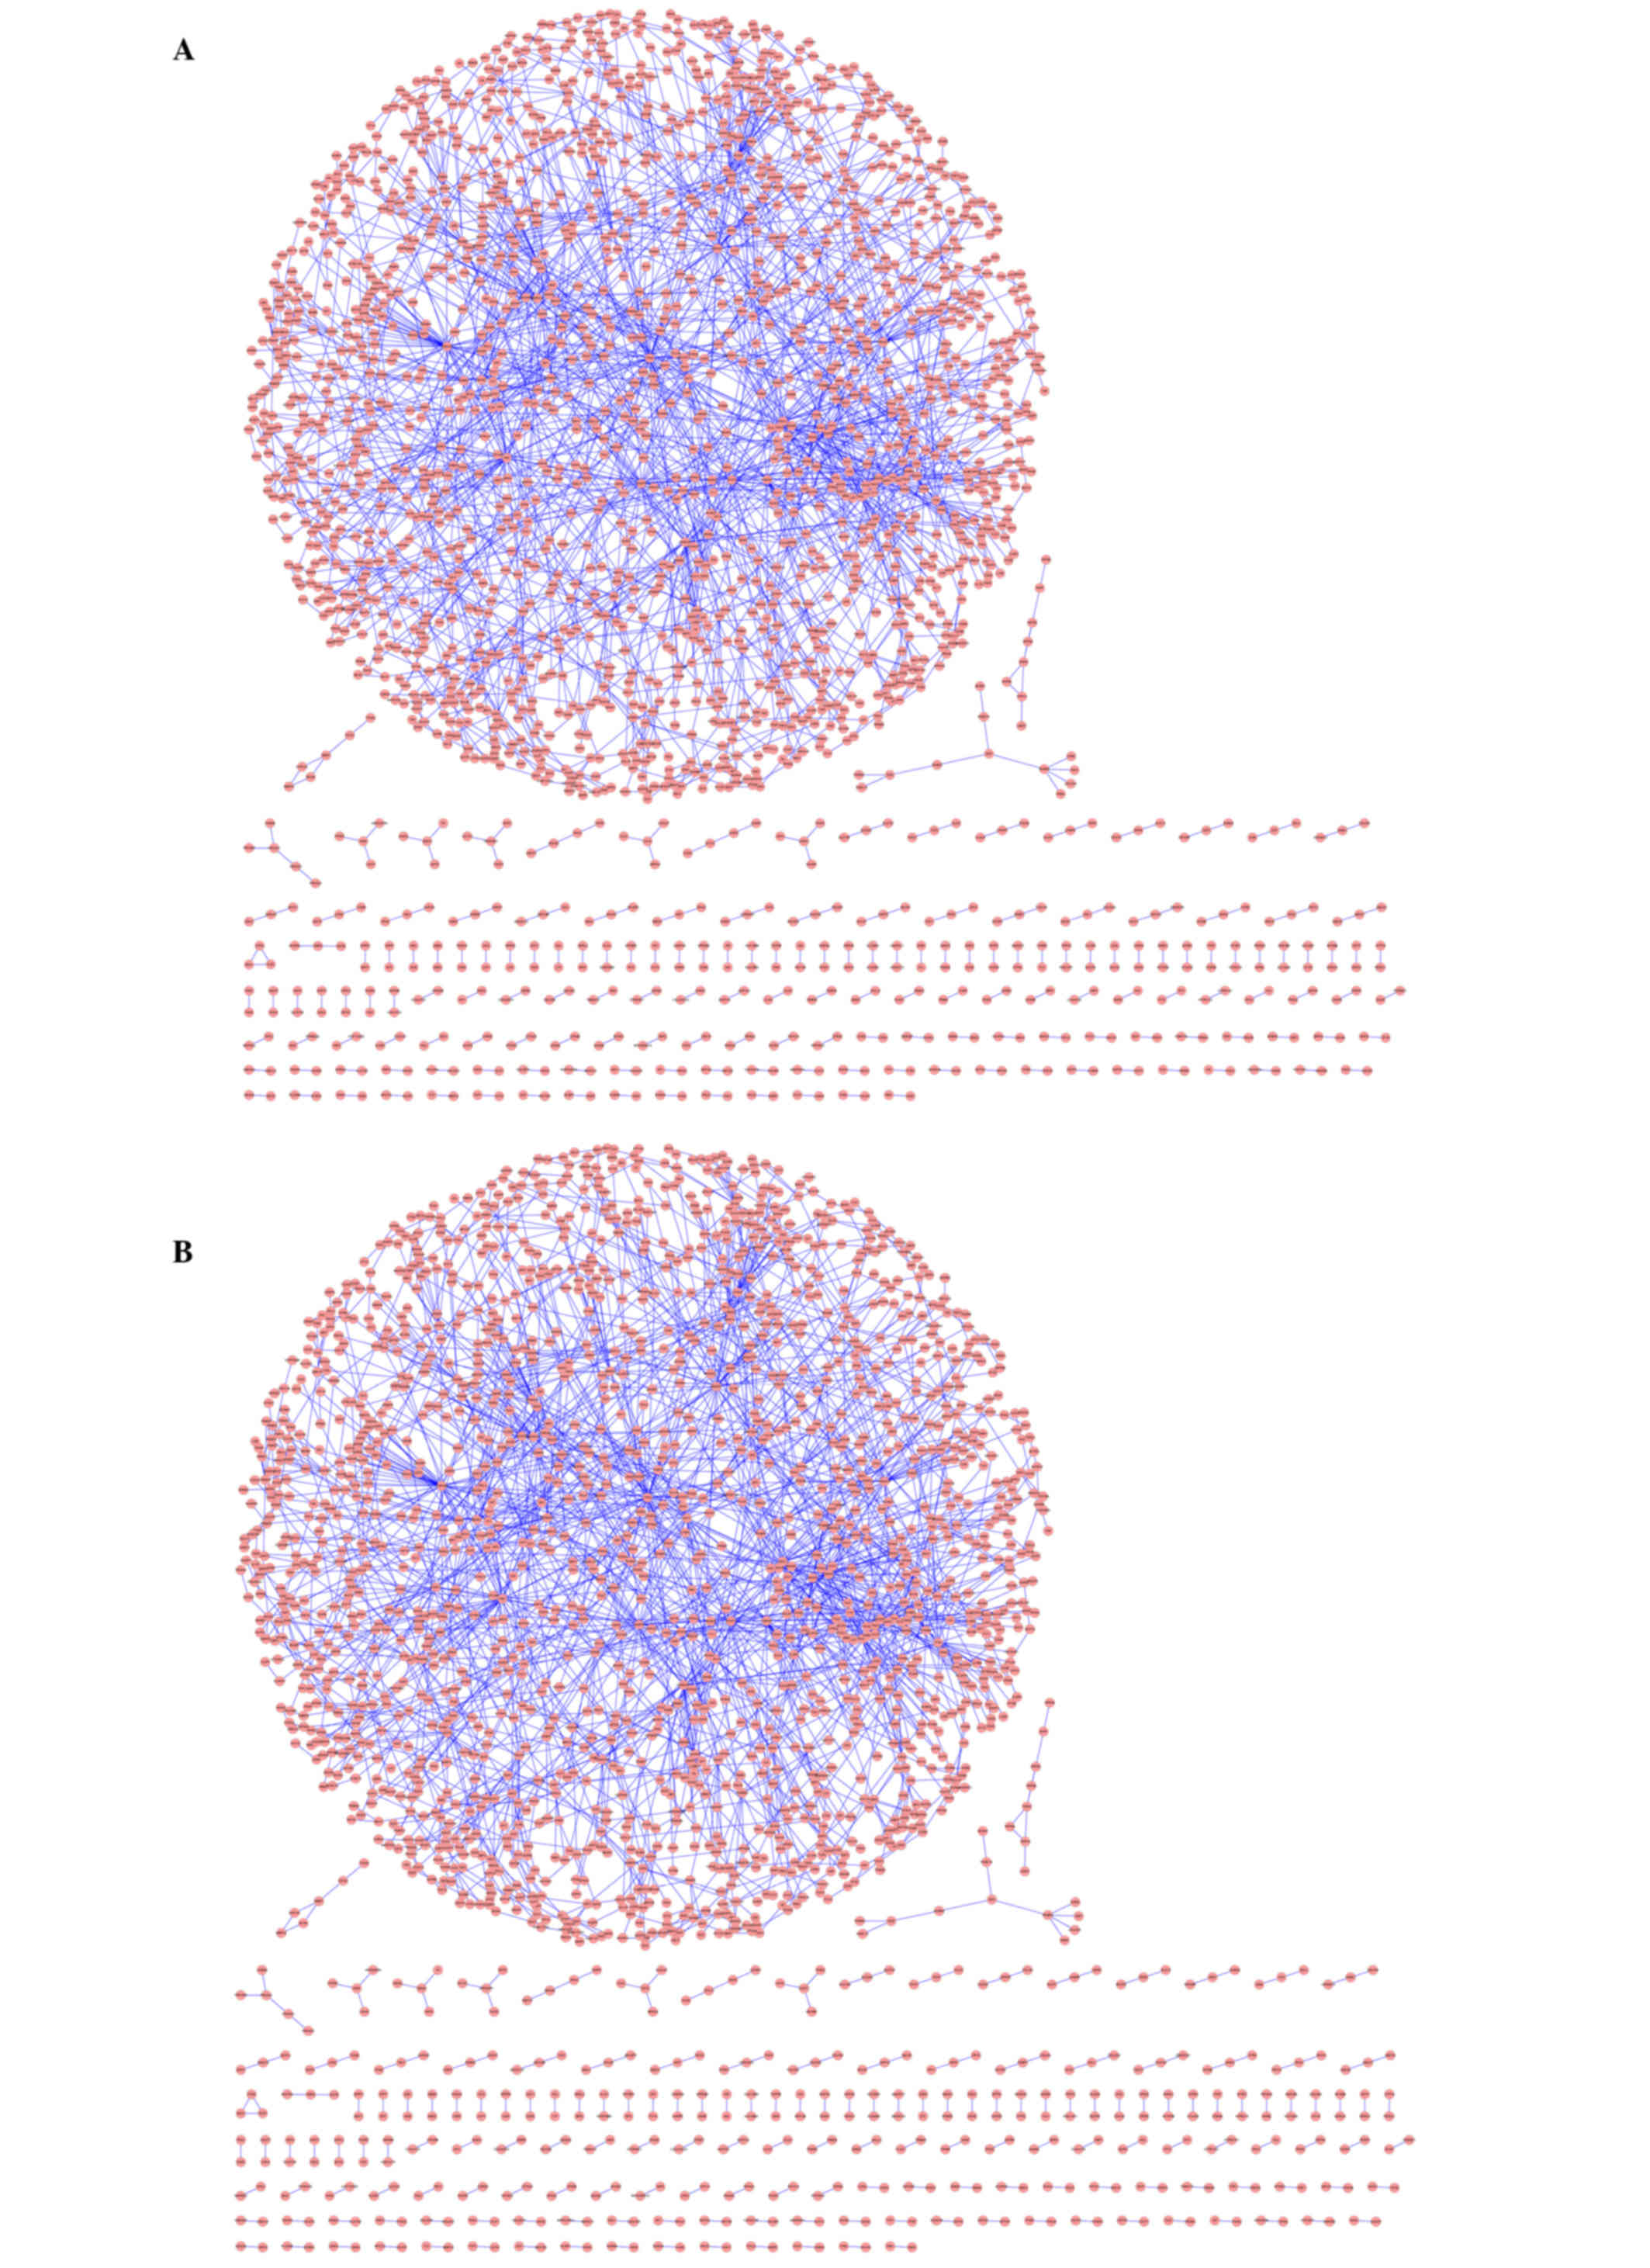
PPI network construction
The HPRD database was used to construct the PPI
network and Cytoscape software was employed to visualize the
network. The PPI network of genes under sepsis collected 1,996
genes and 2,645 interactions between them; the PPI network of genes
under non-sepsis status collected 2,147 genes and 2,783
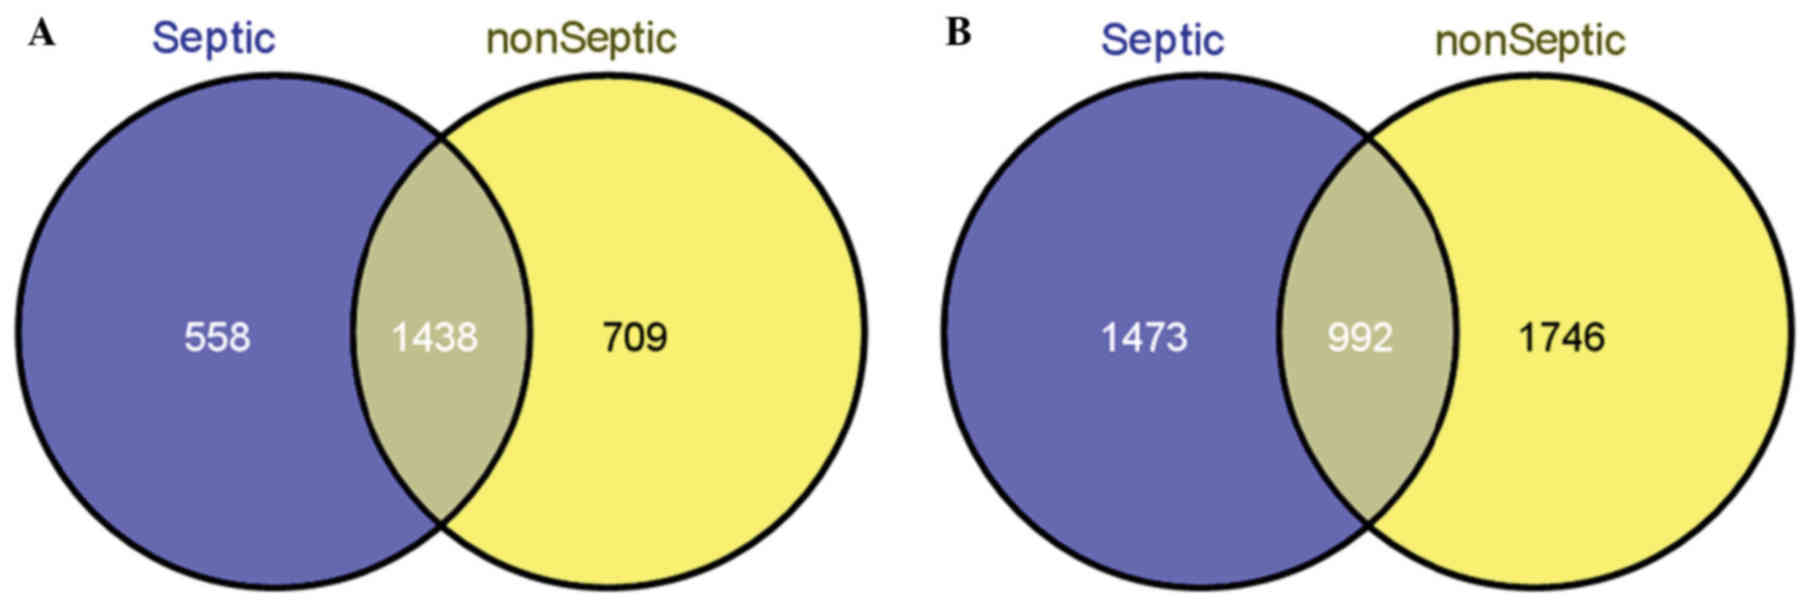
interactions (Fig. 2). Further
analysis revealed that there were 1,438 overlapping genes and only
992 overlapping interactions between sepsis and non-sepsis samples
(Fig. 3).
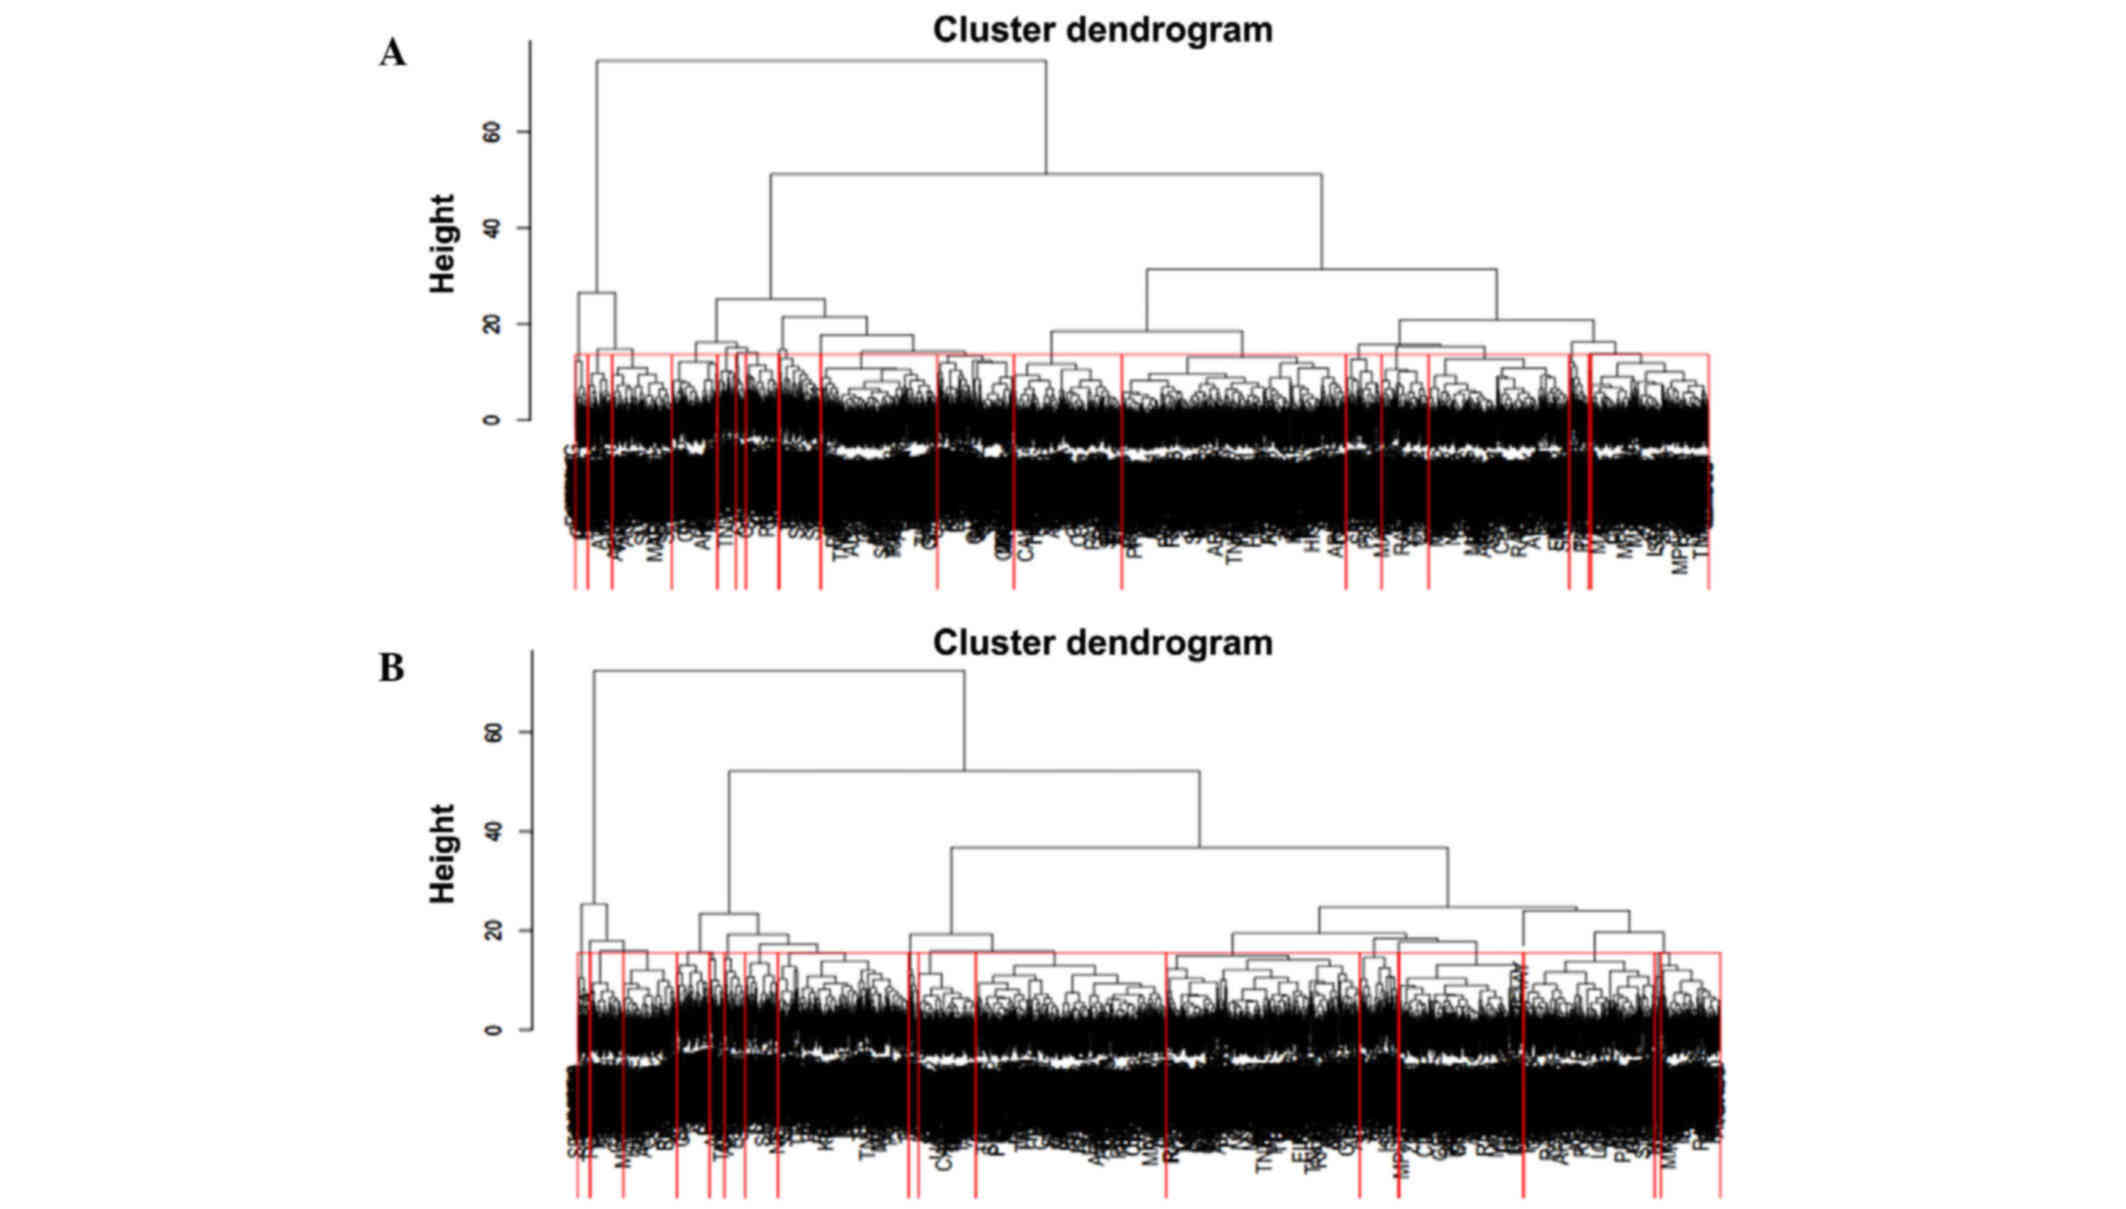
Screening of differentially expressed
clusters
In total, 40 clusters with 20 clusters in both PPI
networks were identified by hierarchical clustering (Fig. 4). Furthermore, 24 differentially
expressed clusters, each with 12 clusters in both networks, were
identified by the ANCOVA global test with a threshold of
P<0.05.
Enrichment analysis of differentially
expressed clusters
Function enrichment analysis revealed that the genes
in the 24 differentially expressed clusters were mainly enriched in
the following GO terms: Positive regulation of macromolecule
metabolic processes, transcription factor binding, regulation of
cell death and the intracellular signaling cascade (Table I). However, no pathways were
enriched.
 | Table I.GO analysis of differentially
expressed clusters (top 15). |
Table I.
GO analysis of differentially
expressed clusters (top 15).
| Category | Term | FDR |
|---|
| GOTERM_BP_FAT | GO:0010604~positive
regulation of macromolecule metabolic process |
6.58×10⁻²⁹ |
| GOTERM_MF_FAT |
GO:0008134~transcription factor
binding |
1.09×10⁻²⁷ |
| GOTERM_BP_FAT | GO:0010605~negative
regulation of macromolecule metabolic process |
2.52×10⁻²³ |
| GOTERM_BP_FAT |
GO:0010941~regulation of cell death |
1.83×10⁻²² |
| GOTERM_BP_FAT |
GO:0007242~intracellular signaling
cascade |
2.59×10⁻²² |
| GOTERM_BP_FAT |
GO:0043067~regulation of programmed cell
death |
8.30×10⁻²² |
| GOTERM_MF_FAT |
GO:0030528~transcription regulator
activity |
7.43×10⁻²¹ |
| GOTERM_BP_FAT |
GO:0042981~regulation of apoptosis |
1.21×10⁻²⁰ |
| GOTERM_MF_FAT | GO:0004672~protein
kinase activity |
1.08×10⁻¹⁹ |
| GOTERM_BP_FAT |
GO:0016310~phosphorylation |
7.73×10⁻¹⁹ |
| GOTERM_BP_FAT | GO:0006468~protein
amino acid phosphorylation |
8.91×10⁻¹⁹ |
| GOTERM_BP_FAT | GO:0044093~positive
regulation of molecular function |
4.92×10⁻¹⁷ |
| GOTERM_BP_FAT | GO:0010628~positive
regulation of gene expression |
5.97×10⁻¹⁷ |
| GOTERM_BP_FAT |
GO:0006796~phosphate metabolic
process |
6.14×10⁻¹⁷ |
| GOTERM_BP_FAT |
GO:0006793~phosphorus metabolic
process |
6.14×10⁻¹⁷ |
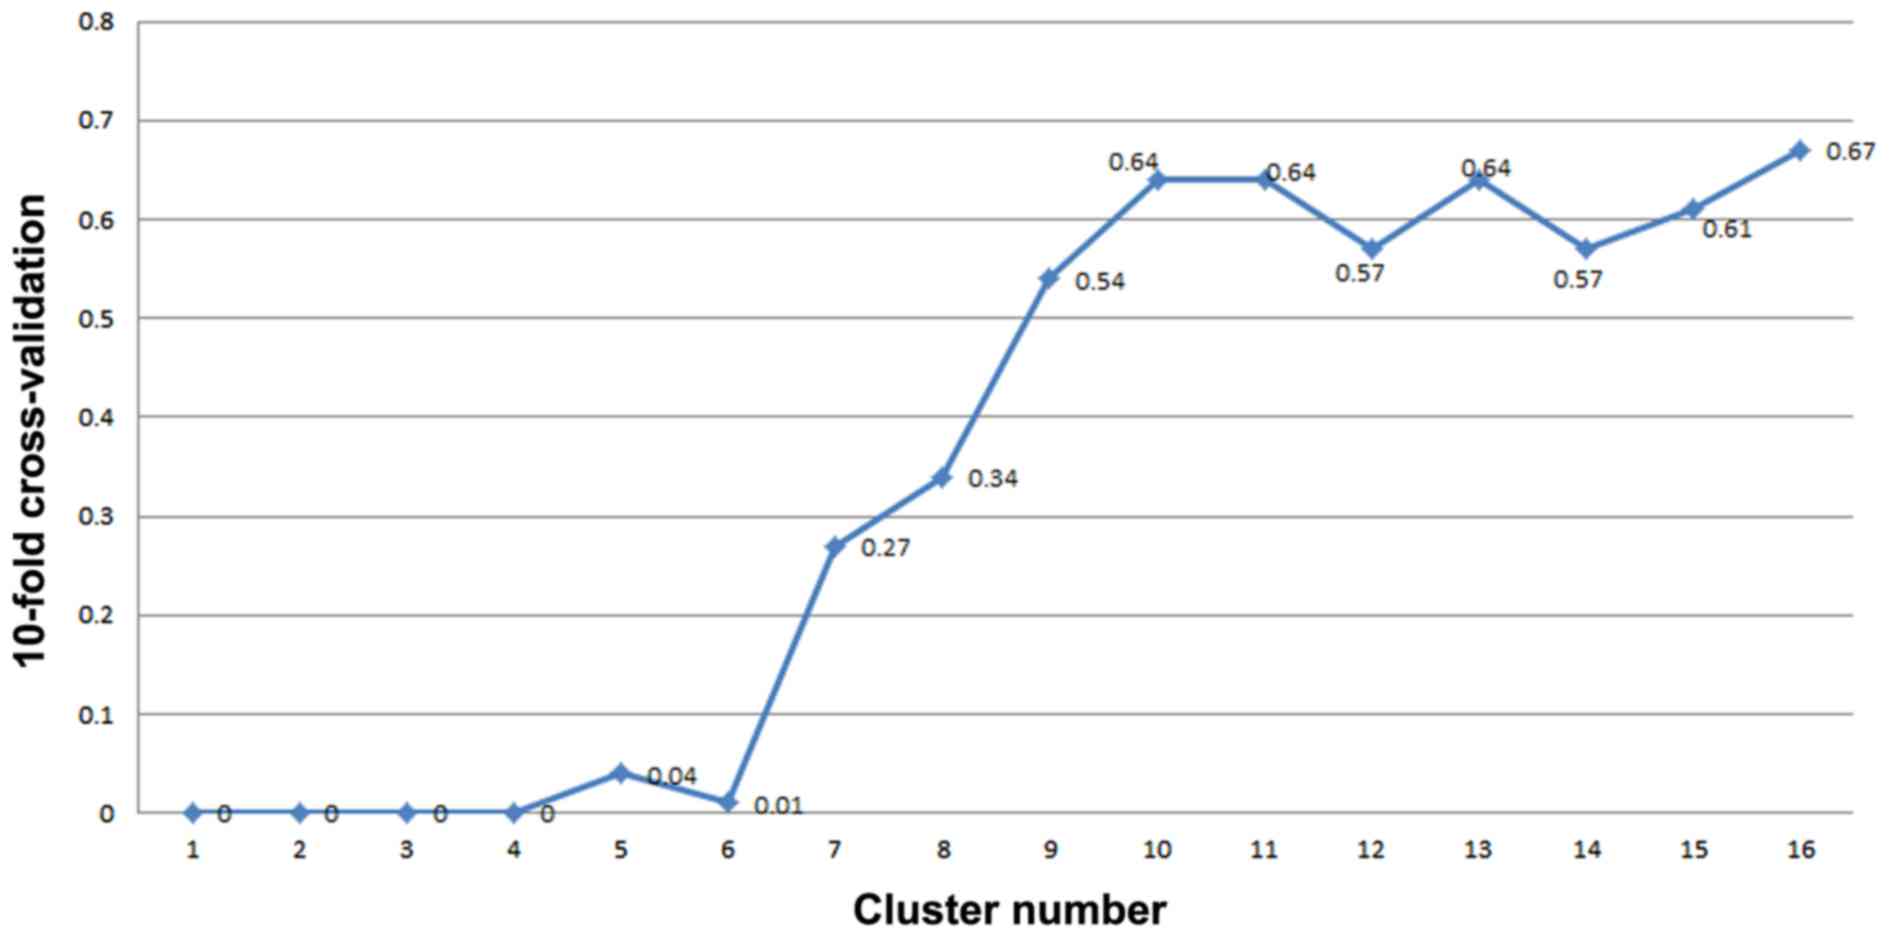
Identification of molecular markers by
the SVM method
The 24 clusters that were sorted by P-value are
listed in Table II. The SVM method
was employed in order to classify the samples according to the
cluster sequences listed in Table
II. Notably, when the seventh cluster was added, the feature
selection error rate of 10-fold cross-validation was >0.1.
Therefore, 207 genes in the top six clusters were selected as
potential biomarkers, including CDC42, CSF3R, GCA, HMGB2, RHOG,
SERPINB1 and TYROBP in cluster 15, as well as SERPINA1, FCER1G and
S100P. Fig. 5 illustrates the SVM
calculating process. In order to validate the non-randomness of
these 207 genes, 207 genes were randomly selected from the mRNA
expression profile data 1,000 times and the results of the 10-fold
cross-validation were always >0.1. This proved the effectiveness
of the selected molecular markers. Further enrichment analysis
demonstrated that these 207 genes were mainly enriched in functions
of the intracellular signaling cascade, regulation of programmed
cell death, regulation of cell death, regulation of apoptosis and
leukocyte activation (Table III);
whereas no pathways were enriched.
| Table II.Sorted differentially expressed
clusters of sepsis and non-sepsis samples. |
Table II.
Sorted differentially expressed
clusters of sepsis and non-sepsis samples.
| Clusters | F-value | p.perm | p.approx | State |
|---|
| 15 | 9.12 | <0.01 |
2.74×10⁻⁶ | s |
| 18 | 6.66 | <0.01 |
4.87×10⁻³ | ns |
| 14 | 6.03 | <0.01 |
1.06×10⁻⁴ | s |
| 10 | 5.26 | <0.01 |
7.52×10⁻⁴ | ns |
| 13 | 4.83 | <0.01 |
1.25×10⁻⁵ | ns |
| 8 | 4.61 | <0.01 |
1.40×10⁻³ | s |
| 13 | 3.94 | <0.01 |
4.86×10⁻⁶ | s |
| 3 | 3.77 | <0.01 |
2.92×10⁻⁶ | ns |
| 2 | 3.58 | <0.01 |
6.30×10⁻⁴ | s |
| 11 | 3.25 | <0.01 |
2.37×10⁻³ | ns |
| 3 | 3.23 | <0.01 |
2.26×10⁻³ | s |
| 11 | 3.03 | <0.01 |
3.31×10⁻³ | s |
| 2 | 2.94 | <0.01 |
6.03×10⁻³ | ns |
| 5 | 2.82 | <0.01 |
2.06×10⁻² | s |
| 6 | 2.82 | <0.01 |
6.06×10⁻³ | s |
| 4 | 2.64 | <0.01 |
8.88×10⁻³ | ns |
| 16 | 4.88 |
0.01 |
1.11×10⁻³ | ns |
| 6 | 3.76 |
0.01 |
6.36×10⁻⁴ | ns |
| 4 | 3.42 |
0.01 |
2.21×10⁻³ | s |
| 8 | 2.94 |
0.01 |
5.65×10⁻³ | ns |
| 9 | 2.43 |
0.02 |
4.01×10⁻² | s |
| 12 | 2.26 |
0.02 |
3.19×10⁻² | s |
| 1 | 2.65 |
0.03 |
1.53×10⁻² | ns |
| 5 | 2.36 |
0.04 |
1.87×10⁻² | ns |
| Table III.GO analysis of molecular markers (top
15). |
Table III.
GO analysis of molecular markers (top
15).
| Category | Term | FDR |
|---|
| GOTERM_CC_FAT |
GO:0005829~cytosol |
1.33×10⁻⁸ |
| GOTERM_BP_FAT |
GO:0007242~intracellular signaling
cascade |
3.76×10⁻⁵ |
| GOTERM_CC_FAT |
GO:0031982~vesicle |
9.54×10⁻³ |
| GOTERM_CC_FAT | GO:0044459~plasma
membrane part |
1.12×10⁻² |
| GOTERM_BP_FAT | GO:0010033~response
to organic substance |
1.39×10⁻² |
| GOTERM_BP_FAT |
GO:0043067~regulation of programmed cell
death |
1.40×10⁻² |
| GOTERM_CC_FAT | GO:0005886~plasma
membrane |
1.46×10⁻² |
| GOTERM_BP_FAT |
GO:0010941~regulation of cell death |
1.50×10⁻² |
| GOTERM_CC_FAT | GO:0015629~actin
cytoskeleton |
1.67×10⁻² |
| GOTERM_MF_FAT | GO:0032403~protein
complex binding |
2.73×10⁻² |
| GOTERM_BP_FAT |
GO:0042981~regulation of apoptosis |
3.31×10⁻² |
| GOTERM_BP_FAT |
GO:0045321~leukocyte activation |
6.04×10⁻² |
| GOTERM_BP_FAT | GO:0031400~negative
regulation of protein modification process |
7.36×10⁻² |
| GOTERM_CC_FAT | GO:0009986~cell
surface |
7.38×10⁻² |
| GOTERM_CC_FAT |
GO:0031988~membrane-bounded vesicle |
7.53×10⁻² |
| GOTERM_BP_FAT |
GO:0016192~vesicle-mediated transport |
9.46×10⁻² |
Discussion
Sepsis and its complications are a common cause of
infectious disease and hospital-reported mortality worldwide
(33). The present study aimed to
investigate the potential mechanism of sepsis, and to identify
genes that can be used for diagnosing and developing candidate
molecularly targeted therapy. In total, 7,672 genes were obtained
after preprocessing of the mRNA expression profile data. Following
hierarchical clustering analysis and the ANCOVA global test, 24
differentially expressed clusters with 12 clusters in each PPI
network were identified. Moreover, 207 genes in the top six
clusters were selected using SVM, and the functional enrichment
analysis revealed that they were mainly enriched in the
intracellular signaling cascade, regulation of programmed cell
death, regulation of apoptosis and leukocyte activation.
The ANCOVA global test identified 24 differentially
expressed clusters, and cluster 15 had the highest P-value. Genes
in this cluster, including CDC42 (34), CSF3R (35), GCA (36), HMGB2 (37), RHOG (38), SERPINB1 (39) and TYROBP (40) had already been linked with sepsis.
SERPINA1, FCER1G and S100P were also genes in this cluster. Gene
SERPINA1 encodes alpha-1-antitrypsin, which is a serine protease
inhibitor. Moreover, the targets of SERPINA1 include elastase,
plasmin, thrombin, trypsin, chymotrypsin and plasminogen activator,
which participates in inflammatory processes (41). Buttenschoen et al (42) demonstrated that the diagnostic value
of SERPINA1 levels could be applied in order to distinguish sepsis
from SIRS and to assess prognosis. Recently, Su et al
(43) revealed that SERPINA1 was
downregulated in patients with sepsis compared with SIRS patients,
and further analysis demonstrated that SERPINA1 was involved in
sepsis differentiation. The FCER1G gene encodes the γ-subunit of Fc
epsilon RI (FcRγ), which is an immunoreceptor tyrosine-based
activation motif-bearing signal transduction subunit of the Fc
receptor family (44). The FCER1G
gene was upregulated in sepsis according to Hu et al
(45). Furthermore, it has a
deleterious effect on sepsis, and FcRγ-/− mice demonstrated an
increased survival during sepsis due to increased Escherichia
coli phagocytosis (46). The
S100P gene encoding the S100 calcium binding protein, which is a
member of the S100 family proteins, contains 2 EF-hand
calcium-binding motifs. Sepsis-associated encephalopathy (SAE) is
the organ dysfunction accompanied with sepsis (47). S100P is produced mainly by the
central nervous system, and the elevated serum level of S100P is a
biomarker of neuronal damage occurring in SAE (48). Therefore, elevated serum levels of
S100P may be associated with critical illness and may be treated as
the biomarkers of brain damage during sepsis.
GO functional enrichment analysis revealed that 207
genes identified by SVM, including TLR2 and RAB27A, were mainly
enriched in the intracellular signaling cascade, regulation of
programmed cell death and cell death, regulation of apoptosis and
leukocyte activation. Furthermore, programmed cell death is an
important mechanism during the immunopathogenesis of sepsis.
Notably, apoptosis is one form of programmed cell death. In
addition, early programmed cell death of lymphocytes destroys
innate and adaptive immunity, which would reduce the ability of
protecting against pathogens (49).
Also, programmed cell death of parenchymal cells in the lung, liver
and gut would facilitate organ failure and death (50). The TLR2 gene encodes Toll-Like
Receptor 2, which is a member of the Toll-like receptor family
expressed on the macrophage recognizing pathogen-associated
molecular patterns (51). Several
reports have suggested the role of TLR2 in the induction of
pathogen-induced programmed cell death (52–54). The
present study identified that TLR2 demonstrated differential
expression in sepsis samples, which was consistent with the
observations of Armstrong et al (55). Therefore, we inferred that TLR2 may
be involved in sepsis by interrupting programmed cell death. The
RAB27A gene encoding guanosine triphosphate (GTP)-binding protein
Ram belongs to the GTPase superfamily, Rab family (56). Ménasché et al (57) have reported that genetic defects in
Rab27a may lead to immunodeficiency in humans caused by programmed
cell death. Furthermore, Johnson et al (58) illustrated that Rab27a deficiency is
associated with increased survival and reduced neutrophil
infiltration of the liver in a model of lipopolysaccharide-induced
systemic inflammation. Therefore, Rab27a may participate in organ
failure which accompanies sepsis.
Overall, in order to illustrate the pathological
mechanisms underlying sepsis, gene expression profiles containing
70 samples were downloaded and analyzed. SERPINA1, FCER1G and S100P
in the selected differential clusters may be potential biomarkers.
Moreover, TLR2 and Rab27a may exert certain roles in sepsis by
interrupting programmed cell death. However, more experiments are
required in order to confirm these results.
References
|
1
|
Pierrakos C and Vincent JL: Sepsis
biomarkers: A review. Crit Care. 14:R152010. View Article : Google Scholar : PubMed/NCBI
|
|
2
|
American College of Chest
Physicians/Society of Critical Care Medicine Consensus Conference:
Definitions for sepsis and organ failure and guidelines for the use
of innovative therapies in sepsis. Crit Care Med. 20:864–874. 1992.
View Article : Google Scholar : PubMed/NCBI
|
|
3
|
Soong J and Soni N: Sepsis: Recognition
and treatment. Clin Med. 12:276–280. 2012. View Article : Google Scholar
|
|
4
|
Levy MM, Dellinger RP, Townsend SR,
Linde-Zwirble WT, Marshall JC, Bion J, Schorr C, Artigas A, Ramsay
G and Beale R: Surviving Sepsis Campaign: The surviving sepsis
campaign: Results of an international guideline-based performance
improvement program targeting severe sepsis. Crit Care Med.
38:367–374. 2010. View Article : Google Scholar : PubMed/NCBI
|
|
5
|
Mayr FB, Yende S and Angus DC:
Epidemiology of severe sepsis. Virulence. 5:4–11. 2014. View Article : Google Scholar : PubMed/NCBI
|
|
6
|
Venet F and Chung CS: Increased
circulating regulatory T cells (CD4(+)CD25 (+)CD127 (−)) contribute
to lymphocyte anergy in septic shock patients. Intensive Care Med.
35:678–686. 2009. View Article : Google Scholar : PubMed/NCBI
|
|
7
|
Tidswell M, Tillis W, Larosa SP, Lynn M,
Wittek AE, Kao R, Wheeler J, Gogate J and Opal SM: Phase 2 trial of
eritoran tetrasodium (E5564), a Toll-like receptor 4 antagonist, in
patients with severe sepsis. Crit Care Med. 38:72–83. 2010.
View Article : Google Scholar : PubMed/NCBI
|
|
8
|
Machado JR, Soave DF, Da SM, de Menezes
LB, Etchebehere RM, Monteiro ML, dos Reis MA, Corrêa RR and Celes
MR: Neonatal sepsis and inflammatory mediators. Mediators Inflamm.
2014:269681. 2014.PubMed/NCBI
|
|
9
|
Nancy B, Diana S, Kerstin H, Oliver K,
Katrin L, Michael B, Martin BF, Diana I and Michael K: C-Terminal
Alpha-1 Antitrypsin Peptide: A New Sepsis Biomarker with
Immunomodulatory Function. Mediators Inflamm. 2016:1–13. 2016.
|
|
10
|
Chi YF, Chai JK, Yu YM, Luo HM, Zhang QX
and Feng R: Association between PAI-1 polymorphisms and plasma
PAI-1 level with sepsis in severely burned patients. Genet Mol Res.
14:10081–10086. 2015. View Article : Google Scholar : PubMed/NCBI
|
|
11
|
Wang JF, Yu MG, Bian JJ, Deng XM, Wan XJ
and Zhu KM: Serum miR-146a and miR-223 as potential new biomarkers
for sepsis. Biochem Biophys Res Commun. 394:184–188. 2010.
View Article : Google Scholar : PubMed/NCBI
|
|
12
|
Póvoa P, Coelho L, Almeida E, Fernandes A,
Mealha R, Moreira P and Sabino H: C-reactive protein as a marker of
infection in critically ill patients. Clin Microbiol Infect.
11:101–108. 2005. View Article : Google Scholar : PubMed/NCBI
|
|
13
|
Schmit X and Vincent JL: The time course
of blood C-reactive protein concentrations in relation to the
response to initial antimicrobial therapy in patients with sepsis.
Infection. 36:213–219. 2008. View Article : Google Scholar : PubMed/NCBI
|
|
14
|
Luzzani A, Polati E, Dorizzi R,
Rungatscher A, Pavan R and Merlini A: Comparison of procalcitonin
and C-reactive protein as markers of sepsis. Crit Care Med.
31:1737–1741. 2003. View Article : Google Scholar : PubMed/NCBI
|
|
15
|
Gabay C and Kushner I: Acute-phase
proteins and other systemic responses to inflammation. N Engl J
Med. 340:448–454. 1999. View Article : Google Scholar : PubMed/NCBI
|
|
16
|
Hanriot D, Bello G, Ropars ADC, Poitevin
G, Grosjean S, Latger-Cannard V, Devaux Y, Zannad F, Regnault V and
Lacolley P: C-reactive protein induces pro- and anti-inflammatory
effects, including activation of the liver X receptor alpha, on
human monocytes. Thromb Haemost. 99:558–569. 2008.PubMed/NCBI
|
|
17
|
Culley FJ, Bodmansmith KB, Ferguson MA,
Nikolaev AV, Shantilal N and Raynes JG: C-reactive protein binds to
phosphorylated carbohydrates. Glycobiology. 10:59–65. 2000.
View Article : Google Scholar : PubMed/NCBI
|
|
18
|
Assicot M, Gendrel D, Carsin H, Raymond J,
Guilbaud J and Bohuon C: High serum procalcitonin concentrations in
patients with sepsis and infection. Lancet. 341:515–518. 1993.
View Article : Google Scholar : PubMed/NCBI
|
|
19
|
O'Grady NP, Barie PS, Bartlett JG, Bleck
T, Carroll K, Kalil AC, Linden P, Maki DG, Nierman D, Pasculle W
and Masur H: American College of Critical Care Medicine; Infectious
Diseases Society of America: Guidelines for evaluation of new fever
in critically ill adult patients: 2008 update from the American
college of critical care medicine and the infectious diseases
society of America. Crit Care Med. 36:1330–1349. 2008. View Article : Google Scholar : PubMed/NCBI
|
|
20
|
Snider RH Jr, Nylen ES and Becker KL:
Procalcitonin and its component peptides in systemic inflammation:
Immunochemical characterization. J Investig Med. 45:552–560.
1997.PubMed/NCBI
|
|
21
|
Tang BM, Eslick GD, Craig JC and McLean
AS: Accuracy of procalcitonin for sepsis diagnosis in critically
ill patients: Systematic review and meta-analysis. Lancet Infect
Dis. 7:210–217. 2007. View Article : Google Scholar : PubMed/NCBI
|
|
22
|
Wacker C, Prkno A, Brunkhorst FM and
Schlattmann P: Procalcitonin as a diagnostic marker for sepsis: A
systematic review and meta-analysis. Lancet Infect Dis. 13:426–435.
2013. View Article : Google Scholar : PubMed/NCBI
|
|
23
|
Irizarry RA, Hobbs B, Collin F,
Beazer-Barclay YD, Antonellis KJ, Scherf U and Speed TP:
Exploration, normalization and summaries of high density
oligonucleotide array probe level data. Biostatistics. 4:249–264.
2003. View Article : Google Scholar : PubMed/NCBI
|
|
24
|
Bicciato S, Luchini A and Di Bello C: PCA
disjoint models for multiclass cancer analysis using gene
expression data. Bioinformatics. 19:571–578. 2003. View Article : Google Scholar : PubMed/NCBI
|
|
25
|
Peri S, Navarro JD, Kristiansen TZ,
Amanchy R, Surendranath V, Muthusamy B, Gandhi TK, Chandrika KN,
Deshpande N, Suresh S, et al: Human protein reference database as a
discovery resource for proteomics. Nucleic Acids Res. 32:(Database
issue). D497–D501. 2004. View Article : Google Scholar : PubMed/NCBI
|
|
26
|
Shannon P, Markiel A, Ozier O, Baliga NS,
Wang JT, Ramage D, Amin N, Schwikowski B and Ideker T: Cytoscape: A
software environment for integrated models of biomolecular
interaction networks. Genome Res. 13:2498–2504. 2003. View Article : Google Scholar : PubMed/NCBI
|
|
27
|
Cameron DA, Middleton FA, Chenn A and
Olson EC: Hierarchical clustering of gene expression patterns in
the Eomes+lineage of excitatory neurons during early neocortical
development. BMC Neurosci. 13:902012. View Article : Google Scholar : PubMed/NCBI
|
|
28
|
Mansmann U and Meister R: Testing
differential gene expression in functional groups. Goeman's global
test versus an ANCOVA approach. Methods Inf Med. 44:449–453.
2005.PubMed/NCBI
|
|
29
|
Ashburner M, Ball CA, Blake JA, Botstein
D, Butler H, Cherry JM, Davis AP, Dolinski K, Dwight SS, Eppig JT,
et al: Gene ontology: Tool for the unification of biology. The gene
ontology consortium. Nat Genet. 25:25–29. 2000. View Article : Google Scholar : PubMed/NCBI
|
|
30
|
Kanehisa M and Goto S: KEGG: Kyoto
encyclopedia of genes and genomes. Nucleic Acids Res. 28:27–30.
2000. View Article : Google Scholar : PubMed/NCBI
|
|
31
|
da Huang W, Sherman BT and Lempicki RA:
Systematic and integrative analysis of large gene lists using DAVID
bioinformatics resources. Nat Protoc. 4:44–57. 2009. View Article : Google Scholar : PubMed/NCBI
|
|
32
|
Liu J, Li SC and Luo X: Iterative
reweighted noninteger norm regularizing SVM for gene expression
data classification. Comput Math Methods Med. 2013:7684042013.
View Article : Google Scholar : PubMed/NCBI
|
|
33
|
Jawad I, Lukšić I and Rafnsson SB:
Assessing available information on the burden of sepsis: Global
estimates of incidence, prevalence and mortality. J Glob Health.
2:0104042012. View Article : Google Scholar : PubMed/NCBI
|
|
34
|
Geörg M, Maudsdotter L, Tavares R and
Jonsson AB: Meningococcal resistance to antimicrobial peptides is
mediated by bacterial adhesion and host cell RhoA and Cdc42
signalling. Cell Microbiol. 15:1938–1954. 2013.PubMed/NCBI
|
|
35
|
Rauch PJ, Chudnovskiy A, Robbins CS, Weber
GF, Etzrodt M, Hilgendorf I, Tiglao E, Figueiredo JL, Iwamoto Y,
Theurl I, et al: Innate response activator B cells protect against
microbial sepsis. Science. 335:597–601. 2012. View Article : Google Scholar : PubMed/NCBI
|
|
36
|
Durand M and Thomas SL: Incidence of
infections in patients with giant cell arteritis: A cohort study.
Arthritis Care Res (Hoboken). 64:581–588. 2012. View Article : Google Scholar : PubMed/NCBI
|
|
37
|
Metukuri MR, Reddy CM, Reddy PR and
Reddanna P: Bacterial LPS-mediated acute inflammation-induced
spermatogenic failure in rats: Role of stress response proteins and
mitochondrial dysfunction. Inflammation. 33:235–243. 2010.
View Article : Google Scholar : PubMed/NCBI
|
|
38
|
Sista F, Schietroma M, Santis GD, Mattei
A, Cecilia EM, Piccione F, Leardi S, Carlei F and Amicucci G:
Systemic inflammation and immune response after laparotomy vs
laparoscopy in patients with acute cholecystitis, complicated by
peritonitis. World J Gastrointest Surg. 5:73–82. 2013. View Article : Google Scholar : PubMed/NCBI
|
|
39
|
Benarafa C: The SerpinB1 knockout mouse a
model for studying neutrophil protease regulation in homeostasis
and inflammation. Methods Enzymol. 499:135–148. 2011. View Article : Google Scholar : PubMed/NCBI
|
|
40
|
Ormsby T, Schlecker E, Ferdin J, Tessarz
AS, Angelisová P, Köprülü AD, Borte M, Warnatz K, Schulze I,
Ellmeier W, Horejsí V and Cerwenka A: Btk is a positive regulator
in the TREM-1/DAP12 signaling pathway. Blood. 118:936–945. 2011.
View Article : Google Scholar : PubMed/NCBI
|
|
41
|
Ganter U, Bauer J, Schulz-Huotari C,
Gebicke-Haerter PJ, Beeser H and Gerok W: Repression of alpha
2-macroglobulin and stimulation of alpha 1-proteinase inhibitor
synthesis in human mononuclear phagocytes by endotoxin. Eur J
Biochem. 169:13–20. 1987. View Article : Google Scholar : PubMed/NCBI
|
|
42
|
Buttenschoen K, Buttenschoen DC, Berger D,
Vasilescu C, Schafheutle S, Goeltenboth B, Seidelmann M and Beger
HG: Endotoxemia and acute-phase proteins in major abdominal
surgery. Am J Surg. 181:36–43. 2001. View Article : Google Scholar : PubMed/NCBI
|
|
43
|
Su L, Zhou R, Liu C, Wen B, Xiao K, Kong
W, Tan F, Huang Y, Cao L and Xie L: Urinary proteomics analysis for
sepsis biomarkers with iTRAQ labeling and two-dimensional liquid
chromatography-tandem mass spectrometry. J Trauma Acute Care Surg.
74:940–945. 2013. View Article : Google Scholar : PubMed/NCBI
|
|
44
|
Butchar JP, Mehta P, Justiniano SE,
Guenterberg KD, Kondadasula SV, Mo X, Chemudupati M, Kanneganti TD,
Amer A and Muthusamy N: Reciprocal regulation of activating and
inhibitory Fc{gamma} receptors by TLR7/8 activation: implications
for tumor immunotherapy. Clin Cancer Res. 16:2065–2075. 2010.
View Article : Google Scholar : PubMed/NCBI
|
|
45
|
Hu WC: Sepsis is a syndrome with
hyperactivity of TH17-like innate immunity and hypoactivity of
adaptive immunity. ArXiv Preprint ArXiv:. 1311:47472013.
|
|
46
|
da Pinheiro Silva F, Aloulou M, Skurnik D,
Benhamou M, Andremont A, Velasco IT, Chiamolera M, Verbeek JS,
Launay P and Monteiro RC: CD16 promotes Escherichia coli sepsis
through an FcR gamma inhibitory pathway that prevents phagocytosis
and facilitates inflammation. Nat Med. 13:1368–1374. 2007.
View Article : Google Scholar : PubMed/NCBI
|
|
47
|
Iacobone E, Bailly-Salin J, Polito A,
Friedman D, Stevens RD and Sharshar T: Sepsis-associated
encephalopathy and its differential diagnosis. Crit Care Med.
37:(Suppl 10). S331–S336. 2009. View Article : Google Scholar : PubMed/NCBI
|
|
48
|
Hsu AA, Fenton K, Weinstein S, Carpenter
J, Dalton H and Bell MJ: Neurological injury markers in children
with septic shock. Pediatr Crit Care Med. 9:245–251. 2008.
View Article : Google Scholar : PubMed/NCBI
|
|
49
|
Vodounon CA, Chabi CB, Skibo YV, Ezin V,
Aikou N, Kotchoni SO, Akpona SA, Babamoussa L and Abramova ZI:
Influence of the programmed cell death of lymphocytes on the
immunity of patients with atopic bronchial asthma. Allergy Asthma
Clin Immunol. 10:1–11. 2014. View Article : Google Scholar : PubMed/NCBI
|
|
50
|
Perl M, Chung CS, Swan R and Ayala A: Role
of programmed cell death in the immunopathogenesis of sepsis. Drug
Discov Today Dis Mech. 4:223–230. 2007. View Article : Google Scholar : PubMed/NCBI
|
|
51
|
Kurko J, Vähä-Mäkilä M, Tringham M, Tanner
L, Paavanen-Huhtala S, Saarinen M, Näntö-Salonen K, Simell O,
Niinikoski H and Mykkänen J: Dysfunction in macrophage toll-like
receptor signaling caused by an inborn error of cationic amino acid
transport. Mol Immunol. 67:416–425. 2015. View Article : Google Scholar : PubMed/NCBI
|
|
52
|
Bermpohl D, Halle A, Freyer D, Dagand E,
Braun JS, Bechmann I, Schröder NW and Weber JR: Bacterial
programmed cell death of cerebral endothelial cells involves dual
death pathways. J Clin Invest. 115:1607–1615. 2005. View Article : Google Scholar : PubMed/NCBI
|
|
53
|
Bergsbaken T, Fink SL and Cookson BT:
Pyroptosis: Host cell death and inflammation. Nat Rev Microbiol.
7:99–109. 2009. View Article : Google Scholar : PubMed/NCBI
|
|
54
|
Into T, Kiura K, Yasuda M, Kataoka H,
Inoue N, Hasebe A, Takeda K, Akira S and Shibata K: Stimulation of
human Toll-like receptor (TLR) 2 and TLR6 with membrane
lipoproteins of Mycoplasma fermentans induces apoptotic cell death
after NF-kappa B activation. Cell Microbiol. 6:187–199. 2004.
View Article : Google Scholar : PubMed/NCBI
|
|
55
|
Armstrong L, Medford AR, Hunter KJ,
Uppington KM and Millar AB: Differential expression of Toll-like
receptor (TLR)-2 and TLR-4 on monocytes in human sepsis. Clin Exp
Immunol. 136:312–319. 2004. View Article : Google Scholar : PubMed/NCBI
|
|
56
|
Menasche G, Feldmann J, Houdusse A,
Desaymard C, Fischer A, Goud B and De SBG: Biochemical and
functional characterization of Rab27a mutations occurring in
Griscelli syndrome patients. Blood. 101:2736–2742. 2003. View Article : Google Scholar : PubMed/NCBI
|
|
57
|
Ménasché G, Pastural E, Feldmann J,
Certain S, Ersoy F, Dupuis S, Wulffraat N, Bianchi D, Fischer A, Le
Deist F and de Saint Basile G: Mutations in RAB27A cause Griscelli
syndrome associated with haemophagocytic syndrome. Nat Genet.
25:173–176. 2000. View
Article : Google Scholar : PubMed/NCBI
|
|
58
|
Johnson JL, Hong H, Monfregola J and Catz
SD: Increased survival and reduced neutrophil infiltration of the
liver in Rab27a- but not Munc13-4-deficient mice in
lipopolysaccharide-induced systemic inflammation. Infect Immun.
79:3607–3618. 2011. View Article : Google Scholar : PubMed/NCBI
|