Introduction
Glioblastoma (GBM) ranks as the most common
malignant brain tumor type in adults. Despite the low incidence of
~6 out of 100,000 individuals, the mortality rate of GBM is
relatively high (1). Patients
with GBM suffer not only from headaches, seizures and focal
deficits, but also exhibit personality and behavioral changes
(2). GBM has a poor prognosis
with relatively low survival estimates and the 5-year survival rate
is <5% (3).
Molecular-based therapies are considered to be
breakthrough measures for GBM (4). Various prognostic markers have been
identified in GBM, including overex-pressed epidermal growth factor
receptor (EGFR) and mutated tumor protein p53 (5). The EGFR vIII mutation is a
GBM-specific therapeutic target which is present in 50% of EGFR
gene-amplified GBM (6).
Phosphatase and tensin homolog was reported to be mutated in 5–40%
tumor tissues of GBM patients and is a promising prognostic
indicator for GBM patients aged >45 years (7). In order to develop novel therapeutic
strategies to increase overall patient survival, the underlying
mechanisms of GBM require to be further elucidated.
Previous studies have explored the signature of
deregulated genes for developing effective treatments and better
clinical prognostic methods for GBM patients. Bao et al
(8) identified a nine-gene
signature in glioma patients using the mRNA expression data. An
EGFR- and platelet-derived growth factor receptor α-centered
classification scheme in glioma was established by Sun et al
(9). In addition, according to
the 2016 World Health Organization (WHO) classification of tumors
of the central nervous system, molecular features are incorporated
into the classification of GBM (10). In the present study,
differentially expressed genes (DEGs) were identified from
microarray data downloaded from The Cancer Genome Atlas (TCGA) and
Gene Expression Omnibus (GEO) databases. Based on the co-expression
network of prognosis-associated DEGs, a prognostic prediction
system was constructed using Bayes discriminant analysis.
Subsequently, the system established in the present study was
validated using microarray data from the TCGA dataset, another GEO
dataset and a Chinese Glioma Genome Atlas (CGGA) dataset.
Materials and methods
Microarray data
The mRNA expression data for GBM were downloaded
from TCGA database (https://gdc-portal.nci.nih.gov/) on 25th Dec 2016,
including 154 tumor samples (survival time information was
available for 152 samples) and 13 normal samples. The normal
samples were collected from some of the 154 patients with GBM. The
Illumina HiSeq 2000 RNA Sequencing platform was used. The genes
were identified from the mRNAs in the downloaded dataset using the
Human Gene Organization Gene Nomenclature Committee website
(http://www.genenames.org/).
Another GBM microarray dataset, GSE22866, was
downloaded from the GEO database (http://www.ncbi.nlm.nih.gov/geo/query/acc.cgi?acc=GSE22866),
which contained 40 tumor samples and 6 corresponding normal
samples. The raw data in the dataset were annotated to obtain the
gene expression levels and the average expression values of probes
were considered as the expression values of the corresponding
genes. Next, the expression values of the genes were subjected to
log2 transformation and normalization using the Limma package in R
language (11). The clinical
characteristics of the subjects from which the TCGA and GSE22866
datasets were derived are summarized in Table I.
 | Table IClinical characteristics of patients
from the TCGA, CGCA and GEO GSE13041 datasets. |
Table I
Clinical characteristics of patients
from the TCGA, CGCA and GEO GSE13041 datasets.
| Clinical
characteristic | TCGA (n=172)
| CGCA (n=126) | GEO GSE13041
(n=191) |
|---|
| Tumor | Normal |
|---|
| Age (years) | 59.84±13.54 | 54.62±12.27 | 46.99±12.04 | 53.83±13.65 |
| Gender
(male/female/undefined) | 99/54/1 | 8/5/5 | 78/48 | 117/74 |
| Survival status
(dead/alive/unknown) | 102/40/12 | 12/1/5 | 89/37 | 176/15 |
| Overall survival
time (months) | 12.06±10.41 | 17.09±11.89 | 14.49±8.05 | 19.37±19.41 |
Screening for DEGs
DEGs between tumor and normal samples were
identified in the TCGA and GEO datasets using the Limma and
multitest package from Bioconductor (http://bioconductor.org/) in R language (11,12). False discovery rate <0.5 and
|log2 fold change (FC)|>1 were set as the cut-off criteria. The
DEGs overlapping between the two datasets were selected for further
analysis. The top 50 overlapping DEGs based on the size of their
|log2FC| values were subjected to bidirectional clustering.
Identification of prognosis-associated
DEGs
Cox regression analysis in the survival package
(13) was utilized to select the
prognosis-associated genes from the overlapping DEGs, based on the
expression values and survival status data. P<0.05 was set as a
strict threshold. The top 6 DEGs based on their log-rank P-values
were screened as the prognosis-associated DEGs, and were numbered
according to their log-rank P-values. Kaplan-Meier survival
analysis was performed for the top 6 prognosis-associated DEGs.
Co-expression network of
prognosis-associated DEGs
Correlation coefficients (r) between these
prognosis-associated DEGs were calculated using the cor function in
R language. The DEG interaction pairs with coefficients of |r|≥0.6
and P<0.05 were selected to construct a co-expression network,
which was visualized using Cytoscape2.8.0 (http://www.cytoscape.org/). Functional modules in the
co-expression network were identified using the GraphWeb tool
(http://biit.cs.ut.ee/graphweb/)
(14).
Construction of a prognostic prediction
system
The 152 GBM tumor samples from TCGA were stratified
into two groups based on good prognosis and bad prognosis. The good
prognosis group was comprised of the samples from patients that
were alive and those with a survival time of ≥15 months following
sample collection, while the bad prognosis group was comprised of
the samples from deceased patients and those with a survival time
of <15 months. Based on this grouping, Bayes discriminant
analysis was performed to analyze the genes in the co-expression
network constructed for the prognosis-associated DEGs by using the
discriminant Bayes function in R language (15,16). The discriminant coefficient under
the highest discriminant accuracy was considered as the prognostic
score. The prognostic DEGs were assembled randomly to genesets to
identify the prognostic discriminant. The effectiveness of the
prognostic prediction system was evaluated by the receiver
operating characteristic (ROC) curve using the pROC package in
R3.4.1 (https://cran.r-project.org/web/packages/pROC/index.html).
The genes in the highest prognostic discriminant geneset were
considered to be signature genes and thereby the constructed system
was the prognostic prediction system.
Validation of the prognostic prediction
system
To verify the prognostic prediction effect of the
constructed system, Kaplan-Meier survival analysis was performed to
compare good and bad prognosis groups, which were divided with the
scores calculated by the prediction system established in the
present study according to the expression level of the signature
genes. Next, the microarray dataset GSE13041, containing 191 GBM
tumor samples with survival data, was downloaded from the GEO
database for further validation of the prediction system. The
expression values of the signature genes in this dataset were
subjected to analysis with the prediction system for distinguishing
different samples based on their prognostic score. Kaplan-Meier
survival analysis was also performed to compare the survival status
of the two groups to determine the prognostic efficacy of the
system. In addition, PartA expression profiles, including 128 GBM
tumor samples with survival data, were downloaded from the CGGA
database for further validation. Clinical features of patients from
which the CGGA dataset was derived are listed in Table I. A similar analysis as for the
GSE13041 dataset was performed for validation of the prediction
system.
Co-expression network of signature
genes
Based on the expression values of these signature
genes in TCGA dataset, r values between these signature genes were
calculated using the cor function in R 3.4.1 language (https://stat.ethz.ch/R-manual/R-devel/library/stats/html/cor.html).
These gene interaction pairs with coefficients of |r|≥0.6 and
P<0.05 were collected to construct the co-expression network of
these signature genes.
Function and pathway enrichment
Function and pathway enrichment was performed for
the hub genes in the signature genes co-expression network using
the cluster Profiler package in R language (https://bioconductor.org/packages/release/bioc/html/clusterProfiler.html)
(17).
Results
DEG screening
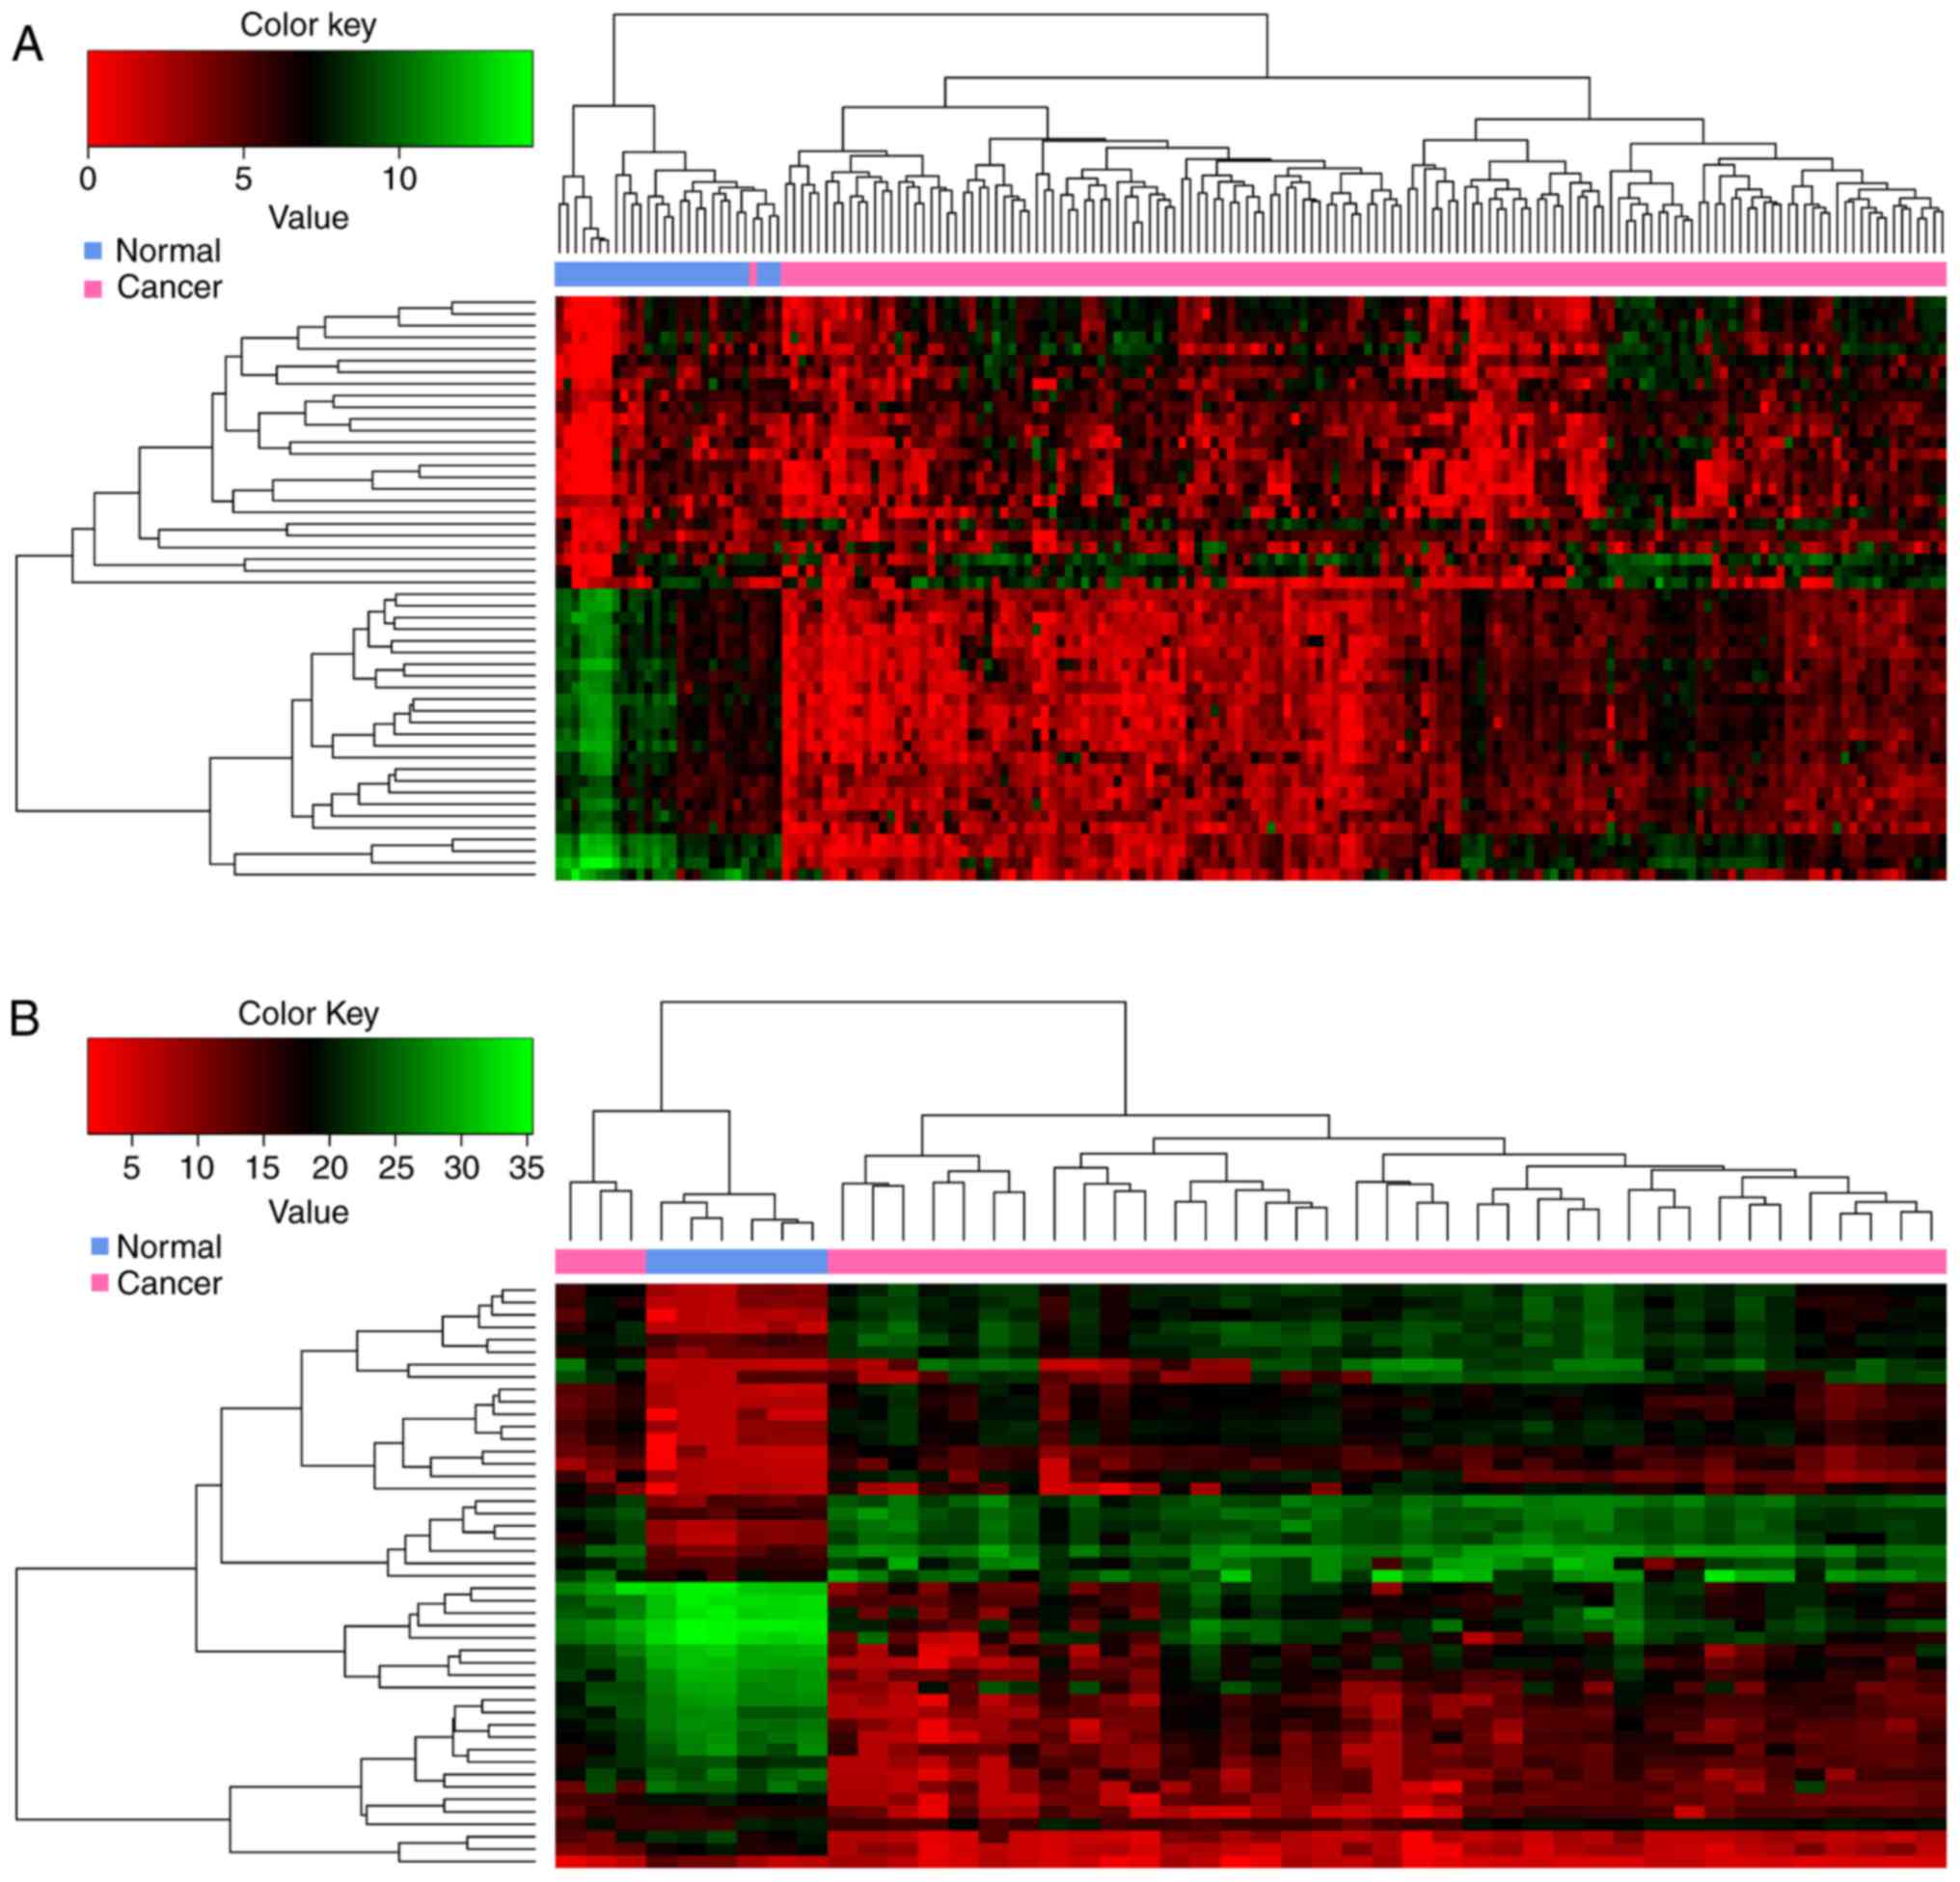
In the present study, 370 and 3564 DEGs were
screened from TCGA dataset and the GEO dataset no. GSE22866,
respectively. Among them, 288 DEGs overlapped. The heatmap obtained
after bidirectional clustering of the top 50 overlapping DEGs with
the highest |log2FC| values is presented in Fig. 1. The expression values of these
DEGs were obviously different between normal and GBM samples.
Prognosis-associated DEGs
A total of 123 prognosis-associated DEGs were
selected using Cox regression analysis and the log-rank test. These
prognosis-associated DEGs were ranked according to their P-values
(log-rank test; data not shown). Kaplan-Meier survival curves of
the top 6 prognosis-associated DEGs, including V-set and
transmembrane domain containing 2-like, calcium-binding protein 1,
CD22, neurexin 3, small G protein signaling modulator 1 and
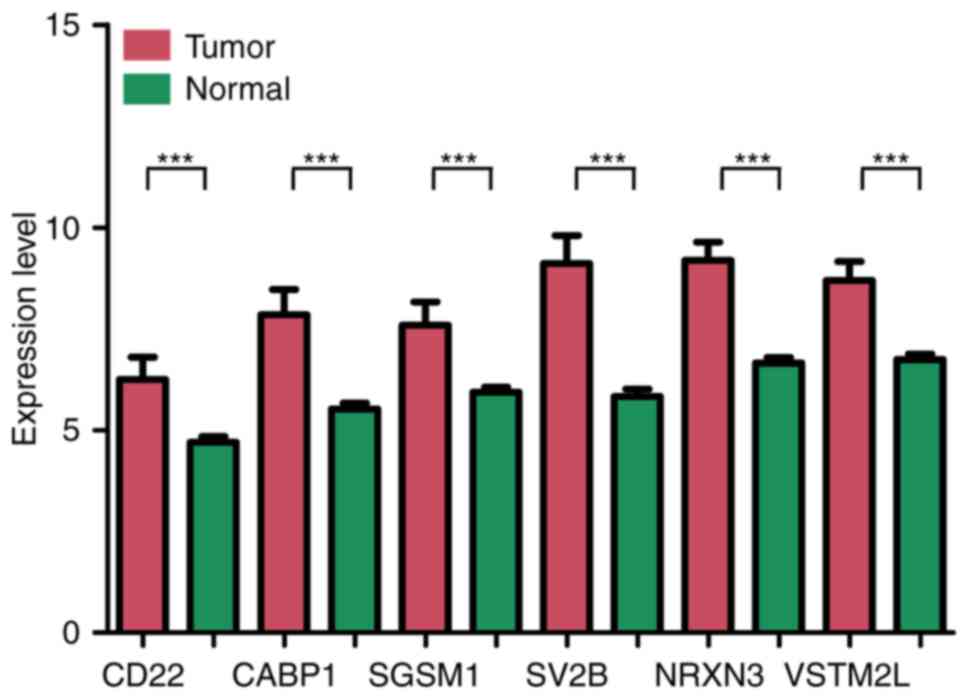
synaptic vesicle glycoprotein 2b, are presented in Fig. 2. The difference in expression of
the top 6 genes between tumor tissue and normal tissue are
presented in Fig. 3. All of these
DEGs were able to distinguish between groups with different
survival status (P<0.05).
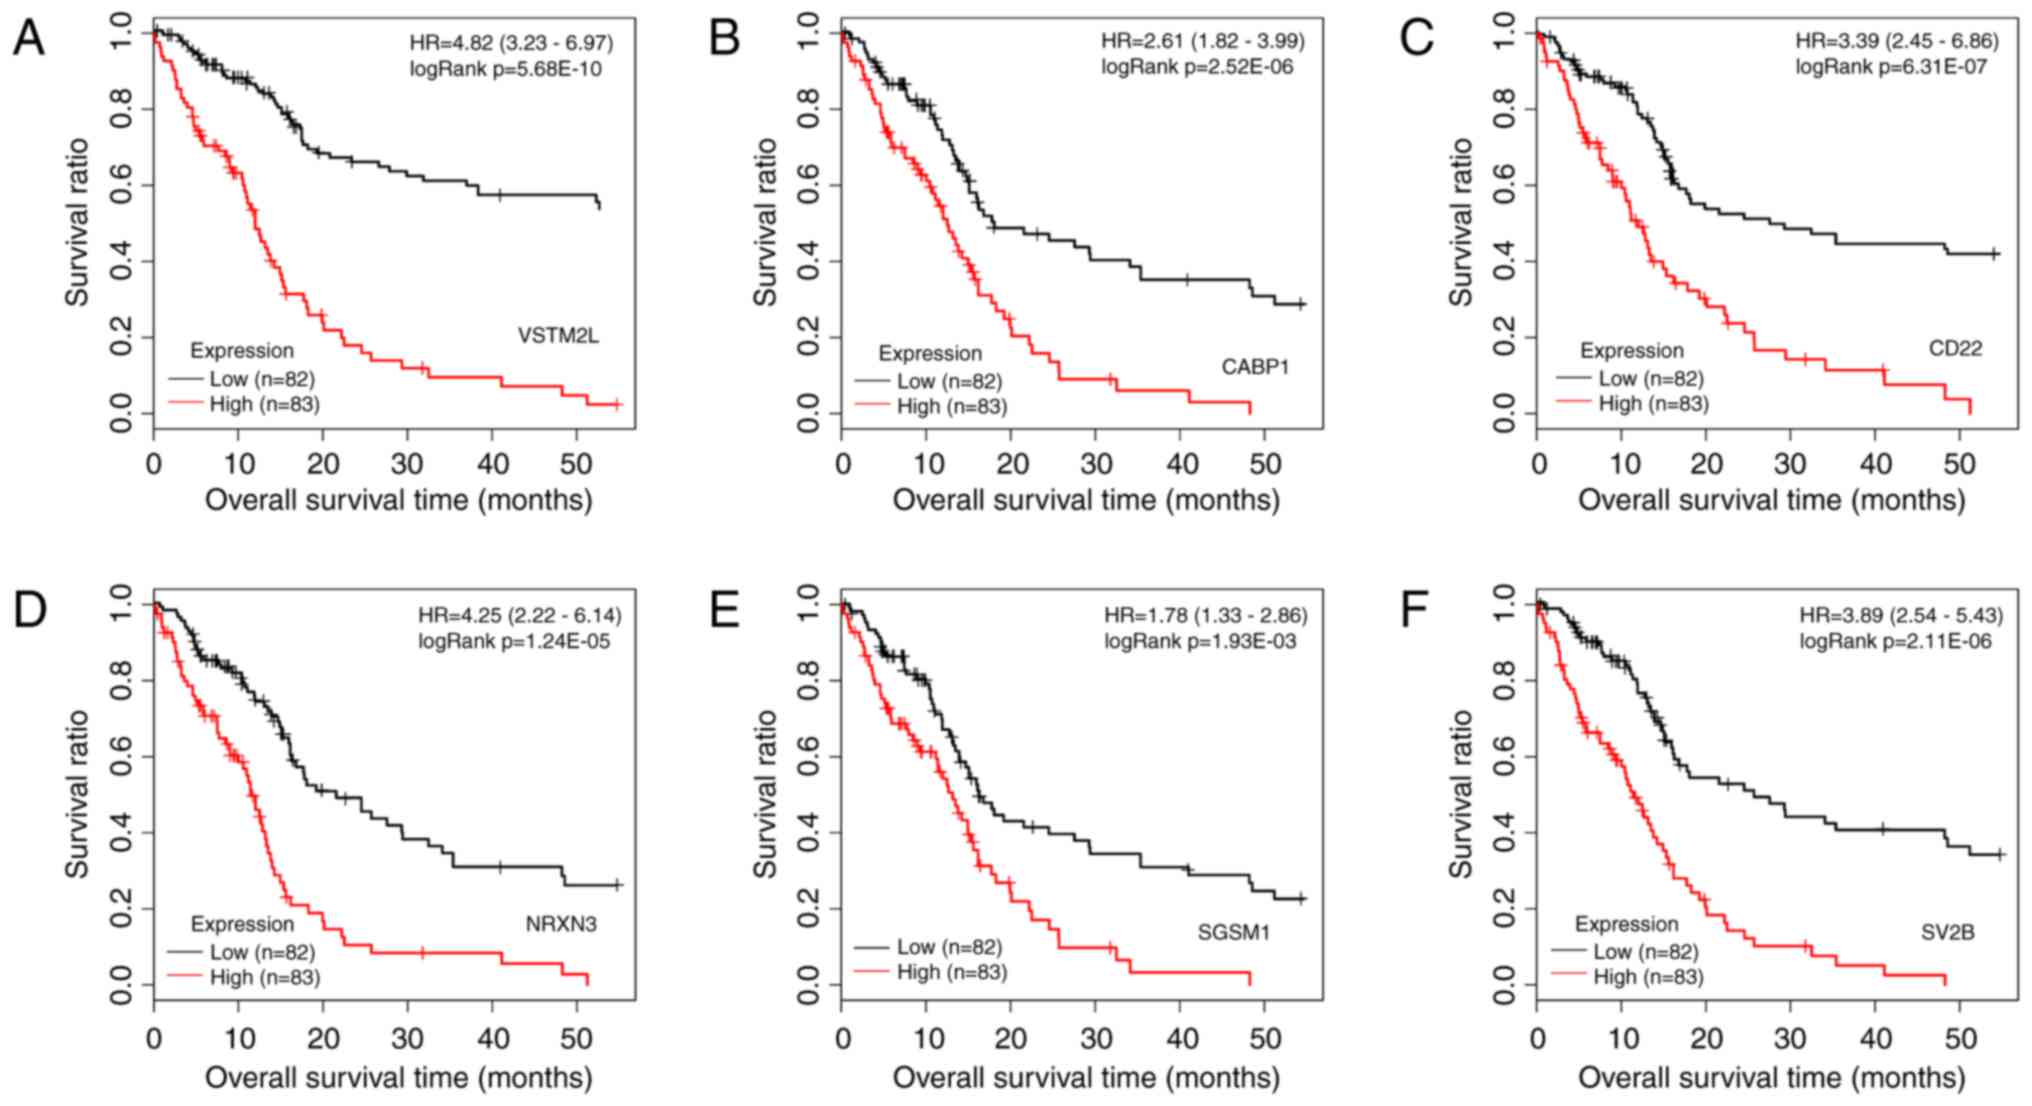 | Figure 2Kaplan-Meier survival curves with
patients stratified by high and low expression of the top 6
prognosis-associated differentially expressed genes. (A) VSTM2L,
(B) CABP1, (C) CD22, (D) NRXN3, (E) SGSM1 and (F) SV2B. The samples
with different expression are marked in different colors (red and
black). HR, hazard ratio; VSTM2L, V-set and transmembrane domain
containing 2 like; CABP1, calcium-binding protein 1; NRXN3,
neurexin 3; SGSM1, small G protein signalling modulator 1; SV2B,
synaptic vesicle glycoprotein 2b. |
Co-expression network of
prognosis-associated DEGs
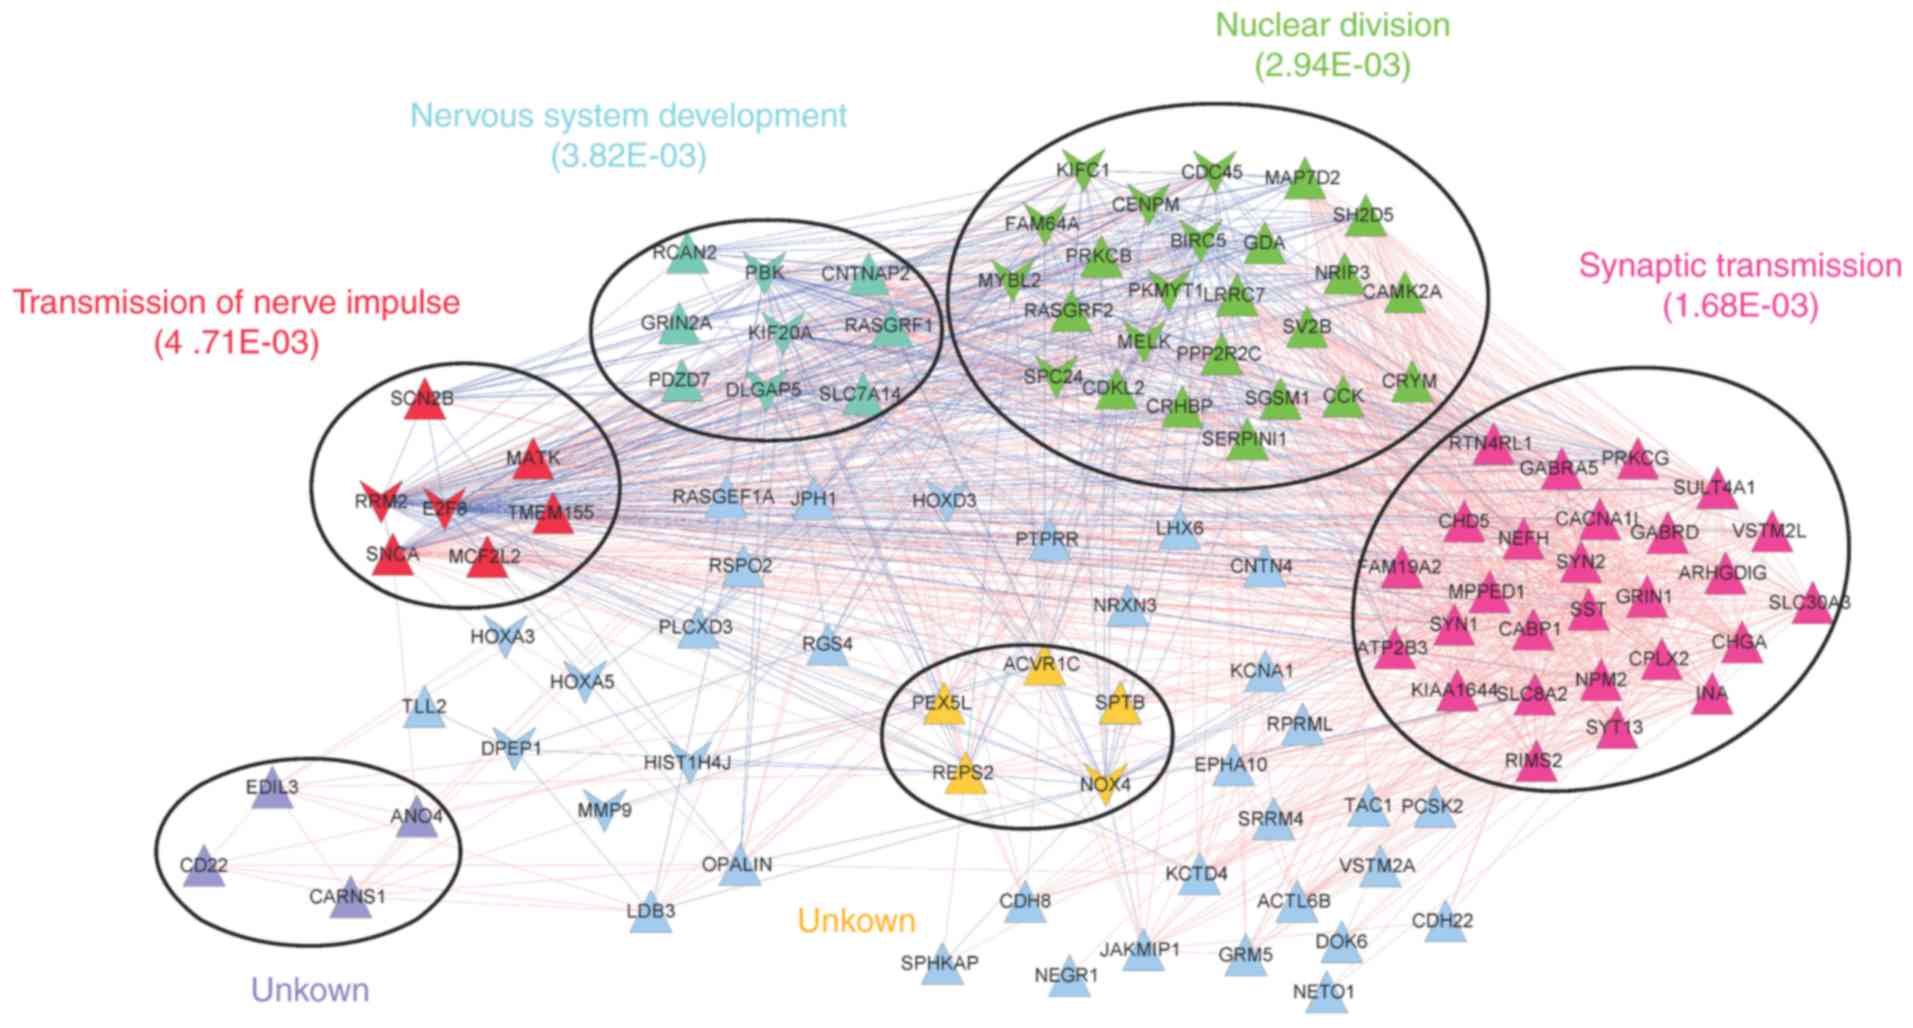
The co-expression network was comprised of 1405
interaction pairs of 112 prognosis-associated DEGs (91 upregulated
and 21 downregulated DEGs). A total of 6 significant modules were
identified in the network (Fig.
4). Functional analysis revealed that the modules were
associated with transmission of nerve impulses (red), nervous
system development (blue), nuclear division (green), synaptic
transmission (pink) or further unknown functions (yellow and
purple).
Construction of prognostic prediction
system
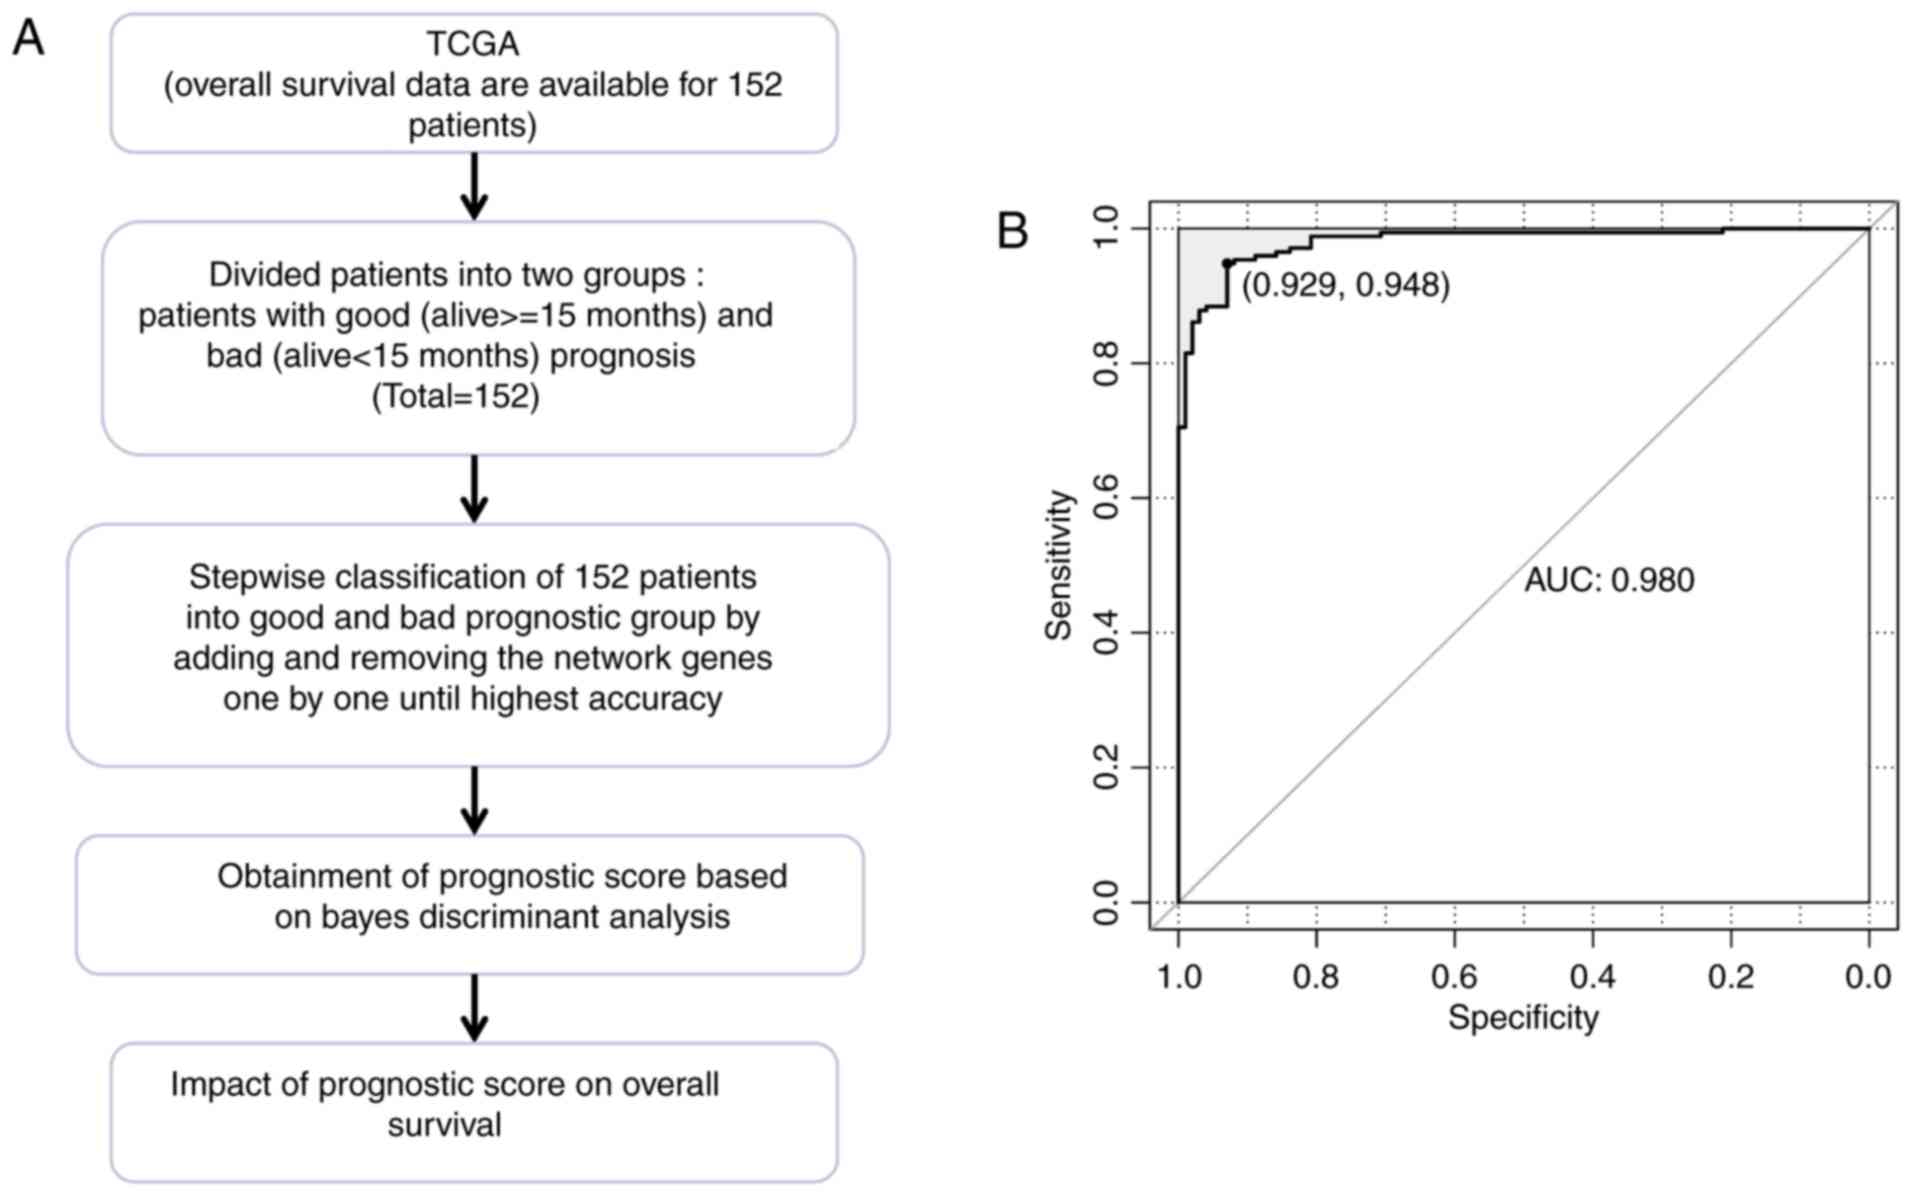
The TCGA dataset included 50 patients with good
prognosis and 102 patients with bad prognosis. Based on the
co-expression network of prognosis-associated genes, a prognostic
prediction system comprising 63 signature genes was constructed
using Bayes discriminant analysis. The discriminant accuracy of the
prognostic prediction system was identified from the ROC curve by
determining the area under the curve (AUC) (Fig. 5). The samples from patients with
scores −3< score <0 were defined as good prognosis; the
samples from patients with scores 0≤ score <3 were defined as
bad prognosis. The specificity value was 0.929 and the sensitivity
value was 0.948 for the ROC curve with the largest AUC of
0.980.
Validation of the prognostic prediction
system
In order to validate the performance of the
prognostic prediction system, it was tested on the GEO GSE13041 and
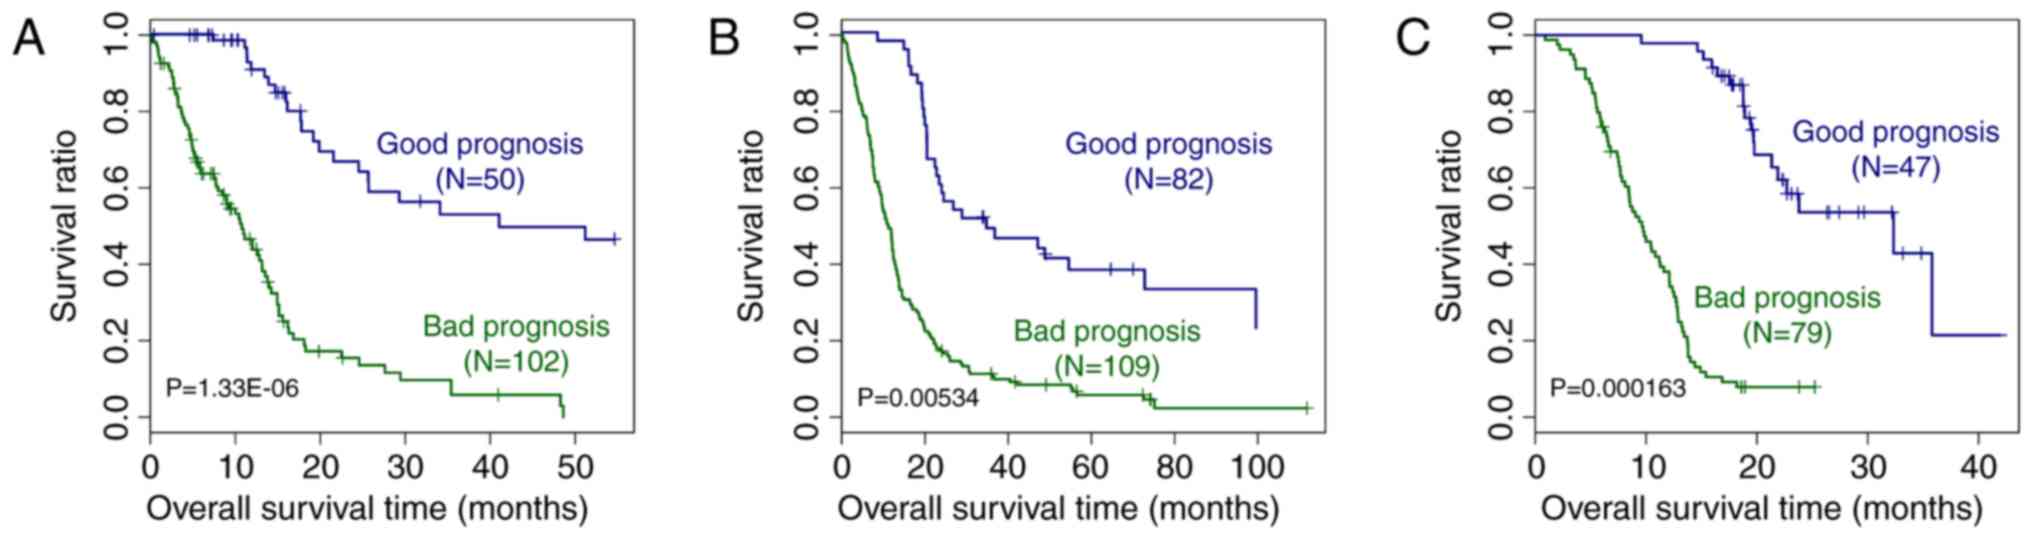
CGGA datasets. As presented in Fig.
6, based on the expression of the signature genes included in
the prognostic prediction system, it was possible to distinguish
between samples from patients with good and bad prognosis from the
TCGA, GEO GSE13041 and CGGA datasets (P=1.33×10⁻⁶,
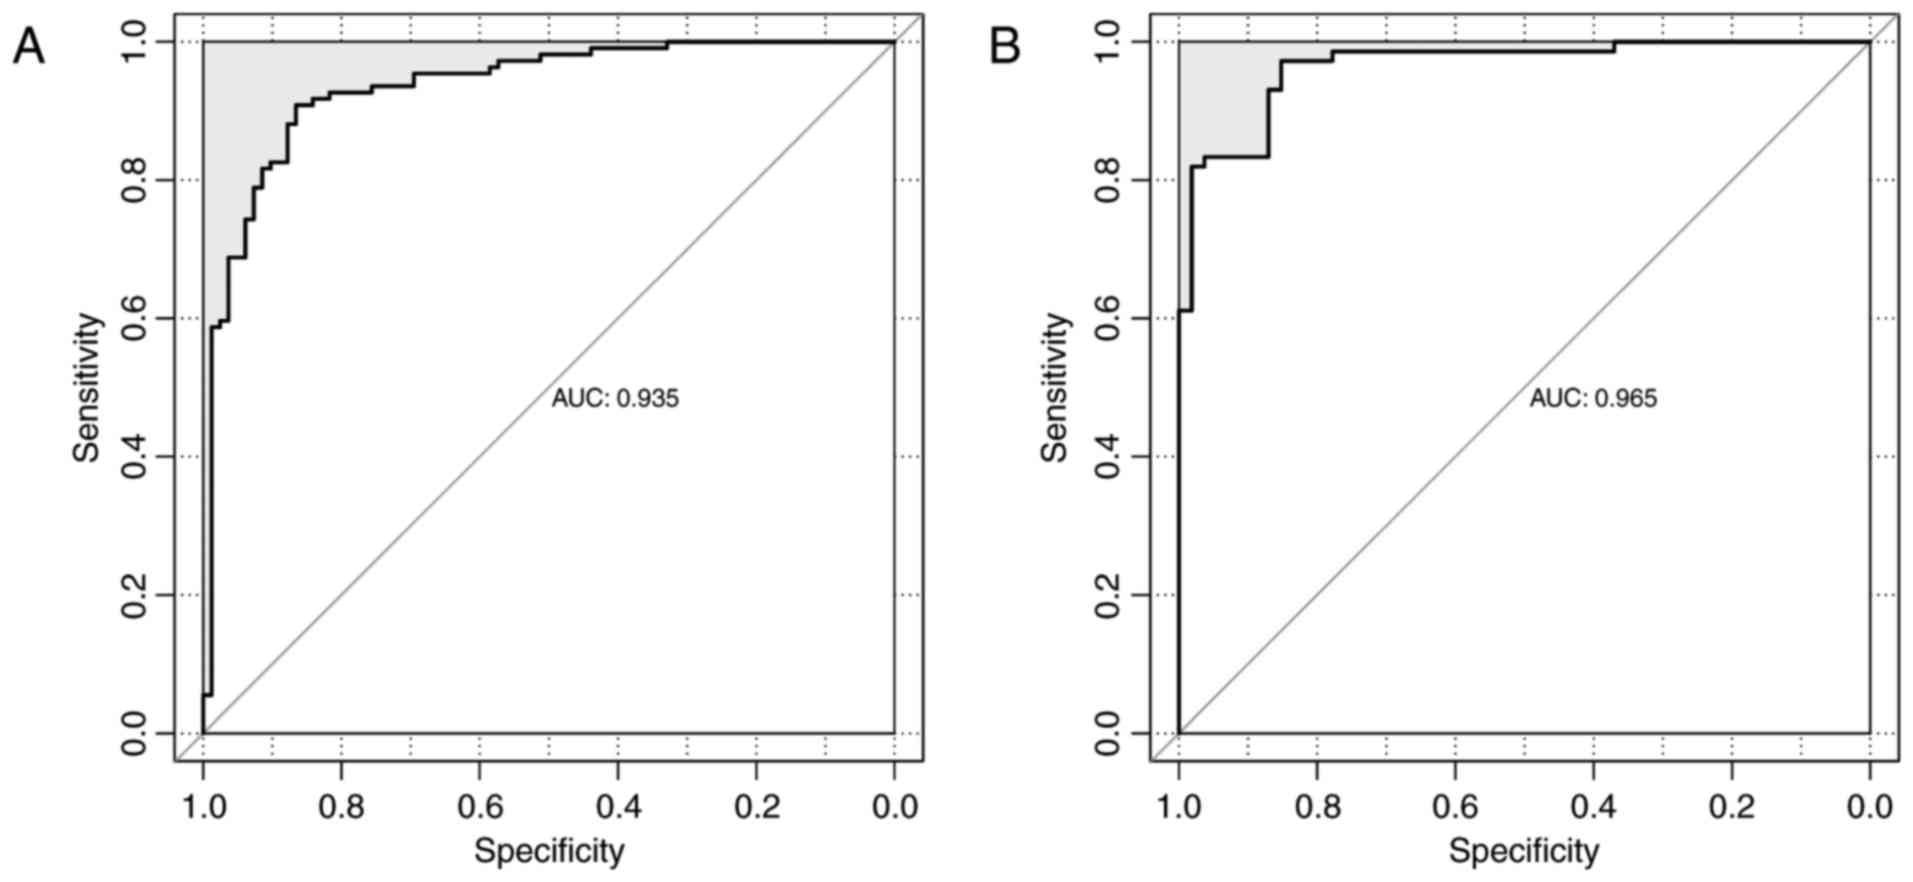
0.00534 and 1.63×10⁻⁴, respectively). The ROC curves of
the GSE13041 and CGGA datasets are displayed in Fig. 7. The AUC was 0.935 and 0.965,
respectively. All of these results proved the accuracy of the
prognostic prediction system.
Co-expression network of signature
genes
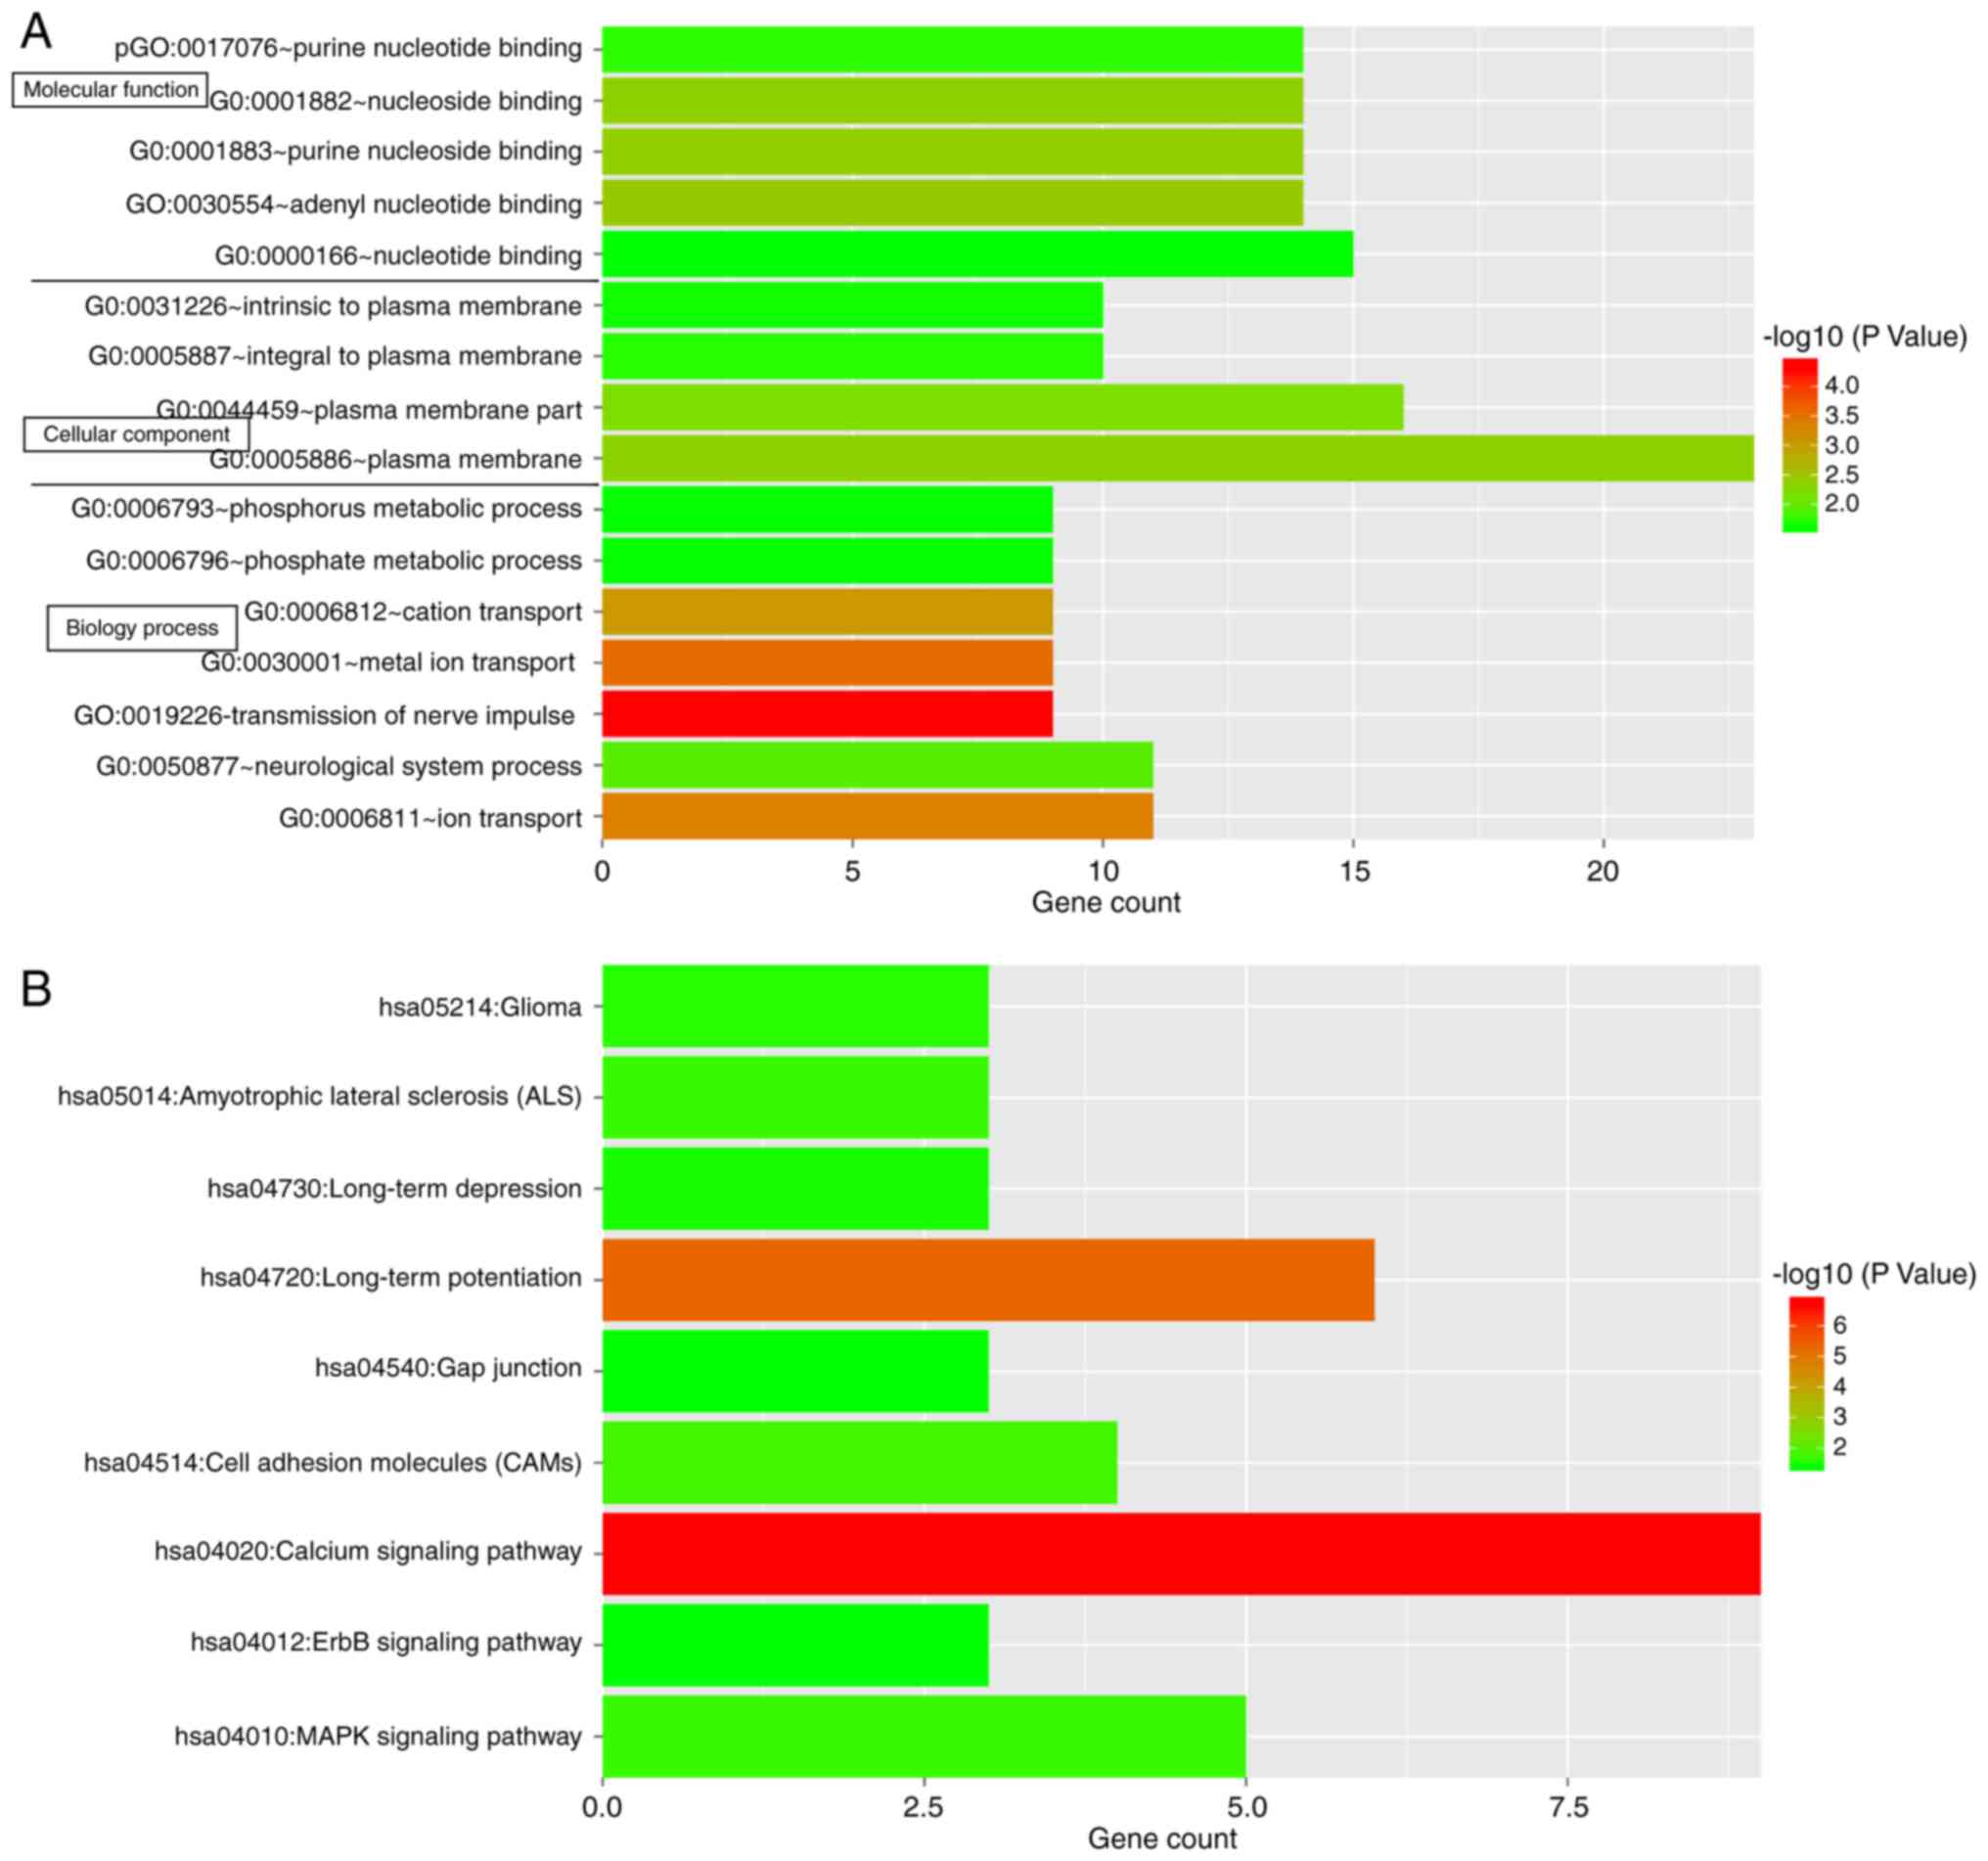
For investigating the possible roles of the 63
prognostic signature genes in GBM, functional and pathway
enrichment analysis was performed. The genes were enriched in a
total of 16 significant functional terms and 9 significant pathway
terms (Fig. 8). The top 3
functional terms included plasma membrane, plasma membrane part and
nucleotide binding, while the top 3 pathway terms included calcium
signaling pathway, long-term potentiation and the
mitogen-associated protein kinase (MAPK) signaling pathway.
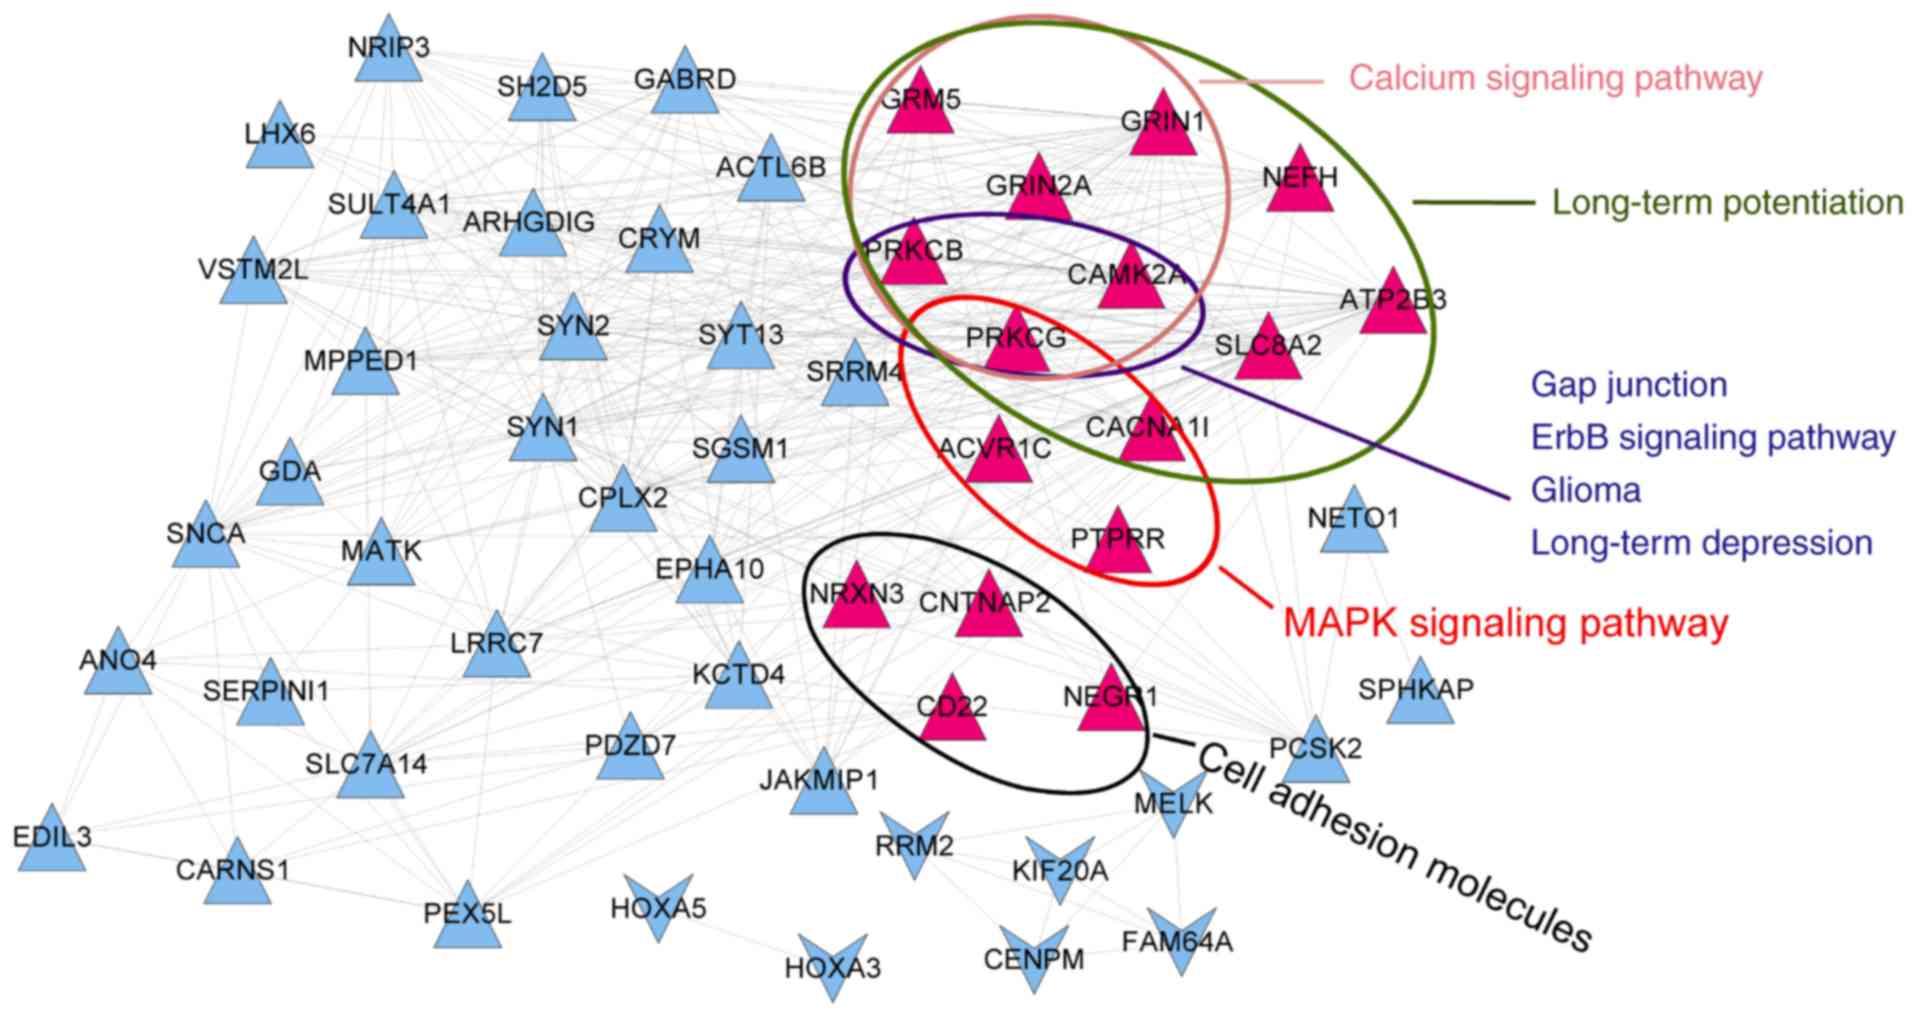
To gain a better understanding of the associations
of these genes with pathways, a co-expression network of signature
genes with significant pathways was constructed. The network
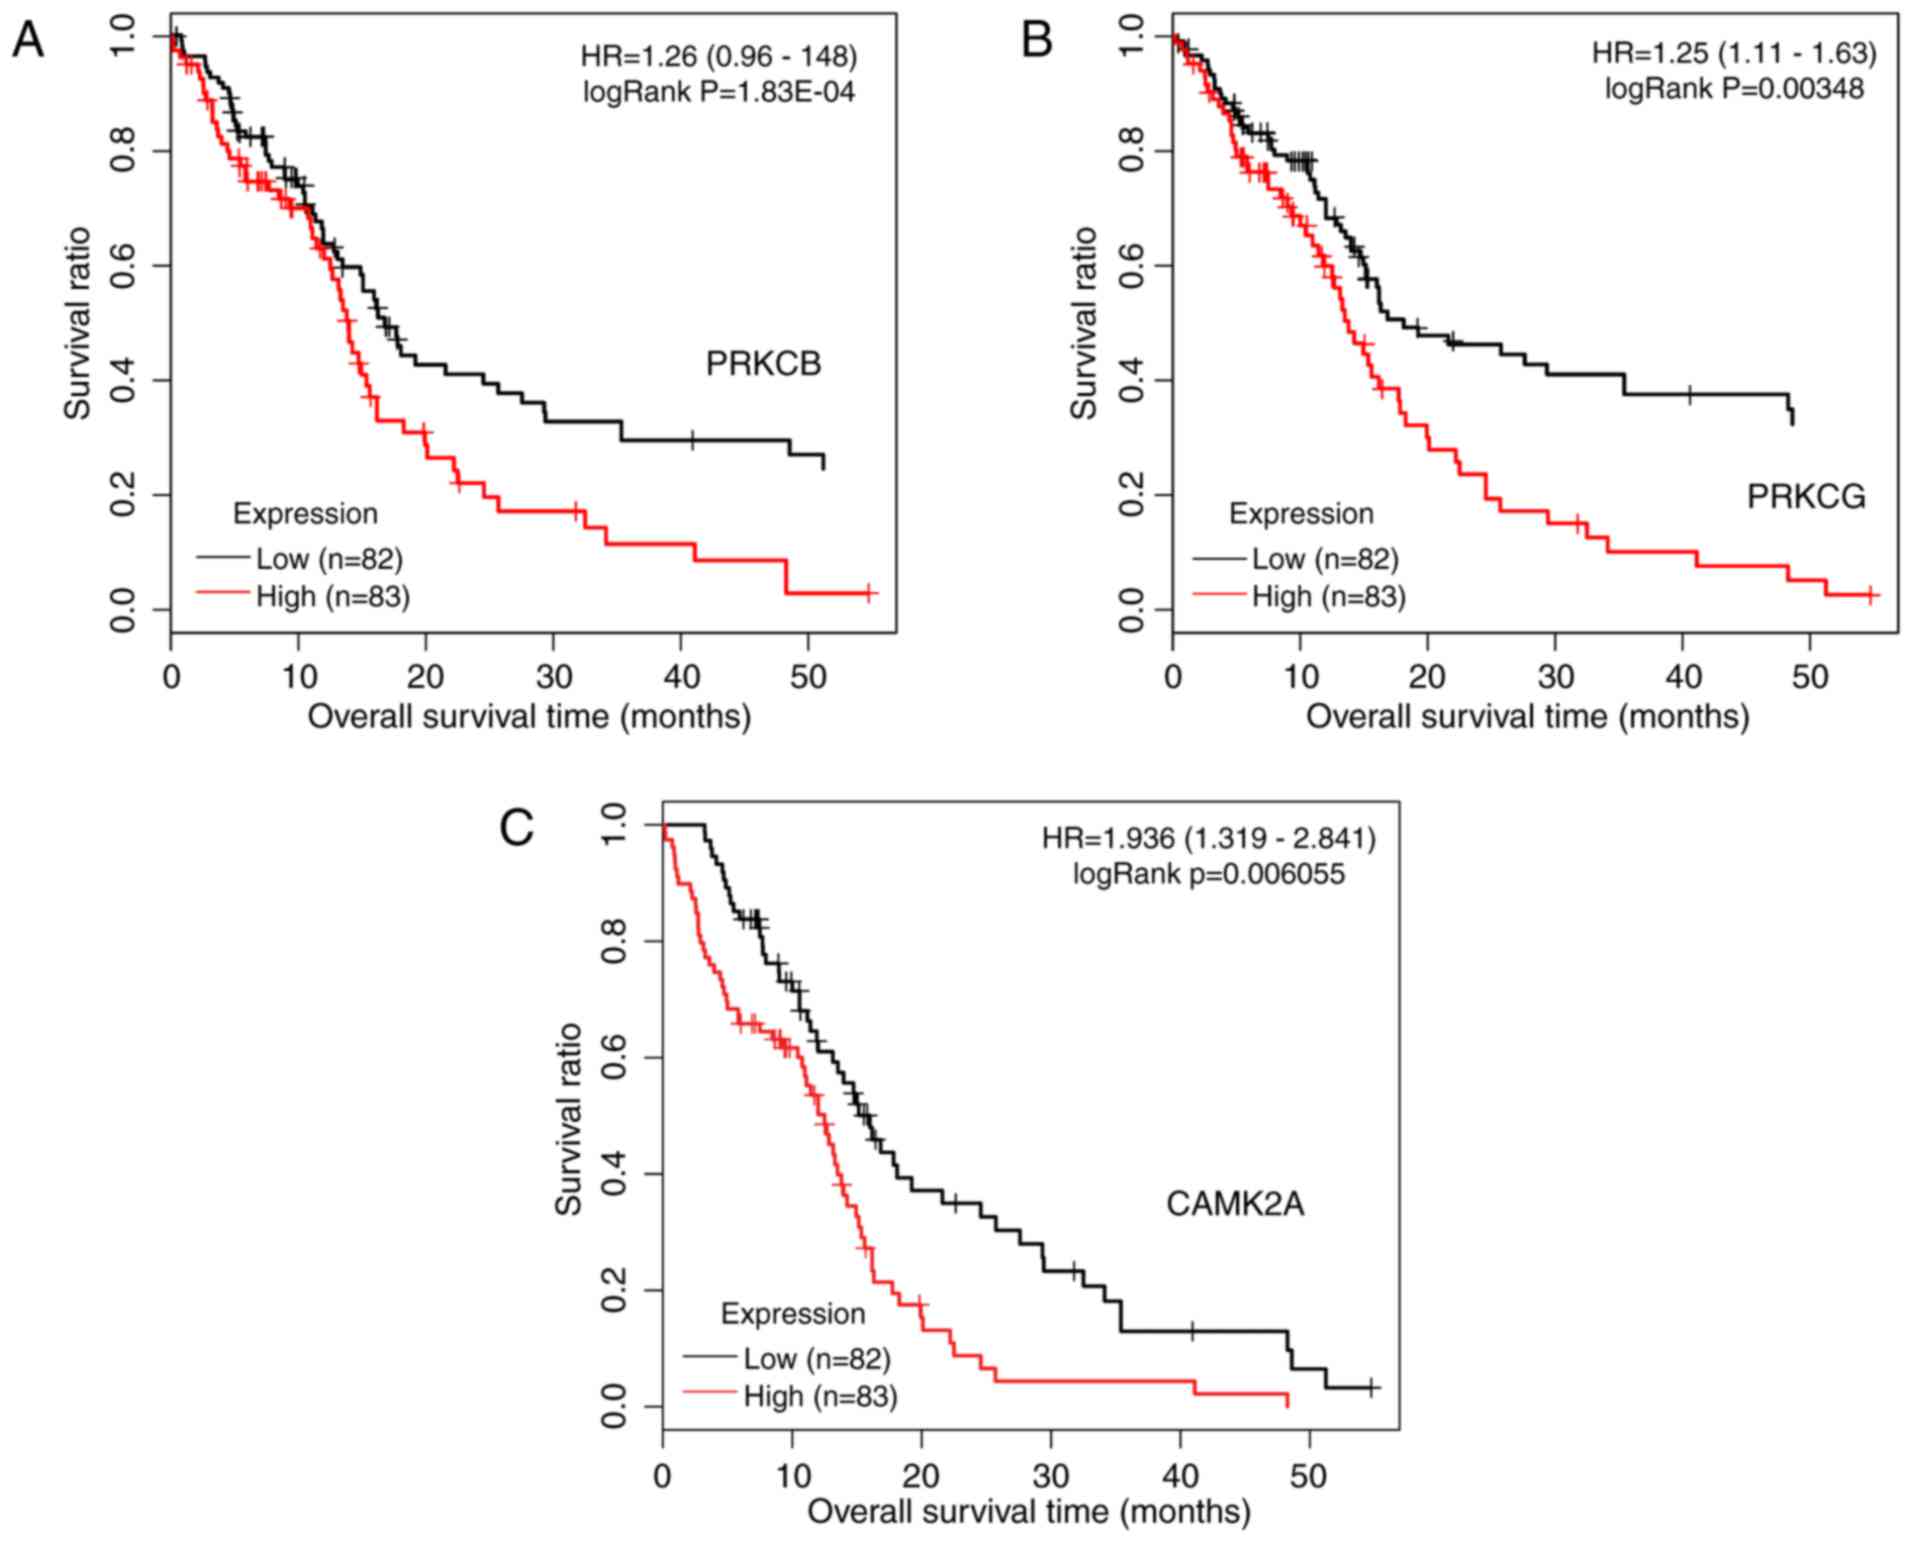
included 56 genes and 361 interactions. As presented in Fig. 9, protein kinase C (PKC) γ (PRKCG)
and PKC β (PRKCB) participated in 7 common pathways, and
calcium/calmodulin-dependent protein kinase IIα (CAMK2A) was
involved in 6 pathways. Kaplan-Meier curves with patients
stratified according to high or low expression of each of the three
genes are presented in Fig. 10.
Based on the expression of these three genes, it was possible to
distinguish between samples with significantly different survival
risks.
Discussion
GBM is a highly aggressive form of brain cancer
associated with a poor prognosis. By analyzing the TCGA and GEO
GSE22866 datasets, it was identified that they had 288 of the
screened DEGs in common. A total of 123 prognosis-associated DEGs
were selected from the overlapped DEGs. The co-expression network
of the prognosis-associated DEGs was comprised of 1,405
interactions, 91 upregulated DEGs and 21 downregulated DEGs. A
total of 6 significant modules were identified in the network, and
their significant functions included transmission of nerve impulse,
nervous system development, nuclear division and synaptic
transmission. The prognostic prediction system was comprised of 63
signature genes with the specificity value of 0.929 and the
sensitivity value of 0.948. The prognostic prediction system was
able to distinguish between samples with good and bad prognosis
from the TCGA, GEO GSE13041 and CGGA datasets based on the
expression of the signature genes (P=1.33×10⁻⁶, 0.00534
and 1.63×10⁻⁴, respectively). The 63 prognostic
signature genes were significantly enriched in 16 significant
functional terms and 9 significant pathway terms. The top 3
functional terms included plasma membrane, plasma membrane part and
nucleotide binding, while the top 3 pathway terms included calcium
signaling pathway, long-term potentiation and the MAPK signaling
pathway. In the co-expression network of signature genes with
significant pathways, PRKCG and PRKCB were two important genes
participating in 7 common significant pathways, while CAMK2A was
involved in 6 significant pathways. Based on the expression status
of the three genes, it was possible to distinguish between samples
with significantly different survival risk.
Calcium mediates long-term potentiation in the
hippo-campus (18), and is
involved in activating the MAPK pathway. In addition, cytosolic
calcium regulates ion channels located in the plasma membrane
(19). Evidence suggested that
calcium signaling has a tumorigenic role in GBM (20). Long-term potentiation is an
underlying mechanism for learning and memory. Previous studies have
demonstrated that the MAPK pathway is implicated in GBM cell
migration and proliferation (21,22). The present study suggested that
these signature genes may be associated with the prognosis of GBM
patients, partly by modulating the calcium signaling pathway,
long-term potentiation and the MAPK signaling pathway.
PRKCG is a susceptibility locus for behavioral
disinhibition (23). PRKCG
encodes the PKC family γ isoform, which normally only occurs in the
nervous system. PRKCG is the receptor of phorbol esters, which
functions as a class of tumor promoter (24). Louhimo et al (25) reported that Homo sapiens
microRNA-23a has a survival effect and its target PRKCG
participates in GBM progression-associated processes. It has been
reported that PRKCG mutations in spinocerebellar ataxia type 14
affect C1 domain accessibility and kinase activity, leading to
aberrant MAPK signaling (26).
PRKCG was reported to be mutated in spinocerebellar ataxia, causing
aberrant MAPK signaling (26).
The MAPK signaling pathway is involved in the migration and
proliferation of GBM cells (21),
and MAPK/extracellular signal-regulated kinase signaling activity
is comprised of the migration and invasion ability of glioma cells
(27). The MAPK signaling pathway
also participates in the cellular activity of survival or death
(28). Activation of the RAS-MAPK
pathway is associated with poor prognosis in neuroblastoma tumors
(29). In the present study, it
was therefore inferred that PRKCG may affect the prognosis of GBM
by the influencing MAPK signaling pathway.
PRKCB also belongs to the PKC family and is
considered as a tumor promoter gene, as it enhances certain
cellular signaling pathways (30). PRKCB modulates the rate of
autophagy, which serves as a pro-death or pro-survival mechanism
(31). The PKC family also
participates in several cell life and survival-associated
processes, including the regulation of cell survival and apoptosis
(32). Upregulation of PRKCB is
considered beneficial and was identified to be associated with
relapse-free survival of breast cancer patients (33). PRKCB is aberrantly expressed in
GBM and its expression levels have been reported to be proportional
to patient survival time (34).
Hence, PRKCB may be a potential prognostic indicator for GBM.
CAMK2A encodes an enzyme involved in
calcium-calmodulin-dependent activity. Calcium/calmodulin-dependent
protein kinases participate in activating anti-apoptotic signaling
pathways and regulating the cell cycle (35). In the present study, CAMK2A was
identified to be significantly enriched in long-term potentiation
and calcium signaling pathways. This indicates that CAMK2A may
affect the prognosis of GBM patients, partly by modulating
long-term potentiation and calcium signaling pathways.
The 2016 WHO Classification of Tumors of the Central
Nervous system introduced molecular parameters for grouping tumors
(10). It is expected that
thereby, the accuracy in the diagnosis as well as prognosis of
patients may be improved. In the present study, PRKCG, PRKCB and
CAMK2A were identified as potential prognostic factors for GBM. The
use of PRKCG, PRKCB and CAMK2A as novel molecular markers for GBM
may lead to an improvement in prognostic accuracy. Of note, the
present study had certain limitations. First, the sample size of
patients was limited. Furthermore, the present study focused on
bioinformatics analyses only. In vivo and in vitro
experiments are required to verify the results of the present
study.
In conclusion, the present study established an
effective prognostic prediction system and validated its prognostic
performance for GBM. PRKCG, PRKCB and CAMK2A may be potential
prognostic factors for GBM.
Notes
[1] Competing
interests
The authors declare that they have no competing
interests.
References
|
1
|
Ricard D, Idbaih A, Ducray F, Lahutte M,
Hoang-Xuan K and Delattre JY: Primary brain tumours in adults.
Lancet. 379:1984–1996. 2012. View Article : Google Scholar : PubMed/NCBI
|
|
2
|
Catt S, Chalmers A and Fallowfield L:
Psychosocial and supportive-careneeds in high-grade glioma. Lancet
Oncol. 9:884–891. 2008. View Article : Google Scholar : PubMed/NCBI
|
|
3
|
Smoll NR, Schaller K and Gautschi OP:
Long-term survival of patients with glioblastoma multiforme (GBM).
J Clin Neurosci. 20:670–675. 2013. View Article : Google Scholar : PubMed/NCBI
|
|
4
|
Drappatz J, Norden AD and Wen PY:
Therapeutic strategies for inhibiting invasion in glioblastoma.
Expert Rev Neurother. 9:519–534. 2009. View Article : Google Scholar : PubMed/NCBI
|
|
5
|
Thakkar JP, Dolecek TA, Horbinski C,
Ostrom QT, Lightner DD, Barnholtz-Sloan JS and Villano JL:
Epidemiologic and molecular prognostic review of glioblastoma.
Cancer Epidemiol Biomarkers Prev. 23:1985–1996. 2014. View Article : Google Scholar : PubMed/NCBI
|
|
6
|
Gan HK, Kaye AH and Luwor RB: The EGFRvIII
variant in glioblastoma multiforme. J Clin Neurosci. 16:748–754.
2009. View Article : Google Scholar : PubMed/NCBI
|
|
7
|
Srividya MR, Thota B, Shailaja BC,
Arivazhagan A, Thennarasu K, Chandramouli BA, Hegde AS and Santosh
V: Homozygous 10q23/PTEN deletion and its impact on outcome in
glioblastoma: A prospective translational study on a uniformly
treated cohort of adult patients. Neuropathology. 31:376–383. 2011.
View Article : Google Scholar
|
|
8
|
Bao ZS, Li MY, Wang JY, Zhang CB, Wang HJ,
Yan W, Liu YW, Zhang W, Chen L and Jiang T: Prognostic value of a
nine-gene signature in glioma patients based on mRNA expression
profiling. CNS Neurosci Ther. 20:112–118. 2014. View Article : Google Scholar
|
|
9
|
Sun Y, Zhang W, Chen D, Lv Y, Zheng J,
Lilljebjörn H, Ran L, Bao Z, Soneson C, Sjögren HO, et al: A glioma
classification scheme based on coexpression modules of EGFR and
PDGFRA. Proc Natl Acad Sci USA. 111:3538–3543. 2014. View Article : Google Scholar : PubMed/NCBI
|
|
10
|
Wen PY and Huse JT: 2016 World Health
Organization classification of central nervous system tumors.
Continuum (Minneap Minn). 23:1531–1547. 2017.
|
|
11
|
Li H, Yu B, Li J, Su L, Yan M, Zhang J, Li
C, Zhu Z and Liu B: Characterization of differentially expressed
genes involved in pathways associated with gastric cancer. PloS
One. 10:e01250132015. View Article : Google Scholar : PubMed/NCBI
|
|
12
|
Gu C and Shen T: cDNA microarray and
bioinformatic analysis for the identification of key genes in
Alzheimer’s disease. Int J Mol Med. 33:457–461. 2014. View Article : Google Scholar
|
|
13
|
Wang P, Wang Y, Hang B, Zou X and Mao JH:
A novel gene expression-based prognostic scoring system to predict
survival in gastric cancer. Oncotarget. 7:55343–55351.
2016.PubMed/NCBI
|
|
14
|
Reimand J, Tooming L, Peterson H, Adler P
and Vilo J: GraphWeb: Mining heterogeneous biological networks for
gene modules with functional significance. Nucleic Acids Res.
36(Web Server issue): W452–W459. 2008. View Article : Google Scholar : PubMed/NCBI
|
|
15
|
Joutsijoki H, Haponen M, Rasku J,
Aalto-Setälä K and Juhola M: Error-correcting output codes in
classification of human induced pluripotent stem cell colony
images. Biomed Res Int. 2016:30250572016. View Article : Google Scholar : PubMed/NCBI
|
|
16
|
Voigt AP, Eidenschink Brodersen L, Pardo
L, Meshinchi S and Loken MR: Consistent quantitative gene product
expression: #1. Automated identification of regenerating bone
marrow cell populations using support vector machines. Cytometry A.
89:978–986. 2016. View Article : Google Scholar : PubMed/NCBI
|
|
17
|
Yu G, Wang LG, Han Y and He QY:
clusterProfiler: An R package for comparing biological themes among
gene clusters. OMICS. 16:284–287. 2012. View Article : Google Scholar : PubMed/NCBI
|
|
18
|
Park P, Sanderson TM, Amici M, Choi SL,
Bortolotto ZA, Zhuo M, Kaang BK and Collingridge GL:
Calcium-permeable AMPA receptors mediate the induction of the
protein kinase a-dependent component of long-term potentiation in
the hippo-campus. J Neurosci. 36:622–631. 2016. View Article : Google Scholar : PubMed/NCBI
|
|
19
|
Schroeder JI and Hagiwara S: Cytosolic
calcium regulates ion channels in the plasma membrane of Vicia faba
guard cells. Nature. 338:427–430. 1989. View Article : Google Scholar
|
|
20
|
Leclerc C, Haeich J, Aulestia FJ,
Kilhoffer MC, Miller AL, Néant I, Webb SE, Schaeffer E, Junier MP,
Chneiweiss H and Moreau M: Calcium signaling orchestrates
glioblastoma development: Facts and conjunctures. Biochim Biophys
Acta. 1863:1447–1459. 2016. View Article : Google Scholar : PubMed/NCBI
|
|
21
|
Zohrabian VM, Forzani B, Chau Z, Murali R
and Jhanwar-Uniyal M: Rho/ROCK and MAPK signaling pathways are
involved in glioblastoma cell migration and proliferation.
Anticancer Res. 29:119–123. 2009.PubMed/NCBI
|
|
22
|
Sangpairoj K, Vivithanaporn P,
Apisawetakan S, Chongthammakun S, Sobhon P and Chaithirayanon K:
RUNX1 regulates migration, invasion, and angiogenesis via p38 MAPK
pathway in human glioblastoma. Cell Mol Neurobiol. 37:1243–1255.
2017. View Article : Google Scholar
|
|
23
|
Schlaepfer IR, Clegg HV, Corley RP,
Crowley TJ, Hewitt JK, Hopfer CJ, Krauter K, Lessem J, Rhee SH,
Stallings MC, et al: The human protein kinase C gamma gene (PRKCG)
as a susceptibility locus for behavioral disinhibition. Addict
Biol. 12:200–209. 2007. View Article : Google Scholar : PubMed/NCBI
|
|
24
|
Geiges D, Meyer T, Marte B, Vanek M,
Weissgerber G, Stabel S, Pfeilschifter J, Fabbro D and Huwiler A:
Activation of protein kinase C subtypes alpha, gamma, delta,
epsilon, zeta and eta by tumor-promoting and nontumor-promoting
agents. Biochem Pharmacol. 53:865–875. 1997. View Article : Google Scholar : PubMed/NCBI
|
|
25
|
Louhimo R, Aittomäki V, Faisal A, Laakso
M, Chen P, Ovaska K, Valo E, Lahti L, Rogojin V, Kaski S and
Hautaniemi S: Systematic use of computational methods allows
stratifying treatment responders in glioblastoma multiforme.
Proceedings of the CAMDA Conference. Critical Assessment of Massive
Data Analysis, 2011. Systems Biomedicine. 1:130–136. 2013.
View Article : Google Scholar
|
|
26
|
Verbeek DS, Goedhart J, Bruinsma L, Sinke
RJ and Reits EA: PKC gamma mutations in spinocerebellar ataxia type
14 affect C1 domain accessibility and kinase activity leading to
aberrant MAPK signaling. J Cell Sci. 121:2339–2349. 2008.
View Article : Google Scholar : PubMed/NCBI
|
|
27
|
Thomas SL, Alam R, Lemke N, Schultz LR,
Gutiérrez JA and Rempel SA: PTEN augments SPARC suppression of
proliferation and inhibits SPARC-induced migration by suppressing
SHC-RAF-ERK and AKT signaling. Neuro Oncol. 12:941–955. 2010.
View Article : Google Scholar : PubMed/NCBI
|
|
28
|
Dhillon AS, Hagan S, Rath O and Kolch W:
MAP kinase signalling pathways in cancer. Oncogene. 3279–3290.
2007. View Article : Google Scholar : PubMed/NCBI
|
|
29
|
Eleveld TF, Schild L, Ebus ME, van Sluis
PG, Westerhout EM, Caron HN, Koster JJB, Versteeg R and Molenaar
JJ: Abstract A31: Activation of the RAS-MAPK pathway in primary
neuroblastoma tumors is associated with poor prognosis. Cancer Res.
76(5 Suppl)2016. View Article : Google Scholar
|
|
30
|
Martiny-Baron G and Fabbro D: Classical
PKC isoforms in cancer. Pharmacol Res. 55:477–486. 2007. View Article : Google Scholar : PubMed/NCBI
|
|
31
|
Wang K and Klionsky DJ: Mitochondria
removal by autophagy. Autophagy. 7:297–300. 2011. View Article : Google Scholar : PubMed/NCBI
|
|
32
|
Bononi A, Agnoletto C, De Marchi E, Marchi
S, Patergnani S, Bonora M, Giorgi C, Missiroli S, Poletti F,
Rimessi A and Pinton P: Protein kinases and phosphatases in the
control of cell fate. Enzyme Res. 2011:3290982011. View Article : Google Scholar : PubMed/NCBI
|
|
33
|
Roessler J, Ammerpohl O, Gutwein J,
Steinemann D, Schlegelberger B, Weyer V, Sariyar M, Geffers R,
Arnold N, Schmutzler R, et al: The CpG island methylator phenotype
in breast cancer is associated with the lobular subtype.
Epigenomics. 7:187–199. 2015. View Article : Google Scholar
|
|
34
|
Hwang E, Yoo KC, Kang SG, Kim RK, Cui YH,
Lee HJ, Kim MJ, Lee JS, Kim IG, Suh Y and Lee SJ: PKCδ activated by
c-MET enhances infiltration of human glioblastoma cells through
NOTCH2 signaling. Oncotarget. 7:4890–4902. 2016. View Article : Google Scholar
|
|
35
|
Rodriguez-Mora O, LaHair MM, Howe CJ,
McCubrey JA and Franklin RA: Calcium/calmodulin-dependent protein
kinases as potential targets in cancer therapy. Expert Opin Ther
Targets. 9:791–808. 2005. View Article : Google Scholar : PubMed/NCBI
|