Introduction
Recurrent respiratory tract infections (RRTIs) are
not uncommon in children in the 1st year of life, mainly caused by
immaturity of the immune system and exposure to pathogens (1). It is said that a person diagnosed
with RRTIs should meet at least one of the following criteria: not
less than 6 respiratory infections per year; not less than 3
respiratory infections per year involving the lower airways or not
less than 1 respiratory infection per month involving the upper
airways from September to April (2). Up to 25% of children <1 year of
age and ~18% of children aged 1 to 4 years suffer from RRTIs in
developed countries (3). It
occurs both in children and adults (4,5).
Thus, early diagnosis of RRTIs and understanding of its
pathogenesis are urgently needed.
Some prevention strategies for RRTIs including the
use of immunostimulants and vaccines and the reduction of risk
factors have been developed (1).
One study indicated that treated with vitamin D3 may be
able to reduce disease burden of patients with frequent respiratory
tract infections (6). Pleuran
(β-glucan from Pleurotus ostreatus) has a potential
anti-allergic effect for children with RRTIs (7). Human milk probiotic Lactobacillus
fermentum CECT5716 may be useful for the prevention of upper
respiratory tract infections in infants (8). De Benedetto and Sevieri showed that
OM-85 could decrease exacerbation frequency of respiratory tract
infections in children and adults at risk (5). Though many prevention and treatment
measures have been found, the molecular mechanisms of RRTIs are not
clear. Understanding of the molecular mechanisms can help us find
more effective treatment for RRTIs.
In the process of infection and anti-infection,
innate immune system, which serves as the first line of defense,
plays the roles of limiting the spread of infection and reducing
the tissue damage caused by the inflammatory reaction (9). As a major member of the innate
immune system, neutrophil plays important parts in that process. In
this present study, peripheral blood neutrophil was used to study
the possible molecular mechanisms of RRTIs. We first used the
bioinformatics methods to find the key genes associated with RRTIs.
Then, the real-time PCR was used to verify the results of
bioinformatics. We aimed to find the key genes related with RRTIs,
and then elucidate the possible molecular mechanisms of RRTIs.
Materials and methods
Samples
Fresh peripheral blood was obtained from 9 patients
with recurrent lower respiratory tract infection and 9 healthy
controls with 5 ml for every case. The demographic and clinical
characteristics of subjects are shown in Table I. The mean age of patients was
51.5, and the mean age of healthy controls was 54. Heparin (10
U/ml) was used to exert anticoagulant effect for blood, and then
the blood was stored at 4°C. Informed consent was obtained from
subjects before blood sample collection. The present study was
approved by Ethics Committee of First Hospital, Jilin University
(no. 2014-078). Single RNA sample was not up to the requirements of
sequencing, thus 3 cases of blood samples were extracted and mixed
into 1 sample for sequencing. Therefore, the samples included 3
recurrent lower respiratory tract infection samples and 3 control
samples. Neutrophil was isolated from peripheral bloods of the
recurrent lower respiratory tract infection patients and healthy
control samples, respectively.
 | Table IThe demographic and clinical
characteristics of the subjects. |
Table I
The demographic and clinical
characteristics of the subjects.
| Paremeters | Patients | HC |
|---|
| Number | 9 | 9 |
| Age (years) mean
(range) | 51.5 (32–76) | 54 (15–76) |
| Sex, M/F | 5/4 | 5/4 |
| WBC
(×109/l) | 10.86
(4.43–25.9)a | 7.20
(3.35–12.13) |
| PLT
(×109/l) | 175.6
(103–479)a | 244.6
(187.3–295) |
| D-dimer
(μg/l) | 448.7
(155–742.9)a | 129.1
(74.9–238) |
| PCT
(μg/ml) | 1.07
(0.51–2.06)a | 0.06
(0.01–0.3) |
| CRP (mg/l) | 37.3
(20.0–87.7)a | 3.22
(0.71–10.02) |
Processing and quality assessment of raw
data
The next generation sequencing information was
obtained after RNA extraction, purification, library construction
and sequencing, and was stored in a FASTQ file. The quality of the
data was assessed using FastQC v0.11.4 (http://www.bioinformatics.babraham.ac.uk/projects/fastqc).
Base content distribution was used to detect whether there was AT,
GC separation in sequencing data, and AT, GC separation could
affect the results of subsequent bioinformatics analysis. GC
content distribution was mainly used for detecting whether the GC
distribution of the data was normal. Sequence base quality was used
to detect the average quality of the sequencing data.
The sequencing data included some adapters and low
quality reads, and these sequences could cause a great deal of
interference for subsequent analysis. Thus, the removal of adapter
sequences and quality filtering were performed. The adapter
sequences at least 10 bp overlap at the 3′ end were removed with
cutadapt (version 1.2.1) (10),
and the quality filtering was performed by 5 bp window method with
average quality score of window ≥Q20, the length at least 50 bp and
no uncertain bases ('N') in sequences.
Reference genome information and
comparative analysis
The sequencing data was compared to the genome. The
comparative analysis was performed with Bowtie2 2.1.0/TopHat2 2.1.0
(http://tophat.cbcb.umd.edu/). The
reference genome index was constructed by Bowtie2, and then reads
after filtering were compared to the reference genome by using
TopHat2 software.
Standardization of gene expression
The read count compared to every gene and obtained
by HTSeq 0.6.1p2 (http://www-huber.embl.de/users/anders/HTSeq) was
regarded as original expression of genes. The standardization of
gene expression was carried out with FPKM (fragment per kilo bases
per million fragments).
Analysis of differentially expressed
genes (DEGs)
edgeR (http://www.bioconductor.org/packages/release/bioc/html/edgeR.html)
is a Bioconductor software package used to analyze the differential
expression of repeated counting data. edgeR was used for the
detection of differential expression in this study. The read count
was preprocessed with TMM normalization provided by limma in R
package (11,12), and the preprocessed data was
transformed into gene expression matrix with voom (13). |log2FC| >1 and
P-value <0.05 were used as cut-off criterion. Then, the heat map
of DEGs was drawn using gplots in R package (14).
Gene Ontology (GO) and pathway enrichment
analyses
GO is a tool used for gene annotation by collecting
defined, structured, controlled vocabulary, mainly including 3
categories, molecular function (MF), biological process (BP) and
cellular component (CC) (15). GO
slim is a simplified version of GO, only including a part of GO. GO
is used for a general understanding of the content of Ontology.
Kyoto Encyclopedia of Genes and Genomes (KEGG) is a database used
to put associated gene sets into each of their pathway.
We made GO annotation (http://www.bioconductor.org/packages/release/bioc/html/RamiGO.html),
GO slim annotation [OWLTools (Map2Slim) (https://github.com/owlcollab/owltools/wiki/Map2Slim)]
and KEGG pathway enrichment analyses for DEGs. Fisher's exact test
was used to calculate the P-values. The P-value cut-off was 0.05
for GO analysis and P-value was 0.1 for KEGG analysis.
Protein-protein interaction (PPI) network
analysis
Search Tool for the Retrieval of Interacting Genes
(STRING) (16) database can
provide information on the predicted and experimental interactions
of proteins. The prediction method of this database came from
neighborhood, gene fusion, co-occurrence, co-expression
experiments, databases and textmining. The input gene sets were
DEGs, and the species was Homo. PPI score was set to 0.4,
and all the protein nodes interacted with each other were DEGs. PPI
networks were constructed with Cytoscape software (17).
Analysis of key nodes in network
Four methods including degree centrality (18), betweenness centrality (19), subgraph centrality (20) and closeness centrality (21) were used to study key genes. The
scores that network nodes obtained in the 4 methods were
observed.
Cytoscape plug-in CytoNCA (parameter setting,
network without weight) (22) was
used to calculate network centrality. The higher the degree value
and the subgraph value of the node are, the more important the
nodes are in the network. The higher the betweenness values are,
the greater the impact of the node in the network is. The higher
closeness value indicates that the node is more closely related to
the other nodes.
Nodes with the higher scores in 4 methods were
predicted as key genes, and clustering effect of these key genes
was observed by combining with gplots package.
Analysis of pathways enriched by key
genes
KEGG pathways significantly enriched by the key
genes were analyzed with R package clusterProfiler (23). The P-value was adjusted by
Benjamini-Hochberg (BH) (24),
and pathways with adjusted P-value <0.05 were selected.
Analysis of transcription factors of key
nodes
We used Cyto-scape plug-in iRegulon (25) to analyze transcription factors of
key genes. IRegulon integrated some transcription factor databases
(Transfac, Jaspar, Encode, Swissregulon and Homer) information, and
predicted transcription factors through calculating transcription
factor and gene binding motif enrichment analysis. Multiple
position weight matrix (PWM) was used in motif enrichment analysis,
then sort and score was carried out, and the preferred motif was
used to predict the final transcription factor. Parameter setting
was minimum identity between orthologous genes=0.05, and maximum
false discovery rate on motif similarity=0.001. The output result
was normalized enrichment score (NES). The higher the scores were,
the more reliable the results were. The transcription factor and
target gene pairs with NES >3.5 were selected.
Verification of gene expression
According to both the centrality score of 17 key
genes and transcription factor regulation network of key nodes, the
prostaglandin-endoperoxide synthase 2 (PTGS2), peroxisome
proliferator-activated receptor-γ (PPARG), transferrin (TF),
interleukin-10 (IL-10), TIMP metallopeptidase inhibitor 1 (TIMP1)
and matrix metallopeptidase 1 (MMP1) were chosen for
validation.
Neutrophil was isolated from peripheral blood of the
recurrent lower respiratory tract infection patients (6 cases) and
healthy volunteers (6 cases), respectively. RNA was isolated from
peripheral blood by using RNAiso plus (9109; Takara, Tokyo, Japan),
RNA was reversely transcribed into cDNA by using PrimeScript™ RT
Master Mix (RR036A; Takara), and the experiment was performed
according to the manufacturer's instructions. Real-time PCR was
carried out with the help of SYBR-Green kit. The real-time PCR
program started with 3 min of incubation at 50°C, 3 min at 95°C,
followed by 40 cycles of 10 sec at 95°C and 30 sec at 60°C. After
that, a melting curve was constructed for verification of
specificity of PCR products by increasing the temperature from 60
to 95°C for increment 0.5°C for 10 sec.
The forward and reverse primers for each gene were
designed as follows: 5′-TCGATGCTGCTCTTTCTGAG-3′ and
5′-GATAACCTGGATCCATAGATCGTT-3′ for MMP1; 5′-CTCGTCATCAGGGCCAAGTT-3′
and 5′-GTAGGTCTT GGTGAAGCCCC-3′ for TIMP1; 5′-GCCGTGGCCGCAGA TTT-3′
and 5′-TGGCATCTCTGTGTCAACCA-3′ for PPARG;
5′-ACACAGTCTTCTCATCACTTCGTTT-3′ and 5′-AATAG
CAGTCCTGAGCTGAGGTTTA-3′ for PTGS2; 5′-GTCTAC ATAGCGGGCAAGT-3′ and
5′-TTCCAGCCAGCGGTTCT-3′ for TF; 5′-TGGAGGACTTTAAGGGTTAC-3′ and
5′-TGATG TCTGGGTCTTGGTT-3′ for IL-10;
5′-TGACAACTTTGGTATCGTGGAAGG-3′ and 5′-AGGCAGGGATGATGTTCTG GAGAG-3′
for GAPDH.
All the data were expressed as mean ± SEM, and were
made into tables. Statistical analysis method was t-test and the
software used for data analysis was GraphPad Prism (GraphPad
Software, Inc., San Diego, CA, USA). P<0.05 was considered to be
statistically significant.
Results
Processing and quality assessment of raw
data
The results for single base quality distribution,
base content distribution, GC content distribution and sequence
base quality distribution are shown in Fig. 1.
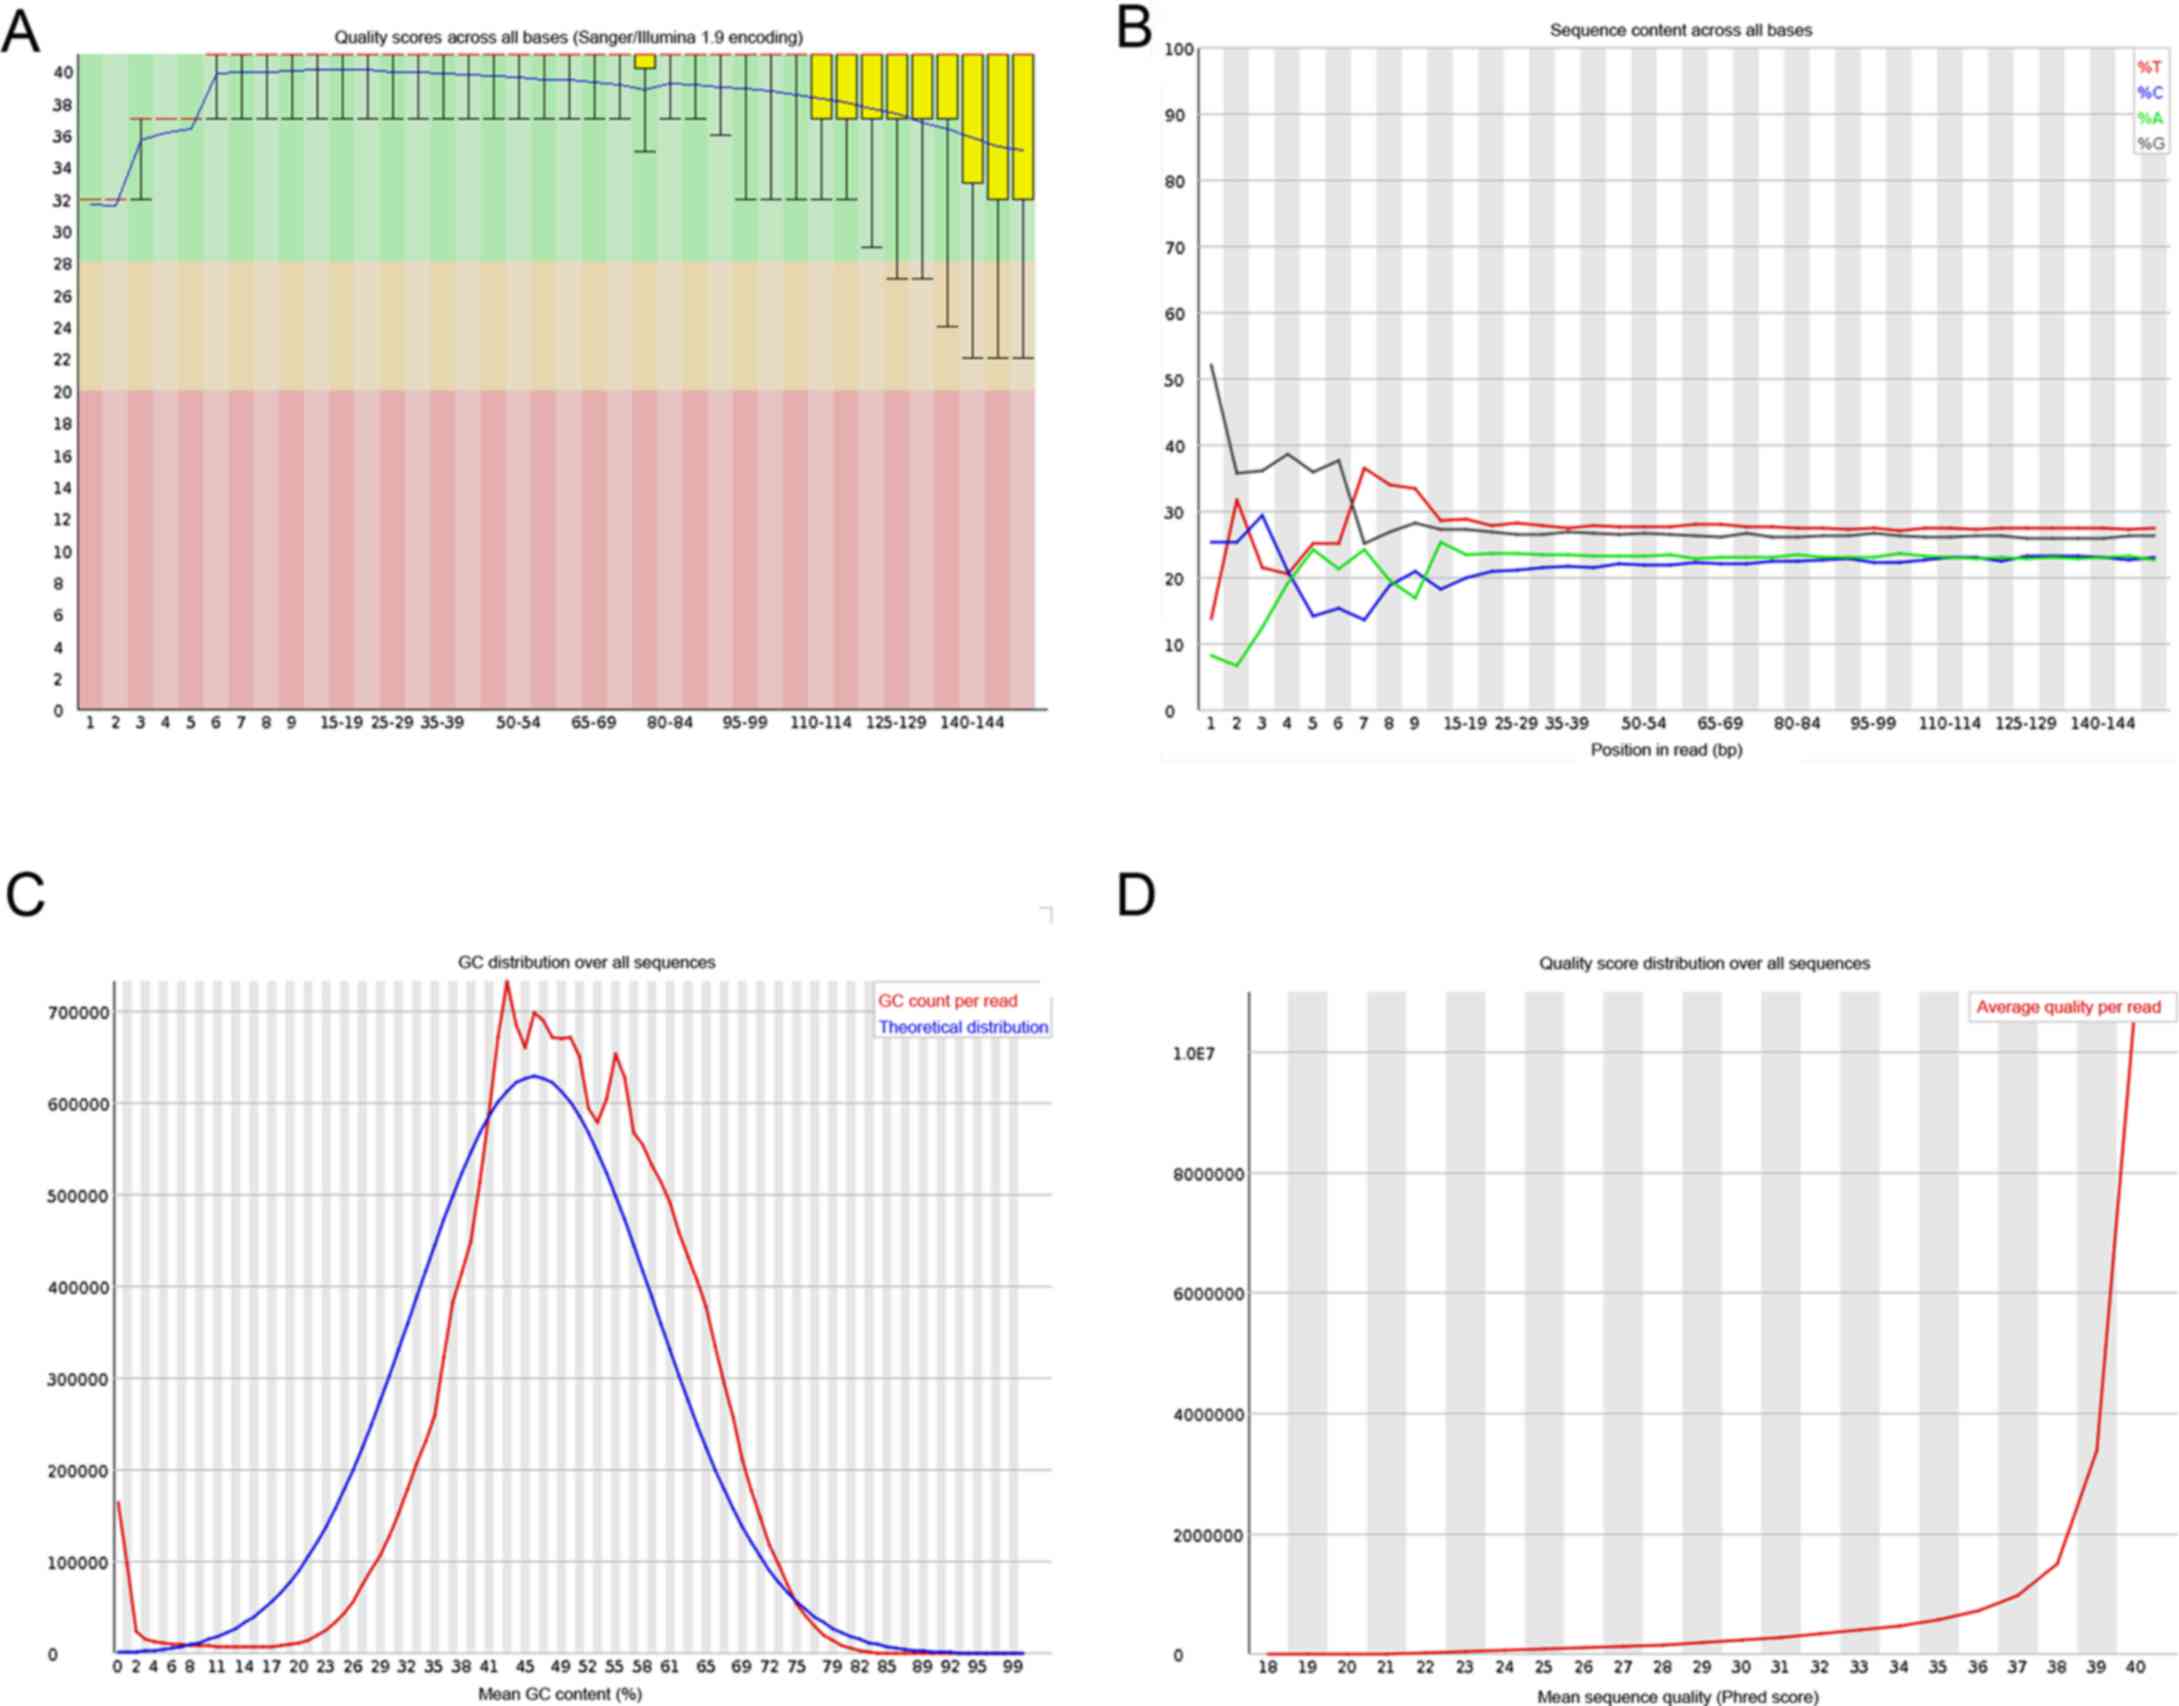 | Figure 1(A) The results for single base
quality distribution, (B) base content distribution, (C) GC content
distribution and (D) sequence base quality distribution. (A)
Horizontal ordinate, position in reads (5′->3′); longitudinal
coordinates, q-value statistics; red line represents, median; blue
line, average number; yellow lines, the range of 25-75%; tentacles,
the range of 10-90%. (B) Horizontal ordinate, position in reads
(5′->3′); longitudinal coordinates, the proportion of a base.
(C) Horizontal ordinate, mean GC content; longitudinal coordinates,
the number of reads; red, actual distribution curve; blue,
theoretical distribution curve. (D) Horizontal ordinate, quality
(phred score); longitudinal coordinates, the number of reads. |
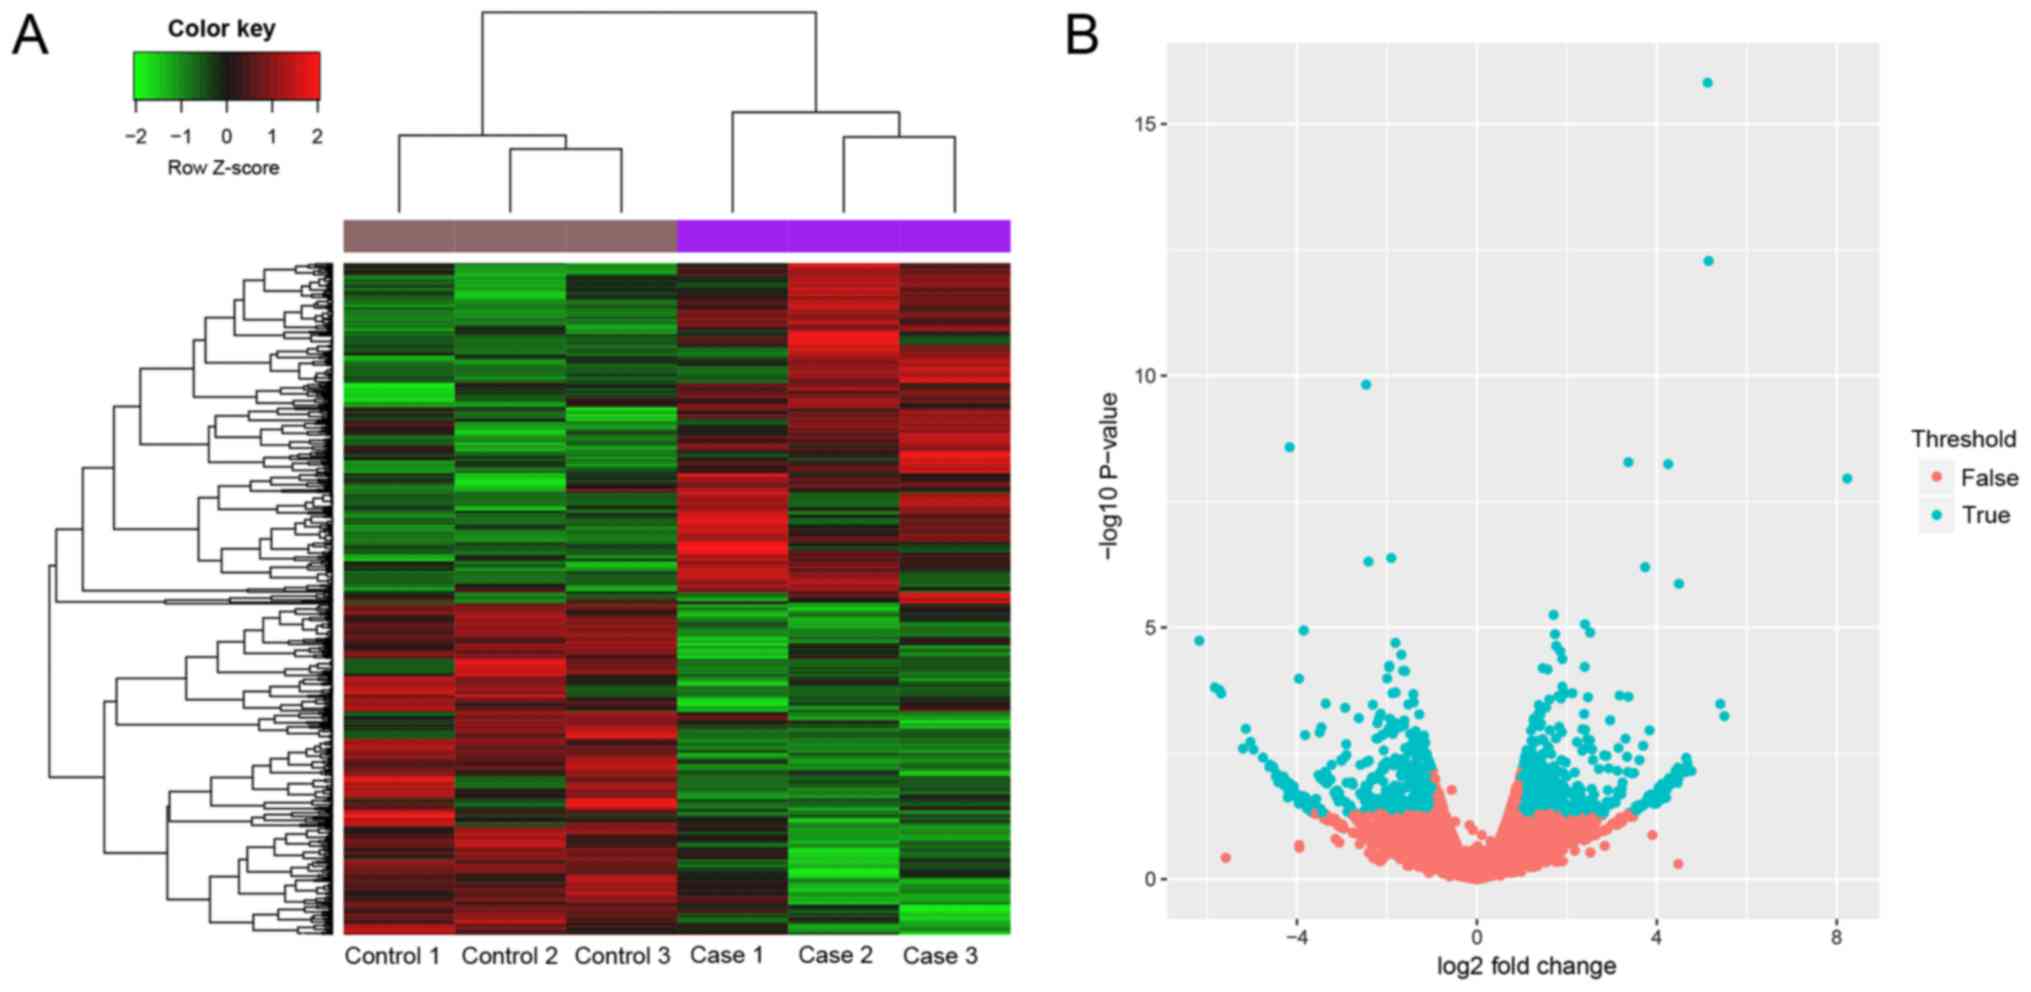
DEGs analysis
After processing of the raw data, 35,663 genes were
obtained to select DEGs. The gene was detected in at least one
sample. The heat map was standardized data, the difference of
expression was large for different genes in sequencing data, and
thus it was not appropriate to use raw score. Then, in total 866
DEGs including 438 upregulated and 428 downregulated genes were
obtained in case group compared with control group. The heat map
and volcano plot are shown in Fig.
2.
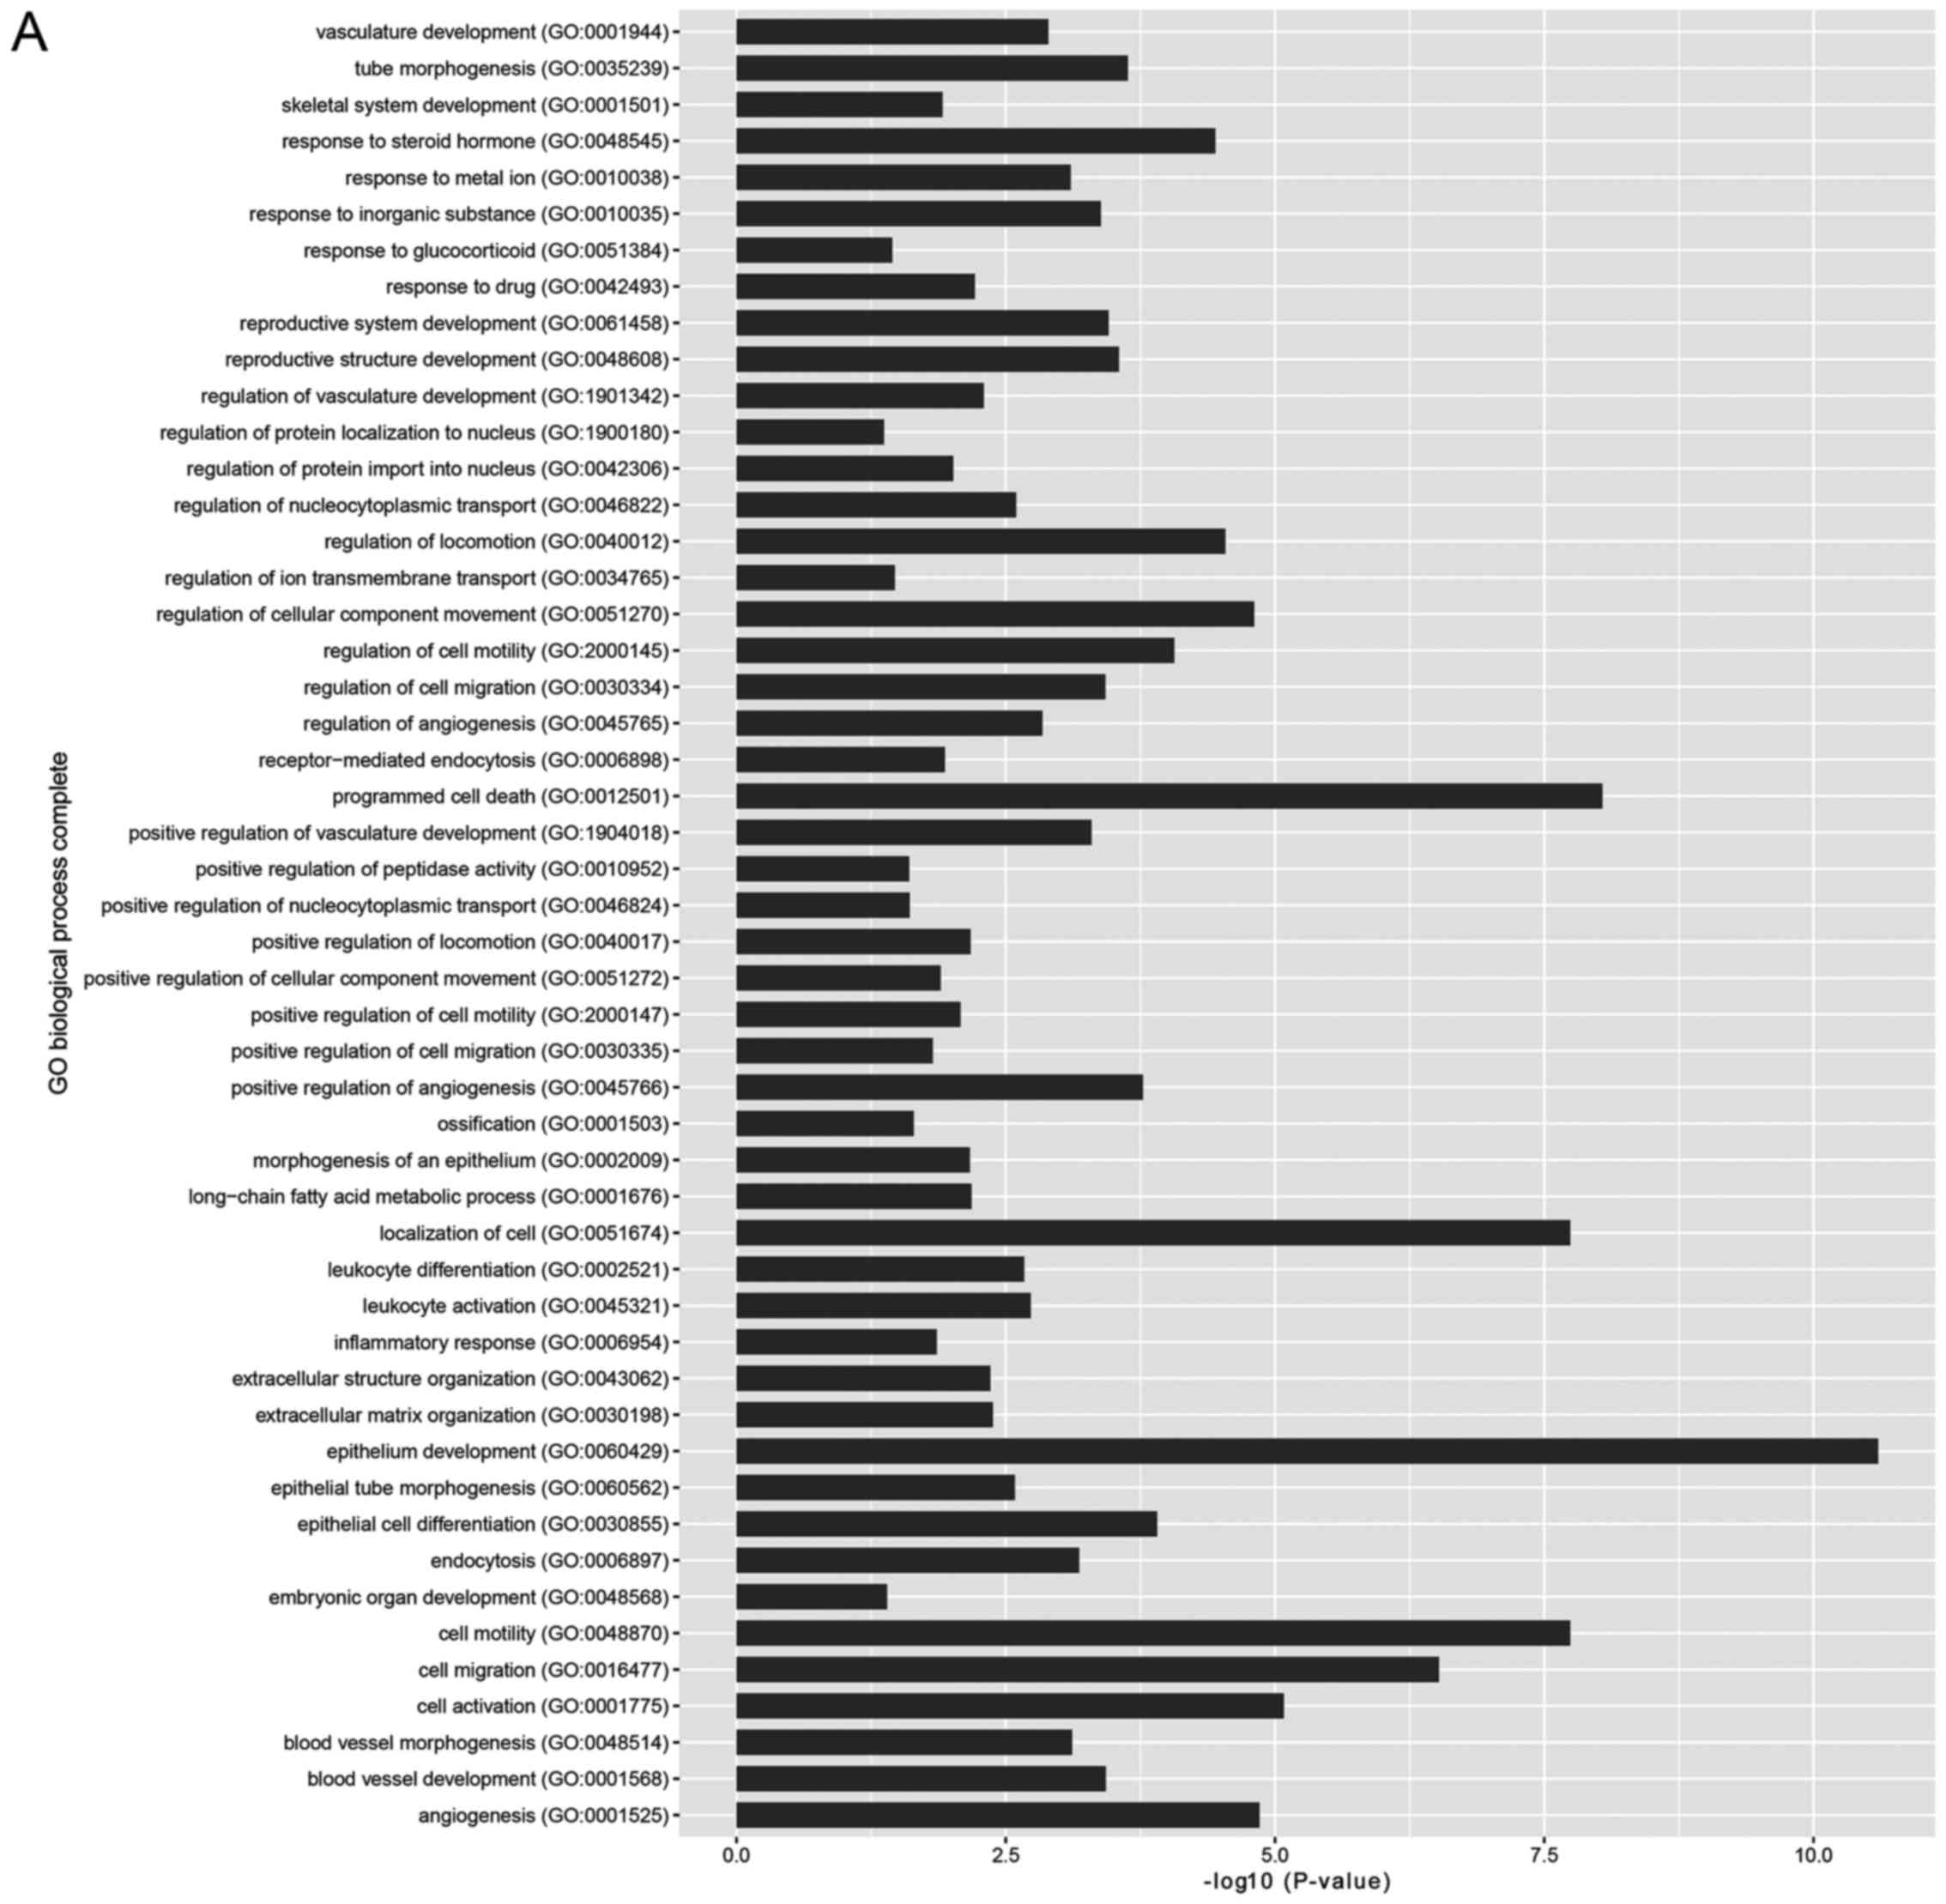
GO and pathway enrichment analyses
The results of GO slim and KEGG pathway enrichment
analyses are shown in Fig 3.
GO-BP (Fig. 3A) was mainly
enriched in epithelium development, cell motility, programmed cell
death and localization of the cell. GO-CC (Fig. 3B) was mainly enriched in intrinsic
component of the membrane, and the membrane parts. GO-MF (Fig. 3C) was mainly enriched in ion
binding, receptor activity, identical protein binding and anion
binding. The first 3 significantly enriched KEGG pathways (Fig. 3D) were cytokine-cytokine receptor
interaction, thyroid cancer and prostate cancer.
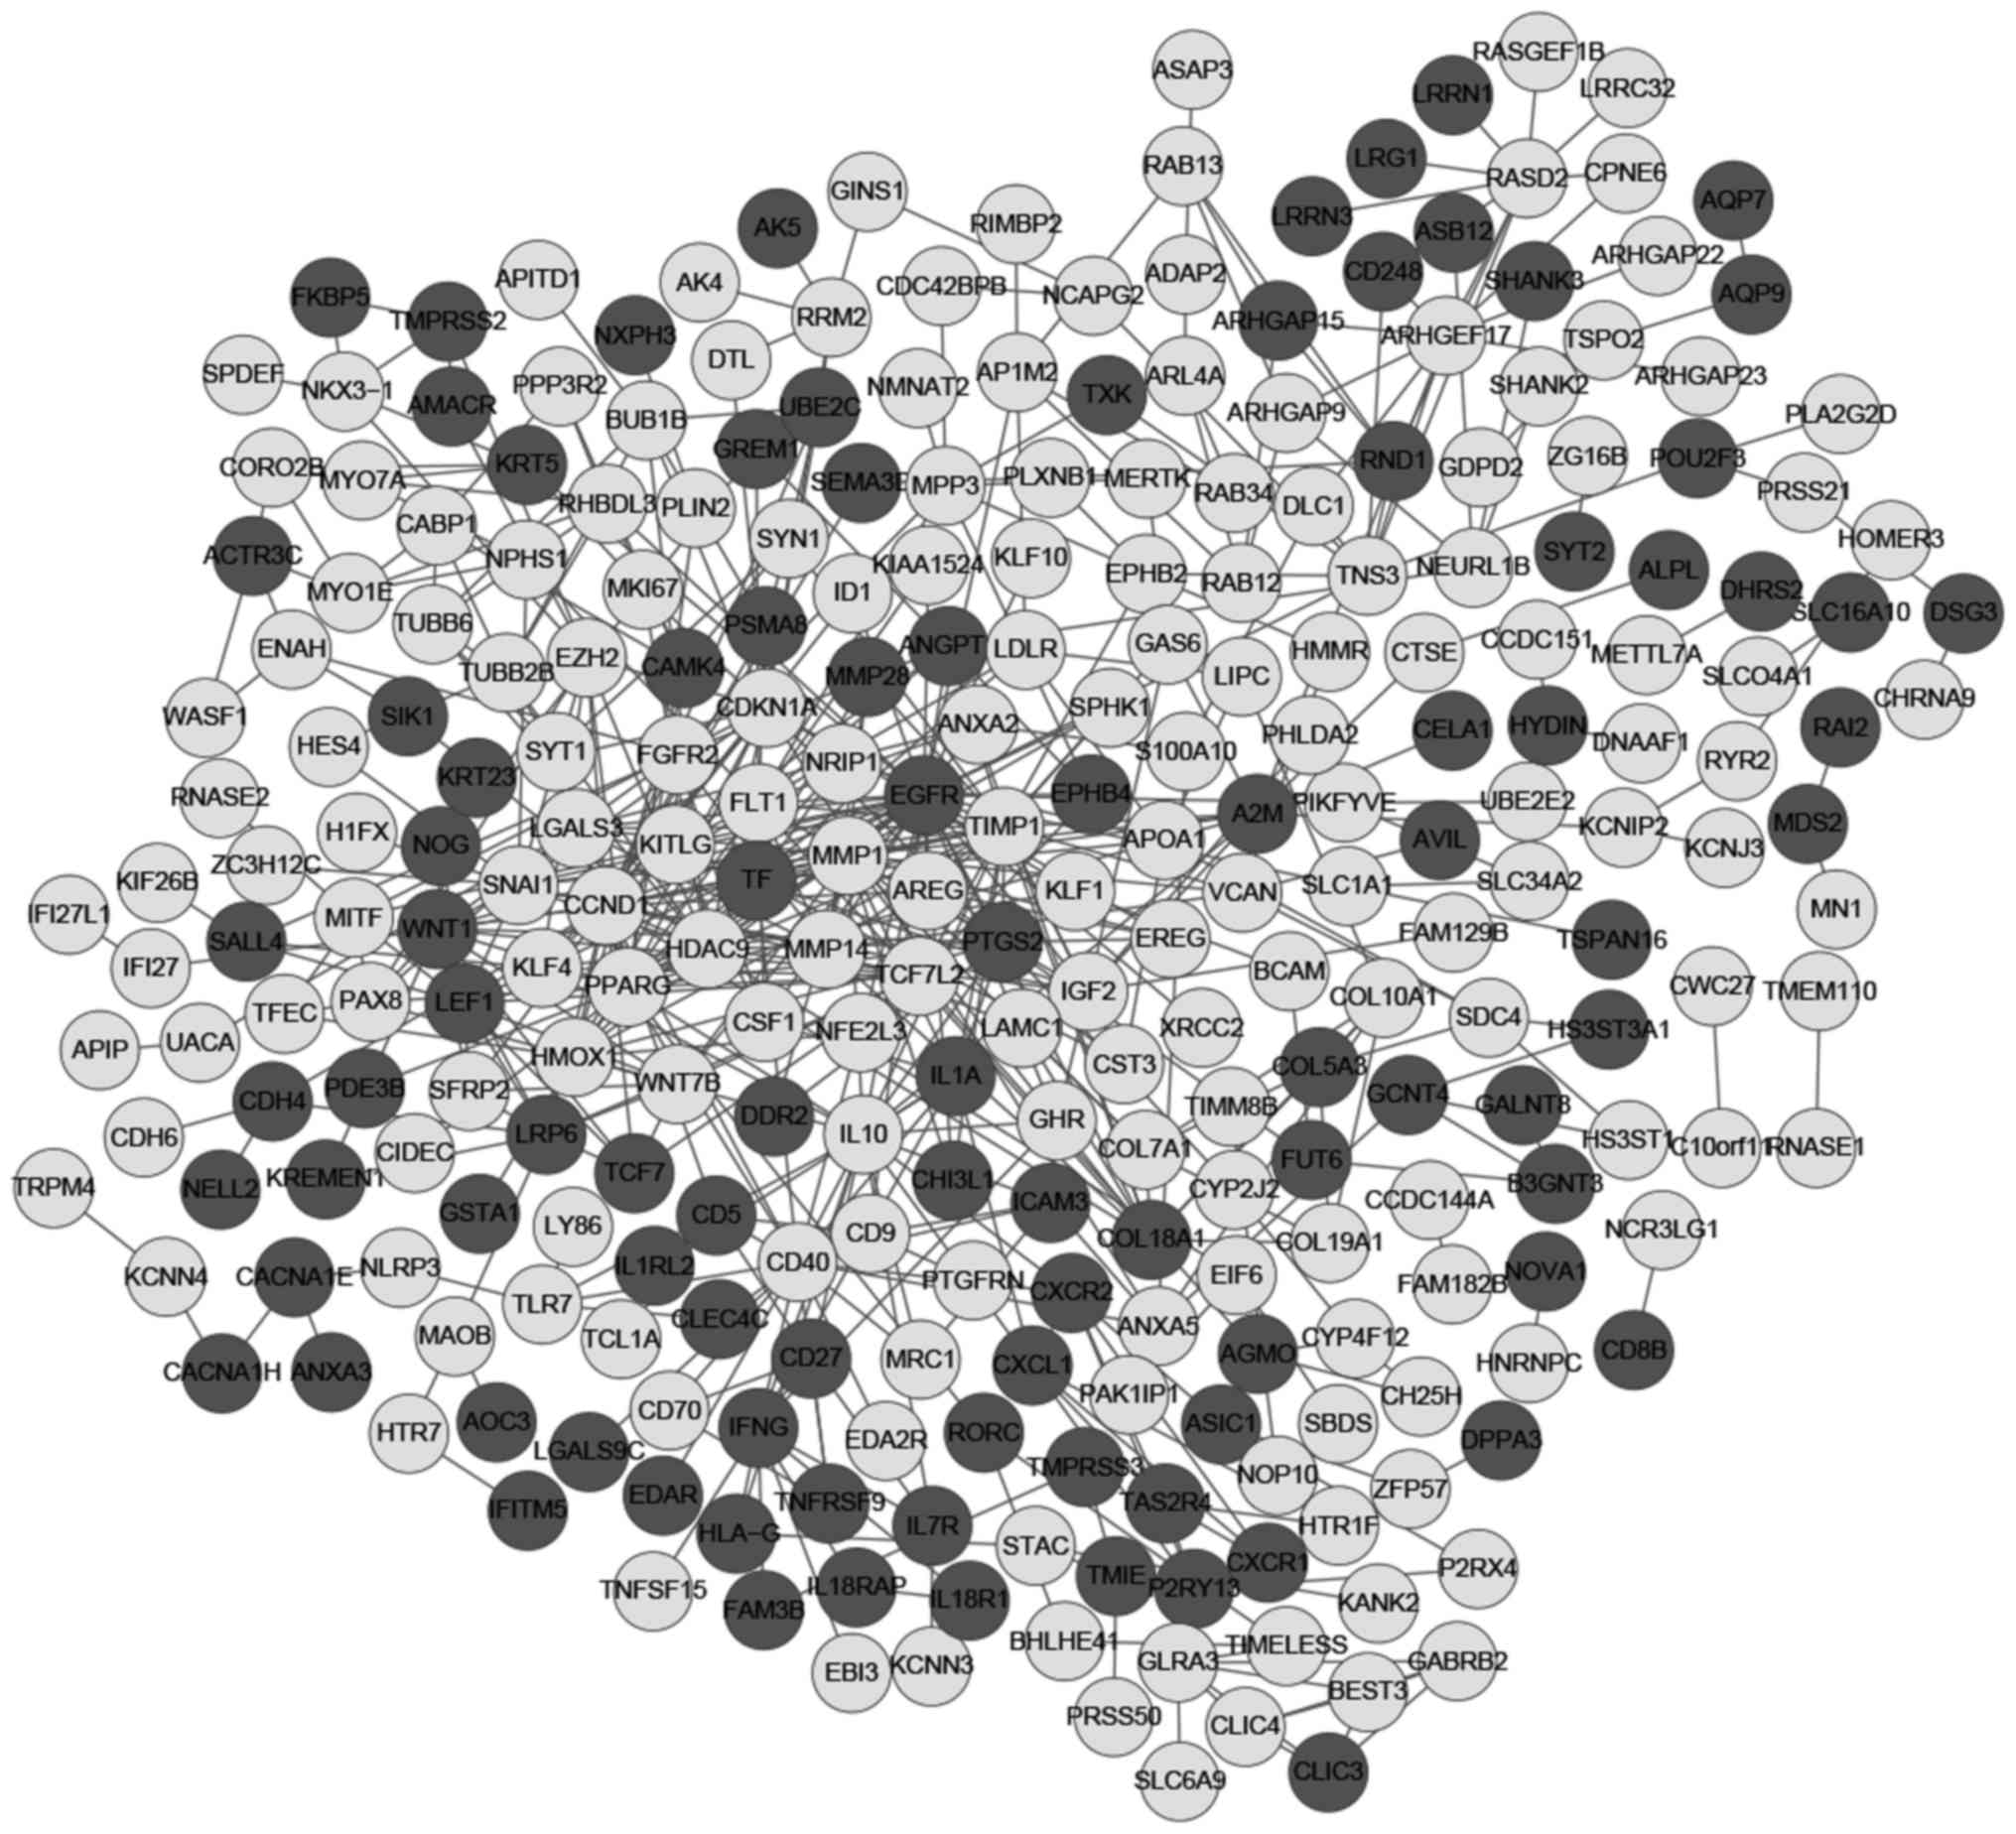
PPI network analysis, and key nodes and
pathway analyses in network
As shown in Fig.
4, there were 279 nodes and 575 protein pairs in the network.
The first 12 nodes with the highest scores were taken from each
centrality method, and 17 genes were obtained after merging and
removing duplicates. The 17 genes were epidermal growth factor
receptor (EGFR), cyclin D1 (CCND1), TIMP1, MMP1, PPARG, PTGS2,
histone deacetylase 9 (HDAC9), IL-10, fms-related tyrosine kinase 1
(FLT1), heme oxygenase 1 (HMOX1), cyclin-dependent kinase inhibitor
1A (CDKN1A), Wnt family member 1 (WNT1), CD40 molecule (CD40),
tensin 3 (TNS3), α2-macroglobulin (A2M), RAR-related orphan
receptor C (RORC) and TF. The case samples and control samples were
clustered by these 17 key genes. The centrality score of these 17
key genes is shown in Table II.
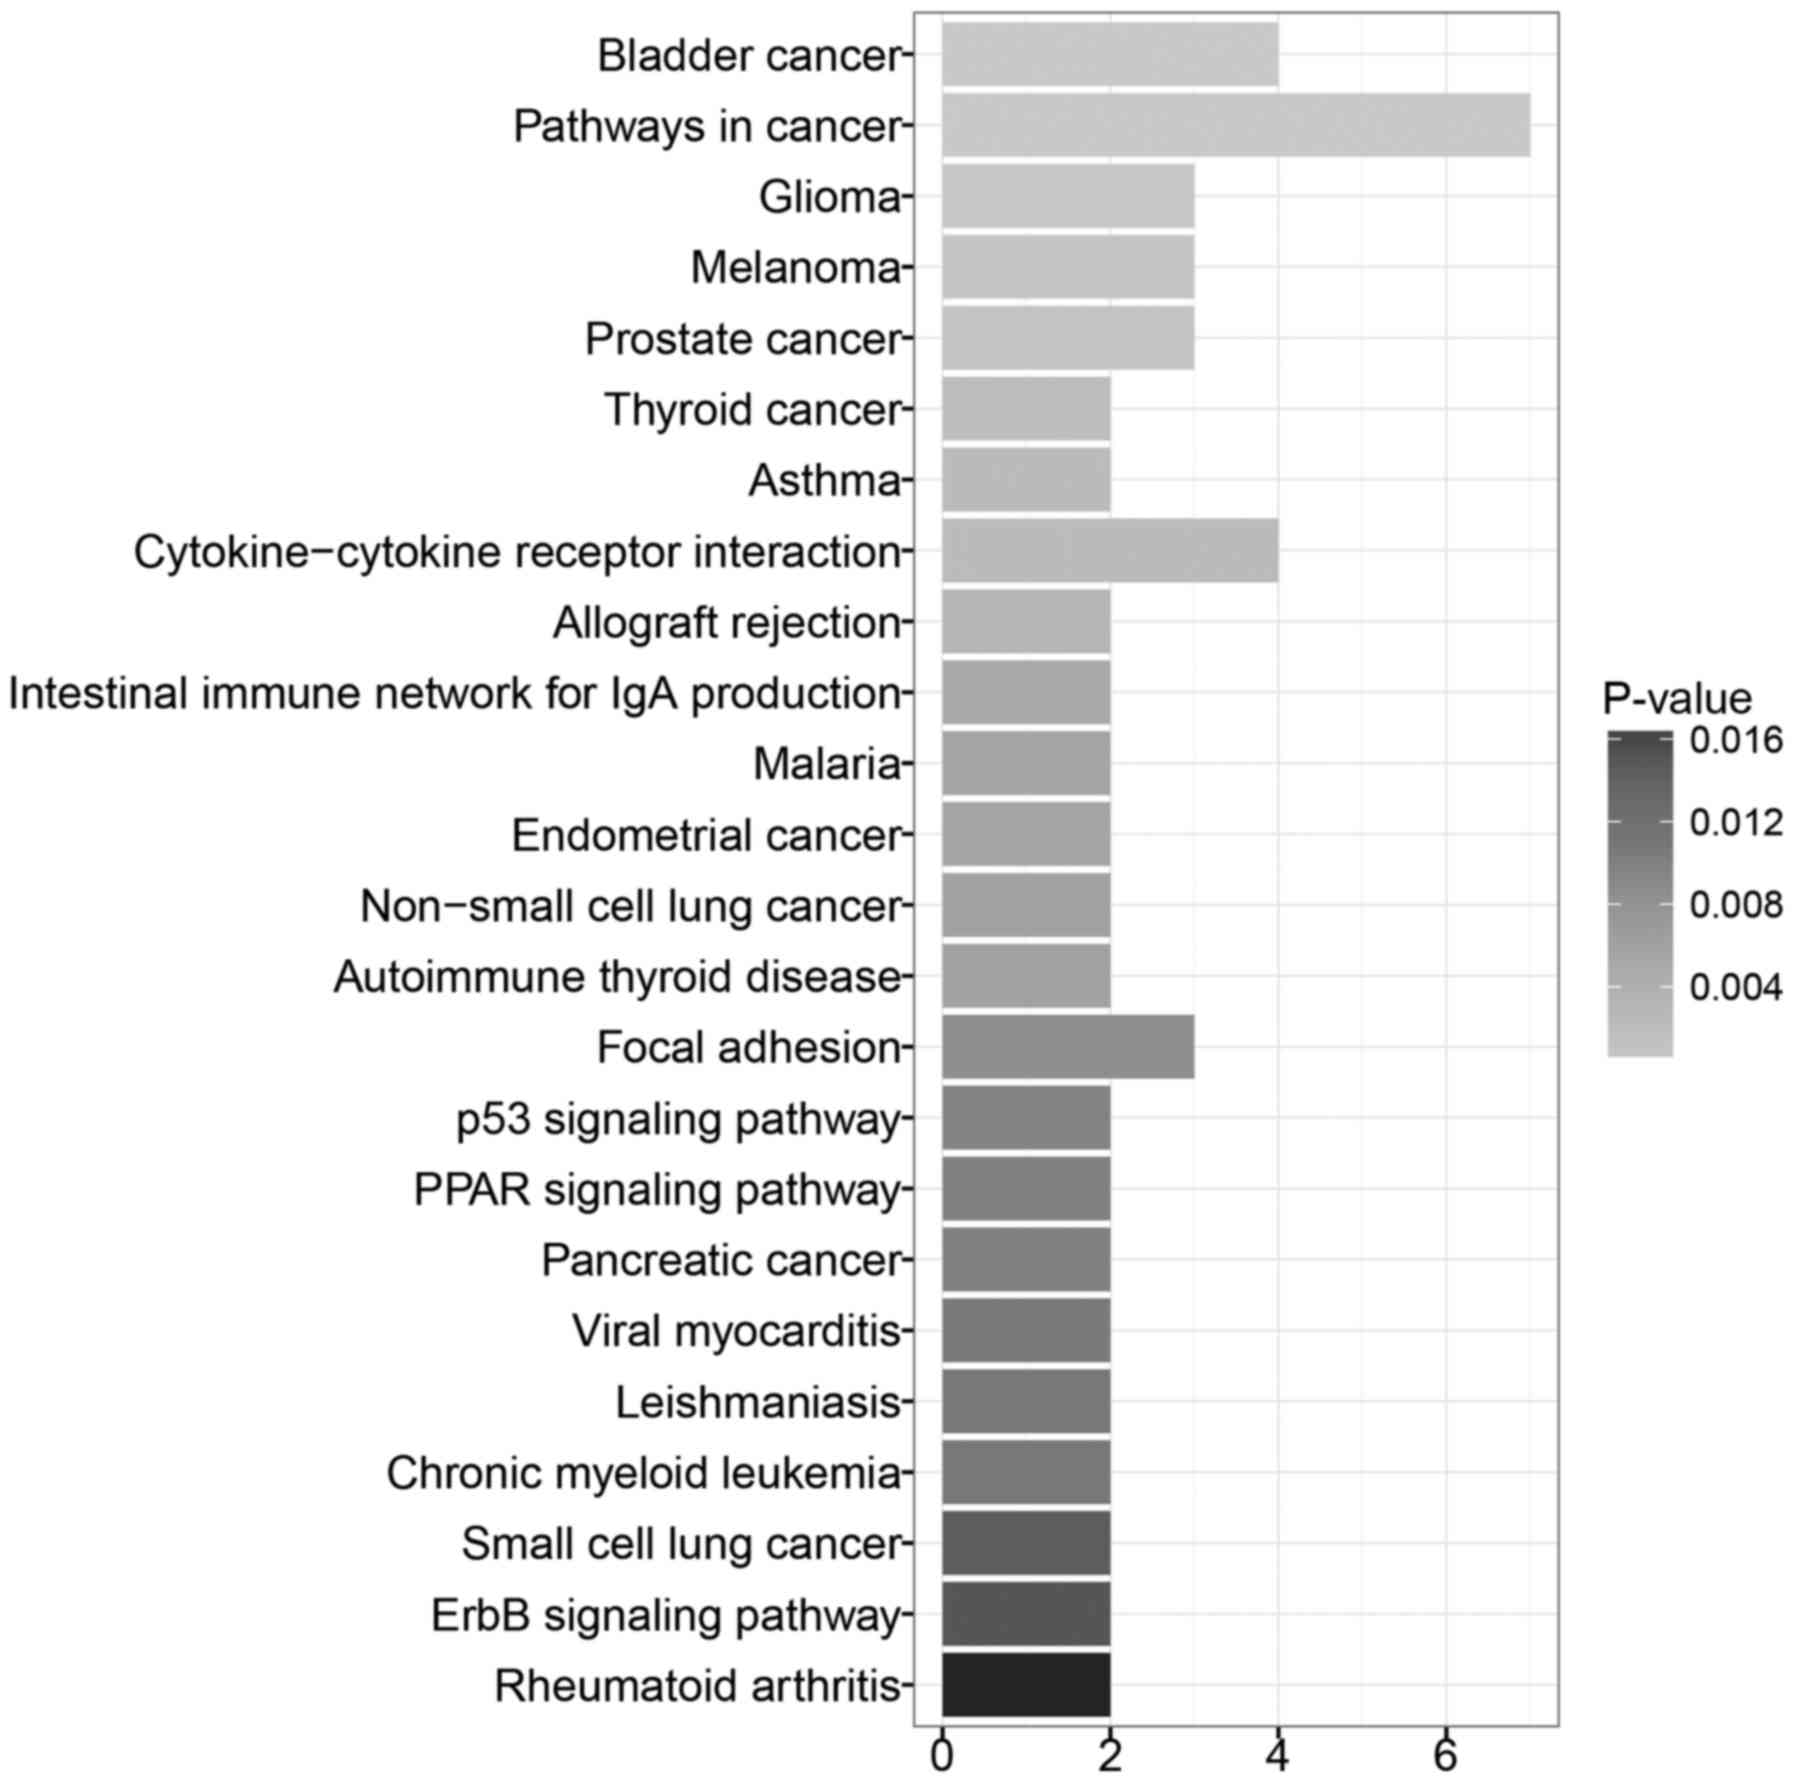
As shown in Fig. 5, the pathways
significantly enriched by these 17 genes were pathways in cancer,
bladder cancer, cytokine-cytokine receptor interaction, and focal
adhesion.
| Table IIThe centrality score of 17 key
genes. |
Table II
The centrality score of 17 key
genes.
| Genes | Subgragh | Degree | Betweenness | Closeness |
|---|
| EGFR | 41129.95 | 41 | 21125.9 | 0.035257 |
| CCND1 | 29876.16 | 31 | 8902.149 | 0.035039 |
| TIMP1 | 23954.49 | 25 | 3898.972 | 0.034938 |
| MMP1 | 22258.21 | 24 | 3890.898 | 0.034955 |
| PPARG | 19492.27 | 25 | 10108.1 | 0.035021 |
| PTGS2 | 10549.89 | 15 | 3224.803 | 0.034815 |
| HDAC9 | 10406.45 | 20 | 5808.442 | 0.034767 |
| IL-10 | 9644.303 | 20 | 10592.6 | 0.034881 |
| FLT1 | 8960.905 | 17 | 2048.353 | 0.034612 |
| HMOX1 | 8760.095 | 13 | 1930.259 | 0.034802 |
| CDKN1A | 8346.486 | 18 | 4548.326 | 0.034711 |
| WNT1 | 7728.413 | 15 | 1505.885 | 0.034599 |
| CD40 | 5181.088 | 19 | 7817.111 | 0.034828 |
| TNS3 | 358.5152 | 10 | 7723.212 | 0.034466 |
| A2M | 2485.854 | 11 | 5437.33 | 0.034478 |
| RORC | 129.5831 | 3 | 3904 | 0.034014 |
| TF | 6344.649 | 11 | 841.7473 | 0.034707 |
Transcription factors of key node
analysis
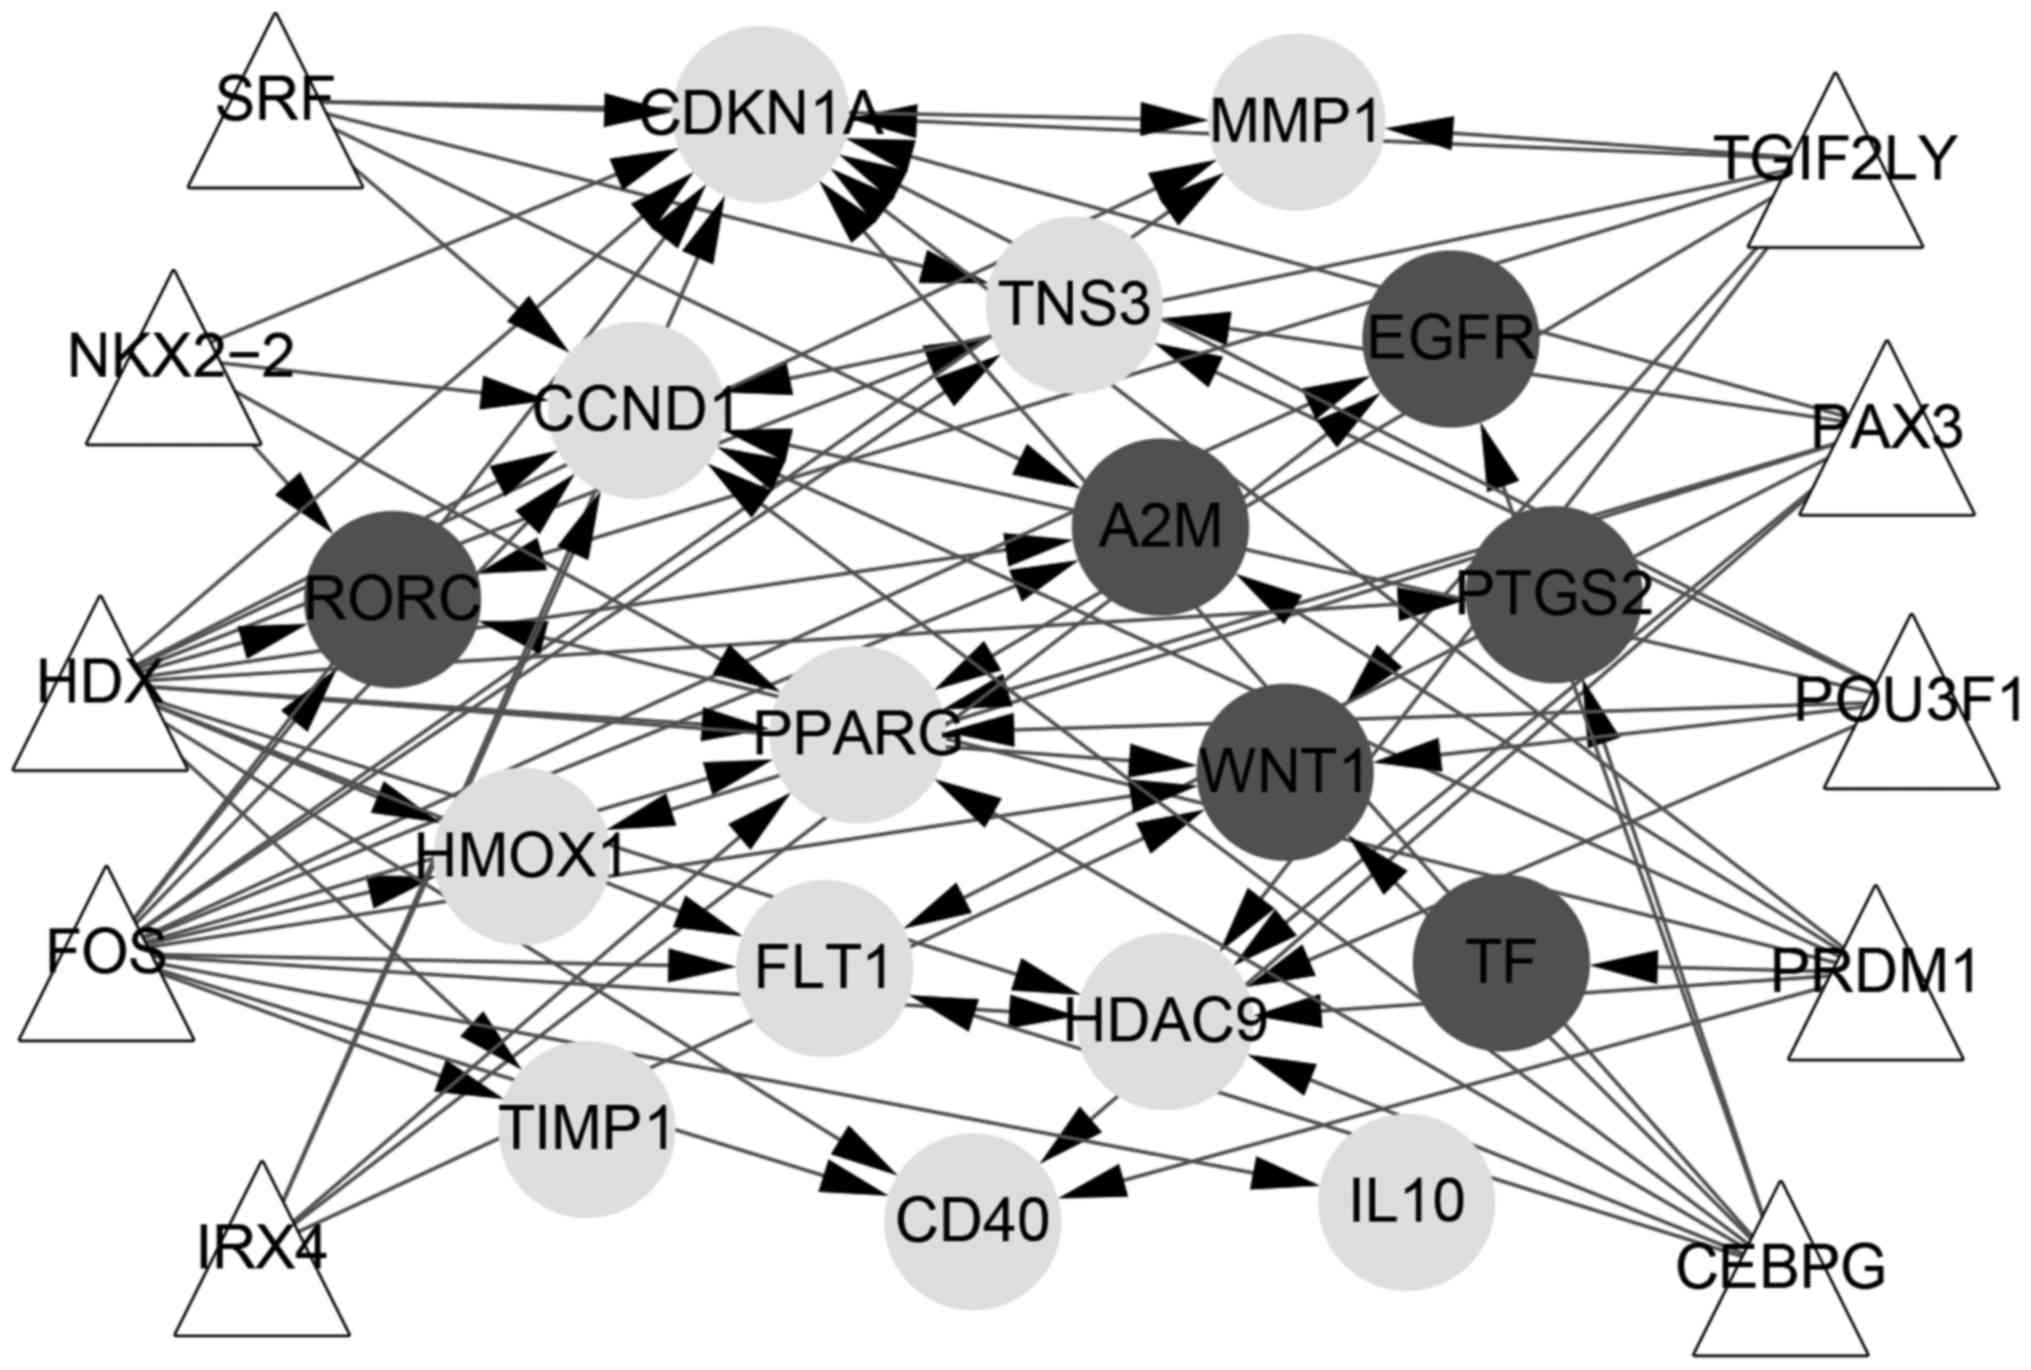
As shown in Fig.
6, transcriptional regulation network included 27 nodes and 78
interaction pairs. In total, 10 transcription factors were obtained
with NES >3.5. TGIF2LY regulated MMP1, RORC, HDAC9, PPARG, WNT1,
CCND1 and CDKN1A. SRF regulated MMP1, TNS3, A2M, CCND1 and CDKN1A.
POU3F1 regulated CDKN1A, TNS3, WNT1, CCND1, HDAC9 and PPARG. NKX2-2
regulated PPARG, CDKN1A, CCND1 and RORC. IRX4 regulated EGFR,
PPARG, CCND1, WNT1 and CDKN1A. PRDM1 regulated RORC, TF, CDKN1A,
A2M, HDAC9, CCND1 and CD40. HDX regulated 14 genes (all 17 genes
except IL-10, PTGS2 and TF). PAX3 regulated FLT1, CD40, TNS3,
PPARG, CDKN1A, HDAC9 and HMOX1. FOS regulated 15 genes (all 17
genes except TF and PTGS2). CEBPG regulated CCND1, FLT1, EGFR,
HDAC9, WNT1, PTGS2, PPARG and CDKN1A.
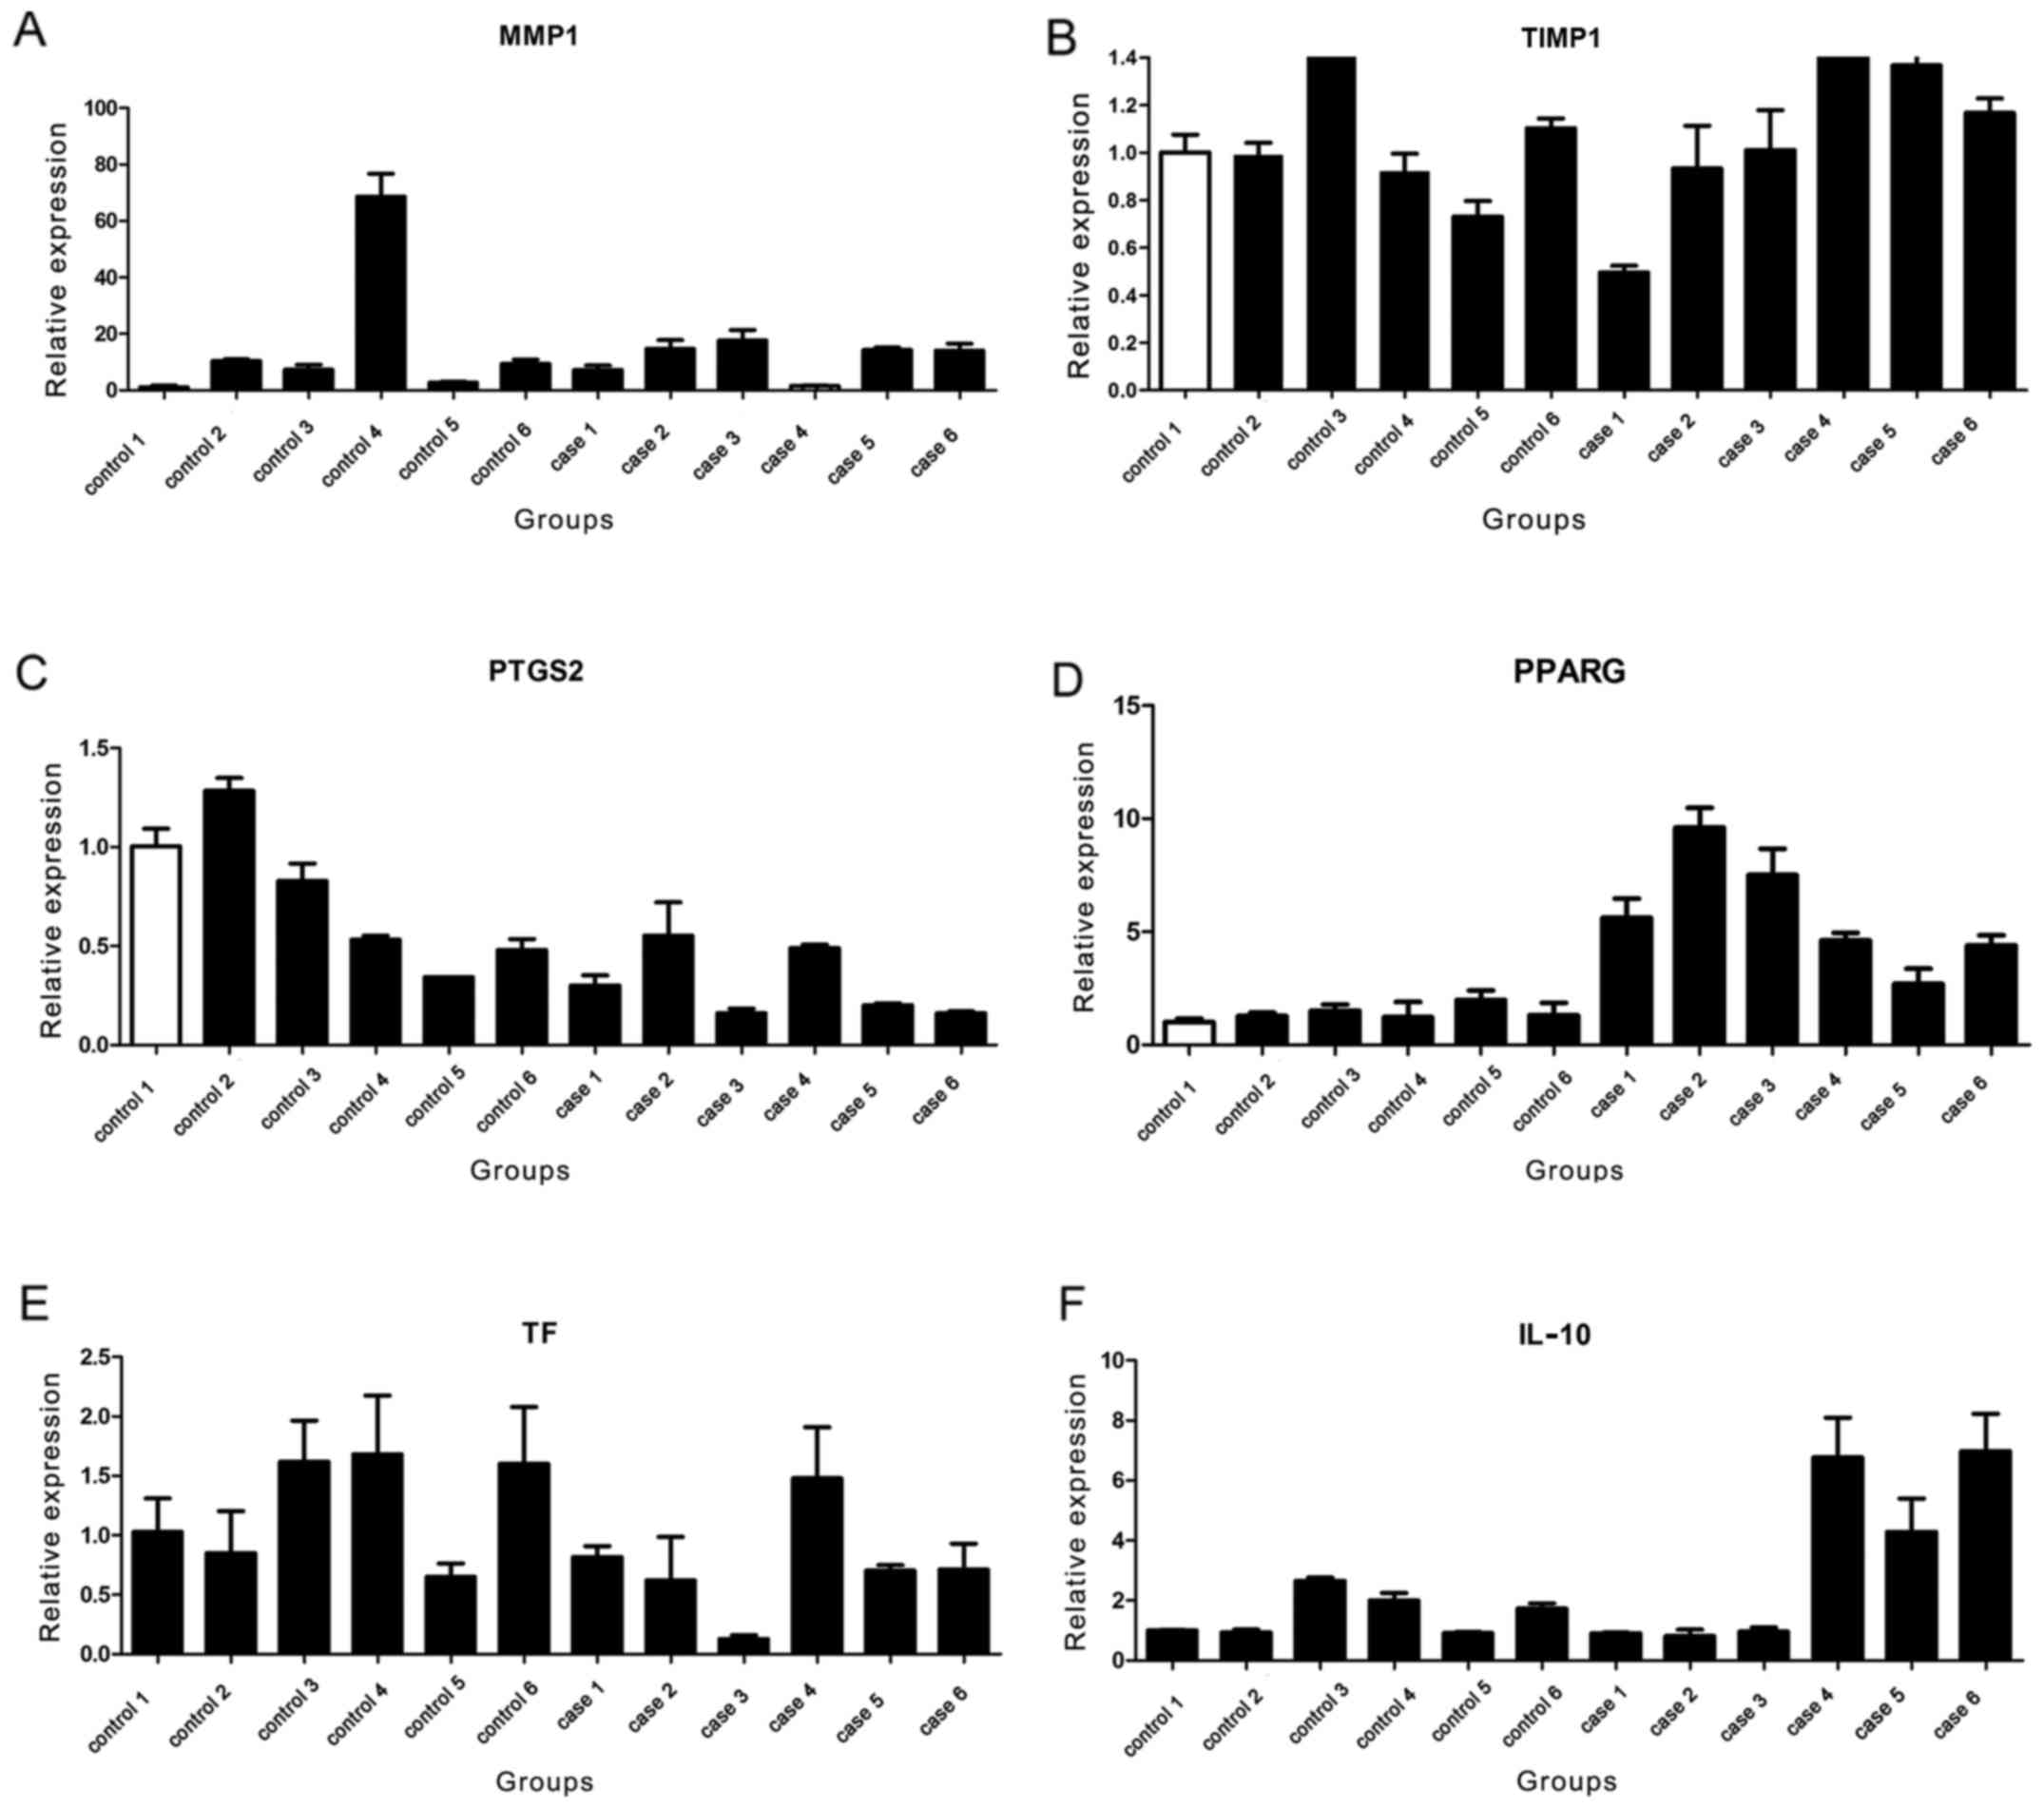
Verification of gene expression
The results of real-time PCR are shown in Fig. 7. In total 6 of 17 genes were
detected. However, there was statistical significance between case
and control groups for PTGS2, PPARG, TF and IL-10 (P<0.05), and
there was no statistical significance between case and control
groups for TIMP1 and MMP1 (Table
III). All samples came from the same type of infections. It may
be because the interference of external conditions leads to the
unstable results. Thus, in our study, 6 samples were used as case
and 6 samples for control.
| Table IIIThe result of statistical analysis
for verification of gene expression. |
Table III
The result of statistical analysis
for verification of gene expression.
| Item | Case group
| Control group
| t-test | P-value |
|---|
| N | mean ± SEM | N | mean ± SEM |
|---|
| TIMP1 | 18 | 1.068±0.305 | 18 | 1.068±0.337 | 0.001 | 0.999 |
| MMP1 | 18 | 16.581±24.360 | 18 | 11.560±5.973 | 0.849 | 0.406 |
| PPARG | 17 | 1.347±0.452 | 18 | 5.738±2.405 | 7.605 | <0.001 |
| PTGS2 | 18 | 0.745±0.341 | 18 | 0.311±0.173 | 4.820 | <0.001 |
| TF | 18 | 1.239±0.524 | 18 | 0.744±0.459 | 3.020 | 0.005 |
| IL-10 | 18 | 1.539±0.682 | 18 | 3.452±2.877 | 2.744 | 0.013 |
Discussion
In the present study, in total 17 key genes in case
group compared with the control group were identified by
bioinfor-matics analysis. Then, 6 of 17 genes were detected by
real-time PCR. However, there was statistical significance between
case and control groups for PPARG, PTGS2, TF and IL-10 (P<0.05),
and there was no statistical significance between case and control
groups for TIMP1 and MMP1.
Our study showed that PTGS2 and PPARG were key genes
associated with RRTIs. Nuclear factor-κB (NF-κB) is necessary for
the roles of proinflammatory factors such as Cox-2 and IL-6
expression, and OM85-BV cause the translocation and activation of
NF-κB (26). As previously
mentioned, OM-85 can decrease exacerbation frequency of respiratory
tract infections in children and adults at risk (5). Furthermore, PTGS2 (Cox-2) mediates
the anti-inflammatory response during Leishmania donovani
infection (27). Cox-2, as a
significant mediator, involves in respiratory syncytial
virus-induced inflammation (28).
In colorectal cancer, non-steroidal anti-inflammatory drugs can
inhibit cancer stem cells through activating PPARG and suppressing
PTGS2 and NOTCH/HES1 (29). Thus,
PTGS2 may play important roles in the development of RRTIs.
Besides, Bank et al indicated that PPARG involved in the
regulation of inflammation (30).
Malur et al suggested that PPARG played negative regulation
roles for chronic granulomatous inflammation (31). Therefore, our results are in line
with former research and show that PTGS2 and PPARG play significant
parts in the progression of RRTIs.
Furthermore, bioinformatics analysis showed that TF
was a key gene related with RRTIs, and it also was verified by
real-time PCR in our present study. TF controls the free iron
levels in biological fluids (32). TF is related with innate immune
system. It can create low free iron environment and impede the
survival of bacteria. The level of TF decrease in inflammation
(33). Besides, a study showed
that the injection of coenzyme A had important effect on the TF in
elderly acute upper RTI patients (34). Thus, TF also play important roles
in patients with RRTIs.
In addition, in the present study, IL-10 was also a
key gene associated with RRTIs. Sun et al indicated that
IL-10 played dual roles in immune response to respiratory syncytial
virus (28). On the one hand,
IL-10 inhibits respiratory syncytial virus induced inflammation; on
the other hand, it induces the Th2-dominant immune responses.
Furthermore, in physically active individuals, high IL-10 is a risk
factor for the progression of upper RTIs (35). Besides, Bont et al
indicated that increased production of IL-10 was related with the
development of recurrent wheezing after respiratory syncytial virus
bronchiolitis (36). Thus, our
results are in accord with the former studies and suggest that
IL-10 is associated with the development of RRTIs.
In this study, the bioinformatics analysis
identified 17 genes, and 6 of these genes including PPARG, PTGS2,
TF, IL-10, TIMP1 and MMP1 were detected by real-time PCR. But there
was no statistical significance between case and control groups for
TIMP1 and MMP1. Besides, previous studies showed that MMPs and
their tissue inhibitors of TIMP1 and TIMP2 were involved in tissue
remodeling during inflammation (37–39). We speculate that TIMP1 and MMP1
also may be involved in the progression of RRTIs. But, further
studies with large number of samples are needed for
verification.
The obvious advantage of this study is that the
results of bioinformatics analysis are verified by real-time PCR.
However, the disadvantage is that several genes identified by
bioinformatics are not verified by real-time PCR possibly because
of the small sample size.
In conclusion, PPARG, PTGS2, TF and IL-10 are key
genes associated with the progression of RRTIs. PPARG, PTGS2, TF
and IL-10 may be regarded as a therapeutic target of RRTIs. We
speculate that TIMP1 and MMP1 may also be involved in the
progression of RRTIs, but further studies with large number of
samples are needed for verification.
Acknowledgments
Not applicable.
References
|
1
|
Principi N, Esposito S, Cavagna R, Bosis
S, Droghetti R, Faelli N, Tosi S and Begliatti E; Snoopy Study
Group: Recurrent respiratory tract infections in pediatric age: a
population-based survey of the therapeutic role of macrolides. J
Chemother. 15:53–59. 2003. View Article : Google Scholar : PubMed/NCBI
|
|
2
|
de Martino M and Ballotti S: The child
with recurrent respiratory infections: normal or not? Pediatr
Allergy Immunol. 18(Suppl 18): 13–18. 2007. View Article : Google Scholar
|
|
3
|
Bellanti JA: Recurrent respiratory tract
infections in paediatric patients. Drugs. 54(Suppl 1): 1–4. 1997.
View Article : Google Scholar : PubMed/NCBI
|
|
4
|
Khasawneh FA and Jou-Tindo AJ: A
30-year-old woman with recurrent lower respiratory tract
infections. Chest. 143:1500–1503. 2013. View Article : Google Scholar : PubMed/NCBI
|
|
5
|
De Benedetto F and Sevieri G: Prevention
of respiratory tract infections with bacterial lysate OM-85
bronchomunal in children and adults: a state of the art.
Multidiscip Respir Med. 8:332013. View Article : Google Scholar : PubMed/NCBI
|
|
6
|
Bergman P, Norlin A-C, Hansen S, Rekha RS,
Agerberth B, Björkhem-Bergman L, Ekström L, Lindh JD and Andersson
J: Vitamin D3 supplementation in patients with frequent
respiratory tract infections: a randomised and double-blind
intervention study. BMJ Open. 2:e0016632012. View Article : Google Scholar
|
|
7
|
Jesenak M, Hrubisko M, Majtan J, Rennerova
Z and Banovcin P: Anti-allergic effect of Pleuran (β-glucan from
Pleurotus ostreatus) in children with recurrent respiratory tract
infections. Phytother Res. 28:471–474. 2014. View Article : Google Scholar
|
|
8
|
Maldonado J, Cañabate F, Sempere L, Vela
F, Sánchez AR, Narbona E, López-Huertas E, Geerlings A, Valero AD,
Olivares M, et al: Human milk probiotic Lactobacillus fermentum
CECT5716 reduces the incidence of gastrointestinal and upper
respiratory tract infections in infants. J Pediatr Gastroenterol
Nutr. 54:55–61. 2012. View Article : Google Scholar
|
|
9
|
Orlowsky EW and Kraus VB: The role of
innate immunity in osteoarthritis: when our first line of defense
goes on the offensive. J Rheumatol. 42:363–371. 2015. View Article : Google Scholar : PubMed/NCBI
|
|
10
|
Martin M: Cutadapt removes adapter
sequences from high-throughput sequencing reads. EMBnet. 17:10–12.
2011. View Article : Google Scholar
|
|
11
|
Ritchie ME, Phipson B, Wu D, Hu Y, Law CW,
Shi W and Smyth GK: Limma powers differential expression analyses
for RNA-sequencing and microarray studies. Nucleic Acids Res.
43:e472015. View Article : Google Scholar : PubMed/NCBI
|
|
12
|
Smyth GK: LIMMA: linear models for
microarray data. Statistics for Biology and Health: Bioinformatics
and Computational Biology Solutions Using R and Bioconductor.
Springer; New York: pp. 397–420. 2005, View Article : Google Scholar
|
|
13
|
Law CW, Chen Y, Shi W and Smyth GK: voom:
Precision weights unlock linear model analysis tools for RNA-seq
read counts. Genome Biol. 15:R292014. View Article : Google Scholar : PubMed/NCBI
|
|
14
|
Warnes GR, Bolker B, Bonebakker L,
Gentleman R, Liaw A, Lumley T, Maechler M, Magnusson A, Moeller S,
Schwartz M, et al: gplots: Various R programming tools for plotting
data. R package version 2. 2009.
|
|
15
|
Ashburner M, Ball CA, Blake JA, Botstein
D, Butler H, Cherry JM, Davis AP, Dolinski K, Dwight SS, Eppig JT,
et al The Gene Ontology Consortium: Gene ontology: tool for the
unification of biology. Nat Genet. 25:25–29. 2000. View Article : Google Scholar : PubMed/NCBI
|
|
16
|
Szklarczyk D, Franceschini A, Wyder S,
Forslund K, Heller D, Huerta-Cepas J, Simonovic M, Roth A, Santos
A, Tsafou KP, et al: STRING v10: protein-protein interaction
networks, integrated over the tree of life. Nucleic Acids Res.
43:D447–D452. 2015. View Article : Google Scholar
|
|
17
|
Shannon P, Markiel A, Ozier O, Baliga NS,
Wang JT, Ramage D, Amin N, Schwikowski B and Ideker T: Cytoscape: a
software environment for integrated models of biomolecular
interaction networks. Genome Res. 13:2498–2504. 2003. View Article : Google Scholar : PubMed/NCBI
|
|
18
|
Opsahl T, Agneessens F and Skvoretz J:
Node centrality in weighted networks: generalizing degree and
shortest paths. Soc Networks. 32:245–251. 2010. View Article : Google Scholar
|
|
19
|
Wang H, Hernandez JM and Van Mieghem P:
Betweenness centrality in a weighted network. Phys Rev E Stat
Nonlin Soft Matter Phys. 77:0461052008. View Article : Google Scholar : PubMed/NCBI
|
|
20
|
Estrada E and Rodríguez-Velázquez JA:
Subgraph centrality in complex networks. Phys Rev E Stat Nonlin
Soft Matter Phys. 71:0561032005. View Article : Google Scholar : PubMed/NCBI
|
|
21
|
Okamoto K, Chen W and Li XY: Ranking of
closeness centrality for large-scale social networks. Frontiers in
Algorithmics. Springer; Berlin: pp. 186–195. 2008, View Article : Google Scholar
|
|
22
|
Tang Y, Li M, Wang J, Pan Y and Wu FX:
CytoNCA: a cytoscape plugin for centrality analysis and evaluation
of protein interaction networks. Biosystems. 127:67–72. 2015.
View Article : Google Scholar
|
|
23
|
Yu G, Wang LG, Han Y and He QY:
clusterProfiler: an R package for comparing biological themes among
gene clusters. OMICS. 16:284–287. 2012. View Article : Google Scholar : PubMed/NCBI
|
|
24
|
Ferreira JA: The Benjamini-Hochberg method
in the case of discrete test statistics. Int J Biostat. 3:112007.
View Article : Google Scholar
|
|
25
|
Janky R, Verfaillie A, Imrichová H, Van de
Sande B, Standaert L, Christiaens V, Hulselmans G, Herten K, Naval
Sanchez M, Potier D, et al: iRegulon: from a gene list to a gene
regulatory network using large motif and track collections. PLOS
Comput Biol. 10:e1003731. 2014. View Article : Google Scholar : PubMed/NCBI
|
|
26
|
Luan H, Zhang Q, Wang L, Wang C, Zhang M,
Xu X, Zhou H, Li X, Xu Q, He F, et al: OM85-BV induced the
productions of IL-1β, IL-6, and TNF-α via TLR4- and TLR2-mediated
ERK1/2/NF-κB pathway in RAW264.7 cells. J Interferon Cytokine Res.
34:526–536. 2014. View Article : Google Scholar : PubMed/NCBI
|
|
27
|
Bhattacharjee S, Bhattacharjee A, Majumder
S, Majumdar SB and Majumdar S: Glycyrrhizic acid suppresses
Cox-2-mediated anti-inflammatory responses during Leishmania
donovani infection. J Antimicrob Chemother. 67:1905–1914. 2012.
View Article : Google Scholar : PubMed/NCBI
|
|
28
|
Sun L, Cornell TT, LeVine A, Berlin AA,
Hinkovska-Galcheva V, Fleszar AJ, Lukacs NW and Shanley TP: Dual
role of interleukin-10 in the regulation of respiratory syncitial
virus (RSV)-induced lung inflammation. Clin Exp Immunol.
172:263–279. 2013. View Article : Google Scholar : PubMed/NCBI
|
|
29
|
Moon CM, Kwon JH, Kim JS, Oh SH, Jin Lee
K, Park JJ, Pil Hong S, Cheon JH, Kim TI and Kim WH: Nonsteroidal
anti-inflammatory drugs suppress cancer stem cells via inhibiting
PTGS2 (cyclooxygenase 2) and NOTCH/HES1 and activating PPARG in
colorectal cancer. Int J Cancer. 134:519–529. 2014. View Article : Google Scholar
|
|
30
|
Bank S, Skytt Andersen P, Burisch J,
Pedersen N, Roug S, Galsgaard J, Ydegaard Turino S, Brodersen JB,
Rashid S, Kaiser Rasmussen B, et al: Polymorphisms in the
inflammatory pathway genes TLR2, TLR4, TLR9, LY96, NFKBIA, NFKB1,
TNFA, TNFRSF1A, IL6R, IL10, IL23R, PTPN22, and PPARG are associated
with susceptibility of inflammatory bowel disease in a Danish
cohort. PLoS One. 9:e98815. 2014. View Article : Google Scholar : PubMed/NCBI
|
|
31
|
Huizar I, Malur A, Patel J, McPeek M,
Dobbs L, Wingard C, Barna BP and Thomassen MJ: The role of PPARγ in
carbon nanotube-elicited granulomatous lung inflammation. Respir
Res. 14:72013. View Article : Google Scholar
|
|
32
|
Crichton RR and Charloteaux-Wauters M:
Iron transport and storage. Eur J Biochem. 164:485–506. 1987.
View Article : Google Scholar : PubMed/NCBI
|
|
33
|
Ritchie RF, Palomaki GE, Neveux LM,
Navolotskaia O, Ledue TB and Craig WY: Reference distributions for
the negative acute-phase serum proteins, albumin, transferrin and
transthyretin: a practical, simple and clinically relevant approach
in a large cohort. J Clin Lab Anal. 13:273–279. 1999. View Article : Google Scholar
|
|
34
|
Wang Q and Bai Q: Influence of injection
with coenzyme A on IL-8, C-reaction protein, transferrin in the
elderly with acute upper respiratory tract infections. Chinese J
Nosocomiol. 15:0092013.In Chinese.
|
|
35
|
Gleeson M, Bishop N, Oliveira M, McCauley
T, Tauler P and Muhamad AS: Respiratory infection risk in athletes:
association with antigen-stimulated IL-10 production and salivary
IgA secretion. Scand J Med Sci Sports. 22:410–417. 2012. View Article : Google Scholar
|
|
36
|
Bont L, Heijnen CJ, Kavelaars A, van
Aalderen WM, Brus F, Draaisma JT, Geelen SM and Kimpen JL: Monocyte
IL-10 production during respiratory syncytial virus bronchiolitis
is associated with recurrent wheezing in a one-year follow-up
study. Am J Respir Crit Care Med. 161:1518–1523. 2000. View Article : Google Scholar : PubMed/NCBI
|
|
37
|
Tryggvason K, Höyhtyä M and Salo T:
Proteolytic degradation of extracellular matrix in tumor invasion.
Biochim Biophys Acta. 907:191–217. 1987.PubMed/NCBI
|
|
38
|
Karelina TV, Hruza GJ, Goldberg GI and
Eisen AZ: Localization of 92-kDa type IV collagenase in human skin
tumors: comparison with normal human fetal and adult skin. J Invest
Dermatol. 100:159–165. 1993. View Article : Google Scholar : PubMed/NCBI
|
|
39
|
Woessner JF Jr: Matrix metalloproteinases
and their inhibitors in connective tissue remodeling. FASEB J.
5:2145–2154. 1991. View Article : Google Scholar : PubMed/NCBI
|