Introduction
Renal cell carcinoma (RCC), which is derived from
the lining of the proximal convoluted tubule, represents 90-95% of
cases of kidney cancer (1). The
early symptoms of RCC are usually undetected, which leads to
advanced disease stages in patients newly diagnosed with RCC
(2). With the progression of RCC,
tumor cells may metastasize to other organs, including the liver,
lymph nodes, lungs, brain, adrenal glands and bones (3). RCC has a relatively higher incidence
in men than women, particularly in those >65 years old (4). Clear cell RCC (ccRCC), characterized
by the clear cytoplasm in cells, is the most frequent type of RCC
(5). Therefore, examining the
pathogenesis of ccRCC is necessary and of significance.
There are several studies reporting the molecular
mechanisms of ccRCC. For example, metastasis-associated lung
adenocarcinoma transcript 1 (MALAT1) is upregulated in
patients with ccRCC, which may be utilized to predict overall
survival (OS) and serve as a promising therapeutic target for the
disease (6,7). Hypoxia-inducible factor-1α, which is
involved in tumoral adaptation to hypoxic conditions, can be a
critical prognostic factor in metastatic ccRCC (8). The overexpression of cannabinoid
receptor 2 is important in the cell cycle, cellular proliferation
and migration of RCC cells, and predicts poor outcomes for patients
with RCC (9). Previous studies
have demonstrated that X-linked inhibitor of apoptosis protein is a
potential prognostic marker in RCC, and that its downregulation may
weaken immune resistance (10,11). Carbonic anhydrase 9 belongs to the
carbonic anhydrase family, and its low expression is correlated
with the poor prognosis of patients with ccRCC (12,13). However, these studies are
insufficient and the prognostic mechanisms of ccRCC remain to be
fully elucidated. In addition, the majority of the aforementioned
results obtained from these microarray data were not validated by
other datasets.
Bioinformatics analysis has been increasingly
applied for revealing the genetic changes in the high-throughput
data of tumors (14,15). In the present study, comprehensive
bioinformatics analyses for gene expression data were performed to
construct a prognostic prediction system for ccRCC with specific
signature genes. Additionally, these predicted genes were validated
by another dataset. The aim of the present study was to provide
additional, and reliable, prognostic markers for patients with
ccRCC, and shed light on the molecular mechanisms of disease
progression.
Materials and methods
Data source and data preprocessing
From The Cancer Genome Atlas (TCGA; https://cancergenome.nih.gov/) database, the mRNA
sequencing data of ccRCC, which was sequenced on the Illumina HiSeq
2000 RNA Sequencing platform, were downloaded with relevant
clinical information on December 18th, 2016. There were a total of
606 samples, and 605 of these had information on sample source
(normal or tumor tissues), including 533 ccRCC and 72 normal
samples. The expression profile dataset GSE40435 (GPL10558
platform) in the Gene Expression Omnibus (GEO; http://www.ncbi.nlm.nih.gov/geo/) database was
also obtained, which included 101 ccRCC and 101 normal samples.
According to the annotation platform, probes in the raw data of
GSE40435 were converted into gene symbols. If multiple probes
matched one gene, the average expression value of the gene was
obtained. Subsequently, the expression data underwent logarithmic
transformation using the R package Limma (http://www.bioconductor.org/packages/release/bioc/html/limma.html)
(16), to reach an approximately
normal distribution from the skewed distribution. Thereafter, the
median normalization method (17)
was utilized to normalize the data.
Analysis of differentially expressed
genes (DEGs)
The TCGA data was combined with the 19,004 protein
coding gene annotation information in the HUGO Gene Nomenclature
Committee (HGNC) database (18),
and mRNAs in the TCGA dataset were identified. The differential
expression analysis of genes or mRNAs was then performed between
ccRCC and normal samples in the TCGA dataset and GSE40435 dataset
separately, using the R package Limma (16). Subsequently, the false discovery
rate (FDR) values were calculated by the R package multtest
(http://www.bioconductor.org/packages/release/bioc/html/multtest.html)
(19). An FDR <0.05 and
|log2fold change (FC)|>0.585 were the thresholds for
selection of the DEGs. In addition, the overlapped DEGs in the TCGA
and GSE40435 datasets were identified for the following
analyses.
Screening of prognosis-associated
genes
From the TCGA dataset, 596 samples (525 ccRCC
samples and 71 normal samples) that matched with survival
information (survival time and survival status) were identified.
Subsequently, the 525 ccRCC samples were used for screening
prognosis-associated genes. Cox regression analysis in the survival
package (20) was applied for
selecting prognosis-associated genes, and the log-rank test
(21) was then utilized to
calculate significant p-values. The top six genes were selected
according to −logRank (P-value), following which Kaplan-Meier (KM)
survival curves (22) were
produced for the six genes.
Co-expression network analysis for
significant prognostic genes and functional annotation
The expression values were extracted from TCGA
database for the prognosis-associated genes, following which the
correlation coefficients between the expression values of two genes
were calculated using the COR function (23) in R. P<0.05 and a correlation
coefficient |r|≥0.6 were used for selecting gene co-expression
interactions. Subsequently, the co-expression network was
visualized using Cytoscape software 3.4.0 (http://www.cyto-scape.org/) (24).
Using Fisher’s exact test method in the R package
clusterProfiler (http://bioconductor.org/packages/release/bioc/html/clusterProfiler.html)
(25), the significant Gene
Ontology (GO) terms and Kyoto Encyclopedia of Genes and Genomes
(KEGG) pathways were enriched for the gene nodes in the
co-expression network. In addition, the transcription factors (TFs)
significantly associated with the nodes in the co-expression
network were searched using The Database for Annotation,
Visualization and Integrated Discovery (DAVID; https://david.ncifcrf.gov/) (26). Additionally, sub modules in the
co-expression network were examined using the GraphWeb tool
(http://biit.cs.ut.ee/graphweb/)
(27).
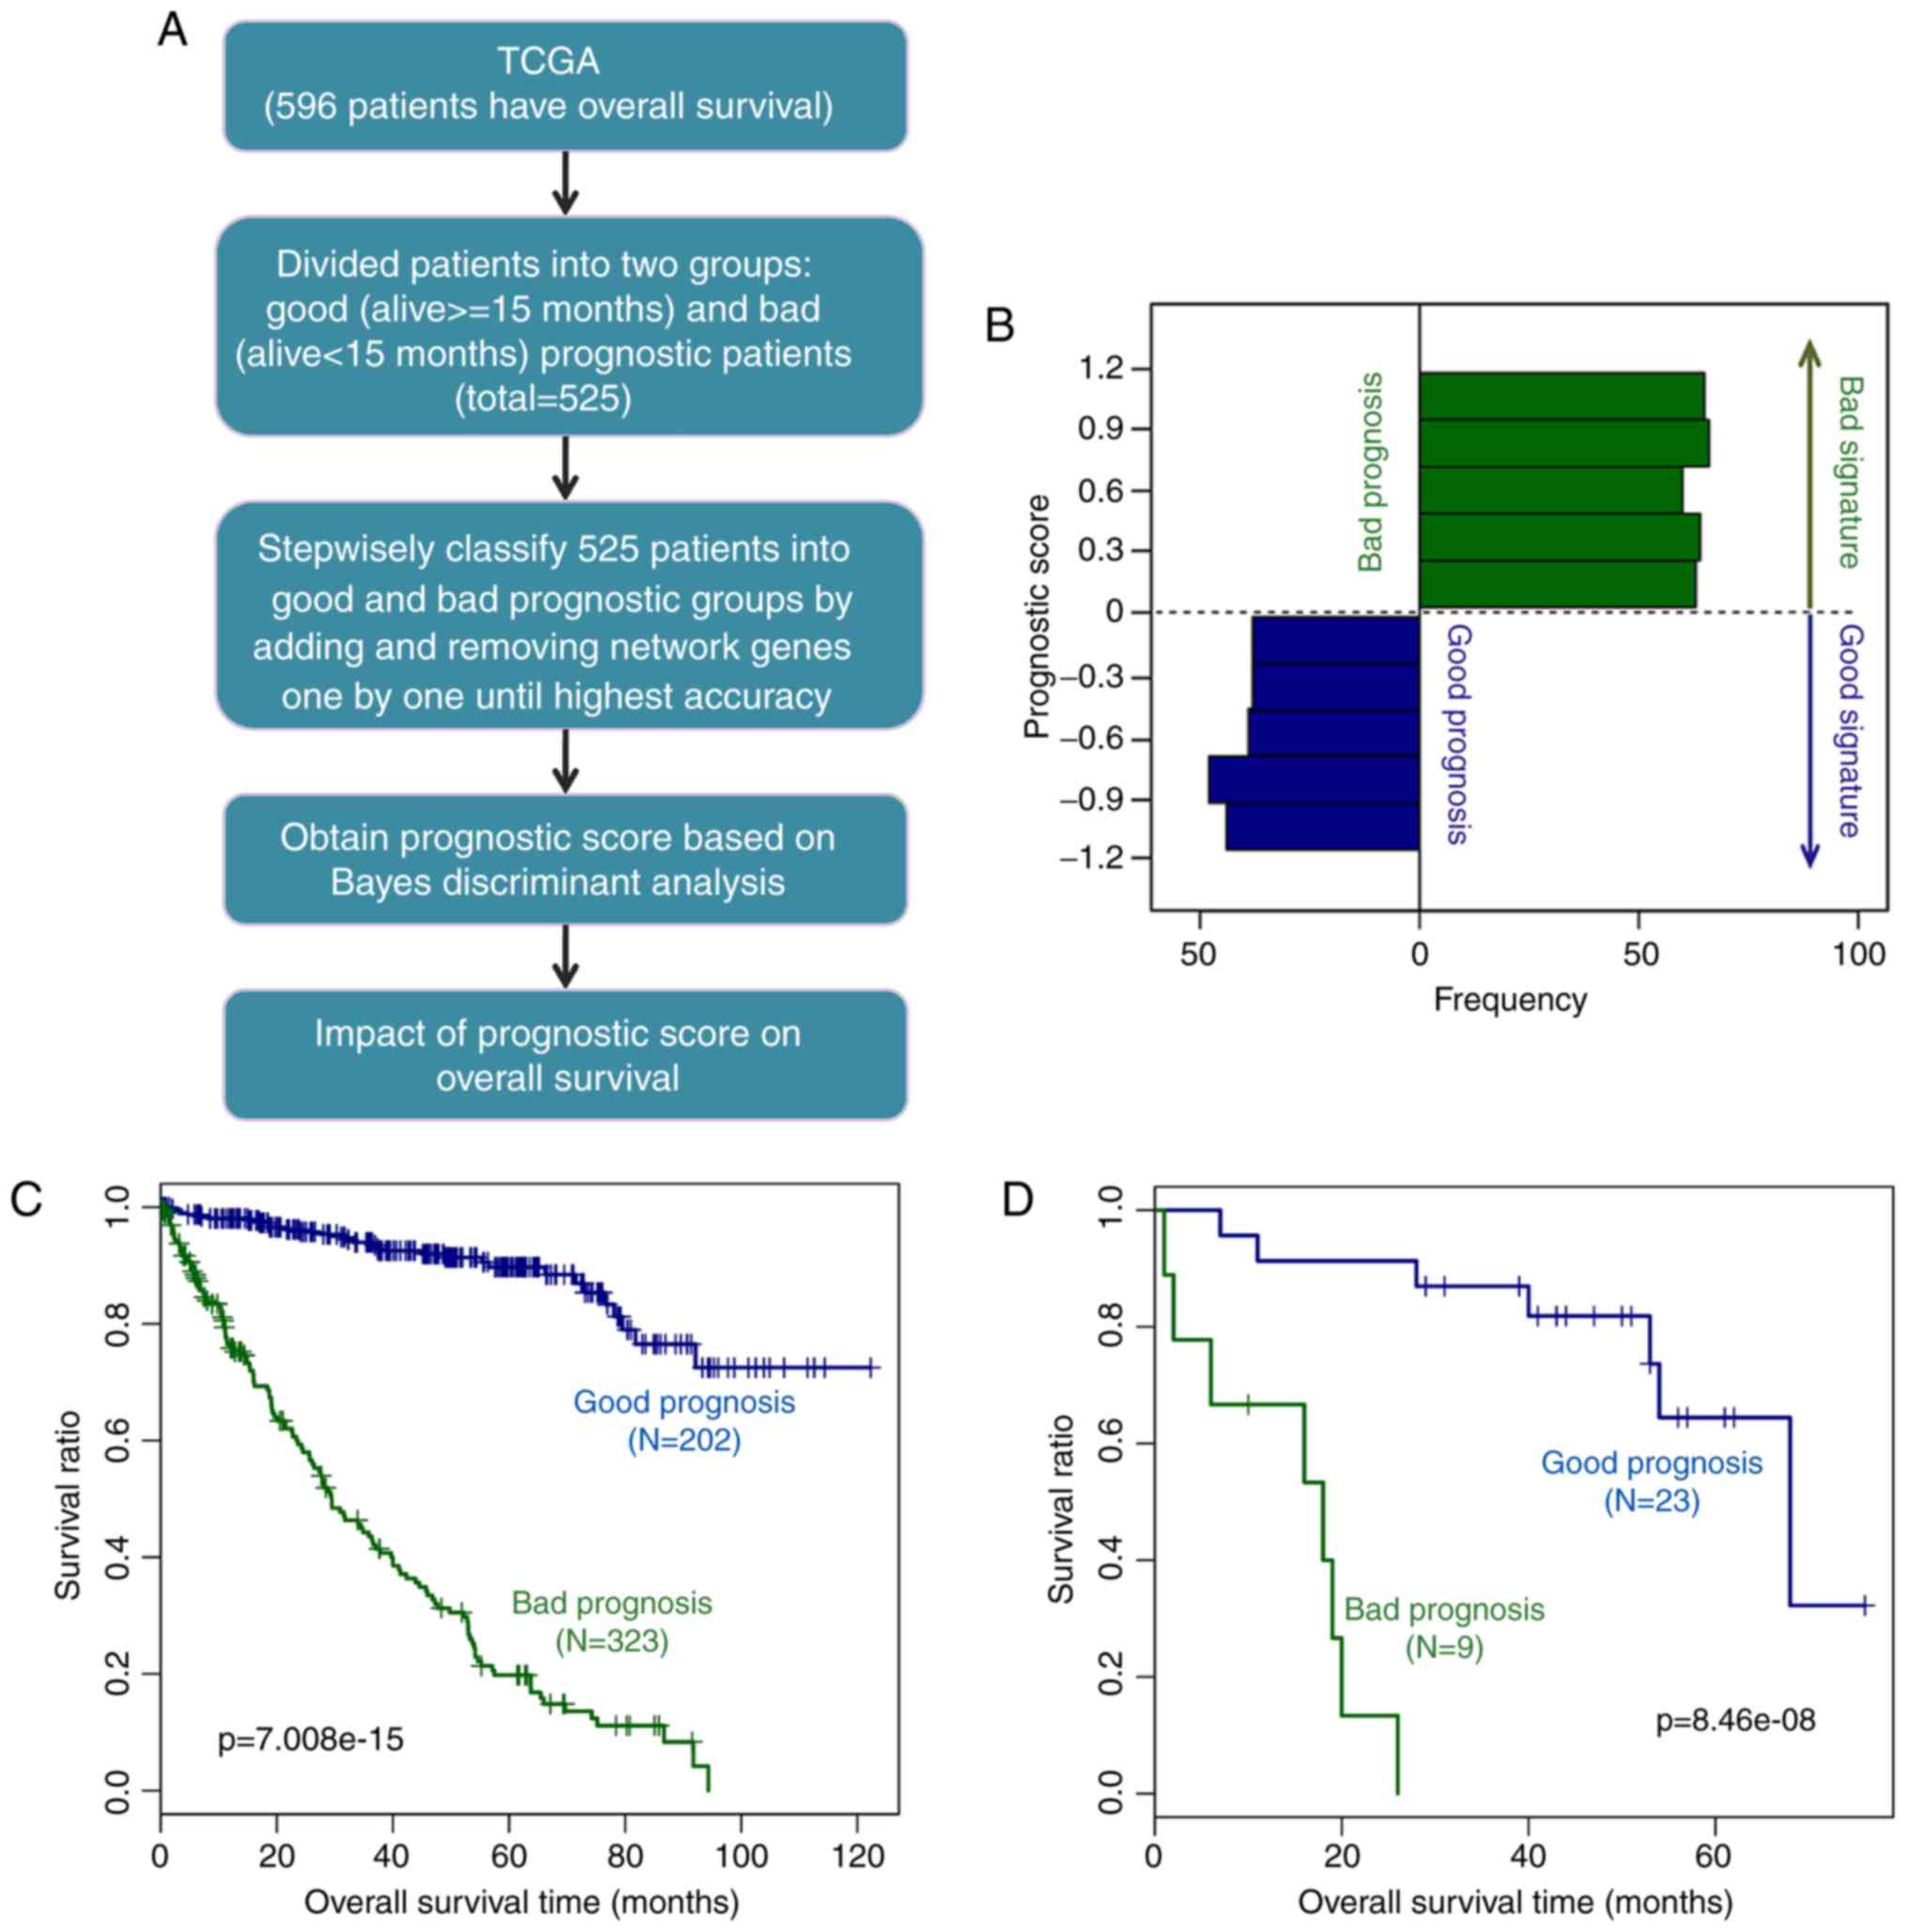
Construction of the prognostic prediction
system
The 525 ccRCC samples with survival information in
the TCGA dataset were considered as the training dataset for the
prognostic prediction system. First, the above samples were
classified into two groups based on their survival status: Alive
and deceased groups. Subsequently, combining survival status with
survival times, the samples were further divided into good
prognosis (alive and survival time ≥15 months) and bad prognosis
(succumbed to mortality and survival time <15 months) groups. As
the median OS time was ~15 months for all the ccRCC samples, the
cut-off value for grouping was set as 15 months. The prior
probability based on the Bayesian approach was then determined. The
nodes of the co-expression network were ranked (−logRank P-values
from largest to smallest). Using the discriminant Bayes function in
the e1071 package of R (https://cran.r-project.org/web/packages/e1071/index.html)
(28). Bayes discriminant
analysis was performed for the network nodes through adding genes
one by one and removing the genes that influenced prediction
accuracy.
The prognostic score was defined as the discriminant
coefficient of each sample when the prediction accuracy was the
highest, and the gene set was considered as signature genes. The
prediction system under the highest prediction accuracy was defined
as the prognostic prediction system.
Validation of the prognostic prediction
system
To examine the predictive effect of the constructed
prediction system, KM survival analysis (22) was performed for the TCGA dataset
to assess the association between the classification results of the
prognostic prediction system and the real survival time and
survival status. In addition, GSE29609 in the GEO data-base was
obtained as the validation dataset, which included 39 ccRCC samples
(32 samples with survival information). The expression values of
the aforementioned signature genes were extracted from the GSE29609
dataset, and the prognostic scores of the 32 samples were obtained
based on the prognostic prediction system. Subsequently, the 32
samples were divided into good prognosis and bad prognosis groups
according to the aforementioned criteria. In addition, the
correlations between the classification results of the prognostic
prediction system and the actual survival time and survival status
were detected by KM survival analysis (22).
Results
DEG analysis
Based on the HGNC database, the expression values of
18,531 protein-coding mRNAs were obtained from the TCGA dataset. A
total of 12,669 mRNAs remained following removal of the mRNAs with
low-abundance expression. There were numerous mRNAs expressed at
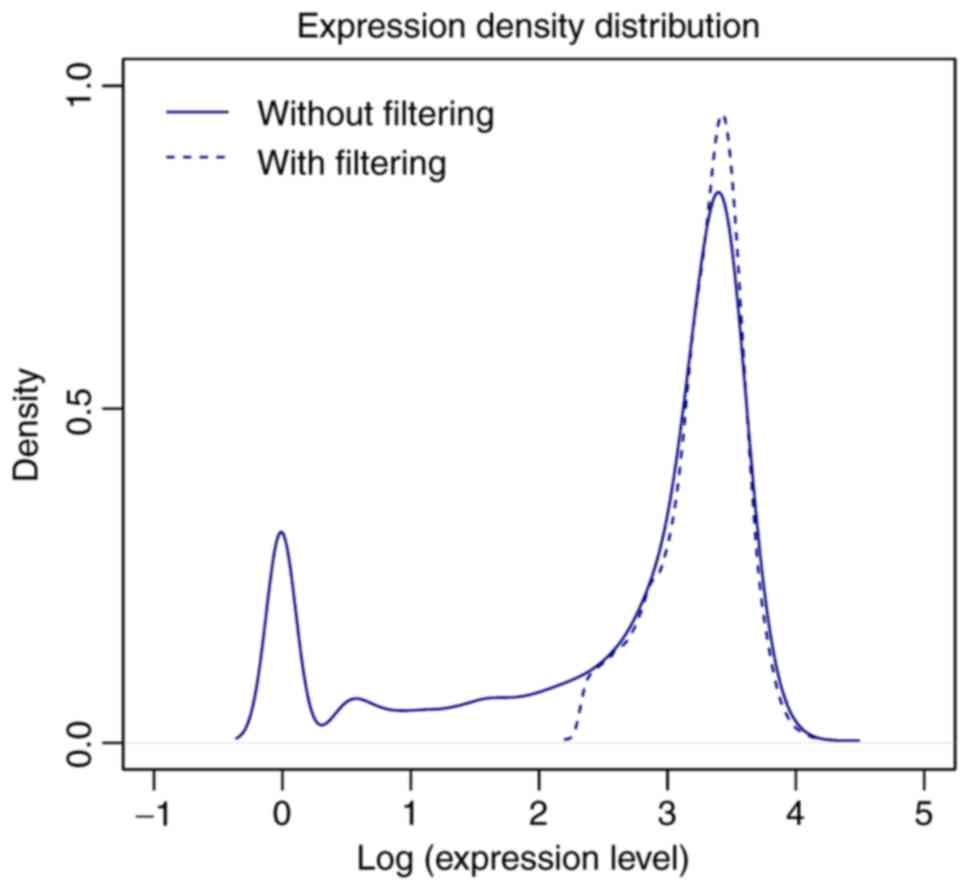
low levels prior to filtering, but the peak of expression density
was markedly elevated following filtering (Fig. 1).
Through differential expression analysis, a total of
621 and 2,764 DEGs were identified in the TCGA dataset and GSE40435
dataset, respectively. Among them, 263 overlapping DEGs in both the
TCGA dataset and GSE40435 dataset were selected.
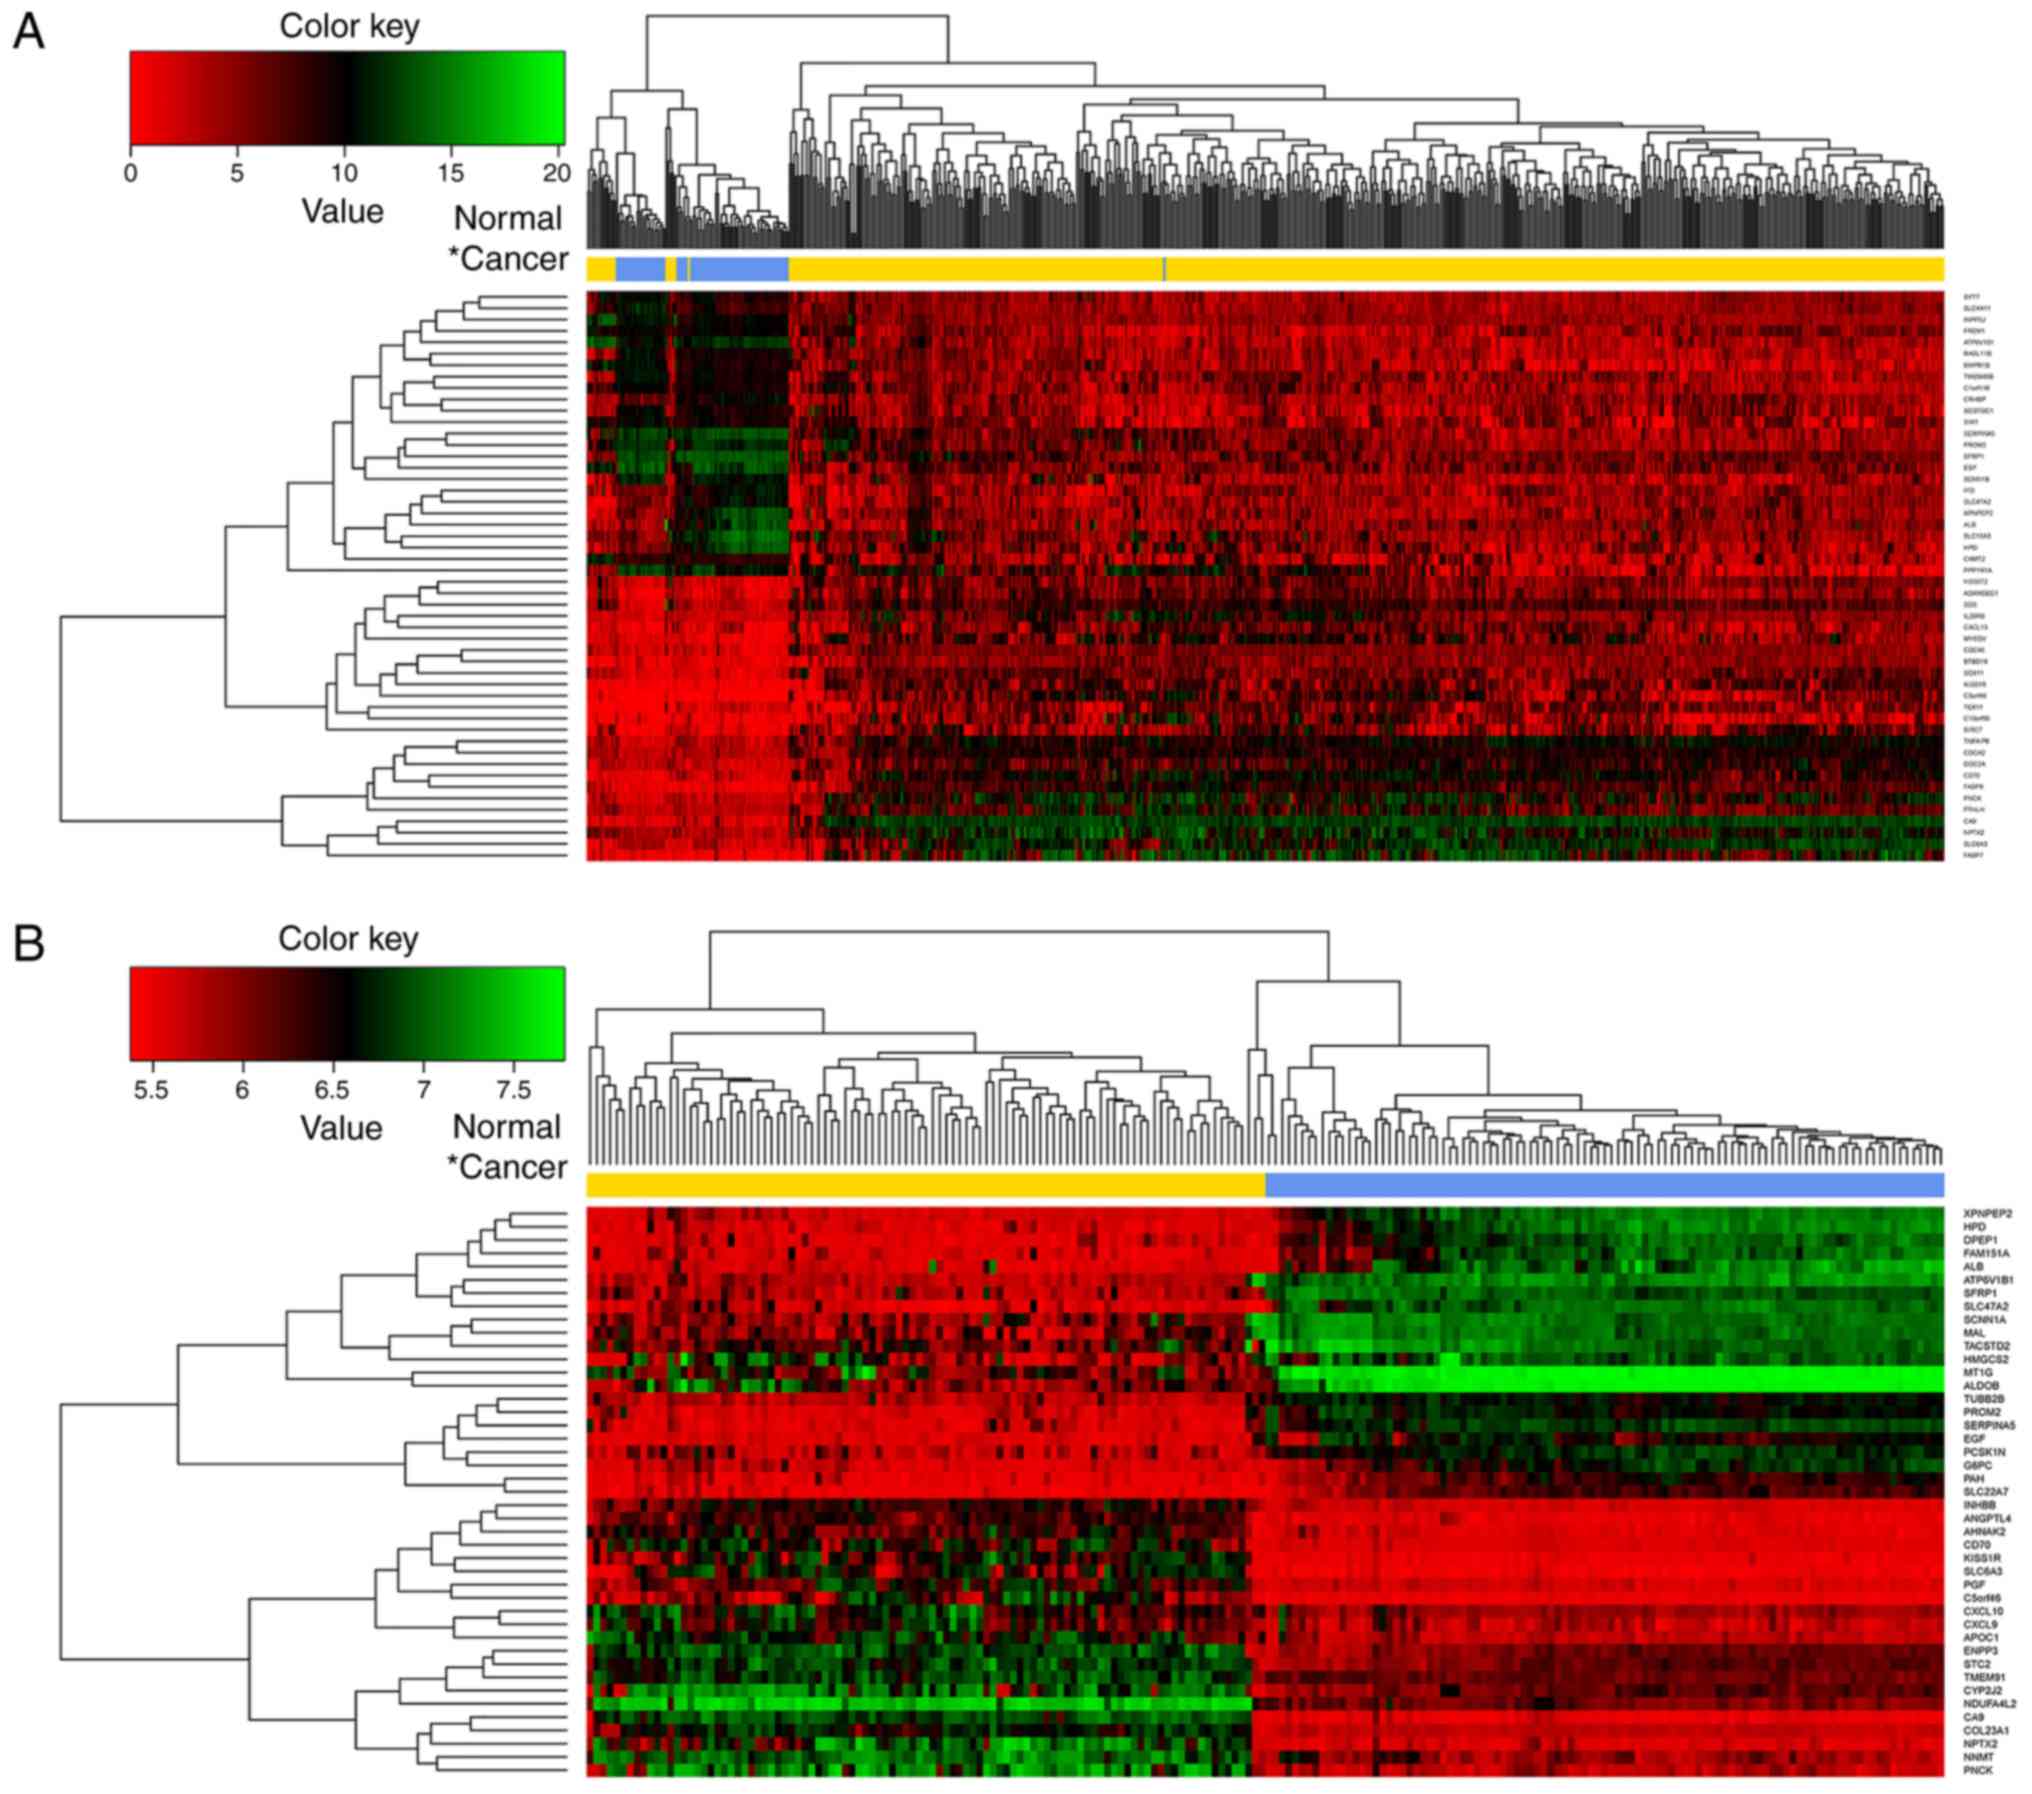
According to the logFC values, the top 50 DEGs (top
25 upregulated and top 25 downregulated) in the TCGA dataset
(Fig. 2A) and GSE40435 dataset
(Fig. 2B), respectively, were
selected and subjected to bidirectional hierarchical clustering
analysis. The heatmap showed that it was possible to divide the
samples into two groups by the above DEGs.
Screening of prognosis-associated
genes
A total of 161 prognosis-associated genes were
identified using Cox regression analysis from the TCGA dataset.
According to −logRank (P-value), the top six genes [transcription
factor AP-2a (TFAP2A); family with sequence similarity 167,
member A (FAM167A); interleukin 20 receptor b
(IL20RB); leucine-rich repeat LGI family, member 4
(LGI4); sodium channel, nonvoltage-gated 1b (SCNN1B);
and solute carrier family 17, member 2 (SLC17A2)] were
selected. The KM survival curves were generated (Fig. 3). It was shown that low expression
of these genes was linked to high survival time, indicating that
these six genes may be used as predictors for prognosis.
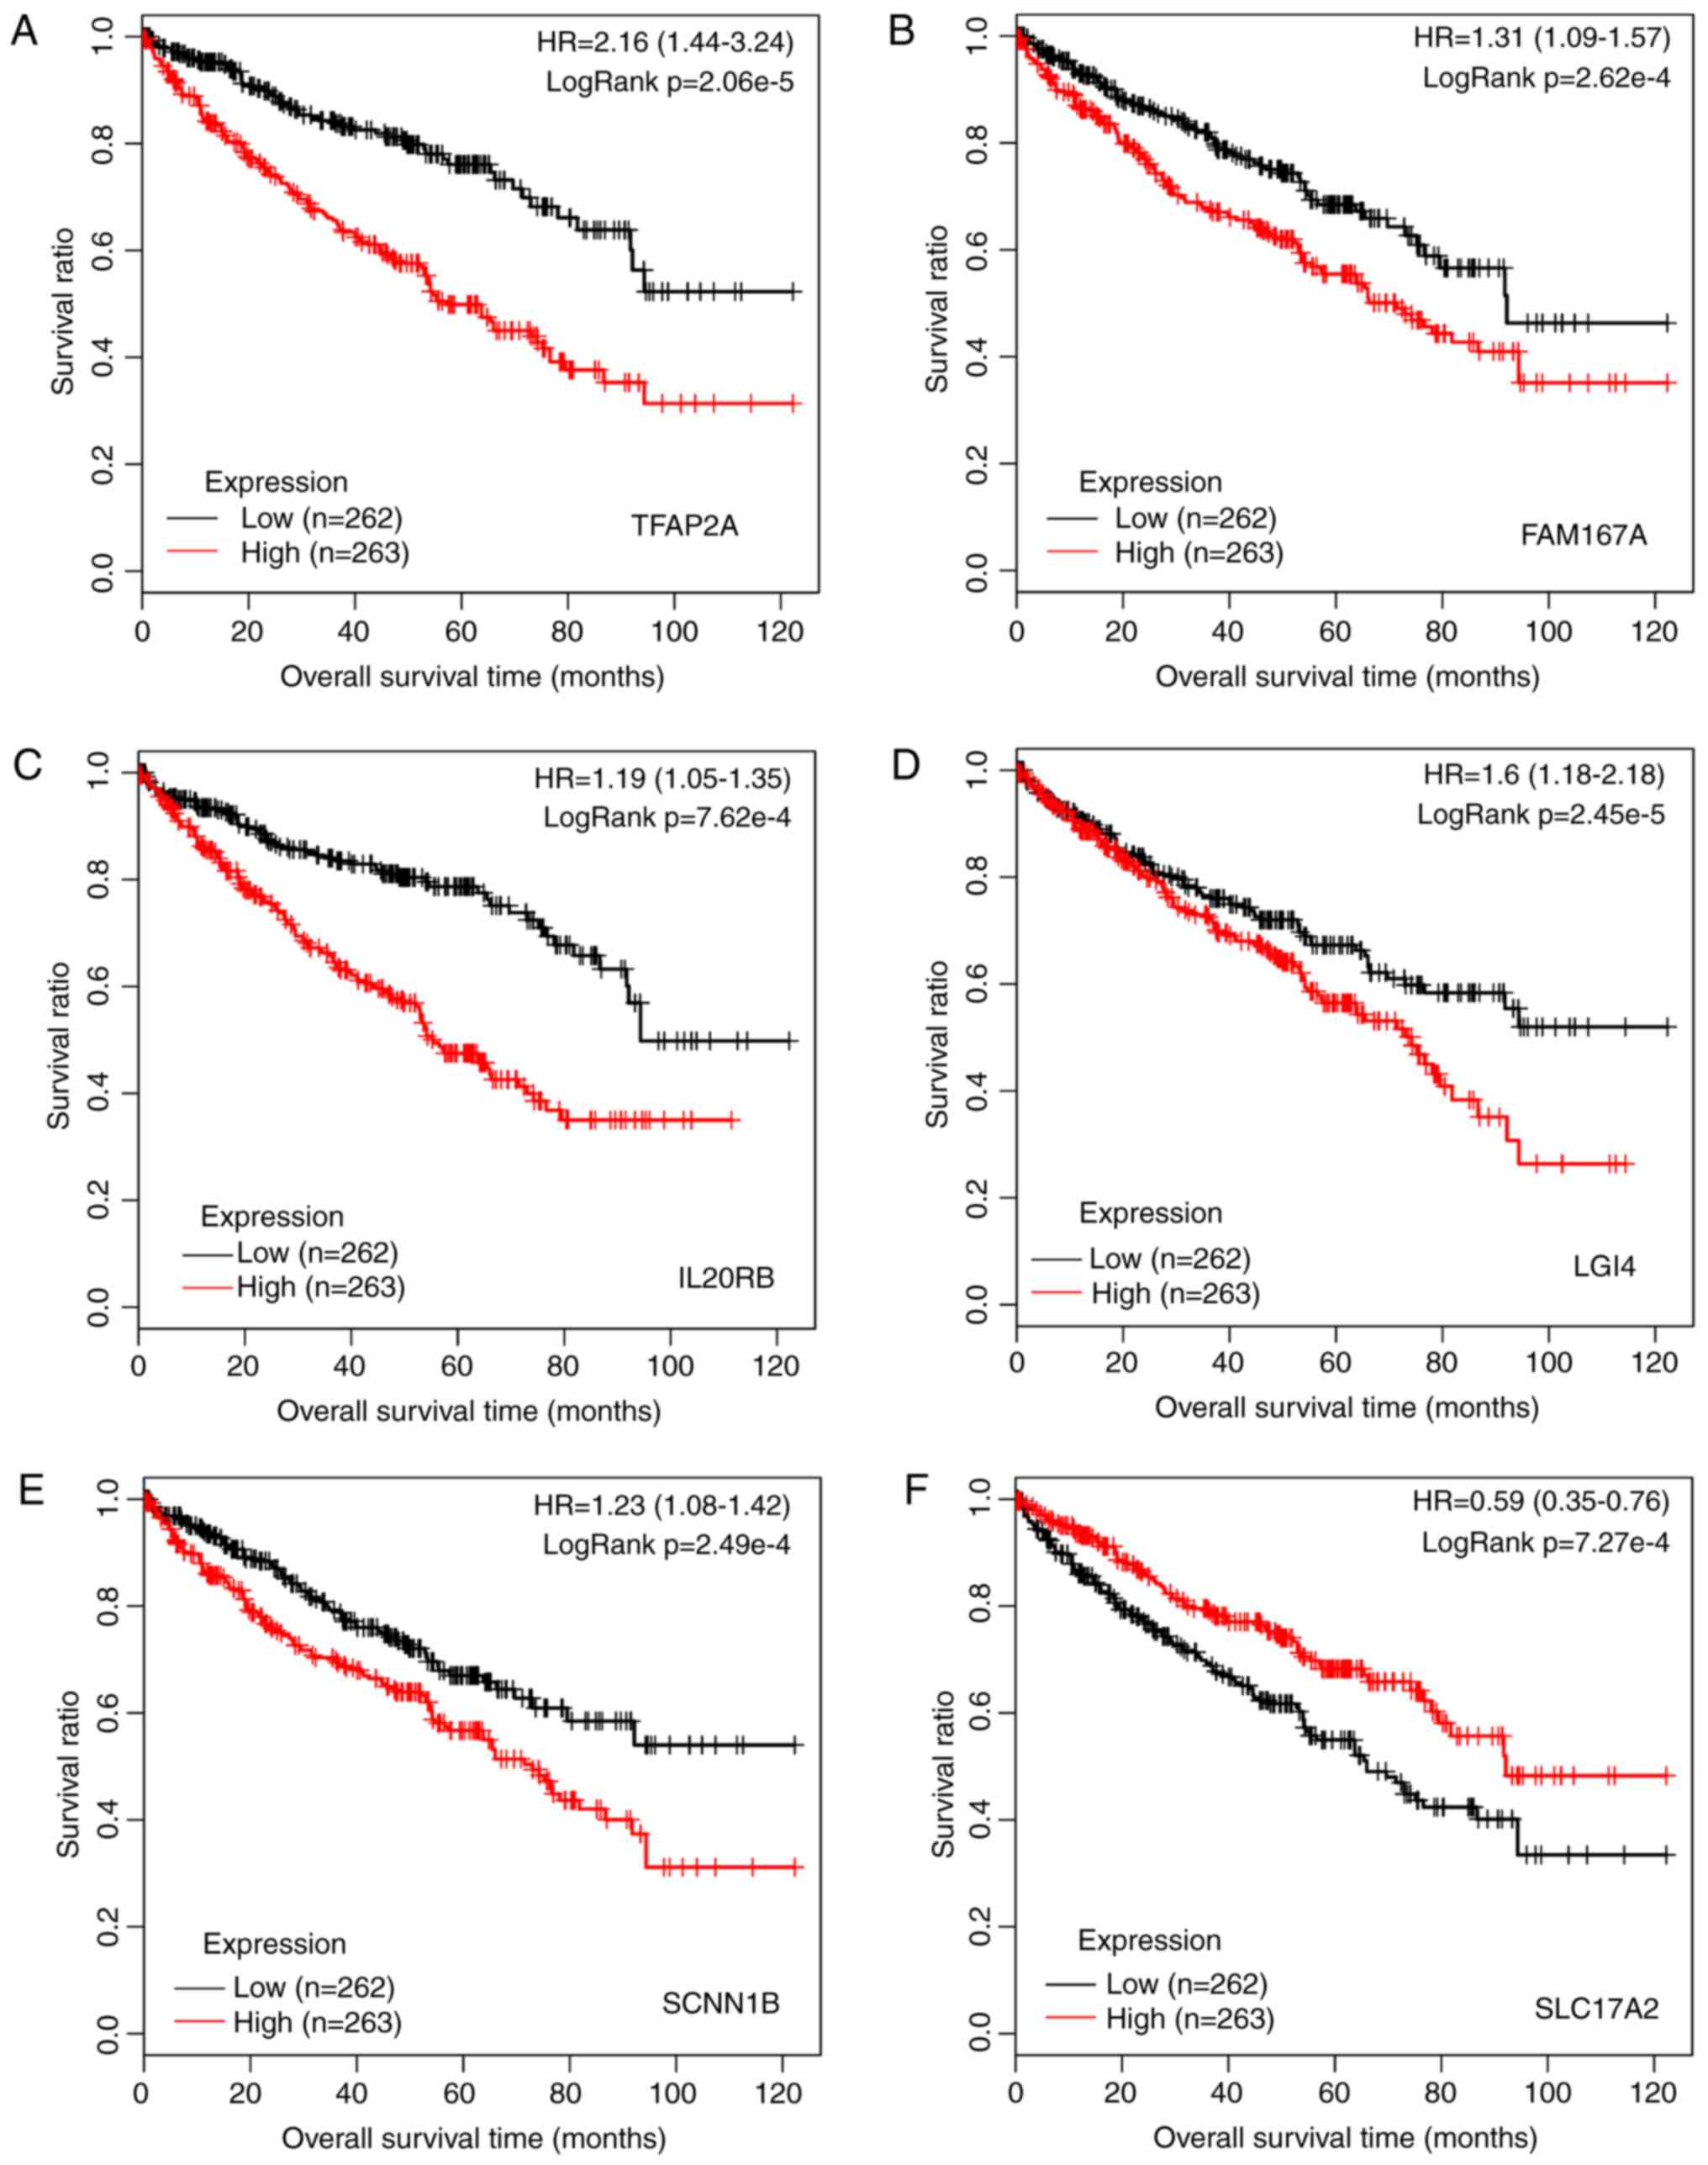 | Figure 3Kaplan-Meier survival curves for the
top six prognosis-associated genes of (A) TFAP2A, (B)
FAM167A, (C) IL20RB, (D) LGI4, (E)
SCNN1B, and (F) SLC17A2. Red and black lines
represent samples with high expression and low expression,
respectively. HR, hazard ratio; TFAP2A, transcription factor
AP-2α; FAM167A, family with sequence similarity 167, member
A; IL20RB, interleukin 20 receptor β; LGI4,
leucine-rich repeat LGI family, member 4; SCNN1B, sodium
channel, nonvoltage-gated 1β; SLC17A2, solute carrier family
17, member 2. |
Co-expression network analysis and
functional annotation
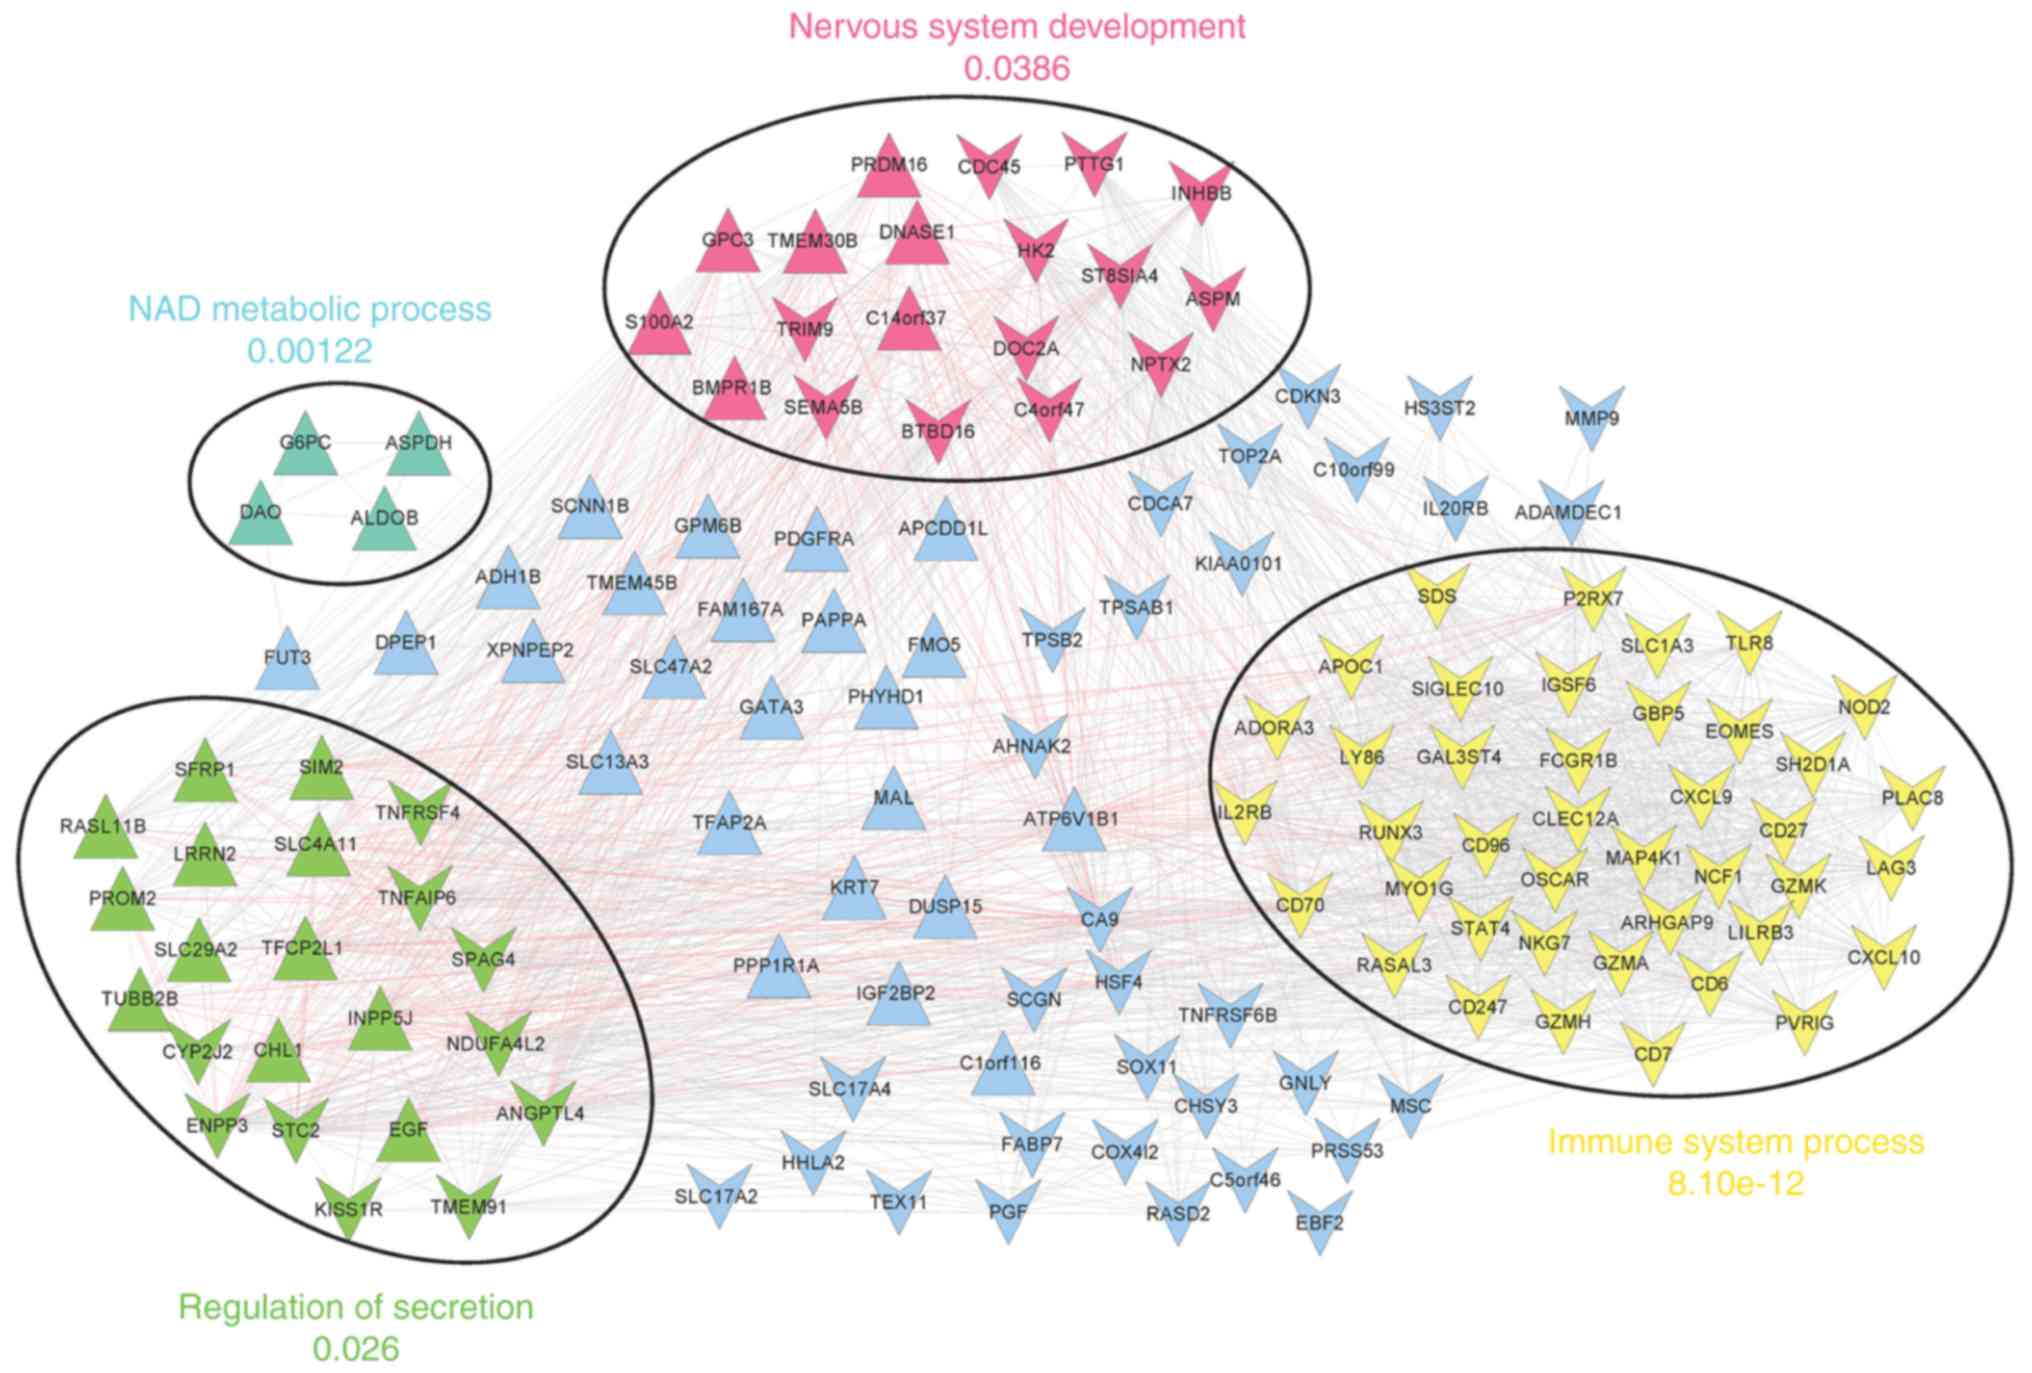
Following the selection of gene co-expression
interactions for the prognosis-associated genes, the co-expression
network (involving 141 nodes and 1,937 edges) was constructed
(Fig. 4).
In addition, four significant network modules were
identified, including a red module, a yellow module, involving
chemokine ligand 10 (CXCL10), CD27 molecule (CD27),
and runt-related transcription factor 3 (RUNX3), a green
module, involving angiopoietin-like 4 (ANGPTL4),
stanniocalcin 2 (STC2), and sperm associated antigen 4
(SPAG4), and a cyan module. Nervous system development,
immune system process, regulation of secretion, and NAD metabolic
process were the most significantly enriched terms for genes in the
red, yellow, green and cyan modules, respectively (Fig. 4).
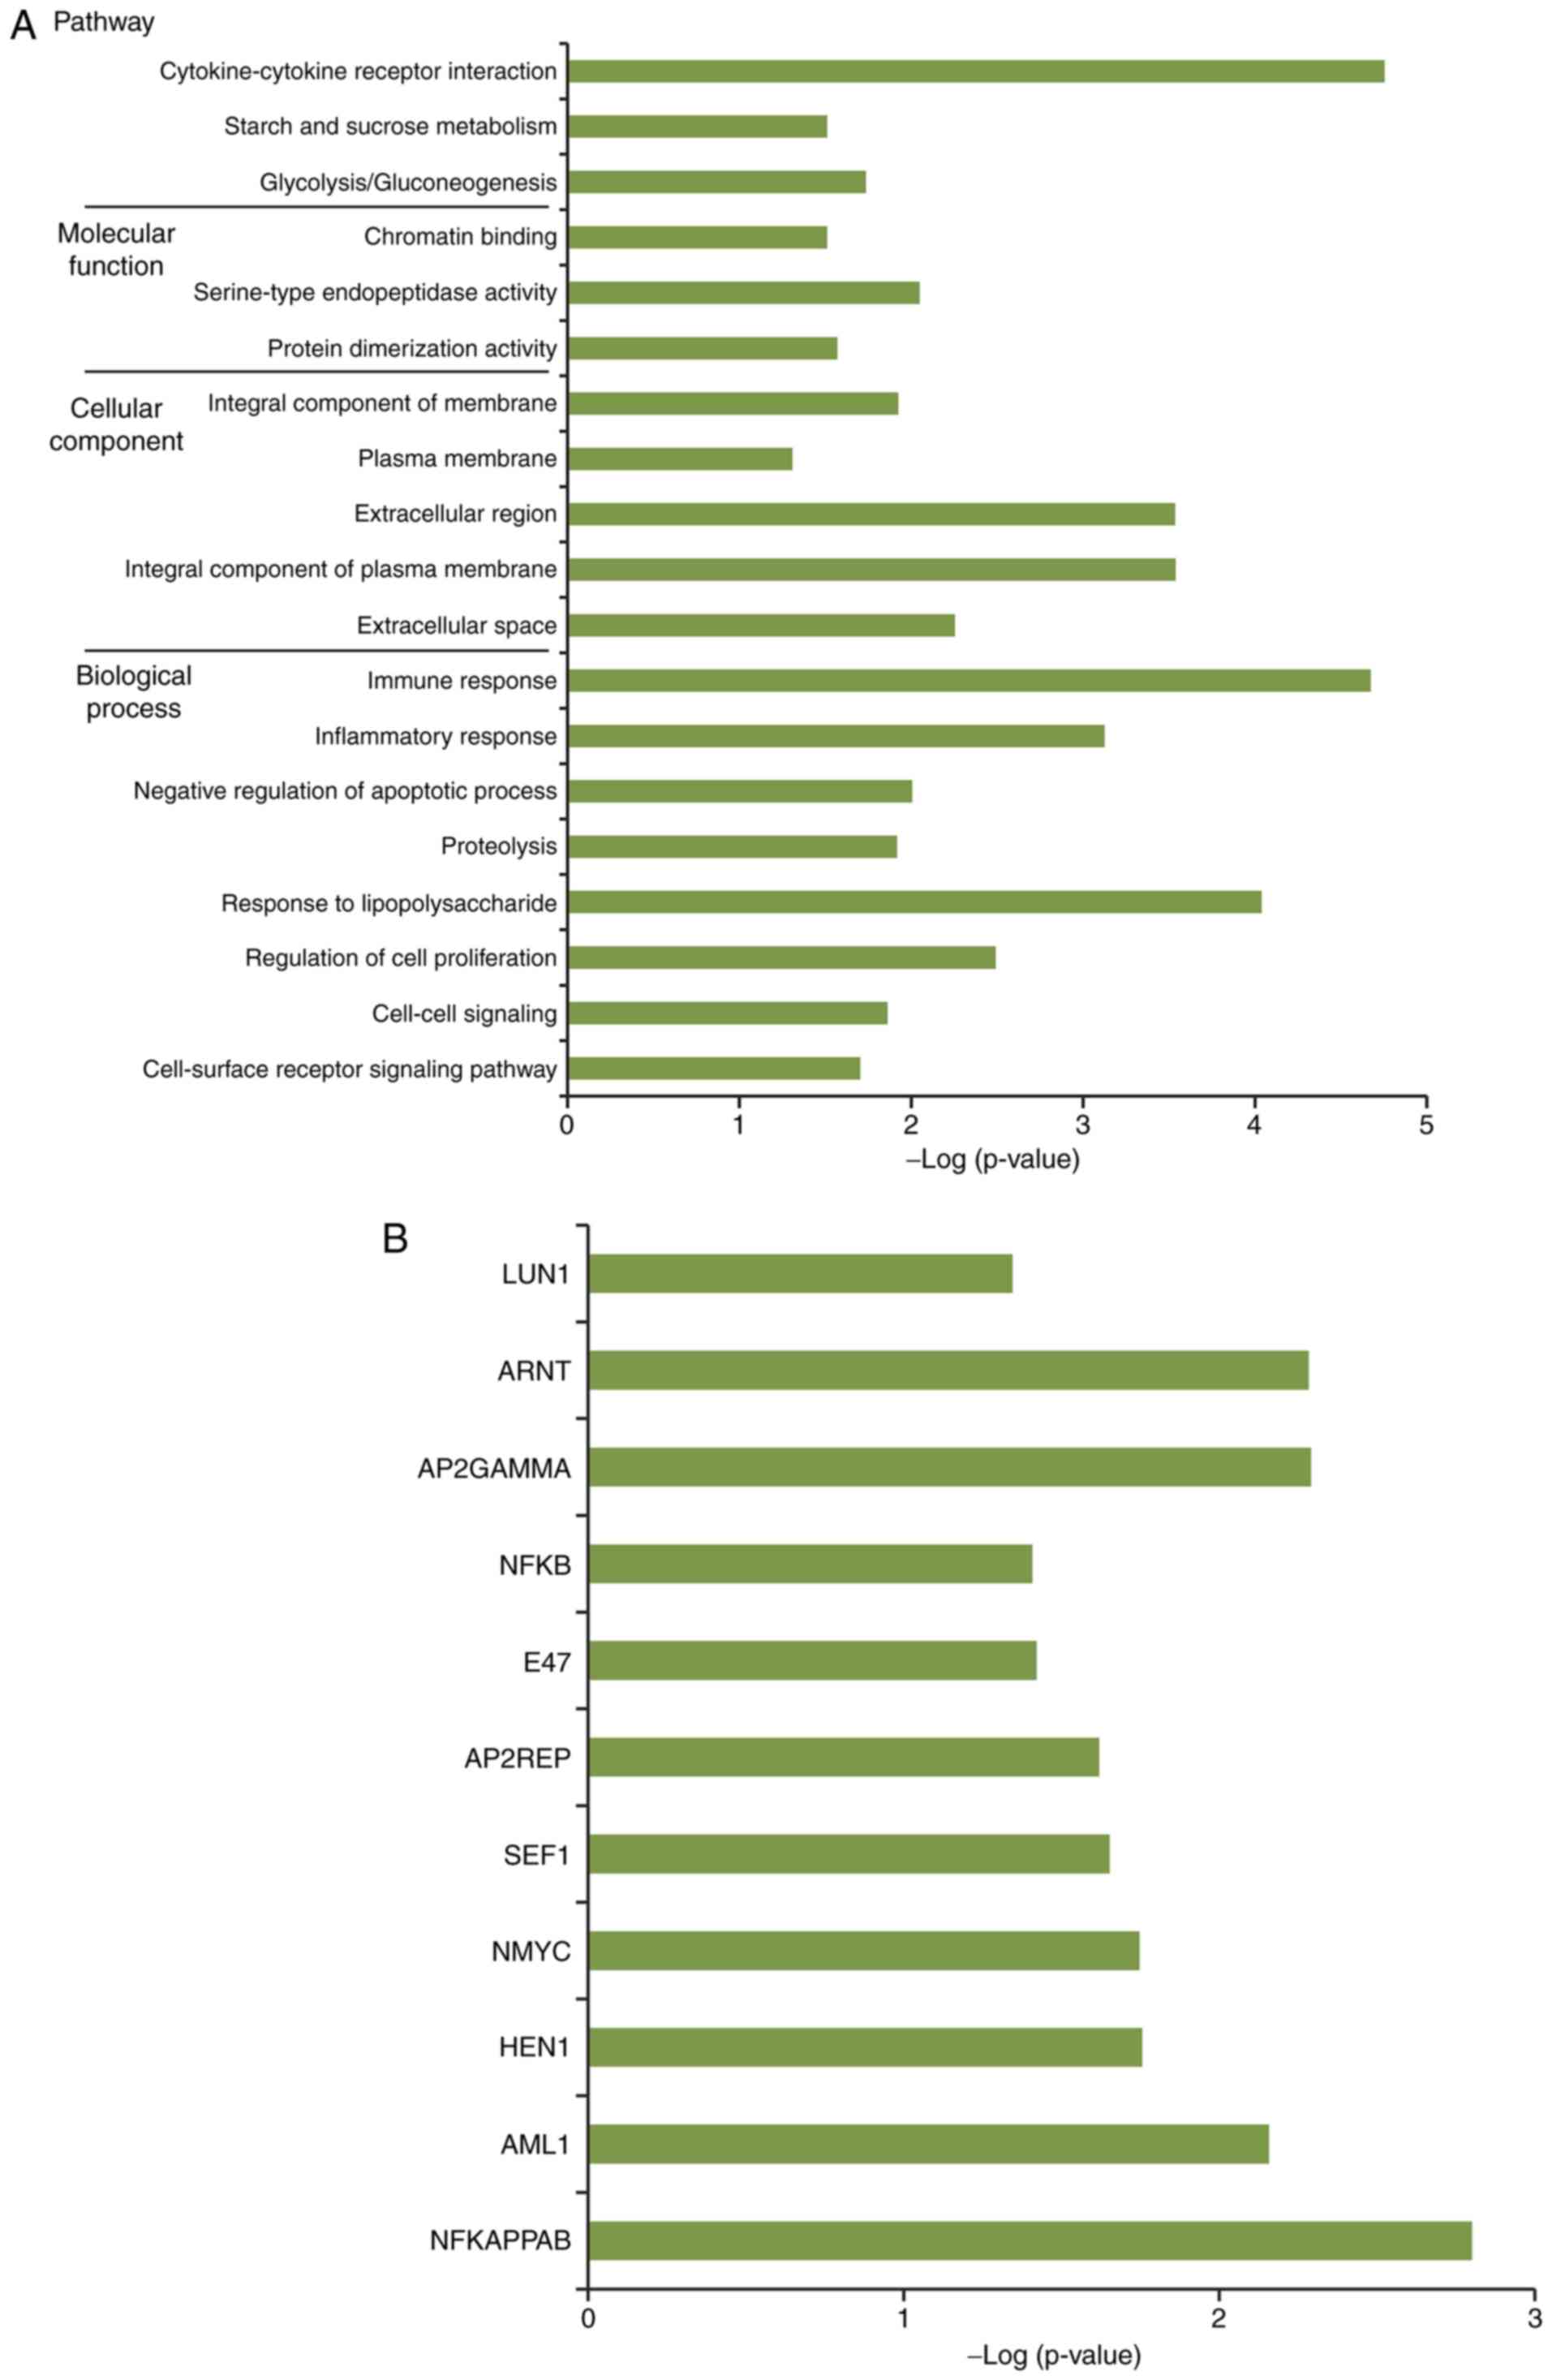
By performing functional and pathway enrichment
analysis, a total of 16 GO terms, including immune response, three
KEGG pathways, including cytokine-cytokine receptor interaction,
and 11 TFs, including nuclear factor-kB, were obtained for genes in
the network nodes (Fig. 5A and
B).
Construction and validation of prognostic
prediction system
The 525 ccRCC samples in the TCGA dataset were
divided into good prognosis (202 samples) and bad prognosis (323
samples) groups. Through a series of processes (Fig. 6A), the prognostic prediction
system containing 44 signature genes, including ANGPTL4,
STC2, CXCL10, SPAG4, CD27, matrix
metallo-peptidase 9 (MMP9), and RUNX3, were
constructed (Table I). The
44-gene prediction system had the highest prognostic accuracy for
the patients with ccRCC.
 | Table IInformation of the 44 signature genes
in The Cancer Genome Atlas dataset. |
Table I
Information of the 44 signature genes
in The Cancer Genome Atlas dataset.
| Gene | logFC | P-value | FDR |
|---|
|
C10orf99 | −2.344 |
6.88×10−64 |
3.23×10−61 |
|
ADAMDEC1 | −1.896 |
1.81×10−55 |
6.03×10−53 |
| HS3ST2 | −1.641 |
2.44×10−48 |
5.72×10−46 |
| IL20RB | −1.514 |
3.55×10−47 |
7.49×10−45 |
| SLC17A2 | −1.182 |
7.10×10⁻²⁸ |
5.23×10⁻²⁶ |
| LAG3 | −0.863 |
6.59×10⁻²² |
3.17×10⁻²⁰ |
| SPAG4 | −0.856 |
1.76×10⁻²⁹ |
1.43×10⁻²⁷ |
| CD27 | −0.820 |
2.44×10⁻²² |
1.24×10⁻²⁰ |
| SH2D1A | −0.804 |
1.55×10⁻¹⁸ |
5.34×10⁻¹⁷ |
| STC2 | −0.802 |
7.73×10⁻³² |
7.47×10⁻³⁰ |
| MMP9 | −0.797 |
5.24×10⁻²² |
2.54×10⁻²⁰ |
| ANGPTL4 | −0.786 |
5.94×10−37 |
7.60×10⁻³⁵ |
| OSCAR | −0.753 |
2.63×10⁻¹⁷ |
7.89×10⁻¹⁶ |
| HHLA2 | −0.742 |
1.70×10⁻²⁴ |
9.79×10⁻²³ |
| RASD2 | −0.734 |
6.34×10⁻²⁰ |
2.43×10⁻¹⁸ |
| NKG7 | −0.728 |
2.15×10⁻²¹ |
9.80×10⁻²⁰ |
| INHBB | −0.723 |
1.73×10⁻²⁴ |
9.92×10⁻²³ |
| CD96 | −0.718 |
1.58×10⁻¹⁸ |
5.42×10⁻¹⁷ |
| NOD2 | −0.687 |
2.47×10⁻¹⁴ |
5.39×10⁻¹³ |
| P2RX7 | −0.674 |
1.82×10⁻¹⁶ |
5.02×10⁻¹⁵ |
| PGF | −0.655 |
7.44×10⁻²² |
3.54×10⁻²⁰ |
| RASAL3 | −0.627 |
5.19×10⁻¹⁶ |
1.36×10⁻¹⁴ |
| ST8SIA4 | −0.627 |
2.64×10⁻¹⁹ |
9.66×10⁻¹⁸ |
| CDCA7 | −0.624 |
1.16×10⁻¹¹ |
1.96×10⁻¹⁰ |
| CHSY3 | −0.624 |
3.61×10⁻¹³ |
7.12×10⁻¹² |
| CXCL10 | −0.622 |
4.34×10⁻¹⁷ |
1.27×10⁻¹⁵ |
| CD6 | −0.622 |
1.38×10⁻¹⁴ |
3.09×10⁻¹³ |
| RUNX3 | −0.615 |
1.35×10⁻¹⁶ |
3.79×10⁻¹⁵ |
| SLC1A3 | −0.609 |
6.02×10⁻¹⁶ |
1.56×10⁻¹⁴ |
| CXCL9 | −0.609 |
2.13×10⁻¹⁸ |
7.18×10⁻¹⁷ |
| TRIM9 | −0.605 |
5.80×10⁻¹⁵ |
1.36×10⁻¹³ |
| SEMA5B | −0.599 |
3.69×10⁻²⁰ |
1.47×10⁻¹⁸ |
| PDGFRA | 0.605 |
9.58×10⁻²¹ |
4.11×10⁻¹⁹ |
| ADH1B | 0.667 |
8.24×10⁻²⁶ |
5.35×10⁻²⁴ |
| G6PC | 0.693 |
3.07×10⁻²¹ |
1.37×10⁻¹⁹ |
| KRT7 | 0.718 |
3.93×10⁻²⁹ |
3.09×10⁻²⁷ |
| TMEM30B | 0.754 |
1.11×10⁻²⁹ |
9.13×10⁻²⁸ |
| FAM167A | 0.911 |
8.99×10−37 |
1.13×10⁻³⁴ |
| TFAP2A | 0.948 |
4.13×10−36 |
5.13×10⁻³⁴ |
| SLC13A3 | 1.009 |
9.21×10−49 |
2.29×10−46 |
| TMEM45B | 1.036 |
1.43×10−47 |
3.12×10−45 |
|
C1orf116 | 1.062 |
5.48×10−47 |
1.14×10−44 |
| SCNN1B | 1.404 |
2.16×10−85 |
2.74×10−82 |
|
ATP6V1B1 | 1.456 |
1.36×10−92 |
1.91×10−89 |
The prognostic scores of the samples varied between
−1.5 and 1.5 (good prognosis group between −1.5 and 0; bad
prognosis group between 0 and 1.5; Fig. 6B). The discriminant scoring system
of the prognostic prediction system was as follows:
Prognostic score = α˙i=144 (Bayes discriminant) = [0-1.5, bad;
−1.5-0, good], where α˙
represents the prognostic score, and i means gene.
To assess the effect of the prediction system, KM
survival analysis was performed in the TCGA dataset first. The
result showed that the survival ratio of the good prognosis group
was significantly higher than that of the bad prognosis group
(P=7.008×10⁻¹⁵; Fig.
6C).
In addition, in the GSE29609 validation dataset, the
survival ratio of the good prognosis group was also significantly
higher that of the bad prognosis group (P=8.46×10⁻⁸;
Fig. 6D). These results suggested
that the prognostic prediction system was able to accurately and
practically classify ccRCC samples according to their
prognosis.
Discussion
Previously, several studies have utilized microarray
analysis to identify prognostic genes for ccRCC. By genome-wide
expression analyses of the expression profiles of patients with
primary ccRCC with different disease-free survival rates, platelet
and endothelial cell adhesion molecule 1, endothelin receptor type
B and tetraspanin 7 have been considered as prognostic markers
potentially involved in tumor metastases (29). Based on array-comparative genomic
hybridization, the genetic clustering of ccRCC was considered as a
potential prognostic indicator in patients with RCC that is closely
associated with DNA methylation alteration (30). However, these studies are
insufficient for prognostic marker identification in ccRCC. In the
present study, there were a total of 263 DEGs overlapped in the
TCGA dataset and GSE40435 dataset, and 161 of these were associated
with prognosis. Enrichment analysis showed that they were
correlated with three KEGG pathways, including the
cytokine-cytokine receptor interaction pathway. In addition, four
significant network modules (red, yellow, green, and cyan modules)
were identified from the co-expression network. Notably,
ANGPTL4, STC2 and SPAG4 were present in the
green module; whereas CXCL10, CD27 and RUNX3
were present in the yellow module. Through a series of
bioinformatics methods, a prognostic prediction system was
established comprising 44 signature genes, including
ANGPTL4, STC2, CXCL10, SPAG4,
CD27, MMP9, and RUNX3, and its prediction
accuracy was confirmed.
ANGPTL4, which is a member of the
angiopoietin/ANGPTL family, has a high expression and can be used
as a diagnostic marker in primary ccRCC (31,32). It is suggested that an increased
serum level of ANGPTL4 may function as a promising
diagnostic and prognostic marker for patients with RCC (33). The overexpression of STC2
is involved in the metastasis of RCC and may be an indicator for
the shorter OS of patients with RCC (34,35). In addition, multilevel
whole-genome analysis has revealed that STC2 is one of the
genes hypomethylated in copy number gains in ccRCC (36). SPAG4 is upregulated in
human RCC and has influences on the growth and invasion capability
of tumor cells (37,38). The mRNA expression of SPAG4
is negatively correlated with tumor stage, grade and size,
suggesting that SPAG4 can act as a marker for the diagnosis
and prognosis of RCC (39).
SPAG4 contributes to the survival of cancer cells via
suppressing hypoxia-induced tetraploid formation, and thus
SPAG4 can independently predict poor prognosis in RCC
(40). In the present study,
ANGPTL4, STC2 and SPAG4 were all involved in
the green module. Therefore, ANGPTL4, STC2 and
SPAG4 may function in ccRCC through their co-expression,
making them the prognostic factors for ccRCC.
CXCL10 inhibits tumor growth in RCC via
restraining angiogenesis and decreasing the expression levels of
vascular endothelial growth factor, platelet derived growth factor,
fibroblast growth factor, and MMP9 (41). In addition, the
interferon-inducible CXCR3 ligands score based on expression levels
of CXCL9, CXCL10 and CXCL11, is suggested to
be linked with different risk subgroups of recurrence and mortality
in patients with ccRCC (42).
CD27+ lymphocyte infiltration and the overexpression of
CD70 are correlated with poor prognosis in ccRCC, and an
elevated serum level of CD27 may be used for anti-CD70
therapy by predicting CD70-expressing ccRCC (43,44). RUNX3 is closely associated
with RCC progression, and its high expression can significantly
suppress the migration, invasion and angiogenesis in RCC (45-47). RUNX3 inhibits RCC migration
and invasion through mediating the microRNA-6780a-5p/
E-cadherin/epithelial-mesenchymal transition signaling pathway,
therefore, RUNX3 serves as a potential prognostic factor of
RCC (48). In terms of the
association of this gene with ccRCC, RUNX3 is decreased in
ccRCC tissues, and it functions as an inhibitor of ccRCC cell
growth and metastasis via regulating cyclins and tissue inhibitors
of matrix metalloproteinase 1 (TIMP1) (49). In the present study,
CXCL10, CD27 and RUNX3 were all involved in
the yellow module, indicating that these co-expressed genes may
also be associated with the prognosis of patients with ccRCC.
MMPs and their inhibitors (TIMPs) have an important
function in the maintenance of extracellular matrix homeostasis. In
RCC, the mRNA or protein expression of MMP2, MMP3, MMP9, TIMP1 and
TIMP2 are relevant to the clinicopathological parameters (50). MMP9 correlates with high
metastasis and poor survival rates in RCC, indicating that
MMP9 may be utilized for predicting the disease-free
survival rates of patients with RCC (51,52). The Notch ligand d-like 4 (DLL4) is
tied up with tumor invasion and metastasis. It has been found that
DLL4 facilitates RCC cell migration and invasion via upregulating
MMP2 and MMP9 (53). It is known
that, in the majority of ccRCC cases, inaction of the von
Hippel-Lindau (VHL) tumor suppressor gene is an important
hallmark, and the protein isoform of VHL coordinately
regulates the metastasis-associated genes CXCR4/CXCL12 and
MMP2/MMP9 (54). MMP9 has
been selected as one of the 10 important genes in the
protein-protein interaction network that associates with the
progression of ccRCC (55). In
the present study, this gene was one of the 44 signature genes
predicting ccRCC prognosis, suggesting it may be used as a
prognostic factor for patients with ccRCC.
Previously, a study reported that cytokine-cytokine
receptor interaction was the most significant pathway for DEGs in
RCC tissue (56). In the present
study, this pathway was also significantly enriched for DEGs
identified in ccRCC samples, suggesting that these crucial DEGs may
function through the regulation of this pathway.
The predictive accuracy of the 44-signature
gene-prognostic prediction system was confirmed by the validation
dataset (GSE29609), indicating this system may be applied for the
prognosis of patients with ccRCC. Although comprehensive
bioinformatics analysis was performed, and hundreds of samples were
used in the present study, a limitation remained that the
validation dataset had a relatively small sample size, and thus the
results require experimental validation, particularly the
co-expression of genes identified in the same module.
In conclusion, the 44-gene prognostic prediction
system, involving ANGPTL4, STC2, CXCL10,
SPAG4, CD27, MMP9, and RUNX3, may be
important in predicting the prognosis of patients with ccRCC.
However, these key genes and the 44-gene prognostic prediction
system require further validation by experimental
investigations.
Funding
No funding was received.
Availability of data and materials
The datasets used during the current study are
available from the corresponding author on reasonable request.
Authors’ contributions
YoW and YaW were involved in the design of this
study and performed the statistical analysis. YaW collected
important background information. FL drafted the manuscript. All
authors read and approved the final manuscript.
Ethics approval and consent to
participate
Not applicable.
Patient consent for publication
Not applicable.
Competing interests
The authors declare that they have no competing
interests.
Acknowledgments
Not applicable.
References
|
1
|
Cohen HT and Mcgovern FJ: Renalcell
carcinoma. N Engl Med. 353:2477–2490. 2005. View Article : Google Scholar
|
|
2
|
Jonasch E, Gao J and Rathmell WK: Renal
cell carcinoma. BMJ. 349:g47972014. View Article : Google Scholar : PubMed/NCBI
|
|
3
|
Ljungberg B, Cowan NC, Hanbury DC, Hora M,
Kuczyk MA, Merseburger AS, Patard JJ, Mulders PF and Sinescu IC;
European Association of Urology Guideline Group: EAU guidelines on
renal cell carcinoma: the 2010 update. Eur Urol. 58:398–406. 2010.
View Article : Google Scholar : PubMed/NCBI
|
|
4
|
Znaor A, Lortet-Tieulent J, Laversanne M,
Jemal A and Bray F: International variations and trends in renal
cell carcinoma incidence and mortality. Eur Urol. 67:519–530. 2015.
View Article : Google Scholar
|
|
5
|
Young JR, Margolis D, Sauk S, Pantuck AJ,
Sayre J and Raman SS: Clear cell renal cell carcinoma:
Discrimination from other renal cell carcinoma subtypes and
oncocytoma at multi-phasic multidetector CT. Radiology.
267:444–453. 2013. View Article : Google Scholar : PubMed/NCBI
|
|
6
|
Zhang HM, Yang FQ, Chen SJ, Che J and
Zheng JH: Upregulation of long non-coding RNA MALAT1 correlates
with tumor progression and poor prognosis in clear cell renal cell
carcinoma. Tumour Biol. 36:2947–2955. 2015. View Article : Google Scholar
|
|
7
|
Hirata H, Hinoda Y, Shahryari V, Deng G,
Nakajima K, Tabatabai ZL, Ishii N and Dahiya R: Long noncoding RNA
MALAT1 promotes aggressive renal cell carcinoma through Ezh2 and
interacts with miR-205. Cancer Res. 75:1322–1331. 2015. View Article : Google Scholar : PubMed/NCBI
|
|
8
|
Klatte T, Seligson DB, Riggs SB, Leppert
JT, Berkman MK, Kleid MD, Yu H, Kabbinavar FF, Pantuck AJ and
Belldegrun AS: Hypoxia-inducible factor 1α in clear cell renal cell
carcinoma. Clin Cancer Res. 13:7388–7393. 2007. View Article : Google Scholar : PubMed/NCBI
|
|
9
|
Wang J, Xu Y, Zhu L, Zou Y, Kong W, Dong
B, Huang J, Chen Y, Xue W, Huang Y and Zhang J: Cannabinoid
receptor 2 as a novel target for promotion of renal cell carcinoma
prognosis and progression. J Cancer Res Clin Oncol. 144:39–52.
2018. View Article : Google Scholar
|
|
10
|
Mizutani Y, Nakanishi H, Li YN, Matsubara
H, Yamamoto K, Sato N, Shiraishi T, Nakamura T, Mikami K, Okihara
K, et al: Overexpression of XIAP expression in renal cell carcinoma
predicts a worse prognosis. Int J Oncol. 30:919–925.
2007.PubMed/NCBI
|
|
11
|
Yamada T, Horinaka M, Shinnoh M, Yoshioka
T, Miki T and Sakai T: A novel HDAC inhibitor OBP-801 and a PI3K
inhibitor LY294002 synergistically induce apoptosis via the
suppression of survivin and XIAP in renal cell carcinoma. Int J
Oncol. 43:1080–1086. 2013. View Article : Google Scholar : PubMed/NCBI
|
|
12
|
Tostain J, Li G, Gentilperret A and
Gigante M: Carbonic anhydrase 9 in clear cell renal cell carcinoma:
A marker for diagnosis, prognosis and treatment. Eur J Cancer.
46:3141–3148. 2010. View Article : Google Scholar : PubMed/NCBI
|
|
13
|
Choueiri TK, Regan MM, Rosenberg JE, Oh
WK, Clement J, Amato AM, McDermott D, Cho DC, Atkins MB and
Signoretti S: Carbonic anhydrase IX and pathological features as
predictors of outcome in patients with metastatic clear-cell renal
cell carcinoma receiving vascular endothelial growth
factor-targeted therapy. Bju Int. 106:772–778. 2010. View Article : Google Scholar : PubMed/NCBI
|
|
14
|
Yang W, Huang P, Zhao M and Lau YL:
Biomarker identification for early tumor detection aided by
bioinformatics gene expression analysis. International Conference
on Biomedical Engineering and Informatics. Sanya; Hainan, China:
pp. 469–473. 2008
|
|
15
|
Fonseca AL, da Silva VL, da Fonsêca MM,
Meira ITJ, da Silva TE, Kroll JE, Ribeiro-dos-Santos AM, Freitas
CR, Furtado R, de Souza JE, et al: Bioinformatics analysis of the
human surfaceome reveals new targets for a variety of tumor types.
Int J Genomics. 2016.1–7. 2016. View Article : Google Scholar
|
|
16
|
Smyth GK: Limma: Linear Models for
Microarray Data. Springer; New York: 2005
|
|
17
|
Wang Y, Zeigler MM, Lam GK, Hunter MG,
Eubank TD, Khramtsov VV, Tridandapani S, Sen CK and Marsh CB: The
role of the NADPH oxidase complex, p38 MAPK, and Akt in regulating
human monocyte/macrophage survival. Am J Respir Cell Mol Biol.
36:68–77. 2007. View Article : Google Scholar
|
|
18
|
Bruford EA, Lush MJ, Wright MW, Sneddon
TP, Sue P and Ewan B: The HGNC Database in 2008: A resource for the
human genome. Nucleic Acids Res. 36:445–448. 2008. View Article : Google Scholar
|
|
19
|
Pollard KS, Dudoit S and van der Laan MJ:
Multiple testing procedures: The multtest package and applications
to genomics. Bioinformatics and Computational Biology Solutions
Using R and Bioconductor. Gentleman R, Carey VJ, Huber W, Irizarry
RA and Du ST: Springer; New York: pp. 465. 2005
|
|
20
|
Therneau TM: Survival analysis. R package
survival, version 2. 39–5. 2016.
|
|
21
|
Kleinbaum DG and Klein M: Kaplan-meier
survival curves and the log-rank test. Statistics for Biology and
Health. Springer; New York: pp. 45–82. 2005
|
|
22
|
Porcher R: CORR Insights(®): Kaplan-meier
survival analysis overestimates the risk of revision arthroplasty:
A meta-analysis. Clin Orthop Relat Res. 473:3443–3445. 2015.
View Article : Google Scholar : PubMed/NCBI
|
|
23
|
Nowicka-Zagrajek J and Weron R: COR:
MATLAB function to compute the correlation coefficients. Hsc
software. 2008.
|
|
24
|
Kohl M, Wiese S and Warscheid B:
Cytoscape: Software for visualization and analysis of biological
networks. Methods Mol Biol. 696:291–303. 2011. View Article : Google Scholar
|
|
25
|
Yu G, Wang LG, Han Y and He QY: Cluster
profiler: An R package for comparing biological themes among gene
clusters. OMICS. 16:284–287. 2012. View Article : Google Scholar : PubMed/NCBI
|
|
26
|
Huang DW, Sherman BT, Tan Q, Kir J, Liu D,
Bryant D, Guo Y, Stephens R, Baseler MW, Lane HC and Lempicki RA:
DAVID bioinformatics resources: Expanded annotation database and
novel algorithms to better extract biology from large gene lists.
Nucleic Acids Res. 35:169–175. 2007. View Article : Google Scholar
|
|
27
|
Reimand J, Tooming L, Peterson H, Adler P
and Vilo J: GraphWeb: Mining heterogeneous biological networks for
gene modules with functional significance. Nucleic Acids Res.
36:452–459. 2008. View Article : Google Scholar
|
|
28
|
Dimitriadou E, Hornik K, Leisch F, Meyer D
and Weingesse A: The e1071 package. Ethnos J Anthropol. 23:55–56.
2006.
|
|
29
|
Wuttig D, Zastrow S, Füssel S, Toma MI,
Meinhardt M, Kalman K, Junker K, Sanjmyatav J, Boll K, Hackermüller
J, et al: CD31, EDNRB and TSPAN7 are promising prognostic markers
in clear-cell renal cell carcinoma revealed by genomewide
expression analyses of primary tumors and metastases. Int J Cancer.
131:E693–E704. 2012. View Article : Google Scholar : PubMed/NCBI
|
|
30
|
Arai E, Ushijima S, Tsuda H, Fujimoto H,
Hosoda F, Shibata T, Kondo T, Imoto I, Inazawa J, Hirohashi S and
Kanai Y: Genetic clustering of clear cell renal cell carcinoma
based on array-comparative genomic hybridization: Its association
with DNA methylation alteration and patient outcome. Clin Cancer
Res. 14:5531–5539. 2008. View Article : Google Scholar : PubMed/NCBI
|
|
31
|
Verine J, Lehmann-Che J, Soliman H,
Feugeas JP, Vidal JS, Mongiat-Artus P, Belhadj S, Philippe J,
Lesage M, Wittmer E, et al: Determination of angptl4 mRNA as a
diagnostic marker of primary and metastatic clear cell renal-cell
carcinoma. PLoS One. 5:e104212010. View Article : Google Scholar : PubMed/NCBI
|
|
32
|
Galaup A, Cazes A, Le Jan S, Philippe J,
Connault E, Le Coz E, Mekid H, Mir LM, Opolon P, Corvol P, et al:
Angiopoietin-like 4 prevents metastasis through inhibition of
vascular permeability and tumor cell motility and invasiveness.
Proc Natl Acad Sci USA. 103:18721–18726. 2006. View Article : Google Scholar : PubMed/NCBI
|
|
33
|
Dong D, Jia L, Zhou Y, Ren L, Li J and
Zhang J: Serum level of ANGPTL4 as a potential biomarker in renal
cell carcinoma. Urol Oncol. 35:279–285. 2017. View Article : Google Scholar : PubMed/NCBI
|
|
34
|
Xin M, Gu L, Li H, Gao Y, Li X, Shen D,
Gong H, Li S, Niu S, Zhang Y, et al: Hypoxia-induced overexpression
of stannio-calcin-1 is associated with the metastasis of early
stage clear cell renal cell carcinoma. J Transl Med. 13:562015.
View Article : Google Scholar
|
|
35
|
Meyer HA, Tölle A, Jung M, Fritzsche FR,
Haendler B, Kristiansen I, Gaspert A, Johannsen M, Jung K and
Kristiansen G: Identification of stanniocalcin 2 as prognostic
marker in renal cell carcinoma. Eur Urol. 55:669–678. 2009.
View Article : Google Scholar
|
|
36
|
Girgis AH, Iakovlev VV, Beheshti B, Bayani
J, Squire JA, Bui A, Mankaruos M, Youssef Y, Khalil B, Khella H, et
al: Multilevel whole-genome analysis reveals candidate biomarkers
in clear cell renal cell carcinoma. Cancer Res. 72:5273–5284. 2012.
View Article : Google Scholar : PubMed/NCBI
|
|
37
|
Knaup KX, Monti J, Hackenbeck T,
Jobst-Schwan T, Klanke B, Schietke RE, Wacker I, Behrens J, Amann
K, Eckardt KU, et al: Hypoxia regulates the sperm associated
antigen 4 (SPAG4) via HIF, which is expressed in renal clear cell
carcinoma and promotes migration and invasion in vitro. Mol
Carcinog. 53:970–978. 2014.
|
|
38
|
Kennedy C, Sebire K, de Kretser DM and
O’Bryan MK: Human sperm associated antigen 4 (SPAG4) is a potential
cancer marker. Cell Tissue Res. 315:279–283. 2004. View Article : Google Scholar
|
|
39
|
Shiraishi T, Terada N, Zeng Y, Mooney S,
Takahashi S, Takaha N, Miki T, Getzenberg R and Kulkarni P: 433
sperm associated antigen 4 is a novel biomarker for renal cell
carcinoma. J Urol. 187:e177-e1782012. View Article : Google Scholar
|
|
40
|
Shoji K, Murayama T, Mimura I, Wada T,
Kume H, Goto A, Ohse T, Tanaka T, Inagi R, van der Hoorn FA, et al:
Sperm-associated antigen 4, a novel hypoxia-inducible factor 1
target, regulates cytokinesis, and its expression correlates with
the prognosis of renal cell carcinoma. Am J Pathol. 182:2191–2203.
2013. View Article : Google Scholar : PubMed/NCBI
|
|
41
|
Jin HA, Heo JH, Kang YH, Kim KH, Han KS
and Hong SJ: Abstract B18: CXCL10 suppresses tumor angiogenesis and
impedes expression of critical angiogenic factors in renal cell
carcinoma. Cancer Res. 76:B182016. View Article : Google Scholar
|
|
42
|
Liu W, Liu Y, Qiang F, Zhou L, Chang Y, Xu
L, Zhang W and Xu Ji: Elevated expression of IFN-inducible CXCR3
ligands predicts poor prognosis in patients with non-metastatic
clear-cell renal cell carcinoma. Oncotarget. 7:139762016.PubMed/NCBI
|
|
43
|
Ruf M, Moch H and Schraml P: Interaction
of tumor cells with infiltrating lymphocytes via CD70 and CD27 in
clear cell renal cell carcinoma. Oncoimmunology. 4:e10498052015.
View Article : Google Scholar : PubMed/NCBI
|
|
44
|
Ruf M, Mittmann C, Nowicka AM, Hartmann A,
Hermanns T, Poyet C, van den Broek M, Sulser T, Moch H and Schraml
P: pVHL/HIF-regulated CD70 expression is associated with
infiltration of CD27+ lymphocytes and increased serum
levels of soluble CD27 in clear cell renal cell carcinoma. Clin
Cancer Res. 21:889–898. 2015. View Article : Google Scholar : PubMed/NCBI
|
|
45
|
Chen F, Bai J, Li W, Mei P, Liu H, Li L,
Pan Z, Wu Y and Zheng J: RUNX3 suppresses migration, invasion and
angiogenesis of human renal cell carcinoma. PLoS One. 8:e562412013.
View Article : Google Scholar : PubMed/NCBI
|
|
46
|
Wang G, Qin W, Zheng J, Wei M, Zhou X,
Wang H and Wen W: Expressions of EZH2 and RUNX3 in renal cell
carcinoma and their clinical significance. Xi Bao Yu Fen Zi Mian Yi
Xue Za Zhi. 29:82–84. 2013.In Chinese.
|
|
47
|
Parmar KM, Singla M, Mandal AK,
Bhattacharya S and Singh SK: The expression of RUNX3 gene in renal
cell cancer and its clinical relevance with serum vascular
endothelial growth factor. Int J Mol Immunooncol. 2:732017.
View Article : Google Scholar
|
|
48
|
Chen F, Liu X, Cheng Q, Zhu S, Bai J and
Zheng J: RUNX3 regulates renal cell carcinoma metastasis via
targeting miR-6780a5p/E-cadherin/EMT signaling axis. Oncotarget.
8:101042–101056. 2016.
|
|
49
|
Zhao He, Wang XL, Zhang H, Guo P, Huang C,
Liu C, Yao X, Chen F, Lou YW, et al: RUNX3 mediates suppression of
tumor growth and metastasis of human CCRCC by regulating cyclin
related proteins and TIMP-1. PLoS One. 7:e329612012. View Article : Google Scholar : PubMed/NCBI
|
|
50
|
Bhuvarahamurthy V, Kristiansen GO,
Johannsen M, Loening SA, Schnorr D, Jung K and Staack A: In situ
gene expression and localization of metalloproteinases MMP1, MMP2,
MMP3, MMP9, and their inhibitors TIMP1 and TIMP2 in human renal
cell carcinoma. Oncol Rep. 15:1379–1384. 2006.PubMed/NCBI
|
|
51
|
Cho NH, Shim HS, Rha SY, Kang SH, Hong SH,
Choi YD, Hong SJ and Cho SH: Increased expression of matrix
metallo-proteinase 9 correlates with poor prognostic variables in
renal cell carcinoma. Eur Urol. 44:560–566. 2003. View Article : Google Scholar : PubMed/NCBI
|
|
52
|
Sato A, Nagase H, Obinata D, Fujiwara K,
Fukuda N, Soma M, Yamaguchi K, Kawata N and Takahashi S: Inhibition
of MMP-9 using a pyrrole-imidazole polyamide reduces cell invasion
in renal cell carcinoma. Int J Oncol. 43:1441–1446. 2013.
View Article : Google Scholar : PubMed/NCBI
|
|
53
|
Huang QB, Ma X, Li HZ, Ai Q, Liu SW, Zhang
Y, Gao Y, Fan Y, Ni D, Wang BJ and Zhang X: Endothelial Delta-like
4 (DLL4) promotes renal cell carcinoma hematogenous metastasis.
Oncotarget. 5:3066–3075. 2014. View Article : Google Scholar : PubMed/NCBI
|
|
54
|
Struckmann K, Mertz K, Steu S, Storz M,
Staller P, Krek W, Schraml P and Moch H: pVHL co-ordinately
regulates CXCR4/CXCL12 and MMP2/MMP9 expression in human clear-cell
renal cell carcinoma. J Pathol. 214:464–471. 2008. View Article : Google Scholar : PubMed/NCBI
|
|
55
|
Yuan L, Zeng G, Chen L, Wang G and Wang X,
Cao X, Lu M, Liu X, Qian G, Xiao Y and Wang X: Identification of
key genes and pathways in human clear cell renal cell carcinoma
(ccRCC) by co-expression analysis. Int J Biol Sci. 14:266–279.
2018. View Article : Google Scholar : PubMed/NCBI
|
|
56
|
Feng JY, Diao XW, Fan MQ, Wang PX, Xiao Y,
Zhong X, Wu RH and Huang CB: Screening of feature genes of the
renal cell carcinoma with DNA microarray. Eur Rev Med Pharmacol
Sci. 17:2994–3001. 2013.PubMed/NCBI
|