Introduction
Liver fibrosis is a prolonged injury that occurs in
combination with superfluous scar deposition inside the hepatic
parenchyma, which is caused by an excessive wound healing response
triggered by activated myofibroblasts (1). Reacting to liver damage requires a
recovery process, however, chronic and severe injuries enhance the
collection of fibrous matrix, damaging the liver architecture and
affecting normal functions (2).
Experimental and clinical evidence suggests that hepatic fibrosis
is reversible via removal of the etiological agent (3,4).
Hepatic stellate cells (HSCs), namely liver pericytes which reserve
retinoids, are pivotal for the presence of myofibroblasts in
hepatotoxic liver fibrosis (4). A
previous study demonstrated that activating HSCs into a
myofibroblast-like phenotype is triggered by a number of chronic
injuries to the liver, including toxins, viral hepatitis,
autoimmune disorders and nonalcoholic steatohepatitis (5). This activation process is often
mediated by two cytokines, platelet-derived growth factor and
transforming growth factor (TGF)-β1, resulting in the elevated
expression of contractile filaments, including extracellular matrix
(ECM) proteins (collagen I) and α-smooth muscle actin (α-SMA)
(6). During the regression
process of liver fibrosis, the number of activated HSCs declines
substantially by returning to a quiescent state or undergoing
cellular apoptosis and senescence (7,8).
HSCs are generally quiescent in the normal healthy liver but are
activated during liver injury and are further transformed into
contractile myofibroblasts (9,10).
In a previous study, it was observed that human HSCs express
Galectin-1, which contributes to HSC-induced immunomodulatory
functions (11).
As a multivalent carbohydrate binding protein,
Galectin-1 mediates malignant cellular activities by regulating the
cross-linking of glycoproteins in the tumor microenvironment
(12). Galectin-1 is associated
with multivalent mechanisms that accumulate cell surface
glycoproteins (13,14), form lattices and larger aggregates
(15), and cross-link receptors
(16). Tumor vascularization is
reported to be closely correlated with elevated levels of
Galectin-1 in the endothelium (14,17). Galectin-1 can directly mediate
invasion and migration by competitively combining with receptors
associated with cell-ECM interactions, allowing cancer cells to
detach from their primary site (18,19). Generated by the activated HSCs,
Galectin-1 promotes the migration of HSCs and the proliferation of
HSCs through involvement in the β-galactoside binding process and
through inducing various intracellular signaling pathways (20). The findings of a previous study
indicated that Galectin-1 may serve as a potential target for the
treatment of pulmonary fibrotic disease (21). However, the role of Galectin-1 in
the activation, proliferation and apoptosis of HSCs in liver
fibrosis models remains to be fully elucidated. Therefore, the
present study investigated how Galectin-1 influences the
activation, proliferation and apoptosis of HSCs in a mouse model of
liver fibrosis.
Materials and methods
Ethics statement
The present study was performed in strict accordance
with the recommendations of the Guide for the Care and Use of
Laboratory Animals of the National Institutes of Health. The
protocol was approved by the Institutional Animal Care and Use
Committee of the First Affiliated Hospital, Zhejiang University
School of Medicine (Zhejiang, China). Significant efforts were made
to minimize the number of animals used and their respective
suffering.
Liver fibrosis model establishment
A total of 32 male C57BL/6J mice (age: 8 weeks;
weight: 25-30 g) were purchased from Laboratory Animal Center of
Zhejiang University (Zhejiang, China). The mice were housed at 22°C
and 55% humidity, and had normal circadian rhythm light exposure
and free access to water and food. A total of 22 mice were selected
for liver fibrosis model establishment using the following method:
20 ml of carbon tetrachloride (CCl4) liquid was mixed
with 30 ml of olive oil, which was stirred with a magnetic stirrer
for 8-12 h to prepare a 40% CCl4 olive oil suspension.
The liver fibrosis model was established via an intraperitoneal
injection of the 40% CCl4 olive oil suspension (2; 0.8
ml/kg CCl4) twice per week. None of the animals died
during the model establishment process. The model establishment
lasted for 6 weeks, following which time the mice were sacrificed,
and their livers were removed. The edge of liver became blunt
according to the observation by naked eyes. The liver presented
with a white color and greasy surface. Liver tissues of mice in
each group were fixed in formaldehyde (cat. no. 30525-89-4;
Shanghai Aladdin Bio-Chem Technology Co., Ltd., Shanghai, China)
for 6 h at room temperature, paraffin-embedded, and sliced into
5-µm sections. Subsequently, the pathological changes of the
sections were observed using the hematoxylin and eosin (H&E)
and Masson staining as detailed below, which indicated a small
amount of fiber formation, indicating the formation of early liver
fibrosis and successful model establishment. Subsequently, the mice
were assigned to the normal group (normal mice) or the model group
(liver fibrosis model mice).
Enzyme-linked immunosorbent assay
(ELISA)
The mice selected from the two groups were
anaesthetized intraperitoneally with 2% sodium pentobarbital (cat.
no. WS20051129; Sinopharm Group Chemical Reagent Co., Ltd.,
Shanghai, China), and 0.5 ml of blood was collected from the
abdominal aorta via a tube. The blood was incubated at room
temperature for 30 min and was then centrifuged (2,192 × g) for 15
min at room temperature to separate the serum. The serum levels of
alanine aminotransferase (ALT), aspartate aminotransferase (AST),
total bilirubin (TBil) and albumin (ALB) were measured using an ALT
ELISA kit (cat. no. YS01266B, Y-J Biological Company, Shanghai,
China), an AST ELISA kit (cat. no. SBJ-M0078; Nanjing SenBeiJia
Biological Technology Co., Ltd., Jiangsu, China), a TBil ELISA kit
(cat. no. YS05110B; Shanghai Caiyou Industrial Co., Ltd., Shanghai,
China) and an ALB ELISA kit (cat. no. ab108792; Abcam, Cambridge,
MA, USA), respectively. The ELISA kits were placed at the room
temperature for 20 min, and the washing liquid was prepared.
Following dissolving of the standard samples, 100 µl of each
sample was added to the reaction plate to produce the standard
curve. Following this, 100 µl of each test sample was added
to the wells, and the plate was incubated at 37°C for 90 min and
then washed five times with ELISA cleaning solution at 30-sec
intervals. Following washing, 100 µl of the readymade
biotinylated antibody working solution was added, and the mixture
was incubated at 37°C for 30 min in the dark. The plate was washed
five times, and the stop solution was immediately added to
terminate the reaction. The optical density (OD) value was detected
at a wavelength of 450 nm using a microplate reader (BioTek Synergy
2; BioTek Instruments, Inc., Winooski, VT, USA) within 3 min, and
the standard curve was drawn according to the OD value. The serum
levels of ALT, AST, TBil and ALB were measured in each group.
H&E staining
The mice were sacrificed in the 6th week following
model establishment, and their hepatic tissues were removed, fixed
with 4% formaldehyde (cat. no. 30525-89-4; Shanghai Aladdin
Biochemical Technology Co., Ltd., Shanghai, China) for 6 h, soaked
in wax, embedded, and cut into sections (5-µm).
Subsequently, the sections were heated at 60°C overnight, dewaxed
in Xylene I (cat. no. 14936-97-1, Shanghai Institute of Bioscience
and Technology Co., Ltd., Shanghai, China) and Xylene II (Shanghai
Yuduo Biological Technology Co., Ltd., Shanghai, China), treated
with gradient alcohol (100, 95, 80 and 70%) for 5 min, and placed
in distilled water. The sections were stained with hematoxylin
(cat. no. 474-07-7; Qingdao Jie Shi Kang Biotechnology Co., Ltd.,
Qingdao, China) for 10 min, flushed with tap water and stained blue
for 15 min. The sections were then stained with eosin (cat. no.
RY0648; Qingdao Jie Shi Kang Biotechnology Co., Ltd.) for 30 sec,
washed with double-distilled water to remove the red staining,
degraded by alcohol, cleaned with xylene and, finally, sealed with
neutral balsam. The H&E staining was performed for
histopathological examination, and images of the samples were
captured. Using the morphological image analysis system (JD801;
Jetta Technology Development Co., Ltd., Nanjing, China), sections
from the different groups were selected at ×200 magnification, and
the structure of the hepatic lobules, infiltration of inflammatory
cells, and necrosis of the hepatocytes in the mouse liver sample
sections were observed by H&E staining. The images were
collected, and the experiment was repeated three times.
Masson staining
The mouse liver tissues selected from each group
were fixed with 4% paraformaldehyde (cat. no. 30525-89-4; Shanghai
Aladdin Biochemical Technology Co., Ltd.), conventionally
dehydrated, cleaned, soaked in wax, embedded, sectioned (thickness,
5 µm), stained with picrosirius red, and restained with
hematoxylin (cat. no. PT003; Shanghai Bogoo Biotechnology. Co.,
Ltd., Shanghai, China). Images of the sections were captured using
a polarizing microscope (XPT-480; Shanghai Zhongheng Biotechnology
Co., Ltd., Shanghai, China), and the images were analyzed with
Image-Pro Plus 5.1 image analysis software (Media Cybernetics, Inc,
Bethesda, MD, USA) to assess lobular hyperplasia in the liver. A
total of five fields (magnification, ×200 in each section were
selected randomly, and the percentage of collagen fibers (collagen
index) was determined. The calculation method was as follows:
Collagen fiber area/liver tissue area ×100%. The mean value was
recorded as the result.
Immunohistochemistry
The paraffin tissue sections were routinely dewaxed
and dehydrated with gradient alcohol. Subsequently, 0.02 mol/l
citrate buffer (pH 6.0) was used for antigen retrieval for 15 min.
The sections were then washed with phosphate-buffered saline (PBS)
three times (5 min/wash), sealed with 3% peroxidase for 10 min,
washed again with PBS three times (5 min/wash), and sealed with 10%
goat serum (cat. no. C-0005; Shanghai Haoran Biotechnology Co.,
Ltd., Shanghai, China) for 30 min. The rabbit anti-α-SMA primary
antibody (cat. no. ab32575; 1:200) and rabbit anti-Desmin primary
antibody (cat. no. ab32362, 1:2,000) (both from Abcam) were then
added, and the samples were incubated overnight at 4°C. Following
three PBS washes (5 min/wash), the sections were incubated with the
goat anti-rabbit secondary antibody (cat. no. ab205718, 1:2,000;
Abcam) for 1 h at room temperature in the dark, rinsed three times
with PBS (5 min/wash), treated with diluted
4′,6-diamidino-2-phenylindole (1:100), incubated at room
temperature for 20-30 min in the dark, washed with PBS three times
(5 min/wash) and sealed with 60% glycerol. The samples were
observed under a fluorescence microscope (GFM: 600; Shanghai
Optical Instrument Co., Ltd., Shanghai, China), and cells with a
visible yellow-stained cytoplasm or cell membrane were considered
positive. A total of four fields in each section were randomly
selected (magnification, ×200), with 200 cells per field. The
percentage of positive cells=positive liver cells/total liver
cells. When the percentage was >10%, it was regarded as positive
(+); otherwise, it was negative (−) (22). The experiment was repeated three
times and the mean was obtained.
Reverse transcription-quantitative
polymerase chain reaction (RT-qPCR) analysis
Total RNA from the liver sample tissues was
extracted using the TRIzol one-step method according to the
manufacturer’s protocol of the TRIzol kit (Invitrogen; Thermo
Fisher Scientific, Inc., Waltham, MA, USA). The RNA was dissolved
in ultrapure water treated with diethyl-pyrocarbonate (Shanghai
Sangon Biological Engineering Technology & Services Co., Ltd.,
Shanghai, China), and the absorbance was measured using an ND-1000
ultraviolet/visible spectrophotometer (Thermo Fisher Scientific
Inc.) at wavelengths of 260 and 280 nm. The quality and
concentration of the total RNA were determined. The extracted RNA
was used for RT by the two-step method according to the
manufacturer’s protocol of the kit (cat. no. RR037Q; Takara
Biotechnology Co., Ltd., Dalian, Liaoning, China). The RT reaction
was as follows: 2 µl of 5X PrimeScript Buffer (for
Real-Time), 0.5 µl of PrimeScript RT Enzyme mix I, 0.5
µl of oligo dT primer (50 µM), 0.5 µl of
random 6-mers (100 µM); 2 µg of total RNA; and
RNase-free dH2O, reaching a total volume of 20
µl. The reaction conditions were as follows: 37°C for 15
min, 85°C for 5 sec, and a 4°C hold. Following RT, the cDNA was
temporarily stored at −80°C. The qPCR analysis was performed using
the TaqMan probe method according to the manufacturer’s protocol of
the kit (MBI Fermentas; Thermo Fisher Scientific, Inc.), and the
primer sequences are shown in Table
I. The reaction conditions were as follows: Predenaturation at
95°C for 30 sec, followed by 40 cycles of denaturation at 95°C for
10 sec, annealing at 60°C for 20 sec, and extension at 70°C for 10
sec. The reaction sample was as follows: 12.5 µl of Premix
Ex Taq or SYBR Green Mix, 1 µl of forward primer, 1
µl of reverse primer, 1-4 µl of cDNA and
ddH2O, bringing the volume to 25 µl. Real-time
fluorescence qPCR (Bio-Rad iQ5; Bio-Rad Laboratories, Inc.,
Hercules, CA, USA) was used to detect mRNA expression, with β-actin
serving as the internal reference. The solubility curve was used to
evaluate the reliability of the PCR results using the Cq (inflexion
point of amplification dynamic curve) values obtained. The formula
was as follows: ∆Cq=Cq (target gene)-Cq (internal reference),
∆∆Cq=∆Cq(experiment group)-∆Cq(model group).
The relative quantitative method was used for the calculation, and
2−ΔCq was adapted for the relative expression
of the target genes (23). Each
experiment was repeated three times, and the mean was obtained.
This method was also used for subsequent cell experiments.
 | Table IReverse transcription-quantitative
polymerase chain reaction primer sequences. |
Table I
Reverse transcription-quantitative
polymerase chain reaction primer sequences.
| Gene | Sequence
(5′-3′) |
|---|
| Galectin-1 | F:
GCCAGCAACCTGAATCTC |
| R:
AGGCCACGCACTTAATCT |
| TGF-β1 | F:
CAACAATTCCTGGCGTTACCTTGG |
| R:
GAAAGCCCTGTATTCCGTCTCCTT |
| CTGF | F:
CTCCACCCGAGTTACCAATGACAA |
| R:
CCAGAAAGCTCAAACTTGACAGGC |
| α-SMA | F:
ACTGGGACGACATGGAAAAG |
| R:
CATCTCCAGAGTCCAGCACA |
| PCNA | F:
AACTTGGAATCCCAGAACA |
| R:
AGACAGTGGAGTGGCTTTT |
| Bcl-2 | F:
GACAGAAGATCATGCCGTCC |
| R:
GGTACCAATGGCACTTCAAG |
| Caspase-3 | F:
CTAAGCCATGGTGATGAAGGG |
| R:
CTGCAAAGGGACTGGATGAAC |
| β-actin | F:
GCTGTCCCTGTATGCCTCT |
| R:
GGTCTTTACGGATGTCAACG |
Western blot analysis
Proteins from liver sample tissues from the groups
were extracted using 3 ml of lysis buffer comprising well-mixed
solution containing 7 mol/l urea, 2 mol/l thiourea, 5 ml/l
isocratic pH gradient buffer (pH 3-10), 65 mmol/l dithiothreitol,
40 g/l 3-[(3-cholamidopropyl) dimethylammonio]-1-propanesulfonate,
5 mg/l protease inhibitor and 10 ml/l trypsin inhibitor, and
homogenized on ice. The samples were then centrifuged (120,000 g)
for 30 min at 4°C to obtain the liquid supernatant, and the protein
concentration was measured using the BCA method. The proteins were
then mixed with 5X sodium dodecyl sulfate (cat. no. P0013G,
Beyotime Institute of Biotechnology, Shanghai, China) at 100°C for
5 min to inactivate the protein. Subsequently, 20 µl of the
loading buffer was obtained for performing electrophoresis on a
polyacrylamide gel (5% concentrated gel and 12% separation gel).
Following transferring of the proteins onto a membrane, the
membrane was blocked with Tris-buffered saline tween (TBST)
containing 5% bovine serum albumin (BSA; Sigma-Aldrich; Merck KGaA,
Darmstadt, Germany) by incubating at room temperature for 1 h.
Following removal of the blocking solution, the membrane was
incubated with the primary antibody at the appropriate
concentration, prepared in 5% BSA. The antibodies were as follows:
Rabbit anti-Galectin-1 (cat. no. ab25138, 1:5,000), rabbit
anti-TGF-β1 (cat. no. ab179695, 1:1,000), rabbit anti-connective
tissue growth factor (CTGF; cat. no. ab6992, 1:1,000), rabbit
anti-α-SMA (cat. no. ab5694, 1:1,000), rabbit anti-α-SMA (cat. no.
ab5694, 1:1,000), rabbit anti-proliferating cell nuclear antigen
(PCNA; cat. no. ab18197, 1:1,000), rabbit anti-B-cell lymphoma-2
(Bcl-2; cat. no. ab27795, 1:1,000), rabbit anti-caspase-3 (cat. no.
ab44976, 1:1,000), rabbit anti-active-caspase-3 (cat. no. ab49822,
1:1,000) and rabbit anti-glyceraldehyde-3-phosphate dehydrogenase
(GAPDH; cat. no. ab181602, 1:10,000). All primary antibodies listed
above were purchased from Abcam. The membrane surface was placed
upright in a refrigerator at 4°C overnight. The following day, the
membrane was washed with TBST three times (10 min/wash), following
which the diluted goat anti-rabbit secondary antibody (cat. no.
ab6721, 1:2,000, Abcam) was added at 4°C and incubated for 4-6 h,
and the membrane was washed with TBST three times (15 min/wash).
The chemiluminescent reagents, liquid A and liquid B (Yanhui
Biology Co., Ltd., Shanghai, China), were mixed at a concentration
of 1:1, and the mixture was then evenly dropped onto the
nitrocellulose membrane to develop the samples. All bands were
analyzed to obtain the relative OD. Each experiment was repeated
three times, and the mean was obtained. This method was used for
subsequent cell experiments.
Isolation and culturing of HSCs
The mice in the normal and model groups were
randomly selected for isolating the HSCs (24). The HSCs were isolated using a
collagenase IV in situ liver recirculating perfusion and
centrifuged by Nycodenz density gradient centrifugation (376 × g)
for 17 min at room temperature. Following centrifugation, the cells
on the interface were selected for isolating the mouse HSCs
(mHSCs). The cells were resuspended in Dulbecco’s modified Eagle’s
medium (DMEM; cat. no. 12800017; Nanjing Ampere Chemical Technology
Co., Ltd., Nanjing, China) supplemented with 15% fetal bovine serum
(FBS; cat. no. 16000-044; Beijing Jie Hui Bo Gao Biotechnology Co.,
Ltd., Beijing, China), and the cell concentration was adjusted to
1×10⁹ cells/l. The cells were seeded in a noncoated
96-well plate, 24-well plate and 6-well plate at a concentration of
1×10⁸ cells/l. In addition, a small quantity of cells
was set aside for purity and viability identification. The cells
were incubated in a 5% CO2 incubator at a constant
temperature of 37°C for 24 h. The culture medium was then replaced,
the cells were further incubated, and the nonadhered cells were
removed. The purity of the mHSCs was identified using an
immunofluorescence assay. Cell viability was identified using
trypan blue staining under an inverted microscope (TS100; Olympus
Corporation, Tokyo, Japan), with the unstained cells considered to
be active cells.
Construction of a Galectin-1
overexpression lentivirus vector and a low-expression plasmid
A recombinant vector with a Galectin-1
overexpression plasmid was constructed as follows: Total RNA was
extracted using TRIzol and reverse transcribed to obtain the cDNA.
The Galectin-1 target gene was amplified by PCR, and the sequences
of the amplified primers were as follows: Forward, 5′-CTC GCT CGA
GGT CTT CTG ACT GCT GGT GG-3′ and reverse, 5′-AGA GCG ATC CGC CTT
TAT TGA GGG CTA CA-3′. Then, a total of 50 µl PCR system was
prepared using PrimeSTAR® GXL Premix (cat. no. R051A,
Takara Biotechnology Co., Ltd.), which consisted of 25 µl
PrimeSTAR GXL Premix (2X), 1 µl forward primer (20
µM), 1 µl reverse primer (20 µM), 1 µl
cDNA template, and RNase Free dH2O up to 50 µl.
Reaction conditions were set as follows: Denaturation at 98°C for
10 sec, annealing at 60°C for 15 sec and extension at 68°C for 90
sec for a total of 30 cycles. The enzyme-detached product obtained
from BamHI and EcoRI was incubated with T4
buffer and T4 DNA ligase with gentle mixing at 4°C
overnight. Following selection of the monoclonal antibody, the
products were transferred into competent DH5α cells (Takara
Biotechnology Co., Ltd., Dalian, China). Following positive clone
examination by bacterial fluid PCR, the plasmid was identified by
enzyme detachment and sequenced. The Galectin-1 overexpression
plasmid generated, and the empty plasmid were cotransfected into
293T cells (Institute of Biochemistry and Cell Biology, Shanghai
Institutes for Biological Sciences, Chinese Academy of Sciences,
Shanghai, China), which were then grouped into two groups, the
overexpressed group (transfection with the Galectin-1
overexpression plasmid) and the control group (transfection with
the empty plasmid). Following transfection for 48 h, the mRNA and
protein expression levels of Galectin-1 were detected by RT-qPCR
and western blot analyses, respectively.
The recombinant vector containing the Galectin-1
low-expression plasmid was constructed as follows: Using Galectin-1
as the target, the sequences for the short hairpin (sh)RNAs
(shRNA1, shRNA2, and shRNA3) and the negative control (NC) plasmids
were designed as follows: shRNA1, 5′-CTA TGA CGA TCC CTT CGT GCA
CTC-3′; shRNA2, 5′-CGG ACC TGT GCT ACA CTT CAA CTC-3′; shRNA3,
5′-AGA CGG ACA TGA ATT CAA GTT CTC-3′ and NC, 5′-AAG GTT AAG TCG
CCC TCG CTC-3′. The shRNA sequences and the NC sequences were
synthesized by Shanghai Sangon Biological Engineering Technology
& Services Co., Ltd. The shRNA and NC sequences were inserted
into the pLVTHM plasmid and detached by BamHI and
EcoRI using T4 DNA ligase. The products were
transformed into competent DH5α cells and transfected into 293T
cells. The transfection experiments were allocated into four groups
as follows: sh-NC (transfection with the NC plasmid sequence),
shRNA 1 (transfection with the shRNA 1 sequence), shRNA 2 group
(transfection with the shRNA 2 sequence), and shRNA3 group
(transfection with the shRNA 3 sequence). Following transfection
for 48 h, the shRNA that exhibited the optimal interference by gene
expression was selected for the RT-qPCR and western blot
assays.
The Galectin-1 overexpression vector and the shRNA
with the optimal interference were used to construct lentiviral
vectors overexpressing Galectin-1 and Galectin-1-shRNA; these were
then used for cotransfection with a lentivirus-coated plasmid into
293T cells via the following liposome method: At 12 h prior to
transfection, the 293T cells were plated onto 6-well plates at a
density of 5×10⁵ cells/well in DMEM supplemented with 5%
FBS. Subsequently, 20 µl of Lipofectamine 2000 was added to
500 µl of DMEM without serum and the double-antibody.
Following evenly shaking, 2 µg of the Galectin-1
overexpression vector, 2 µg of the Galectin-1-shRNA3
expression vector and 10 µg of the lentivirus-coated plasmid
were added, thoroughly mixed, and allowed to incubate for 20 min at
room temperature. The mixture was then transferred to the 293T cell
culture plate. After 6 h, the culture medium was replaced. After 72
h, the virus supernatant was collected for viral titer
determination. The 293T cells were seeded in 96-well plates at a
density of 2×10⁸ cells/l with 100 µl of DMEM
medium containing 10% FBS per well overnight at 37°C. When the
examination was performed, eight wells were used per group. The
first well was incubated with 10 µl of the virus solution,
and the remaining wells were incubated with an equal volume of
solution, followed by 10:1 serial dilutions. The final well was
used as a blank control. After 48 h, the number of cells with green
fluorescence was observed under an inverted fluorescence microscope
in the sequence of high to low concentration. If the number of
positive cells in the previous well was greater than five and the
fluorescence disappeared, or if the fluorescence disappeared and
the well had a positive cell number less than five, the well was
set as the measurement well, named 1 IU. The number (m) of positive
cells was measured, and the viral titer was calculated as follows:
Viral titer=mx (1 IUx dilution ratio between the measured well and
the first well)/viral volume added in the first well (25). The isolated mHSCs from the model
mice were infected with the concentrated lentivirus to create mHSC
lines overexpressing and with low expression of Galectin-1.
Cell grouping
The mHSCs were assigned into normal (mHSCs isolated
from healthy mice), model (mHSCs isolated from the mouse model), NC
(empty plasmid-cotransfected mHSCs from the mouse model),
overexpressed Galectin-1 (Galectin-1 overexpression
plasmid-cotransfected mHSCs from the mouse model), sh-Galectin-1
(Galectin-1 low-expression plasmid-cotransfected mHSCs from the
mouse model) and sh-NC (Galectin-1 NC shRNA plasmid-cotransfected
mHSCs from the mouse model) groups.
3-(4,5-dimethylthiazol-2-yl)-2,5-diphenyltetrazolium bromide (MTT)
assay
When the cells were infected for 24 h and the cell
confluence reached 80%, the cells were washed twice with PBS,
detached with 0.25% trypsin and made into a single cell suspension.
Following counting, 3×10³-6×10³ cells were
seeded per well (200 µl) onto 96-well plates with six
duplicate wells. Following an incubation period, 20 µl of 5
mg/mL MTT solution (Sigma-Aldrich; Merck KGaA) was added to each
well. The cells were then incubated for 4 h, the culture medium
discarded, and 150 µl of dimethyl sulfoxide (Sigma-Aldrich;
Merck KGaA) was added to each well; the mixture was gently shaken
for 10 min. The OD of each well was measured at the wavelength of
490 nm by the ELISA instrument (Nanjing Detie Company, Nanjing,
China) at 24, 48 and 72 h. The cell viability curve was plotted
with the time point as the X-axis and the OD value as the
Y-axis.
Flow cytometry
Cell apoptosis was detected by flow cytometry
following 48 h of cell infection in each group. The cells were then
detached with protease solution and observed under an inverted
microscope (TS100; Olympus Corporation, Tokyo, Japan) for cell
changes, namely, shrinking to round. Subsequently, the digestion
solution was discarded and the serum solution was added to
terminate the detachment. The cells were then gently scraped from
the wall in the cell suspension, centrifuged (179 × g) for 5 min at
room temperature and the liquid supernatant was eliminated.
Following two PBS washes, the cells were fixed with precooled 70%
ethanol for 30 min, collected following centrifugation (179 × g)
for 5 min at room temperature and washed with PBS. Subsequently, 1%
iodized ethidium containing RNA enzyme was used to stain the cells
(cat. no. 40711ES10; Yeasen Biotechnology, Shanghai, China) for 30
min, and the cells were washed with PBS twice for PI elimination.
PBS was then used to adjust the volume to 1 ml. The samples were
analyzed on a BD-Aria FACSCalibur flow cytometer (BD Biosciences,
Franklin Lakes, NJ, USA) to detect cell apoptosis, with three
samples in each group. Each experiment was repeated three
times.
Scratch test
Horizontal lines were drawn behind a 6-well plate
with a marker at a distance interval of 0.5-1 cm. Following this,
3×10⁴ cells were seeded onto the 6-well plate and
cultured overnight. When the cell confluence reached 80-90% the
following day, scratches perpendicular to the horizontal scratches
were made using a spearhead. Following 48 h of continuous culture,
a field containing eight scratches was then randomly selected, and
the cell motility conditions close to the scratches were observed
and images captured. Motic Images Advanced 3.2 software was used to
detect the relative width of the scratches, reflecting the cell
migration ability. Each experiment was repeated at least three
times.
Rhodamine 123 staining
Following 48 h of infection in each group, Rhodamine
123 was added to a final concentration of 10 µg/ml.
Following incubation for 30 min at 37°C in the dark and
centrifugation (179 × g) for 5 min at room temperature, the cells
were washed twice and resuspended in culture medium in the dark.
Following incubating at 37°C for 60 min, the mitochondrial membrane
potential was measured by flow cytometry. The results are expressed
as the mitochondrial mean fluorescence intensity (MFI).
In vivo experiment
A total of 12 mice with hepatic fibrosis were
classified into the sh-NC group or sh-Galectin-1 group. Following 6
weeks of modeling, the mice in the sh-NC group were injected with
sh-NC (0.3 mg per body weight) via their tail vein, and the mice in
the sh-Galectin-1 group were injected with sh-Galectin-1 (0.3 mg
per body weight) via their tail vein. After 3 days, ELISA was
performed to measure the expression levels of ALT, AST, TBi1 and
ALB in the serum of the mice in each group. Following sacrifice of
the mice, the liver tissues were harvested for H&E staining and
Masson staining. In addition, the positive rates of α-SMA and
Desmin protein expression were determined by immunohistochemistry,
and the level of Galectin-1 was assessed using a western blot
assay.
Statistical analysis
All data were analyzed using the SPSS 21.0
statistical analysis software (IBM SPSS, Armonk, NY, USA). The data
are expressed as the mean ± standard deviation. One-way analysis of
variance (ANOVA) was used for comparisons among multiple groups;
the Turkey post hoc test was used following ANOVA to compare two
specific groups among multiple groups. Student’s t-test was used
for comparisons between two groups. P<0.05 was considered to
indicated a statistically significant difference.
Results
Mice with liver fibrosis have elevated
ALT, AST and TBil levels and decreased ALB levels
Initially, the serum levels of ALT, AST, TBil and
ALB in each group were measured by ELISA (Table II). Compared with those in the
normal group, the levels of ALT, AST and Tbil were increased
significantly (P<0.05), whereas the ALB level was significantly
decreased in the model group (P<0.05), indicating severe liver
injury.
| Table IIMice with liver fibrosis have
increased levels of ALT, AST and TBil, and decreased levels of
ALB. |
Table II
Mice with liver fibrosis have
increased levels of ALT, AST and TBil, and decreased levels of
ALB.
| Factor | Normal group | Model group | P-valuea |
|---|
| ALT (U/l) | 47.53±4.02 | 225.43±19.02 | <0.05 |
| AST (U/l) | 60.75±16.14 |
249.89±24.22a | <0.05 |
| TBil
(µmol/l) | 0.63±0.40 | 6.43±0.53a | <0.05 |
| ALB (g/l) | 26.16±2.21 | 17.58±1.62 | <0.05 |
Successful establishment of a mouse model
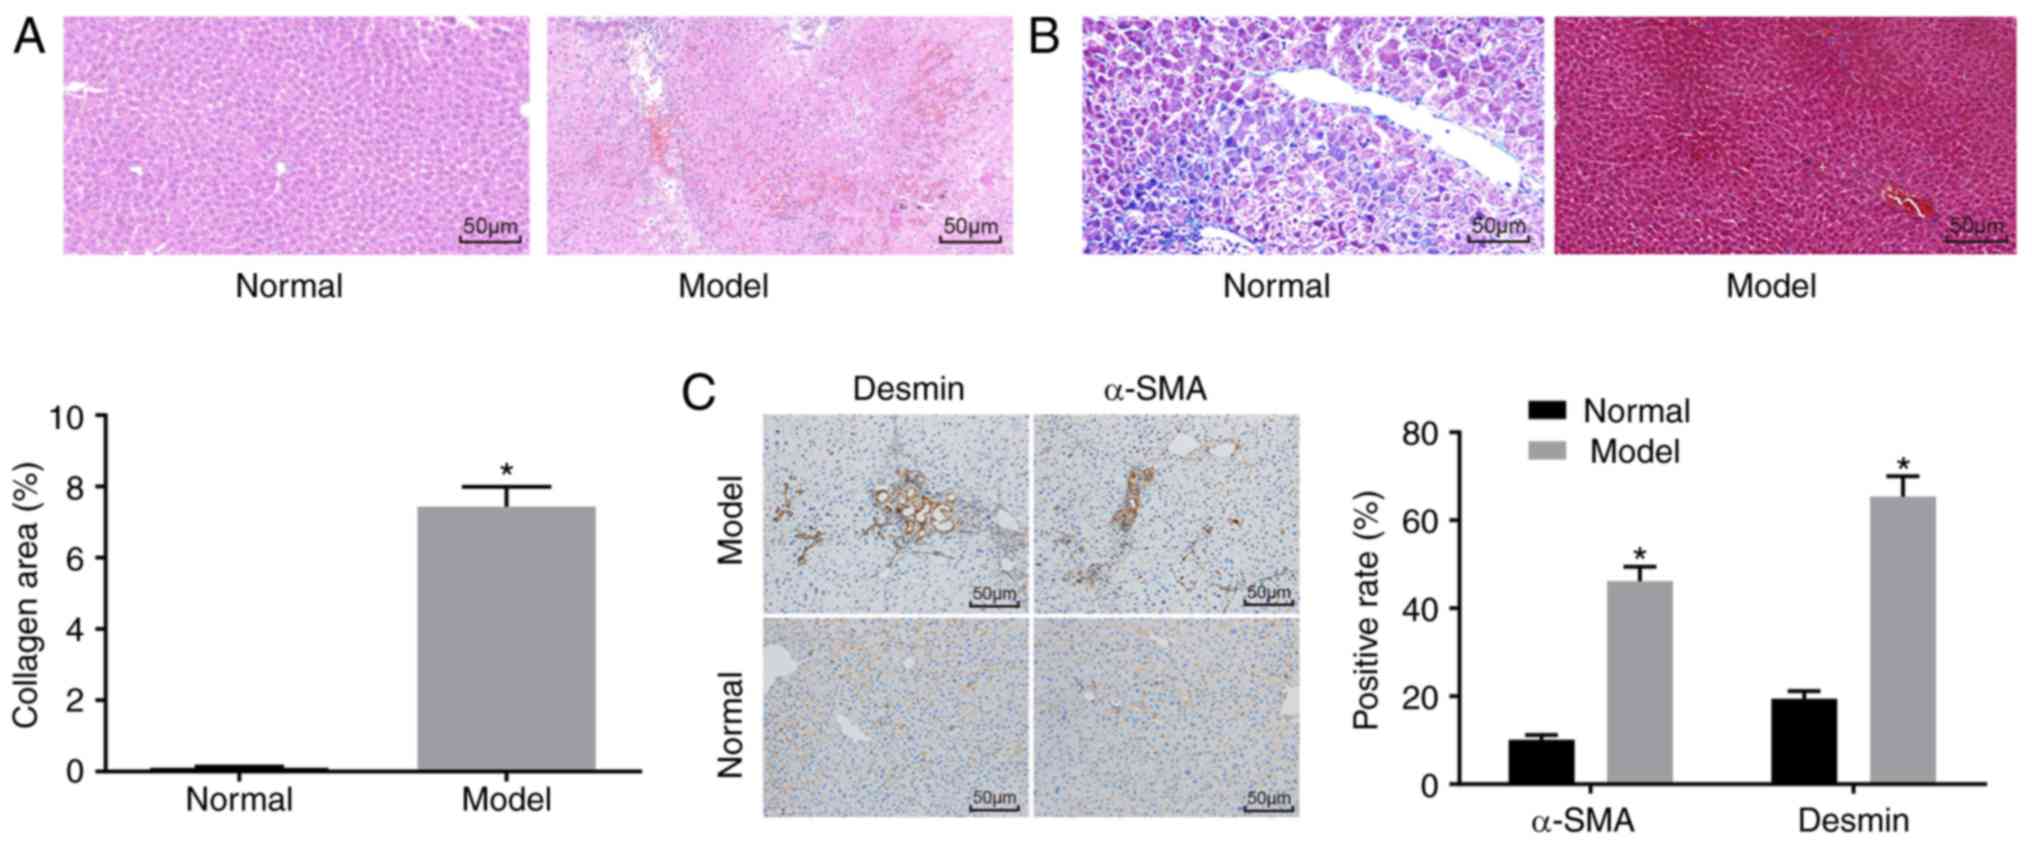
of liver fibrosis
H&E staining (Fig.
1A), Masson staining (Fig.
1B) and immunohistochemistry (Fig. 1C) were used to determine whether
the mouse model was successfully established. The H&E staining
results showed that the mice in the normal group had no obvious
inflammatory cell infiltration, no necrosis, and had a clear liver
lobular structure. In the model group, destruction of liver
lobules, local hyperplasia, and inflammatory cell infiltration were
observed, and necrosis and extravasated blood was present. In
addition, the Masson staining results showed that the mice in the
normal group had normal liver tissue, a low degree of fibrosis, and
liver cells were arranged radially with the central vein at the
centre and no collagen fiber proliferation. By contrast, the mice
in the model group had significantly increased liver fibrosis,
liver lobular destruction, irregular hepatic cords, collagen fiber,
hyperplasia, and an enlarged liver collagen area. The
immunohistochemistry results showed that the cells with positive
expression of α-SMA and Desmin were light yellow. The normal group
had a relatively small number of cells with α-SMA-positive
expression in the artery wall and vein wall in the portal area, and
a relatively small number of cells with Desmin-positive expression
around the hepatic sinusoid, whereas other regions had none of
these features. In the model group, the cells with a positive
expression of α-SMA and Desmin and the fibrosis condition exhibited
the same trend. Compared with that in the normal group, the model
group had an increased number of cells with positive expression of
α-SMA and Desmin (P<0.05).
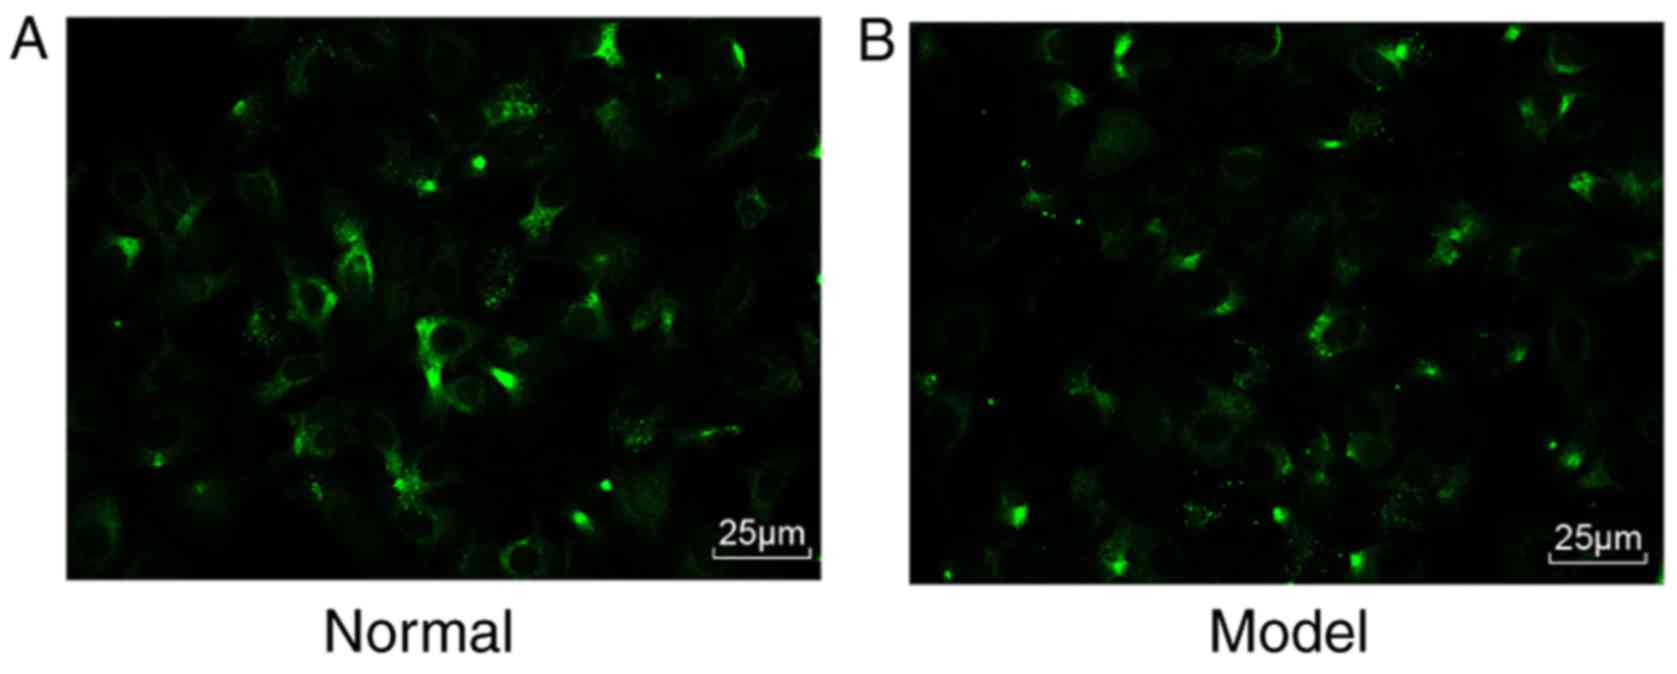
Purity and viability of the mHSCs
Subsequently, the mHSCs were identified. Under a
fluorescence microscope, >90% percent of the cells emitted a
blue-green fluorescence (Fig. 2A and
B). Therefore, the isolated cells were verified as mHSCs, and
the purity and viability of these isolated mHSC were 90 and 95%,
respectively.
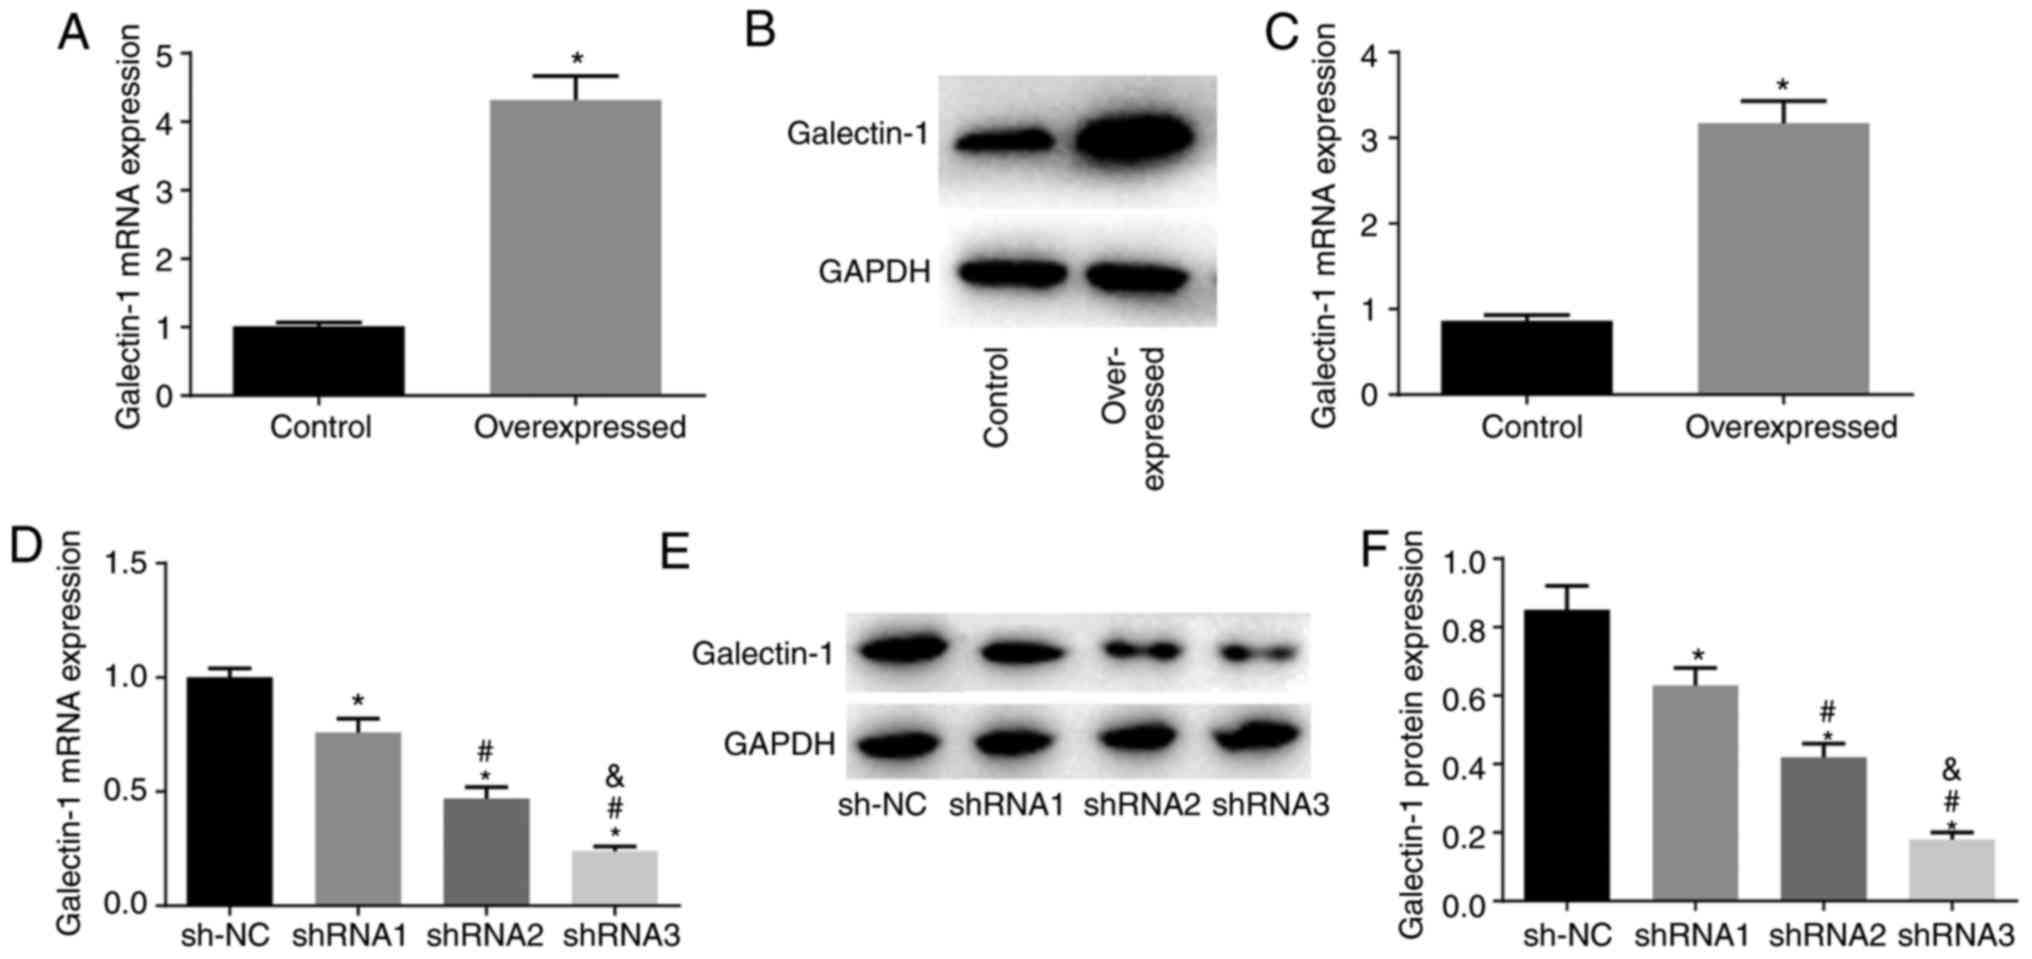
Establishment of mHSC lines stably
transfected with a high or low expression of Galectin-1
Compared with those in the NC group, the
overexpression group had elevated mRNA and protein expression
levels of Galectin-1 (P<0.05), indicating that it was suitable
for use to construct mHSC lines stably expressing the overexpressed
Galectin-1 plasmid (Fig. 3A-C).
Compared with those in the sh-NC group, the shRNA1, shRNA2 and
shRNA3 groups showed decreased mRNA and protein expression of
Galectin-1 (all P<0.05), with the lowest mRNA and protein
expression levels of Galectin-1 in the shRNA3 group. Therefore,
shRNA3 was selected for the establishment of the cell line stably
expressing the Galectin-1 low expression plasmid (Fig. 3D-F).
Cells transfected with sh-Galectin-1 show
decreased expression of Galectin-1, TGF-β1, CTGF and α-SMA in mHSCs
from mice with liver fibrosis
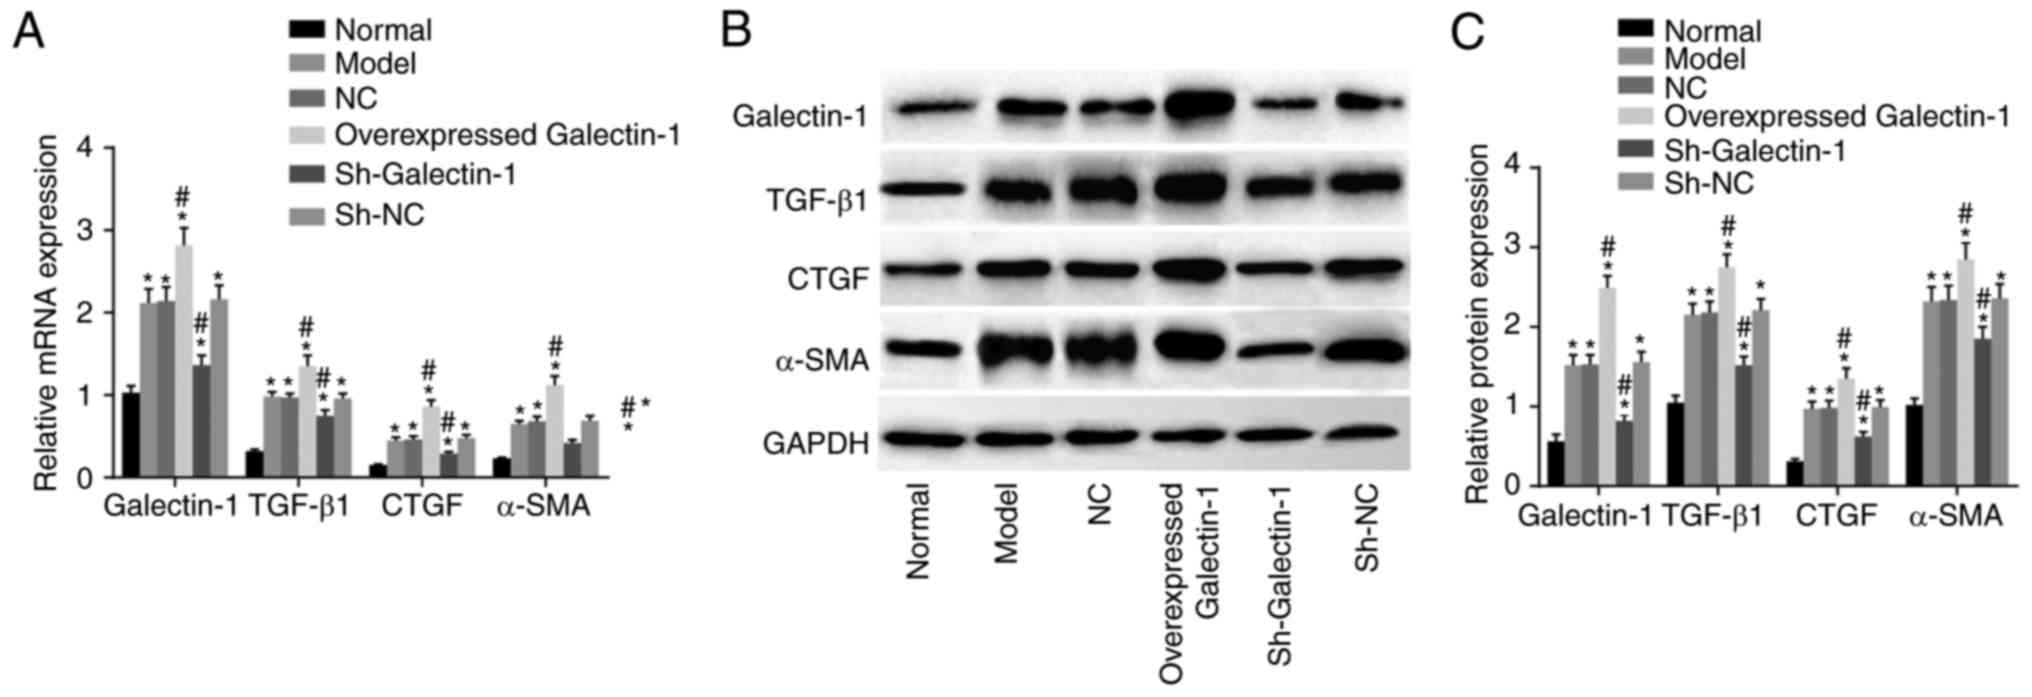
To investigate the effect of Galectin-1 on mHSCs,
RT-qPCR and western blot assays were performed, and the results are
presented in Fig. 4A-C. Compared
with those in the normal group, the expression levels of
Galectin-1, fibrosis process effector cytokines (TGF-β1 and CTGF),
and activated molecule (α-SMA) in the other five groups were
increased (all P<0.05). Compared with those in the model group,
no significant differences were found in the expression levels of
Galectin-1, TGF-β1, CTGF or α-SMA in the NC and sh-NC groups (all
P>0.05). The overexpressed Galectin-1 group had higher
expression levels of Galectin-1, TGF-β1, CTGF and α-SMA (all
P<0.05) compared with those in the model group, whereas the
sh-Galectin-1 group had lower expression levels of Galectin-1,
TGF-β1, CTGF and α-SMA (all P<0.05) compared with the model
group. Taken together, decreased Galectin-1 was a negative factor
for the expression of Galectin-1, TGF-β1, CTGF and α-SMA in the
mHSCs from mice with liver fibrosis.
 | Figure 4Downregulation of Galectin-1 inhibits
expression of Galectin-1, TGF-β1, CTGF and α-SMA in mHSCs. (A)
Reverse transcription-quantitative polymerase chain reaction
analysis confirmed that silencing Galectin-1 downregulated the mRNA
expression levels of Galectin-1, TGF-β1, CTGF and α-SMA in mHSCs.
(B) A western blot assay and (C) quantification confirmed that
silencing Galectin-1 downregulated the protein expression levels of
Galectin-1, TGF-β1, CTGF and α-SMA in mHSCs. *P<0.05
vs. normal group; #P<0.05 vs. model group. mHSCs,
mouse hepatic stellate cells; TGF-β1, transforming growth
factor-β1; CTGF, connective tissue growth factor; α-SMA, α-smooth
muscle actin; GAPDH, glyceraldehyde-3-phosphate dehydrogenase; sh,
short hairpin RNA; NC, negative control. |
Galectin-1 gene silencing suppresses cell
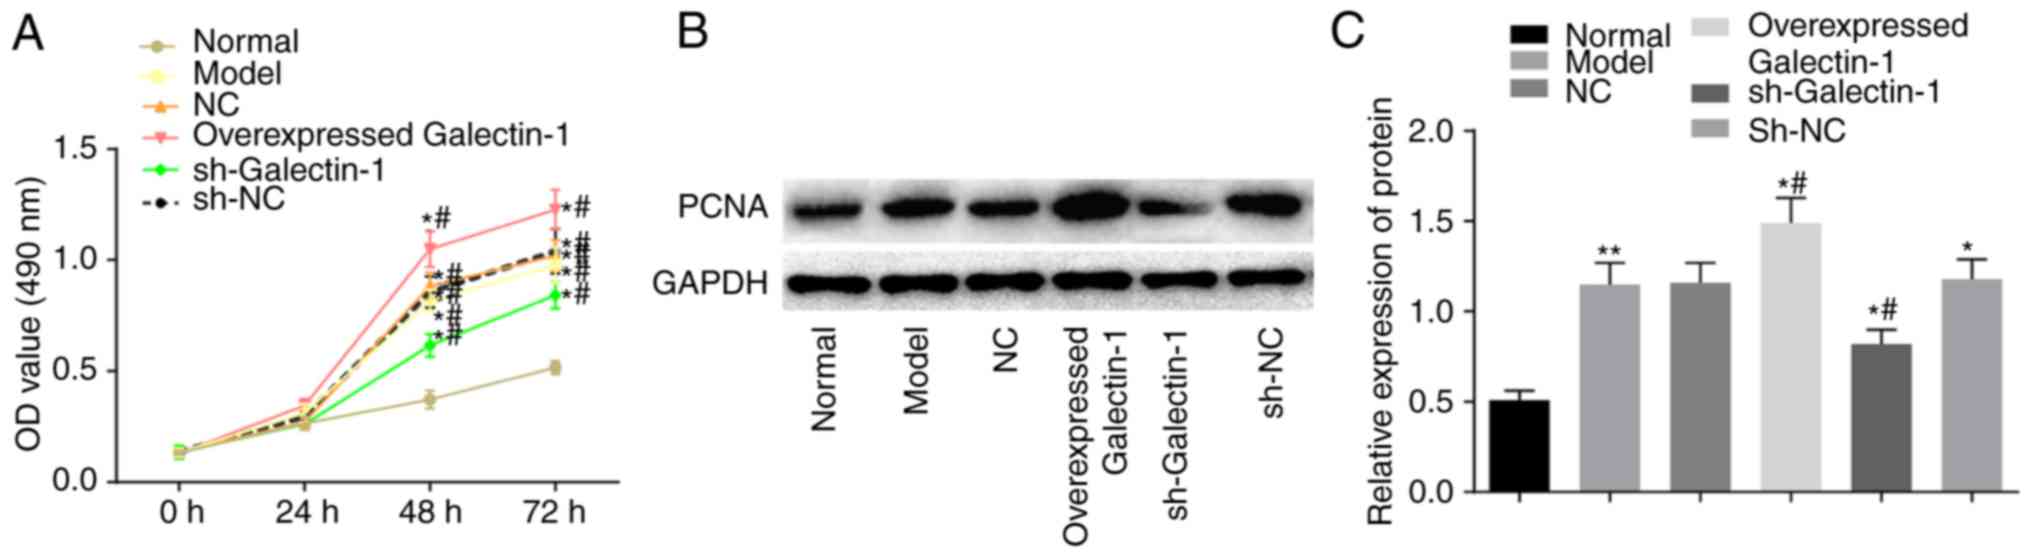
proliferation of mHSCs from mice with liver fibrosis
Subsequently, the impact of Galectin-1 on mHSC
proliferation was determined using the MTT and western blot assays.
The MTT results (Fig. 5A) showed
no significant difference in the OD values among groups at the 0
and 24 h time-points (P>0.05). Compared with those in the normal
group, the OD values at 48 and 72 h in the other five groups were
elevated, suggesting increased cell proliferation (P<0.05).
Compared with that in the model group, there were no significant
differences in the OD values of the NC and sh-NC groups
(P>0.05), whereas the overexpressed Galectin-1 group had an
increased OD value (P<0.05), suggesting increased cell
proliferation, and the sh-Galectin-1 group had a decreased OD value
(P<0.05). A western blot assay was also used to further examine
the expression changes in the proliferation-related protein PCNA
triggered by the upregulation of Galectin-1. The protein expression
of PCNA was higher in the cells transfected with the overexpression
Galectin-1 plasmid, however, this trend was reversed by
transfection with sh-Galectin-1 (P<0.05; Fig. 5B and C). Considering the above
results, it was concluded that the decreased expression of
Galectin-1 exerted a negative effect on the proliferation of mHSCs
from mice with liver fibrosis.
Galectin-1 gene silencing induces cell
apoptosis and decreases cell cycle progression in mHSCs from mice
with liver fibrosis
To examine how the cell cycle and apoptosis of mHSCs
were affected by Galectin-1, flow cytometry and western blot assays
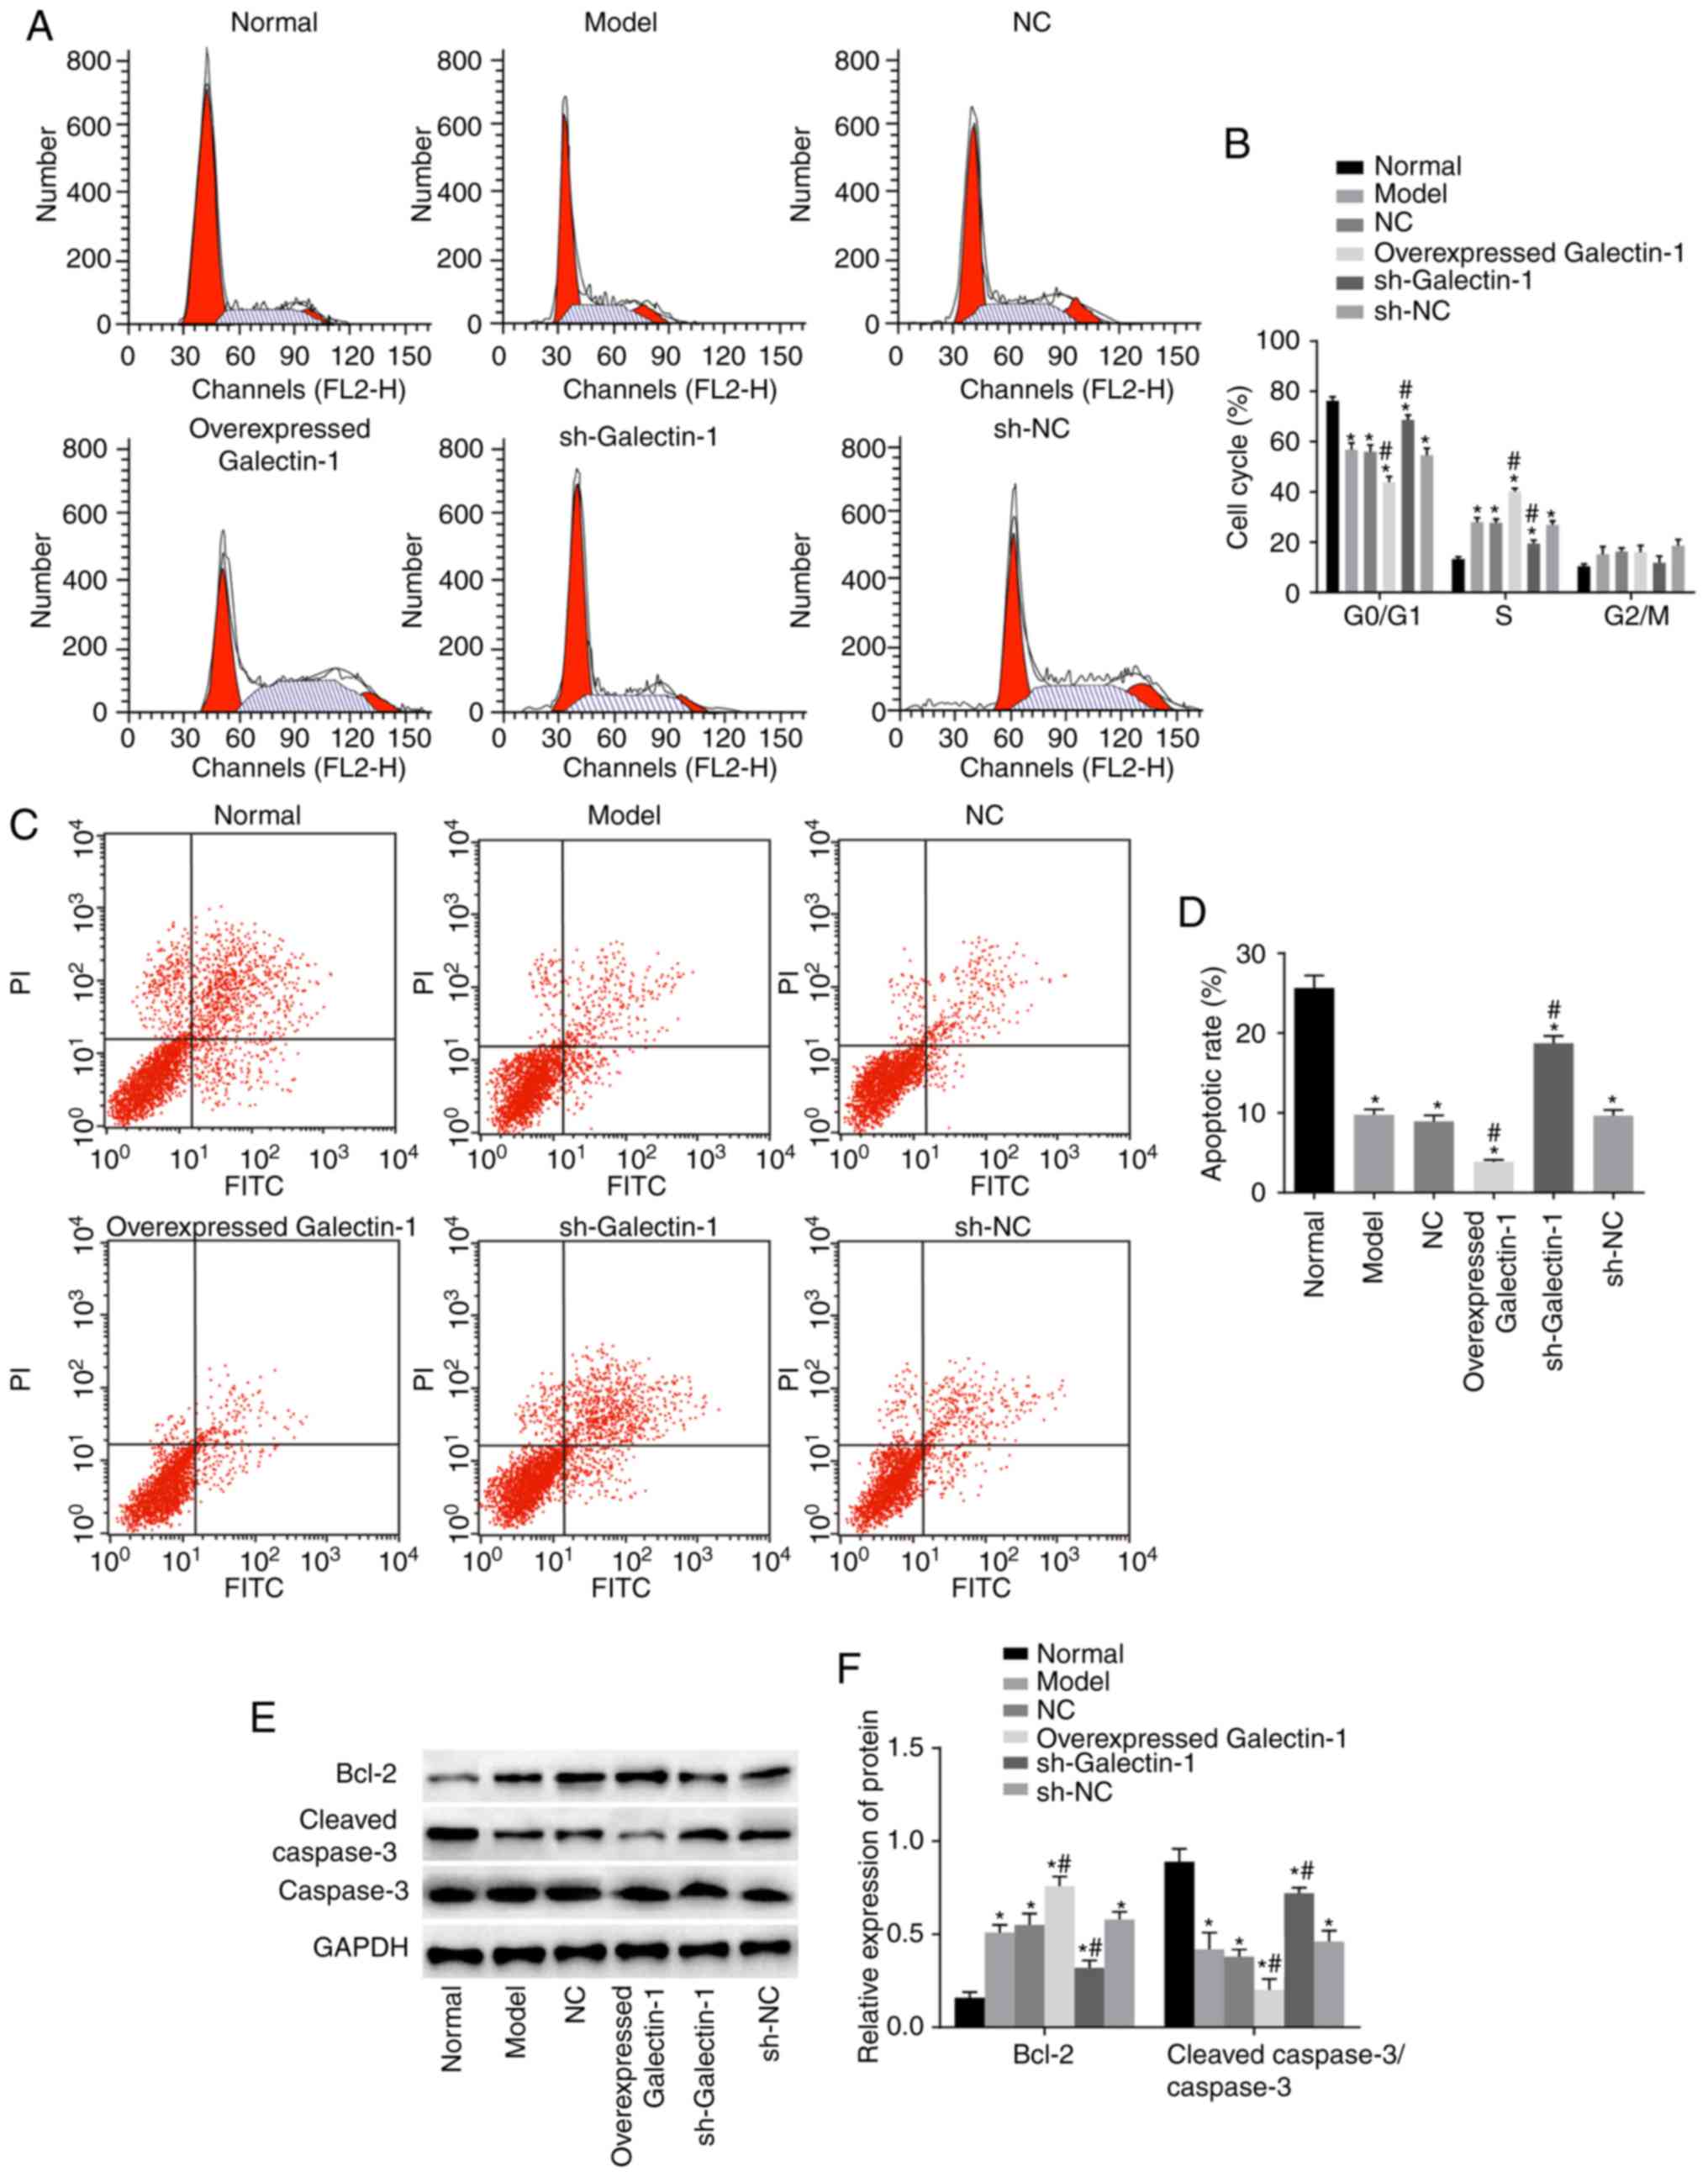
were performed. The flow cytometry results (Fig. 6A and B) showed that, compared with
that in the normal group, the numbers of cells arrested at the
G0/G1 phase in the other five groups were decreased, whereas more
cells were arrested at the S phase. The other five groups also
showed inhibited cell apoptotic rates compared with that in the
normal group (P<0.05). Compared with those in the model group,
the number of cells in the G2/M phase and the cell apoptotic rate
in the NC and sh-NC groups were not significantly different
(P>0.05). Furthermore, the overexpressed Galectin-1 group had
fewer cells that were arrested at the G0/G1 phase and more cells
that were arrested at the S phase compared with numbers in the
model group. The overexpressed Galectin-1 group also showed an
inhibited cell apoptotic rate compared with that in the model group
(P<0.05), whereas the sh-Galectin-1 group showed the opposite
trend (P<0.05; Fig. 6C and D).
The western blot assay results (Fig.
6E and F) indicated that, compared with those in the normal
group, the protein expression levels of the apoptosis-related
protein Bcl-2 in the other five groups were markedly higher, with
lower protein expression levels of cleaved caspase-3/caspase-3
observed (all P<0.05). Compared with those in the model group,
no significant differences were found in the levels of Bcl-2 and
cleaved-caspase-3/caspase-3 in the NC and sh-NC groups (P>0.05),
whereas the overexpressed Galectin-1 group had an increased protein
expression of Bcl-2 and decreased protein expression of
cleaved-caspase-3/caspase-3 compared with levels in the model
group. The trend in the sh-Galectin-1 group was the opposite of
that in the overexpressed Galectin-1 group (P<0.05). In summary,
decreased Galectin-1 promoted apoptosis and inhibited cell cycle
progression of mHSCs from mice with liver fibrosis.
Galectin-1 gene silencing decreases
mitochondrial function in mHSCs from mice with liver fibrosis
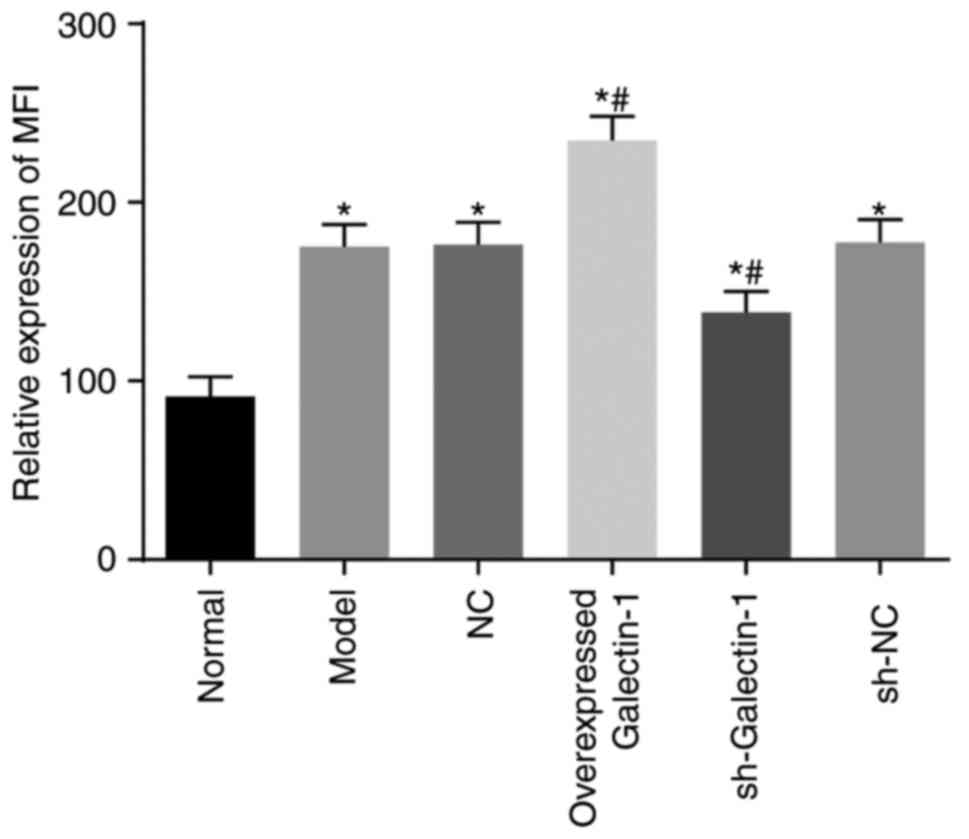
Rhodamine 123 staining and flow cytometry were
utilized to assess the cell mitochondrial membrane potential.
Compared with the normal group, the mitochondrial MFI in the other
five groups exhibited a significant increase (all P<0.05).
Compared with the model group, no notable change in the MFI was
observed in the sh-NC and NC groups (P>0.05), however, the MFI
in the overexpressed Galectin-1 group was significantly increased
and that in the sh-Galectin-1 group was significantly decreased
(P<0.05) (Fig. 7). These
findings suggested that the decreased expression of Galectin-1
reduced mitochondrial function in the mHSCs from mice with liver
fibrosis.
Galectin-1 gene silencing inhibits the
cell migration ability of mHSCs from mice with liver fibrosis
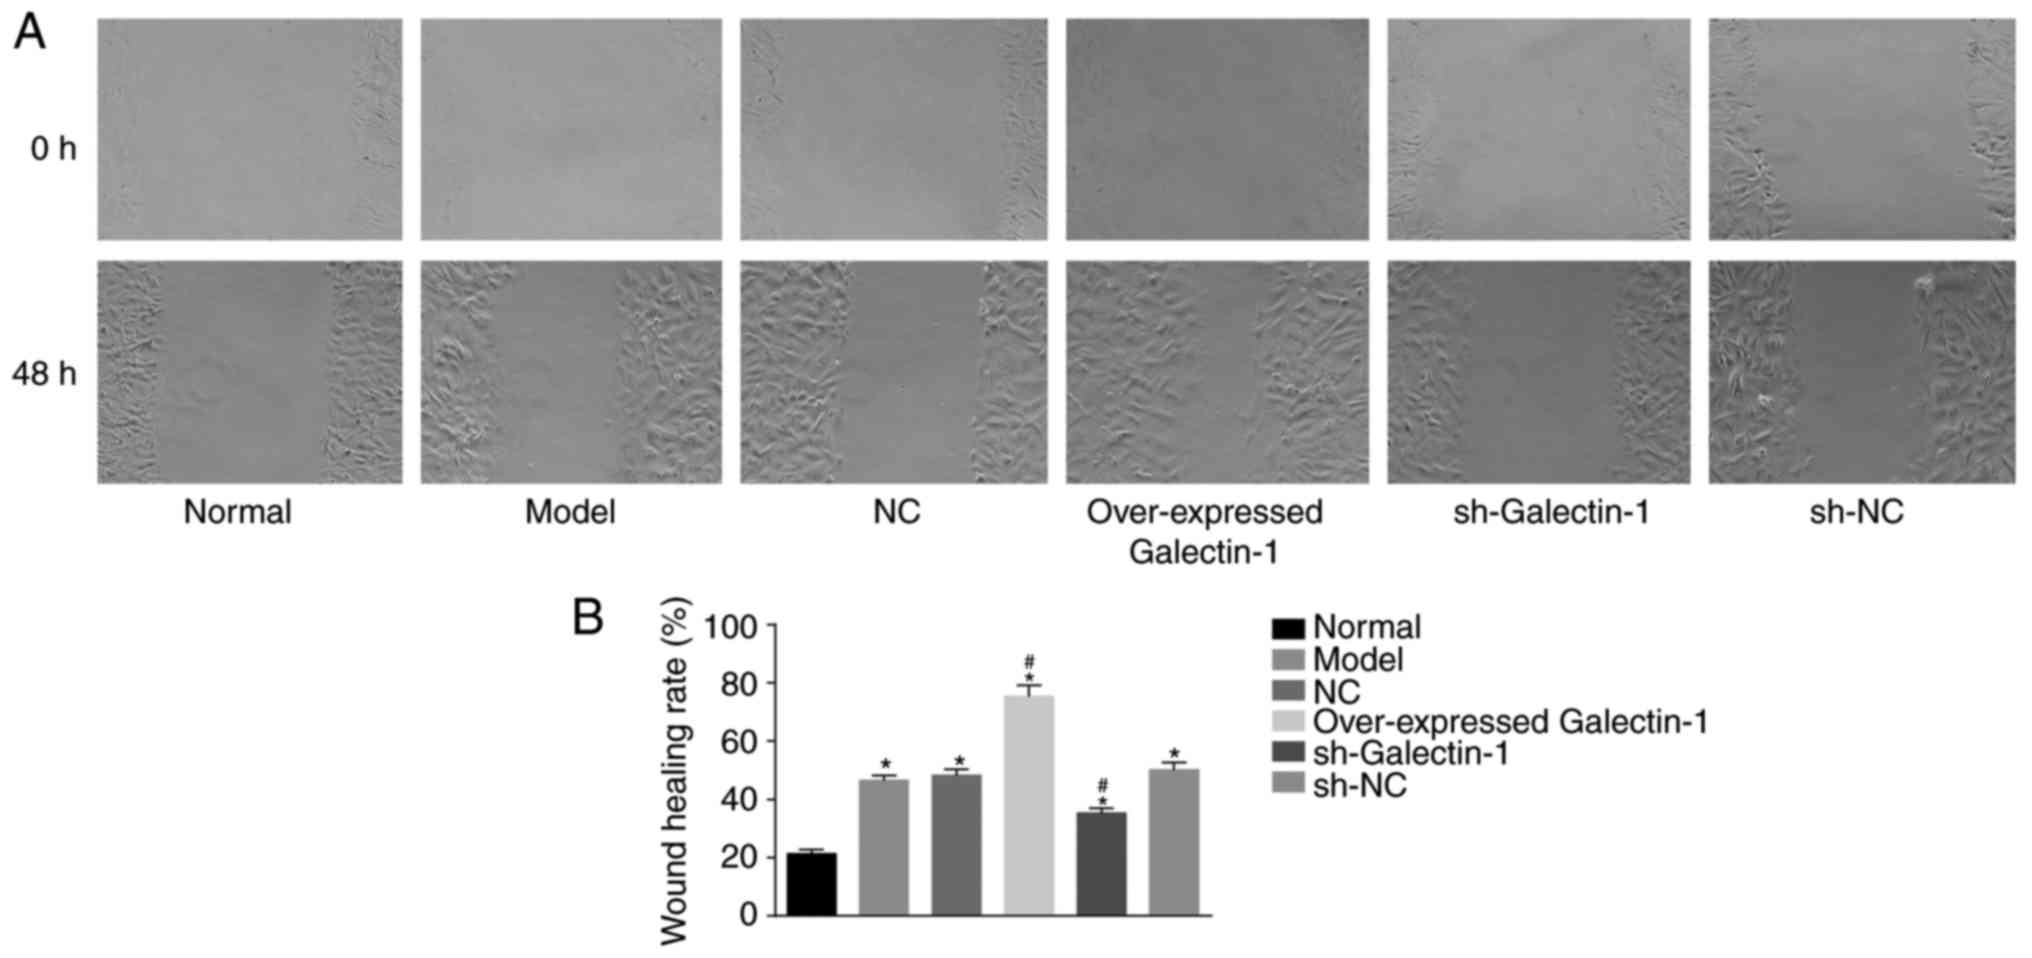
In addition, a scratch test was used to determine
changes in the migration abilities of the mHSCs. The scratch test
results (Fig. 8A and B) showed
that, compared with that in the normal group, the cell migration
abilities at 48 h in the other five groups were increased
(P<0.05). No significant difference was observed in the cell
migration abilities among the model group, NC and sh-NC groups
(P>0.05). The overexpressed Galectin-1 group exhibited increased
cell migration ability (P<0.05), whereas the sh-Galectin-1 group
exhibited decreased cell migration ability (P<0.05). Therefore,
it was concluded that the decreased expression of Galectin-1 had a
negative effect on the cell migration ability of mHSCs from mice
with liver fibrosis.
Galectin-1 gene silencing improves liver
fibrosis
Finally, H&E staining, Masson staining,
immunohistochemistry and ELISA were performed to observe the effect
of Galectin-1 on liver fibrosis. As shown in Fig. 9A and B, the pathological results
showed that liver fibrosis was reduced in the sh-Galectin-1 group,
as a low level of inflammatory cell infiltration and a marginally
increased liver cell volume with a cord-like arrangement were
observed, with no apparent necrosis, interstitial hyperplasia or
fibrosis. The immunohistochemistry results (Fig. 9C) demonstrated that, compared with
the Sh-NC group, the positive protein expression of α-SMA and
Desmin was decreased in the sh-Galectin-1 group (P<0.05). The
ELISA results (Fig. 9D) showed
that, compared with those in the sh-NC group, the expression levels
of ALT, AST and Tbil were reduced and the expression level of ALB
was increased in the sh-Galectin-1 group (P<0.05). Western blot
analysis (Fig. 9E) suggested that
the protein expression of Galectin-1 was decreased in the
sh-Galectin-1 group and increased in the sh-NC group (P<0.05).
In conclusion, Galectin-1 silencing ameliorated liver fibrosis.
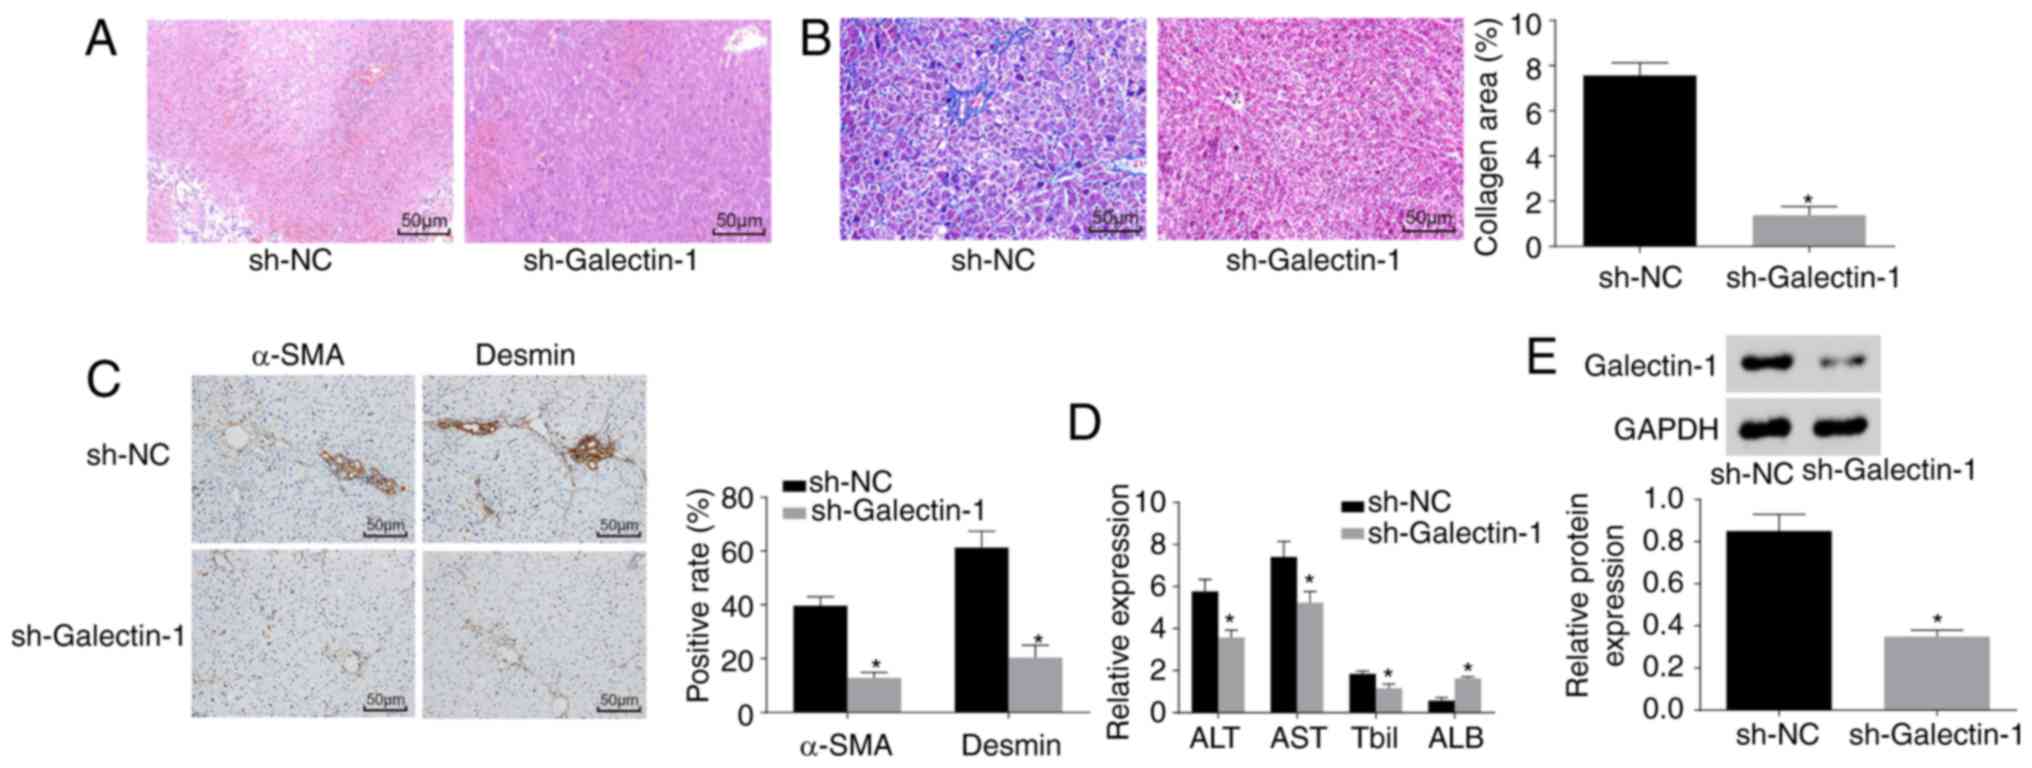 | Figure 9Silencing the expression of
Galectin-1 ameliorates liver fibrosis. (A) Hematoxylin and eosin
staining results verified that mice in the sh-Galectin-1 group had
a small amount of inflammatory cell infiltration (magnification,
×200). (B) Masson staining results verified that mice in the
sh-Galectin-1 group had significantly decreased liver fibrosis
(magnification, ×200). (C) Immunohistochemistry results verified
that mice in the sh-Galectin-1 group had decreased positive
expression for α-SMA and Desmin (magnification, ×200). (D) ELISA
demonstrated that the expression levels of ALT, AST and Tbil were
decreased, whereas that of ALB was increased by Galectin-1 gene
silencing. (E) Western blot assay results demonstrated that
Galectin-1 was expressed at a low level in the sh-Galectin-1
group;*P<0.05 vs. sh-NC group. α-SMA, α-smooth muscle
actin; ALT, alanine aminotransferase; AST, aspartate
aminotransferase; ALB, albumin; TBil, total bilirubin; sh, short
hairpin RNA; NC, negative control. |
Discussion
Liver fibrosis is a chronic progressive liver
disease that results from one or more etiologies, including
autoimmune reactions, alcohol, viruses, long-term drug damage,
parasites, and the repeated impact of liver damage (26). Orthotopic liver transplantation is
the most useful treatment, however, shortages of donor tissues and
organs restrict its wide application (27,28). Galectins have emerged as a
significant regulator of cellular physiology (29). Over the last 10 years, various
biological functions have been demonstrated for this protein
family, as they have been shown to be involved in cell migration,
adhesion, survival and cytokine synthesis (19,30). Therefore, the present study
investigated and demonstrated the role of Galectin-1 in the
activation, proliferation and apoptosis of HSCs in a liver fibrosis
mouse model. It was shown that silencing the gene expression of
Galectin-1 reduced liver fibrosis by suppressing the activation and
proliferation and accelerating the apoptosis of mHSCs.
The present study found that mice with liver
fibrosis had increased expression levels of ALT, AST and Tbil, but
showed reduced expression of ALB. ALT is a liver enzyme commonly
used to screen for hepatic disease and liver injury in humans
(31). Persistently normal ALT is
associated with a good long-term prognosis, whereas certain
increases in ALT levels are associated with increased mortality and
morbidity rates in chronic hepatitis B virus infection (32). The AST, ALT and γ-glutamyl
transferase parameters are regarded as important markers of liver
damage assessment (33). The
association between liver fibrosis and ALT has been examined in
previous studies, and ALT has been shown to exert an important
effect on liver fibrosis via its interaction with proinflammatory
cytokines and chemokines (34,35). Liver function is often examined by
determining the serum levels of ALT, alkaline phosphatase (ALP),
AST, Tbil, and lactate dehydrogenase (LDH) to evaluate the hepatic
fibrosis condition, and reduced serum activities of ALT, AST, ALP
and TBil indicate alleviated liver damage (36). AST is also considered to be
involved in liver fibrosis, and it is used with the platelet ratio
index to evaluate the development of liver fibrosis in infants with
a shortened gut (37,38). In addition, a previous report
indicated a correlation between TBil and liver disease, finding
that liver patients with elevated Tbil levels had a significantly
increased number of glycans modified with α1-6 fucose, which is a
marker of hepatocellular carcinoma (39). Advanced cirrhosis features a
reduced concentration of ALB, and impaired ALB function is the
result of specific structural changes together with oxidative
damage (40). In addition, HSCs
exert key effects on liver fibrosis, and HSC inactivation is
commonly considered an effective therapeutic approach (41).
In the present study, Galectin-1 silencing decreased
the mRNA and protein expression levels of TGF-β1, CTGF and α-SMA,
but increased that of ALB. The expression of Galectin-1,
carbohydrate-binding protein, which has an affinity for
β-galactoside, is high among isolated activated pancreatic stellate
cells (42-44). Galectin-1 is reportedly
overexpressed in various types of tumors, including colorectal
cancer, gastric cancer, and hepatocellular carcinoma (45-47). Pancreatic ductal adenocarcinoma
cells secrete TGF-β1 cytokines, and the expression of Galectin-1 is
associated with the paracrine secretion of TGF-β1 (44). Further investigation into the
mechanism by which Galectin-1 promotes the TGF-β1-induced
differentiation of fibroblasts has revealed that knocking down
Galectin-1 reduces the phosphorylation and nuclear retention of
mothers against decapentaplegic 2 (Smad2), which may be responsible
for delaying the differentiation of fibroblasts by sustaining the
nuclear localization of Smad2 (48). α-SMA, a widely featured
cytoskeletal protein, represents myofibroblast differentiation,
whereas TGF-β1 triggers the expression of α-SMA, offering a
promoted myofibroblast contractile event that is involved in tissue
remodelling (49). Upon liver
injury, quiescent HSCs become activated and then transform into
myofibroblast-like cells, which are invariably associated with
positive staining for α-SMA and markedly elevated synthesis of ECM
proteins (8). The expression of
Galectin-1 was reported to be positively correlated with α-SMA in
oral squamous cell carcinoma specimens, and Galectin-1 knockdown
decreased the expression of α-SMA (50). In addition, Galectin-1 modulates
the expression of hypoxia-related genes, including CTGF, which are
implicated in angiogenesis (51).
A previous report showed that ALB, which inhibits HSC activation,
is endogenously expressed among quiescent HSCs (52). As the previous data are in line
with the findings of the present study, it was concluded that the
low expression of Galectin-1 decreased the mRNA and protein
expression levels of Galectin-1, TGF-β1, CTGF and α-SMA, but
elevated that of ALB.
Furthermore, the silencing of Galectin-1 inhibited
the proliferation and migration and induced the apoptosis of mHSCs.
High serum levels of Galectin-1 correlate with tumor aggression
(53-55) and a metastatic phenotype (56-58). Similar to neuroblastoma (59), breast cancer (60), and oral squamous cell carcinoma,
Galectin-1 enhances the proliferation and migration of lung
adenocarcinoma (61). Galectins
are known as a growing group of β-galactoside binding animal
lectins and are implicated in biological behaviors, including
proliferation and apoptosis, by binding to complementary
glycoconjugates (62). PCNA,
which was upregulated by Galectin-1 in the present study, has
received attention due to its role in proliferation (63,64). In addition, PCNA is expressed in
the nuclei of plant, yeast and animal cells that undergo cell
division, indicating that it functions in DNA replication and/or
cell cycle regulation (65). The
present study also revealed that Galectin-1 decreased the
expression levels of Bcl-2, CTGF and Caspase-3. Proteins in the
Bcl-2 family are effective regulators of mitochondrial membrane
integrity and are vital in the control of apoptosis (66). Galectin-1, which shows marked
expression in naive and IgM+ memory B cells, affects
cell survival and death by regulating the Bcl-2-regulated pathway
(67). The overexpression of
Bcl-2 protects HSCs against oxidative stress and may affect the
progression of fibrosis in chronic liver diseases (68). A previous study revealed that
serum CTGF is associated with the stage of liver fibrosis,
indicating that it is an important indicator of liver fibrosis and
may be a useful marker for the assessment of the liver fibrosis
(69). Serum CTGF levels in
patients with hepatitis B are significantly elevated compared with
those in controls (70).
Caspase-3 activity is also regarded as a marker of apoptosis in
fibrosis studies in vivo (71). In conclusion, the present study
demonstrated that Galectin-1 enhanced the activation and
proliferation, but suppressed the apoptosis of HSCs from a mouse
model of liver fibrosis, which may provide a basic foundation for
hepatic diseases. These findings indicated that Galectin-1 may be a
future therapeutic candidate for liver fibrosis. However, due to
the limited data and conditions examined, improvements are required
in the future.
Acknowledgments
Not applicable.
Funding
This study was supported by the National Natural
Science Foundation of China (grant no. 81471581) and Research on
Public Welfare Technology and the Social Development Project of
Zhejiang Provincial Bureau of Science and Technology (grant no.
2015C33151).
Availability of data and materials
The datasets used and analyzed during the current
study are available from the corresponding author on reasonable
request.
Authors’ contributions
ZJJ, QHS, HYC and ZY participated in the design and
funding applications. MQS and SSZ performed analysis and
interpretation of data. ZJJ, QHS and HYC obtained and validated the
results. ZY, MQS and SSZ wrote revised the manuscript. All authors
read and approved the final manuscript.
Ethics approval and consent to
participate
The present study was performed in strict accordance
with the recommendations of the Guide for the Care and Use of
Laboratory Animals of the National Institutes of Health. The
protocol was approved by the Institutional Animal Care and Use
Committee of the First Affiliated Hospital, Zhejiang University
School of Medicine.
Patient consent for publication
Not applicable.
Competing interests
The authors declare that they have no competing
interests.
References
|
1
|
Moran-Salvador E and Mann J: Epigenetics
and liver fibrosis. Cell Mol Gastroenterol Hepatol. 4:125–134.
2017. View Article : Google Scholar : PubMed/NCBI
|
|
2
|
Hyun J and Jung Y: MicroRNAs in liver
fibrosis: Focusing on the interaction with hedgehog signaling.
World J Gastroenterol. 22:6652–6662. 2016. View Article : Google Scholar : PubMed/NCBI
|
|
3
|
Ellis EL and Mann DA: Clinical evidence
for the regression of liver fibrosis. J Hepatol. 56:1171–1180.
2012. View Article : Google Scholar : PubMed/NCBI
|
|
4
|
Kisseleva T, Cong M, Paik Y, Scholten D,
Jiang C, Benner C, Iwaisako K, Moore-Morris T, Scott B, Tsukamoto
H, et al: Myofibroblasts revert to an inactive phenotype during
regression of liver fibrosis. Proc Natl Acad Sci US. 109:9448–9453.
2012. View Article : Google Scholar
|
|
5
|
Lee UE and Friedman SL: Mechanisms of
hepatic fibrogenesis. Best Pract Res Clin Gastroenterol.
25:195–206. 2011. View Article : Google Scholar : PubMed/NCBI
|
|
6
|
Troeger JS, Mederacke I, Gwak GY, Dapito
DH, Mu X, Hsu CC, Pradere JP, Friedman RA and Schwabe RF:
Deactivation of hepatic stellate cells during liver fibrosis
resolution in mice. Gastroenterology. 143:1073–1083.e22. 2012.
View Article : Google Scholar : PubMed/NCBI
|
|
7
|
Krizhanovsky V, Yon M, Dickins RA, Hearn
S, Simon J, Miething C, Yee H, Zender L and Lowe SW: Senescence of
activated stellate cells limits liver fibrosis. Cell. 134:657–667.
2008. View Article : Google Scholar : PubMed/NCBI
|
|
8
|
Friedman SL: Hepatic stellate cells:
Protean, multifunctional, and enigmatic cells of the liver. Physiol
Rev. 88:125–172. 2008. View Article : Google Scholar : PubMed/NCBI
|
|
9
|
Yin C, Evason KJ, Asahina K and Stainier
DY: Hepatic stellate cells in liver development, regeneration, and
cancer. J Clin Invest. 123:1902–1910. 2013. View Article : Google Scholar : PubMed/NCBI
|
|
10
|
Moreira RK: Hepatic stellate cells and
liver fibrosis. Arch Pathol Lab Med. 131:1728–1734. 2007.PubMed/NCBI
|
|
11
|
You Y, Tan JX, Dai HS, Chen HW, Xu XJ,
Yang AG, Zhang YJ, Bai LH and Bie P: MiRNA-22 inhibits oncogene
galectin-1 in hepatocellular carcinoma. Oncotarget. 7:57099–57116.
2016. View Article : Google Scholar : PubMed/NCBI
|
|
12
|
Cousin JM and Cloninger MJ: The role of
galectin-1 in cancer progression, and synthetic multivalent systems
for the study of galectin-1. Int J Mol Sci. 17:E15662016.
View Article : Google Scholar : PubMed/NCBI
|
|
13
|
Huang YJ, Shiau AL, Chen SY, Chen YL, Wang
CR, Tsai CY, Chang MY, Li YT, Leu CH and Wu CL: Multivalent
structure of galectin-1-nanogold complex serves as potential
therapeutics for rheumatoid arthritis by enhancing receptor
clustering. Eur Cell Mater. 23:170–181. 2012. View Article : Google Scholar : PubMed/NCBI
|
|
14
|
D’Haene N, Sauvage S, Maris C, Adanja I,
Le Mercier M, Decaestecker C, Baum L and Salmon I: VEGFR1 and
VEGFR2 involvement in extracellular galectin-1- and
galectin-3-induced angiogenesis. PLoS One. 8:e670292013. View Article : Google Scholar :
|
|
15
|
Belardi B, O’Donoghue GP, Smith AW, Groves
JT and Bertozzi CR: Investigating cell surface galectin-mediated
cross-linking on glycoengineered cells. J Am Chem Soc.
134:9549–9552. 2012. View Article : Google Scholar : PubMed/NCBI
|
|
16
|
Hernandez JD, Nguyen JT, He J, Wang W,
Ardman B, Green JM, Fukuda M and Baum LG: Galectin-1 binds
different CD43 glycoforms to cluster CD43 and regulate T cell
death. J Immunol. 177:5328–5336. 2006. View Article : Google Scholar : PubMed/NCBI
|
|
17
|
Laderach DJ, Gentilini LD, Giribaldi L,
Delgado VC, Nugnes L, Croci DO, Al Nakouzi N, Sacca P, Casas G,
Mazza O, et al: A unique galectin signature in human prostate
cancer progression suggests galectin-1 as a key target for
treatment of advanced disease. Cancer Res. 73:86–96. 2013.
View Article : Google Scholar
|
|
18
|
Liu FT and Rabinovich GA: Galectins as
modulators of tumour progression. Nat Rev Cancer. 5:29–41. 2005.
View Article : Google Scholar : PubMed/NCBI
|
|
19
|
Elola MT, Wolfenstein-Todel C, Troncoso
MF, Vasta GR and Rabinovich GA: Galectins: Matricellular
glycan-binding proteins linking cell adhesion, migration, and
survival. Cell Mol Life Sci. 64:1679–1700. 2007. View Article : Google Scholar : PubMed/NCBI
|
|
20
|
Maeda N, Kawada N, Seki S, Arakawa T,
Ikeda K, Iwao H, Okuyama H, Hirabayashi J, Kasai K and Yoshizato K:
Stimulation of proliferation of rat hepatic stellate cells by
galectin-1 and galectin-3 through different intracellular signaling
pathways. J Biol Chem. 278:18938–18944. 2003. View Article : Google Scholar : PubMed/NCBI
|
|
21
|
Lim MJ, Ahn J, Yi JY, Kim MH, Son AR, Lee
SL, Lim DS, Kim SS, Kang MA, Han Y and Song JY: Induction of
galectin-1 by TGF-β1 accelerates fibrosis through enhancing nuclear
retention of Smad2. Exp Cell Res. 326:125–135. 2014. View Article : Google Scholar : PubMed/NCBI
|
|
22
|
Brown RS and Wahl RL: Overexpression of
Glut-1 glucose transporter in human breast cancer. An
immunohistochemical study Cancer. 72:2979–2985. 1993.
|
|
23
|
Tuo YL, Li XM and Luo J: Long noncoding
RNA UCA1 modulates breast cancer cell growth and apoptosis through
decreasing tumor suppressive miR-143. Eur Rev Med Pharmacol Sci.
19:3403–3411. 2015.PubMed/NCBI
|
|
24
|
Friedman SL and Roll FJ: Isolation and
culture of hepatic lipocytes, Kupffer cells, and sinusoidal
endothelial cells by density gradient centrifugation with Stractan.
Anal Biochem. 161:207–218. 1987. View Article : Google Scholar : PubMed/NCBI
|
|
25
|
Jiang QL, Wang JM, Jiang S, Wen LM and
Zhou H: Large-scale real-time titration of
green-fluorescence-protein-marked recombinant retrovirus:
Comparison with standard titration method. Di Yi Jun Yi Da Xue Xue
Bao. 23:1101–1103. 2003.In Chinese. PubMed/NCBI
|
|
26
|
Yu J, Hao G, Wang D, Liu J, Dong X, Sun Y,
Pan Q, Li Y, Shi X, Li L and Cao H: Therapeutic effect and location
of GFP-labeled placental mesenchymal stem cells on hepatic fibrosis
in rats. Stem Cells Int. 2017.1798260:2017.
|
|
27
|
Pais R, Barritt AS IV, Calmus Y, Scatton
O, Runge T, Lebray P, Poynard T, Ratziu V and Conti F: NAFLD and
liver transplantation: Current burden and expected challenges. J
Hepatol. 65:1245–1257. 2016. View Article : Google Scholar : PubMed/NCBI
|
|
28
|
Addolorato G, Mirijello A, Barrio P and
Gual A: Treatment of alcohol use disorders in patients with
alcoholic liver disease. J Hepatol. 65:618–630. 2016. View Article : Google Scholar : PubMed/NCBI
|
|
29
|
Bacigalupo ML, Manzi M, Rabinovich GA and
Troncoso MF: Hierarchical and selective roles of galectins in
hepatocarcinogenesis, liver fibrosis and inflammation of
hepatocellular carcinoma. World J Gastroenterol. 19:8831–8849.
2013. View Article : Google Scholar :
|
|
30
|
Liu FT and Rabinovich GA: Galectins:
Regulators of acute and chronic inflammation. Ann N Y Acad Sci.
1183:158–182. 2010. View Article : Google Scholar : PubMed/NCBI
|
|
31
|
Carobene A, Braga F, Roraas T, Sandberg S
and Bartlett WA: A systematic review of data on biological
variation for alanine aminotransferase, aspartate aminotransferase
and gamma-glutamyl transferase. Clin Chem Lab Med. 51:1997–2007.
2013. View Article : Google Scholar : PubMed/NCBI
|
|
32
|
Tai DI, Lin SM, Sheen IS, Chu CM, Lin DY
and Liaw YF: Long-term outcome of hepatitis B e antigen-negative
hepatitis B surface antigen carriers in relation to changes of
alanine amino-transferase levels over time. Hepatology.
49:1859–1867. 2009. View Article : Google Scholar : PubMed/NCBI
|
|
33
|
Ceriotti F, Henny J, Queraltó J, Ziyu S,
Özarda Y, Chen B, Boyd JC and Panteghini M: IFCC Committee on
Reference Intervalsand Decision Limits (C-RIDL); Committee on
Reference Systems for Enzymes (C-RSE): Common reference intervals
for aspartate aminotransferase (AST), alanine aminotransferase
(ALT) and γ-glutamyl transferase (GGT) in serum: Results from an
IFCC multicenter study. Clin Chem Lab Med. 48:1593–1601. 2010.
View Article : Google Scholar : PubMed/NCBI
|
|
34
|
Moreno-Otero R, Trapero-Marugan M and
Mendoza J: Liver fibrosis assessment by transient elastography in
hepatitis C patients with normal alanine aminotransferase. Gut.
55:1055–1056. 2006.PubMed/NCBI
|
|
35
|
Liang CC, Liu CH, Chung CS, Lin CK, Su TH,
Yang HC, Liu CJ, Chen PJ, Chen DS and Kao JH: Advanced hepatic
fibrosis and steatosis are associated with persistent alanine
aminotransferase elevation in chronic hepatitis C patients negative
for hepatitis C virus RNA during pegylated interferon plus
ribavirin therapy. J Infect Dis. 211:1429–1436. 2015. View Article : Google Scholar
|
|
36
|
Wang T, Zhao LJ, Li P, Jiang H, Lu GC,
Zhang WD, Li HL and Yuan BJ: Hepatoprotective effects and
mechanisms of dehydrocavidine in rats with carbon
tetrachloride-induced hepatic fibrosis. J Ethnopharmacol.
138:76–84. 2011. View Article : Google Scholar : PubMed/NCBI
|
|
37
|
Mangus RS, O’Connor MG, Tector AJ, Lim JD
and Vianna RM: Use of the aspartate aminotransferase to platelet
ratio index to follow liver fibrosis progression in infants with
short gut. J Pediatr Surg. 45:1266–1273. 2010. View Article : Google Scholar : PubMed/NCBI
|
|
38
|
Petersen JR, Stevenson HL, Kasturi KS,
Naniwadekar A, Parkes J, Cross R, Rosenberg WM, Xiao SY and Snyder
N: Evaluation of the aspartate aminotransferase/platelet ratio
index and enhanced liver fibrosis tests to detect significant
fibrosis due to chronic hepatitis C. J Clin Gastroenterol.
48:370–376. 2014. View Article : Google Scholar :
|
|
39
|
Blomme B, Van Steenkiste C, Vanhuysse J,
Colle I, Callewaert N and Van Vlierberghe H: Impact of elevation of
total bilirubin level and etiology of the liver disease on serum
N-glycosylation patterns in mice and humans. Am J Physiol
Gastrointest Liver Physiol. 298:G615–G624. 2010. View Article : Google Scholar : PubMed/NCBI
|
|
40
|
Spinella R, Sawhney R and Jalan R: Albumin
in chronic liver disease: Structure, functions and therapeutic
implications. Hepatol Int. 10:124–132. 2016. View Article : Google Scholar
|
|
41
|
Lee H, Jeong H, Park S, Yoo W, Choi S,
Choi K, Lee MG, Lee M, Cha D, Kim YS, et al: Fusion protein of
retinol-binding protein and albumin domain III reduces liver
fibrosis. EMBO Mol Med. 7:819–830. 2015. View Article : Google Scholar : PubMed/NCBI
|
|
42
|
Tang D, Yuan Z, Xue X, Lu Z, Zhang Y, Wang
H, Chen M, An Y, Wei J, Zhu Y, et al: High expression of Galectin-1
in pancreatic stellate cells plays a role in the development and
maintenance of an immunosuppressive microenvironment in pancreatic
cancer. Int J Cancer. 130:2337–2348. 2012. View Article : Google Scholar
|
|
43
|
Masamune A, Satoh M, Hirabayashi J, Kasai
K, Satoh K and Shimosegawa T: Galectin-1 induces chemokine
production and proliferation in pancreatic stellate cells. Am J
Physiol Gastrointest Liver Physiol. 290:G729–G736. 2006. View Article : Google Scholar
|
|
44
|
Tang D, Zhang J, Yuan Z, Gao J, Wang S, Ye
N, Li P, Gao S, Miao Y, Wang D and Jiang K: Pancreatic satellite
cells derived galectin-1 increase the progression and less survival
of pancreatic ductal adenocarcinoma. PLoS One. 9:e904762014.
View Article : Google Scholar : PubMed/NCBI
|
|
45
|
Spano D, Russo R, Di Maso V, Rosso N,
Terracciano LM, Roncalli M, Tornillo L, Capasso M, Tiribelli C and
Iolascon A: Galectin-1 and its involvement in hepatocellular
carcinoma aggressiveness. Mol Med. 16:102–115. 2010. View Article : Google Scholar : PubMed/NCBI
|
|
46
|
Satelli A and Rao US: Galectin-1 is
silenced by promoter hyper-methylation and its re-expression
induces apoptosis in human colorectal cancer cells. Cancer Lett.
301:38–46. 2011. View Article : Google Scholar
|
|
47
|
Bektas S, Bahadir B, Ucan BH and Ozdamar
SO: CD24 and galectin-1 expressions in gastric adenocarcinoma and
clinicopathologic significance. Pathol Oncol Res. 16:569–577. 2010.
View Article : Google Scholar : PubMed/NCBI
|
|
48
|
Tang D, Wu Q, Zhang J, Zhang H, Yuan Z, Xu
J, Chong Y, Huang Y, Xiong Q, Wang S, et al: Galectin-1 expression
in activated pancreatic satellite cells promotes fibrosis in
chronic pancreatitis/pancreatic cancer via the TGF-β1/Smad pathway.
Oncol Rep. 39:1347–1355. 2018.PubMed/NCBI
|
|
49
|
Prunotto M, Bruschi M, Gunning P, Gabbiani
G, Weibel F, Ghiggeri GM, Petretto A, Scaloni A, Bonello T,
Schevzov G, et al: Stable incorporation of α-smooth muscle actin
into stress fibers is dependent on specific tropomyosin isoforms.
Cytoskeleton (Hoboken). 72:257–267. 2015. View Article : Google Scholar
|
|
50
|
Wu MH, Hong HC, Hong TM, Chiang WF, Jin YT
and Chen YL: Targeting galectin-1 in carcinoma-associated
fibroblasts inhibits oral squamous cell carcinoma metastasis by
downregulating MCP-1/CCL2 expression. Clin Cancer Res.
17:1306–1316. 2011. View Article : Google Scholar : PubMed/NCBI
|
|
51
|
Le Mercier M, Mathieu V, Haibe-Kains B,
Bontempi G, Mijatovic T, Decaestecker C, Kiss R and Lefranc F:
Knocking down galectin 1 in human hs683 glioblastoma cells impairs
both angiogenesis and endoplasmic reticulum stress responses. J
Neuropathol Exp Neurol. 67:456–469. 2008. View Article : Google Scholar : PubMed/NCBI
|
|
52
|
Park S, Choi S, Lee MG, Lim C and Oh J:
Retinol binding protein-albumin domain III fusion protein
deactivates hepatic stellate cells. Mol Cells. 34:517–522. 2012.
View Article : Google Scholar : PubMed/NCBI
|
|
53
|
Lefranc F, Mathieu V and Kiss R:
Galectin-1-mediated biochemical controls of melanoma and glioma
aggressive behavior. World J Biol Chem. 2:193–201. 2011. View Article : Google Scholar : PubMed/NCBI
|
|
54
|
Chung LY, Tang SJ, Sun GH, Chou TY, Yeh
TS, Yu SL and Sun KH: Galectin-1 promotes lung cancer progression
and chemoresistance by upregulating p38 MAPK, ERK, and
cyclo-oxygenase-2. Clin Cancer Res. 18:4037–4047. 2012. View Article : Google Scholar : PubMed/NCBI
|
|
55
|
Verschuere T, Van Woensel M, Fieuws S,
Lefranc F, Mathieu V, Kiss R, Van Gool SW and De Vleeschouwer S:
Altered galectin-1 serum levels in patients diagnosed with
high-grade glioma. J Neurooncol. 115:9–17. 2013. View Article : Google Scholar : PubMed/NCBI
|
|
56
|
Dalotto-Moreno T, Croci DO, Cerliani JP,
Martinez-Allo VC, Dergan-Dylon S, Méndez-Huergo SP, Stupirski JC,
Mazal D, Osinaga E, Toscano MA, et al: Targeting galectin-1
overcomes breast cancer-associated immunosuppression and prevents
metastatic disease. Cancer Res. 73:1107–1117. 2013. View Article : Google Scholar
|
|
57
|
Kim HJ, Do IG, Jeon HK, Cho YJ, Park YA,
Choi JJ, Sung CO, Lee YY, Choi CH, Kim TJ, et al: Galectin 1
expression is associated with tumor invasion and metastasis in
stage IB to IIA cervical cancer. Hum Pathol. 44:62–68. 2013.
View Article : Google Scholar
|
|
58
|
Hsu YL, Wu CY, Hung JY, Lin YS, Huang MS
and Kuo PL: Galectin-1 promotes lung cancer tumor metastasis by
potentiating integrin α6β4 and Notch1/Jagged2 signaling pathway.
Carcinogenesis. 34:1370–1381. 2013. View Article : Google Scholar : PubMed/NCBI
|
|
59
|
Cimmino F, Schulte JH, Zollo M, Koster J,
Versteeg R, Iolascon A, Eggert A and Schramm A: Galectin-1 is a
major effector of TrkB-mediated neuroblastoma aggressiveness.
Oncogene. 28:2015–2023. 2009. View Article : Google Scholar : PubMed/NCBI
|
|
60
|
Jung EJ, Moon HG, Cho BI, Jeong CY, Joo
YT, Lee YJ, Hong SC, Choi SK, Ha WS, Kim JW, et al: Galectin-1
expression in cancer-associated stromal cells correlates tumor
invasiveness and tumor progression in breast cancer. Int J Cancer.
120:2331–2338. 2007. View Article : Google Scholar : PubMed/NCBI
|
|
61
|
Wu MH, Hong TM, Cheng HW, Pan SH, Liang
YR, Hong HC, Chiang WF, Wong TY, Shieh DB, Shiau AL, et al:
Galectin-1-mediated tumor invasion and metastasis, up-regulated
matrix metalloproteinase expression, and reorganized actin
cytoskeletons. Mol Cancer Res. 7:311–318. 2009. View Article : Google Scholar : PubMed/NCBI
|
|
62
|
Cvejic D, Savin S, Petrovic I, Selemetjev
S, Paunovic I, Tatic S and Havelka M: Galectin-3 and proliferating
cell nuclear antigen (PCNA) expression in papillary thyroid
carcinoma. Exp Oncol. 27:210–214. 2005.PubMed/NCBI
|
|
63
|
Juríková M, Danihel Ľ, Polák Š and Varga
I: Ki67, PCNA, and MCM proteins: Markers of proliferation in the
diagnosis of breast cancer. Acta Histochem. 118:544–552. 2016.
View Article : Google Scholar : PubMed/NCBI
|
|
64
|
Yang M, Zhai X, Xia B, Wang Y and Lou G:
Long noncoding RNA CCHE1 promotes cervical cancer cell
proliferation via upregulating PCNA. Tumour Biol. 36:7615–7622.
2015. View Article : Google Scholar : PubMed/NCBI
|
|
65
|
Strzalka W and Ziemienowicz A:
Proliferating cell nuclear antigen (PCNA): A key factor in DNA
replication and cell cycle regulation. Ann Bot. 107:1127–1140.
2011. View Article : Google Scholar :
|
|
66
|
Youle RJ and Strasser A: The BCL-2 protein
family: Opposing activities that mediate cell death. Nat Rev Mol
Cell Biol. 9:47–59. 2008. View Article : Google Scholar
|
|
67
|
Tabrizi SJ, Niiro H, Masui M, Yoshimoto G,
Iino T, Kikushige Y, Wakasaki T, Baba E, Shimoda S, Miyamoto T, et
al: T cell leukemia/lymphoma 1 and galectin-1 regulate
survival/cell death pathways in human naive and IgM+
memory B cells through altering balances in Bcl-2 family proteins.
J Immunol. 182:1490–1499. 2009. View Article : Google Scholar : PubMed/NCBI
|
|
68
|
González-Puertos VY, Hernández-Pérez E,
Nuño-Lámbarri N, Ventura-Gallegos JL, López-Diázguerrero NE,
Robles-Díaz G, Gutiérrez-Ruiz MC and Konigsberg M: Bcl-2
overexpression in hepatic stellate cell line CFSC-2G, induces a
pro-fibrotic state. J Gastroenterol Hepatol. 25:1306–1314. 2010.
View Article : Google Scholar : PubMed/NCBI
|
|
69
|
Zhang D, Wang NY, Yang CB, Fang GX, Liu W,
Wen J and Luo C: The clinical value of serum connective tissue
growth factor in the assessment of liver fibrosis. Dig Dis Sci.
55:767–774. 2010. View Article : Google Scholar
|
|
70
|
Guo-Qiu W, Nai-Feng L, Xiao-Bo V, Linxian
L, Chen Z, Lixia G and Zhao L: The level of connective tissue
growth factor in sera of patients with hepatitis B virus strongly
correlates with stage of hepatic fibrosis. Viral Immunol. 23:71–78.
2010. View Article : Google Scholar : PubMed/NCBI
|
|
71
|
Trebicka J, Hennenberg M, Odenthal M, Shir
K, Klein S, Granzow M, Vogt A, Dienes HP, Lammert F, Reichen J, et
al: Atorvastatin attenuates hepatic fibrosis in rats after bile
duct ligation via decreased turnover of hepatic stellate cells. J
Hepatol. 53:702–712. 2010. View Article : Google Scholar : PubMed/NCBI
|