Introduction
Acute myeloid leukemia (AML), a malignant and
aggressive neoplasm, is not sensitive to chemotherapy. AML is the
most common acute leukemia in adults, and its incidence is
3–4/100,000 per year (1). Although
most patients with standard induction chemotherapy can achieve
complete remission, the recurrence rate is still high, and more
than half of the patients die of the disease (2). The medical community continues to
make progress in the molecular signaling pathways of AML, however,
still no significant improvement on treatment has been shown.
In addition to the ability of cell proliferation and
apoptosis resistance, undifferentiated state is characteristic of
most cancer cells, especially leukemia cells. Cell differentiation
has many aspects on complex regulatory networks, including
transcriptional, post-transcriptional and epigenetic regulation of
gene expression. The lineage-specific genes and cell growth and
death related genes are involved in the process of maturation. To
induce cancer cell differentiation is regarded as an alternative
method leading to cell death and proliferation inhibition.
Differentiation therapy has primarily been used in the treatment of
AML, especially with all-trans retinoic acid (ATRA)
(3). The second clinically useful
agent in AML is arsenic trioxide (ATO) (4). In spite of the outstanding success of
ATRA treatment, a large number of patients had recurrence on
account of ATRA resistance (5).
Retinoic acid syndrome is a relatively common and serious
complication that acute promyelocytic leukaemia patients may occur
after treated with ATRA and/or ATO (6). Although widespread myeloid
differentiation inducing compounds have been described, including
alkaloids, flavonoids and polyphenols, but their clinical efficacy
in the treatment of AML still remains to be further investigated
(3,7). Hence, it is indispensable to find
promising induction compounds, that are relatively non-toxic and
effective, and can be used for clinical purposes.
Diallyl disulfide (DADS) is a kind of organosulfur
compound from allium plants such as garlic. DADS had anti-tumor
role in a variety of tumors (8),
and was found non-toxic in vivo according to the
experimental data (9). Therefore,
as a recognized anticancer agent, which inhibits cancer cell growth
and invasion, DADS has a good outlook for adjuvant therapy in
clinical application.
We previously showed that moderate amount of DADS
(15–120 μM) can markedly suppress the growth in human AML
HL-60 cells (10), induce
apoptosis (11) and G2/M arrest
(12). In this study, we found
that 8 μM DADS induced differentiation of HL-60 cells in
vitro and in vivo expriments. On this basis, using high
resolution mass spectrometry, we screen and obtain molecules
showing statistically differential expression between DADS-treated
and untreated cells. Eighteen proteins were identified, including
four upregulated and 14 downregulated proteins. The discovery of
these molecules is conducive to reveal unknown anti-leukemia
mechanisms of DADS as a potential differentiating agent.
Materials and methods
Cell culture and cell proliferation
assay
Human leukemia cell line HL-60 was from the Cancer
Research Institute, Xiangya Medical College, Center South
University in China. Cells were cultivated in RPMI-1640 medium with
10% fetal bovine serum (FBS), 100 μg/ml streptomycin, and
100 U/ml penicillin G in a humidified atmosphere of 5%
CO2 and 95% air at 37°C.
Cells (3×10⁴) were seeded in 96-well
plates and treated with Tween-80 (control) or different
concentrations (4, 8, 16, 32, 64 and 128 μM) of DADS (Fluka
Co., Milwaukee, WI, USA), and resolved in Tween-80 at 8 g/l and
stored at −20°C) for 72 h. HL-60 cells were covered with MTT
solution (5 μg/ml) at 37°C for 3 h. Formazan crystals shaped
by the living cells were resolved in absolute ethyl alcohol and
scanned in a scanning multi-well spectrophotometer (Spectra Max
190) at 570 nm. According to inhibition rate (IR) =
(1−ODtreatment group/ODcontrol group) ×100%,
inhibition rate was calculated.
Wright-Giemsa stain and NBT reduction
assay
Before induction of differentiation by DADS, HL-60
cells were kept at a logarithmic growth rate and seeded at a
density of 1×10⁴ cells/well. After exposure to 8
μM DADS for 72 h, we collected cells by cytospin
centrifugation, stained them with Wright-Giemsa stain and observed
them by microscopy. Moreover, the treated cells were pelleted by
centrifugation at 300 × g for 5 min. Differentiation of HL-60 cells
was assessed by adding 200 μl of cell suspension each well
to a solution containing 2 mg/ml of NBT(nitroblue tetrazolium) and
0.24 mg/ml of PMA in phosphate-buffered saline (PBS). The
incubation process for 1 h at 37°C, was stopped by adding 0.4 ml
cold 2 M HCl. The formazan product was centrifugated at 700 × g for
10 min, and dissolved in 200 μl DMSO. The absorbance of the
solution was analyzed at 570 nm.
Immunofluorescence of CD11b
Immunofluorescence was accomplished to confirm
subcellular localization of a general myeloid differentiation
marker CD11b (ab24874). After treatment with DADS (8 μM) for
three days, HL-60 cells were collected by centrifugation. Drops of
cells were coated on slides and incubated at room temperature for
30 min, fixed with 4% polyoxymethylene, then permeabilized with
0.5% Triton X-100 in PBS for 15 min. After that, cells were blocked
with goat serum for 30 min to minimize nonspecific binding of the
primary antibody. The CD11b antibody (1:100 dilution) was applied
at 37°C for 1 h followed by 5-min washes in PBS, three times. FITC
anti-rabbit IgG (ab6717) were used to determinate CD11b. Images
were captured using a Life AMAFD1000 fluorescent microscope and
measured with Image EVOS software (both from Life Technologies
Corp., Bothell, WA, USA).
Tumor xenograft
All animal procedures were carried out according to
the National Institutes of Health guidelines for experimental
animal use. The protocol was authorized by the Committee on the
Ethics of Animal Experiments of the University of South China.
Two-month-old Kunming species mice were obtained from the
Laboratory Animal Center of University of South China. A total of
5×10⁶ HL-60 cells were injected into the left renal
capsule membrane of mice. DADS were injected through the tail vein
of mice, at a concentration of 21, 42 and 84 mg/kg body weight
every day for 5 days. Control mice were injected with same volume
of vehicle (0.9% saline solution). The tumor size was measured from
day 6 after injection. The volume of the tumor was calculated by
the following formula: Volume = Length × Width2 × 0.5.
Inhibitory rate = [(Volume of control tumors − volume of drug
tumors)/volume of control tumors] ×100%. Tumor-burdened kidneys
were fixed with 70% of ethanol for 24 h, embedded in paraffin,
sectioned at 5 μM, and stained with H&E staining. Then
cell morphological changes were observed using an optical
microscope. All surgery was performed under sodium pentobarbital
anesthesia, and we made every effort to minimize suffering.
Cell cycle assay by flow cytometric
detection
Cell cycle analysis was confirmed by flow cytometry.
Briefly, HL-60 cells were plated in 75 cm dishes. After treated by
DADS (4, 8 and 16 μM) for 3 days, HL-60 cells were
collected, centrifuged and washed with PBS. Next, 70% ethanol was
added to fix the cells overnight at 4°C. Then after removing
ethanol, and PBS washing twice, cells were digested with RNAase A
for 1 h at 37°C, and stained with 800 μl PI (50
μg/ml) in the dark for 1 h at 4°C. In the end, the DNA
contents of cell cycle were analysed using a flow cytometer
(Beckman Coulter EPICS-XL).
Transwell migration and invasion
assays
The migration and invasion assays were determined
using 24-well transwell chambers (8 μM; Corning). For the
migration assay, HL-60 cells were resuspended in serum-free
RPMI-1640 medium and 100 μl cell suspension
(1×10⁶ cells) were seeded into the upper chambers.
RPMI-1640 (500 μl) containing 10% FBS was added to the
bottom chambers. After incubation for 24 h, the migrated cells on
the lower membrane surface were fixed with 4% paraformaldehyde for
30 min and stained with 0.1% crystal violet for 15 min, and
calculated under an invert microscope. The invasion assay protocol
was the same as that of the migration assay except that the upper
chambers were first coated with 1 mg/ml Matrigel.
Protein preparation
The total protein from both untreated cells
(control) and cells treated with 8 μM DADS for 72 h were
extracted with lysis buffer (Amersham Biosciences) containing 8 M
urea, 4% CHAPS, 40 mM Tris, 1% DTT, 1 mM PMSF, 0.5% IPG buffer.
2DE and silver stain
Protein samples (200 μg each) were mixed with
hydration solution (8 M Urea, 2% CHAPS, 0.5% IPG buffer, 18 mM DTT,
trace bromophenol blue) and rehydrated with 18 cm IPG strip (pH
4–7) in the isoelectric focusing (IEF) cell followed by 1D IEF in a
maximum current of 60 μA/IPG strip. The strips were
equilibrated in buffer A (8 M urea, 2% SDS, 50 mM Tris-HCl, pH 6.8,
30% glycerol, 1% SDS and 0.2% DTT) for 15 min and in buffer B (8 M
urea, 50 mM Tris-HCl, pH 6.8, 30% glycerol, 1% SDS and 3%
iodoacetamide) for 15 min. The 2D electrophoresis of the strips was
accomplished on 12% SDS-PAGE gel prepared. The gels were fixed in
fixing solution (40% methanol, 10% glacial acetic acid) at room
temperature for 30 min, sensitized in sensitizing solution (30%
ethanol, 0.2% sodium thiosulfate, 6.8% sodium acetate), washed with
double distilled water, stained with silver staining (0.25% silver
nitrate), and then developed in developing solution (2.5% sodium
carbonate, 0.084‰ formaldehyde) until protein point appeared
completely, followed by terminated solution (1.5% EDTA)
immediately.
Image analysis and statistical
significance
Gels were scanned using the Tsinghua Ziguang scanner
D2000 (Tsinghua Ziguang Co.) and assayed using PDQuest 7.1 analysis
software (Bio-Rad), according to the the manufacturer's
instructions. Quantity of each spot was standardized by total valid
spot intensity. Protein spots were regarded as differentially
expressed only if they exhibited at least a 2.0-fold difference in
abundance between control and treatment.
In situ digestion of protein
Protein points were cut down from gels by silver
stain, decolored using decolorizing solution [30 mM
K3Fe(CN)6, 100 mM
Na2S2O3]. Next, samples were
reducted and alkylated with 100 mM NH4HCO3
(10 mM DTT in it). After enzymolysis using TPCK-Trypsin enzyme
solution (TPCK-Trypsin 0.02 g/l, 20 μM HCl, 40 mM
NH4HCO3, 10% acrylonitrile) for 16 h, samples
were extracted with extraction solution (5% trifluoroacetic acid,
50% acrylonitrile) for 1 h.
CapLC-ESI-Q-TOF-MS analysis
All of the data were from Micromass Q-Tof micromass
spectrometer. CapLC elution peptide fragments were assayed by MS
and MS/MS after entering mass spectrometry ion source: positive ion
detection mode, the source temperature at 80°C, cone hole voltage
60 V, nozzle voltage 3000 V, the detector voltage of 2700 V,
instrument level (MS) scanning range was set to 200–1600.
Conversion between primary MS and secondary MS controlled by mother
ionic strength and electric charge, secondary MS analysis to
analyze the primary ion of the set threshold value; each analysis
of the four greatest intensity mother ion using Glu-fib pieces of
tandem calibration instrument. MassLynx software picked each MS and
MS/MS data under the elution of salt concentration converted into
PKL file by proteinLynx software containing primary mother ion size
(m/z), intensity and the size of the pieces of the secondary ion,
which was inputted into database (NCBI), and searched using the
cascade mass spectrum data function (MS/MS ions search) of the
Mascot software (Matrix Science, Ltd., London, UK). Database search
parameters are: carbamidomethyl (C) is the fixed modification,
trypsin the lyase, allow two as the maximum missed cleavages, the
peptides Mw tolerance 1.2, the fragment ions Mw tolerance 0.6, and
50 results are shown. We confirmed protein identification on the
basis of peptide identification as long as the peptide score (Mowse
score) was higher than its threshold.
RT-PCR analysis
Total RNA was extracted from cells using TRIzol
reagent (Invitrogen). The RT-PCR kit (Thermo Fisher Scientific) was
used to perform reverse transcription, and the PCR kit (Promega)
was applied to implement PCR analysis. Primer sequences were as
follows: DJ-1, F, 5′-GTC AGC AGC TTC TAC CTG GAC-3′ and R, 5′-GTG
TTG TTC TGA GAG TGA AAG GCA CG-3′; cofilin 1, F, 5′-CAA GAA GGC GGT
GCT CT-3′ and R, 5′-ACA AAG GTG GCG TAG GG-3′; β-actin, F, 5′-ACA
CTG TGC CCA TCT ACG AGG GG-3′ and R, 5′-ATG ATG GAG TTG AAG GTA GTT
TCG TGG AT-3′; RhoGDI2, F, 5′-GGG GCA TCA TCA AGA GCA-3′ and R,
5′-CCA GGC AGT TGT GGG AGT-3′; β-actin, F, 5′-ACA CTG TGC CCA TCT
ACG AGG GG-3′ and R, 5′-ATG ATG GAG TTG AAG GTA GTT TCG TGG AT-3′;
calreticulin (CTR), F, 5′-GGA AGA TGA GGA GGA AGA TGT C-3′ and R,
5′-CAG GAA GGA GAG CAG ATG AAA T-3′; β-actin, F, 5′-GGA CCT GAC TGA
CTA CCT C-3′ and R, 5′-TAG TCG TTC GTC CTC ATA C-3′; PCNA, F,
5′-AGT CAG TCT TCA GGA TGT GCT-3′ and R, 5′-TGA CAT GGG ATG CTA GGC
TT-3′; β-actin, F, 5′-TGG CAT CCA CGA AAC TAC CT-3′ and R, 5′-TCA
CCT TCA CCG TTC CAG TT-3′. The PCR products were assayed on a 2%
agarose gel having ethidium bromide. Densitometric quantitation of
PCR products was identified using the Labwork analysis software.
The ratio of target gene to β-actin was quantified to get the
relative fold-changes in gene expression.
Western blot analysis
Protein samples (3 μg each) were analysed by
12% SDS-PAGE, and transferred onto PVDF membranes. The membranes
were blocked for 2 h at room temperature in blocking buffer (3%
skim milk/0.1% Tween-20/TBS), and then incubated with the primary
antibodies (DJ-1 antibody and β-actin; Santa Cruz Biotechnology,
Inc., Santa Cruz, CA, USA; cofilin 1, RhoGDI2, CTR and PCNA; Abcam)
at 4°C overnight. After washing with 0.1% Tween-20/TBS (TBST) for
10 min, three times, the blots were covered with HRP-conjugated
secondary antibody (Abcam) in blocking buffer for 2 h. The
membranes were washed with TBST, the blot was assayed by the super
signal ECL detection system.
Statistical analyses
All experiments were repeated three times, and data
are shown as the mean ± SEM. SPSS 17.0 software was used to perform
statistical analyses. Statistical analyses were evaluated using
one-way ANOVA. A P-value <0.05 was considered statistically
significant.
Results
Antiproliferative and differentiation
induction effect of DADS on HL-60 cells
Proliferation activity of human leukemic cell line
HL-60 was analyzed using MTT assay and trypan blue dye exclusion
test incubating with DADS at different doses. A dose-dependent
cytotoxicity was observed at 72 h DADS-treatment with growth IR of
18, 30, 37, 48, 58 and 70% for 4, 8, 16, 32, 64 and 128 μM,
respectively compared to untreated cells as shown in Fig. 1A.
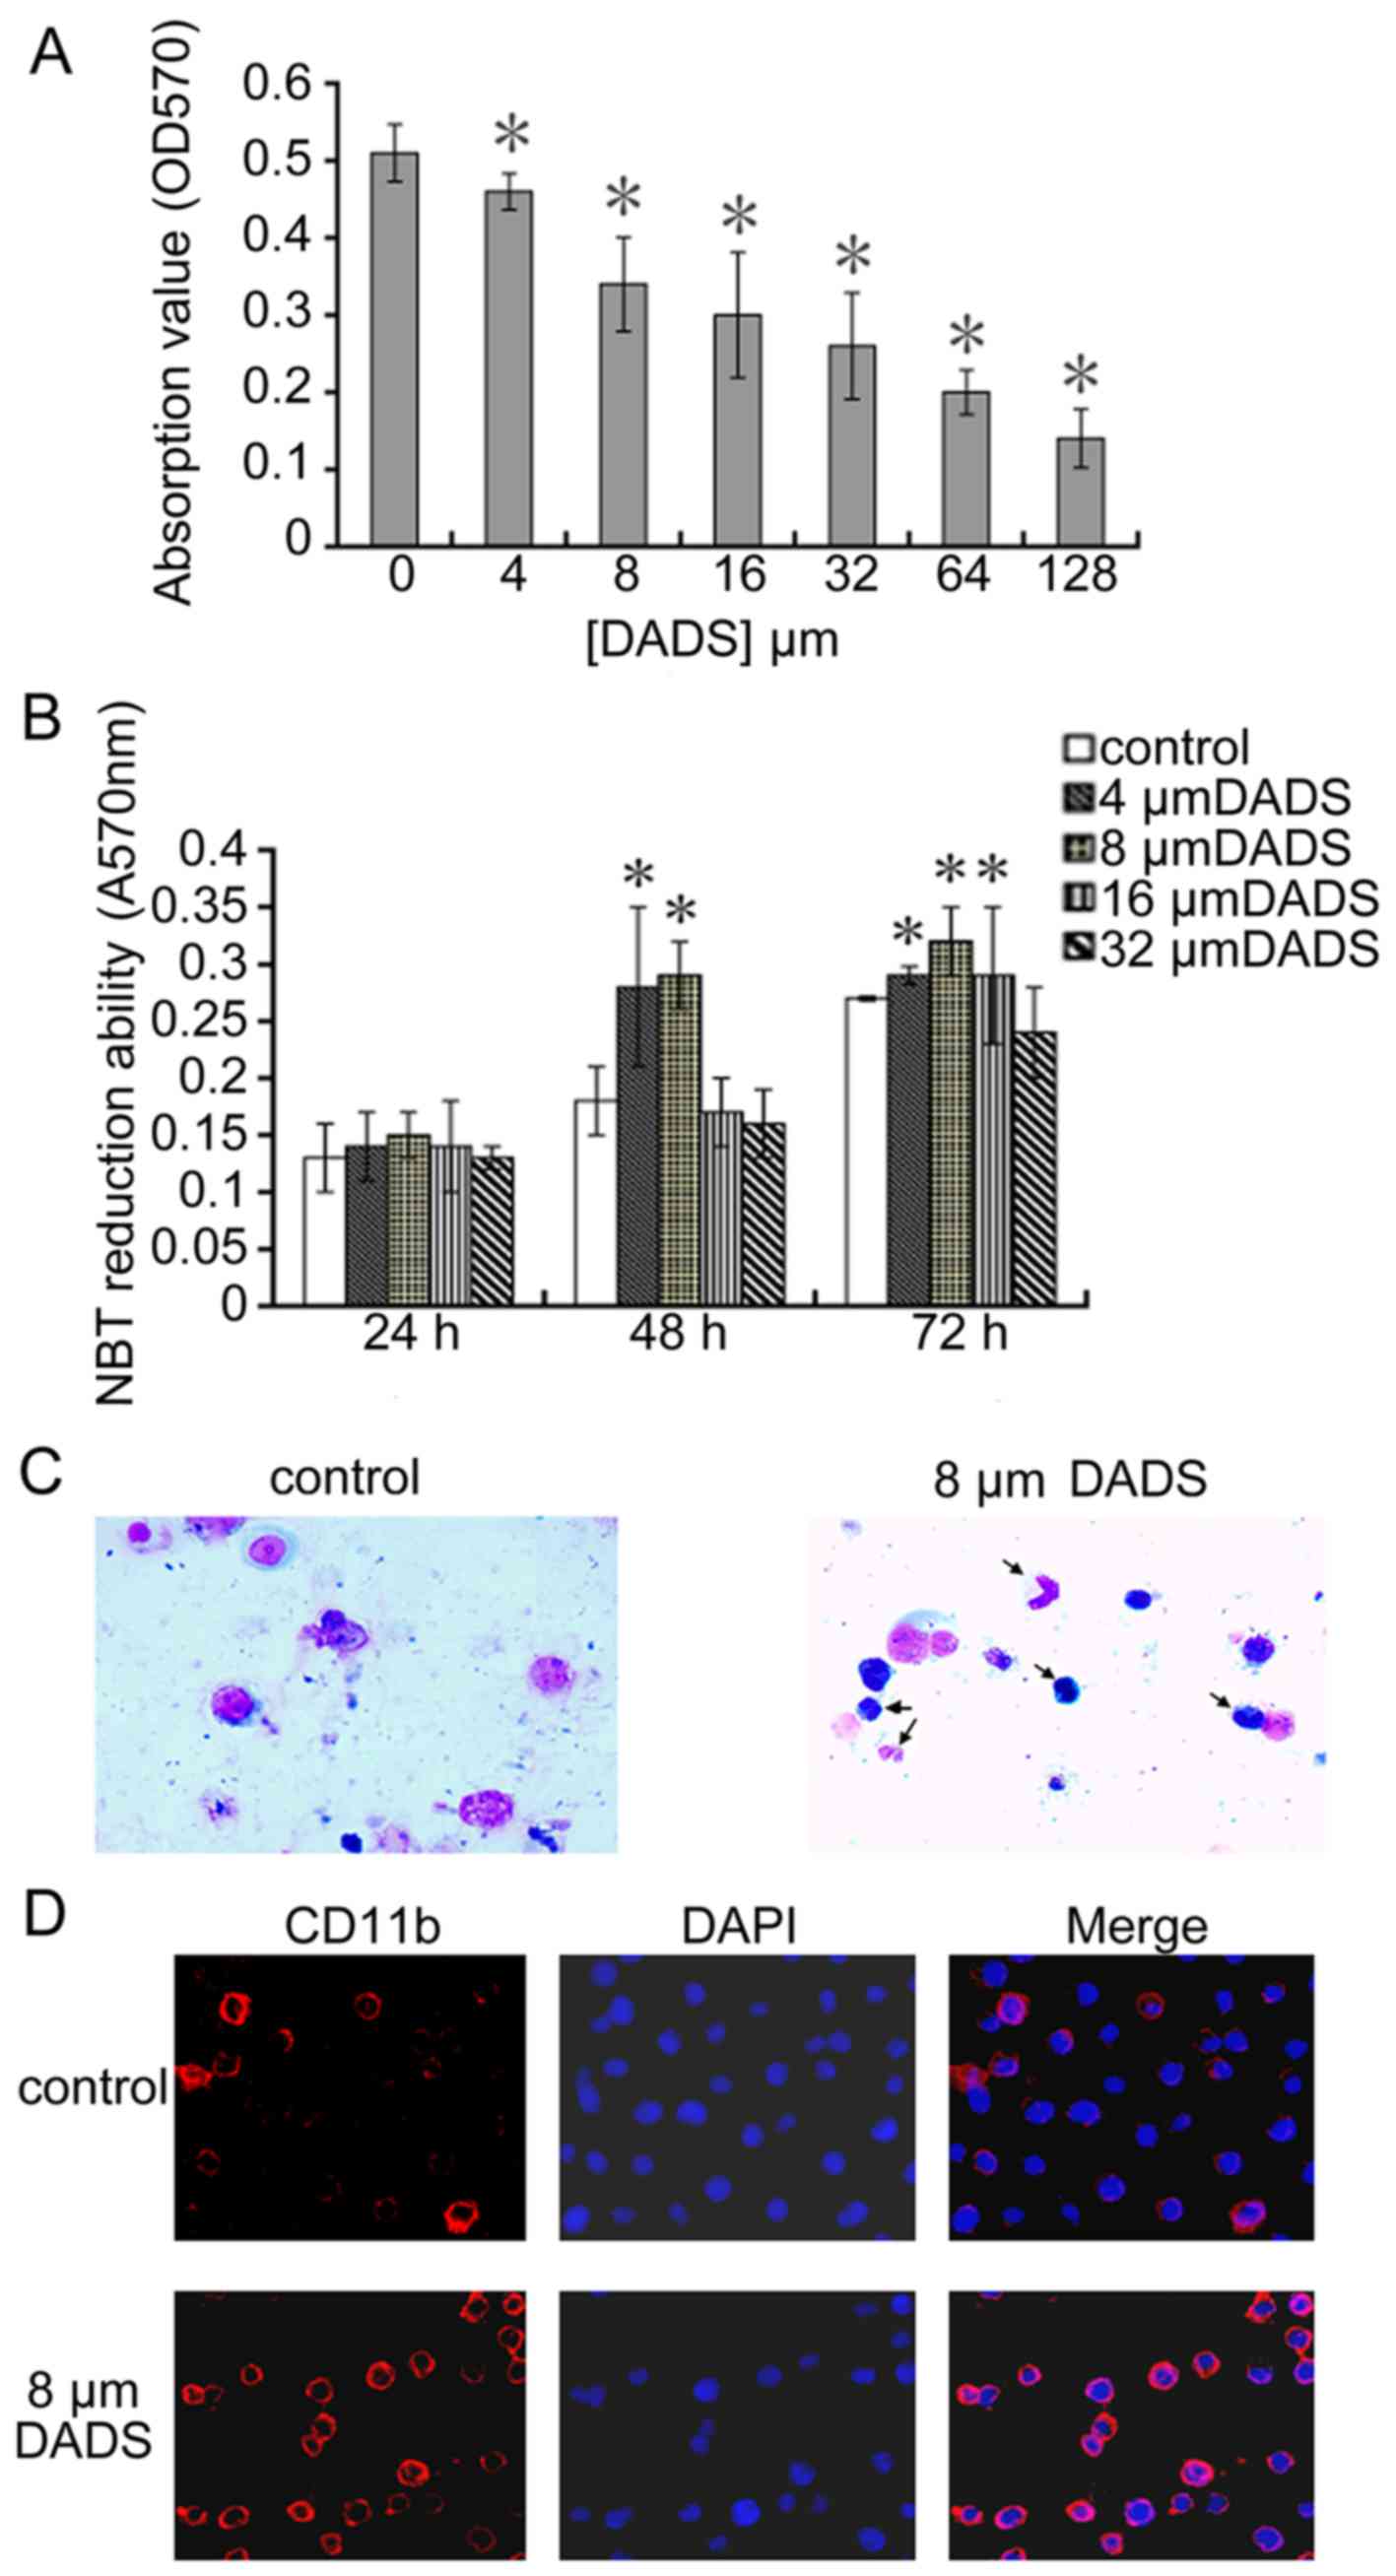 | Figure 1Antiproliferative and differentiation
induction effects of DADS on human leukemic cell line HL-60. (A)
Effect of DADS on cell viability of cell line HL-60. Cells
(3×10⁴) were treated with different concentration of
DADS (4, 8, 16, 32, 64 and 128 μM) and control (0.1%
Tween-80 only) for 72 h and the viable cells were analyzed by MTT
assay. (B) Effect of DADS on NBT reduction in HL-60 cells. HL-60
cells were treated with 4, 8, 16 and 32 μM DADS for 24, 48
and 72 h. Control cells were exposed to 0.1% Tween-80.
Differentiation of HL-60 cells was identified by the decrease in
NBT absorbance at 570 nm. The values are the means ± SEM of three
determinations. *P<0.05 compared with control. (C)
Role of 8 μM DADS on morphological change of HL-60 cell
differentiation. HL-60 cells were treated with DADS for 72 h.
Control cells were exposed to 0.1% Tween-80. We collected cells by
centrifugation, stained with Wright-Giemsa stain and observed using
light microscopy (×400). (D) Effect of DADS on expression of cell
surface differentiation marker CD11b. HL-60 cells were treated with
DADS (8 μM) for 72 h and then were fixed in 4%
formaldehyde/PBS and permeabilized with 0.5% Triton X-100. CD11b
was showed by immunofluorescence (red, left panel). The
DNA-intercalating dye DAPI was used to recognize cell nuclei (blue,
center panel). The right panel displayed a merged image to
highlight the nuclear pool of CD11b. |
As shown in Fig.
1C, untreated HL-60 cells showed typical myeloid leukemia cell
morphology with big oblong nucleus, small cytoplasm, and large
ratio of nucleus to cytoplasm, while 8 μM DADS induced a
granulocytic lineage of differentiation (arrow). Moreover, to
ascertain the role of DADS on differentiation, we investigated the
NBT reduction assay and the expression of CD11b in HL-60 cells. As
shown in Fig. 1B and Table I, compared to untreated control, 8
μM DADS could markedly induce the differentiation. In
Fig. 1D, the expression of the
CD11b increased after treated with 8 μM DADS for 3 days as
compared to the control.
 | Table IDADS-induced differentiation effect
in HL-60 cells. |
Table I
DADS-induced differentiation effect
in HL-60 cells.
| Group | Classification of
cells
| Induction
differentiation rate (%) |
|---|
| Promelocyte | Myelocyte | Metamelocyte | Band cell and
PMN |
|---|
| HL-60 cells | 0.85±0.006 | 0.145±0.008 | 0 | 0 | 0 |
| 8 μM
DADS | 0.063±0.150 | 0.150±0.021 | 0.113±0.036 | 0.673±0.025a | 91.3±2.1a |
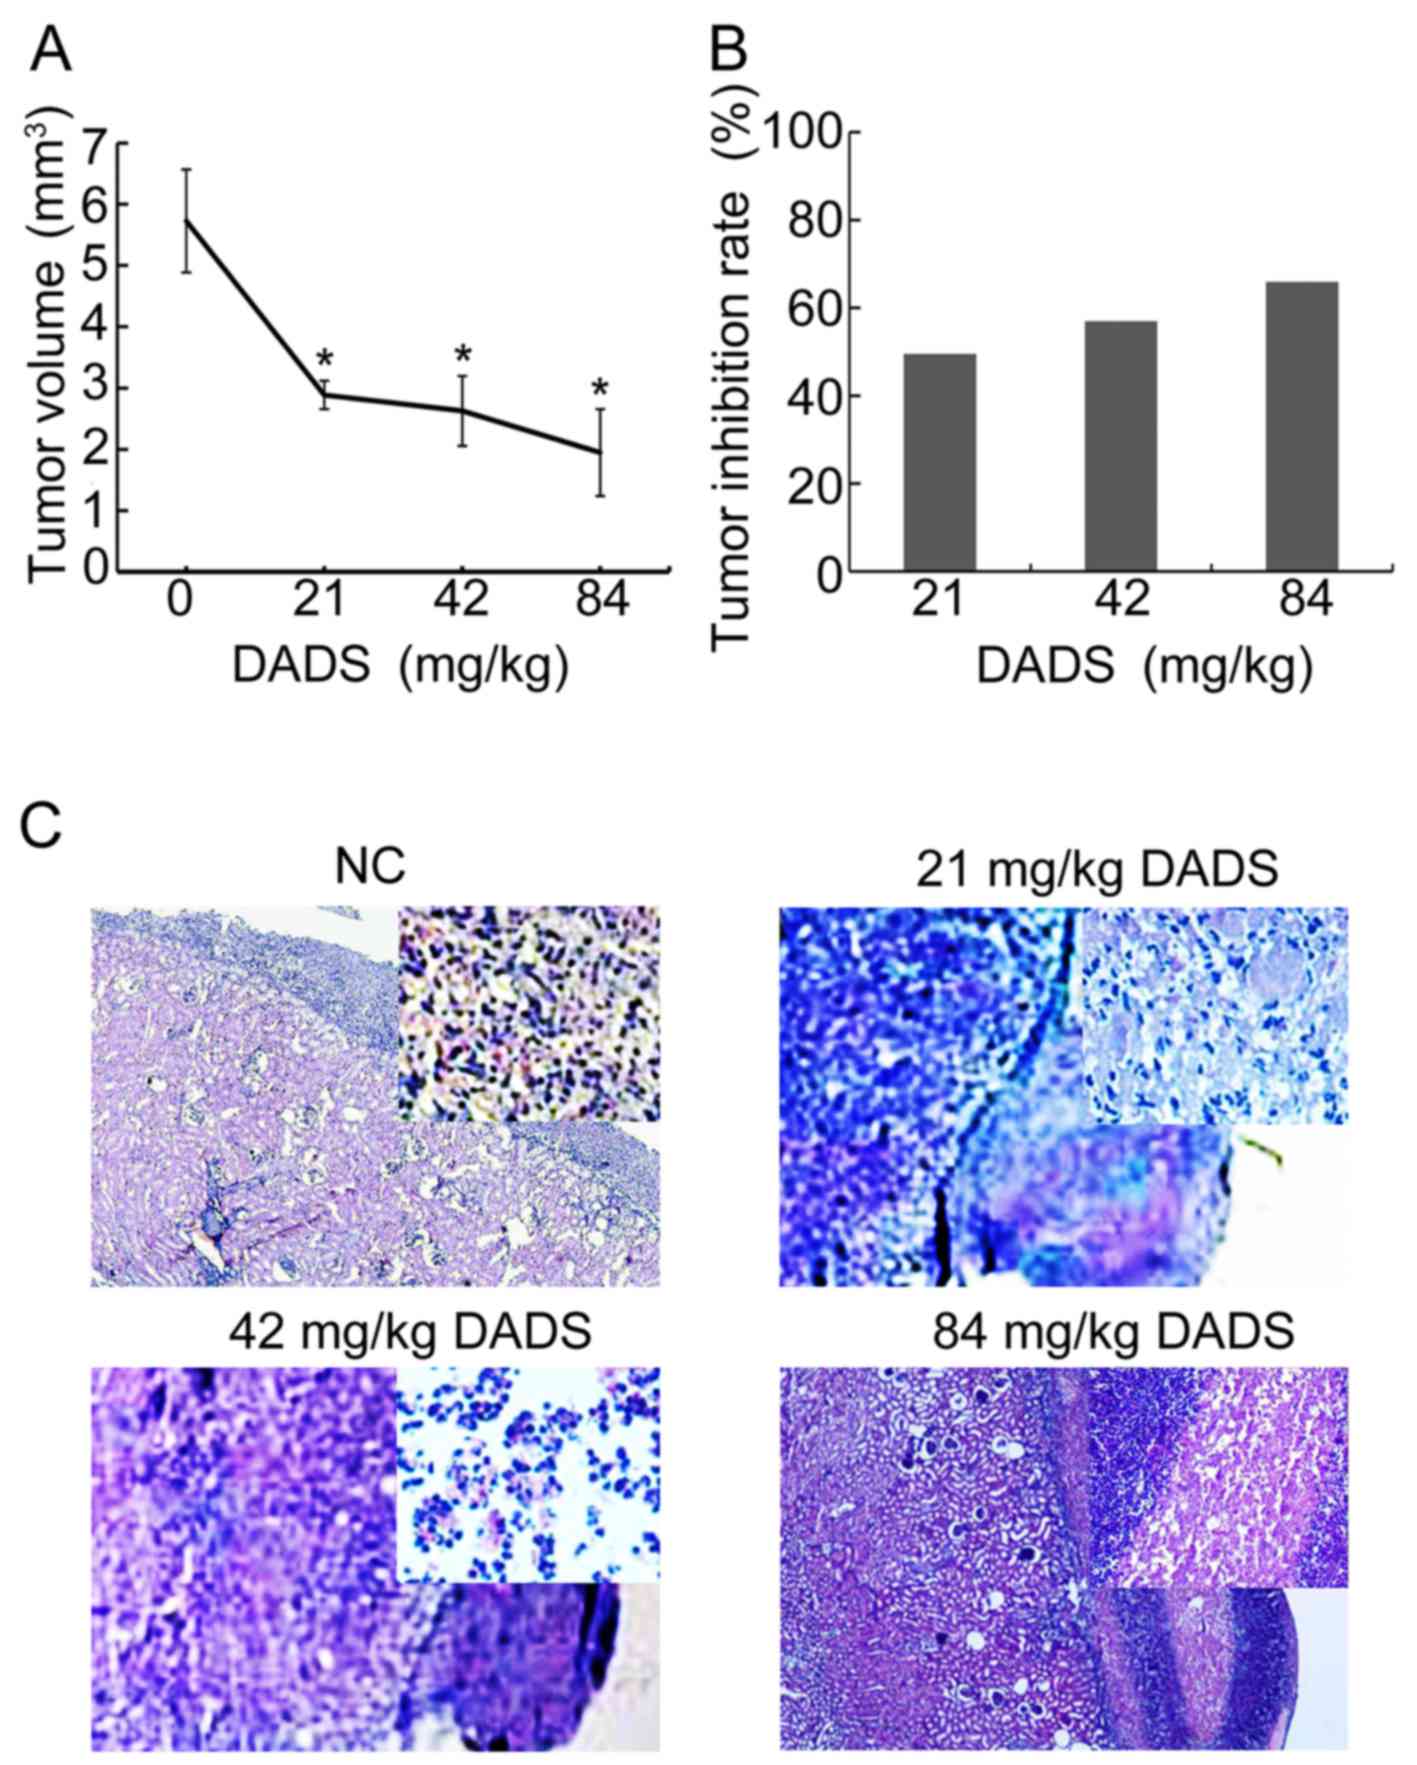
DADS induces growth inhibition and
differentiation effect on HL-60 cells in vivo
To detect the role of DADS in leukemia in
vivo, HL-60 cells were injected into mice and the growth of
xenograft tumors was measured after DADS injection for five days.
DADS tumors grew much slower than control tumors (Fig. 2A). The tumor inhibition rate rose
from 49.5, 56.9 to 65.9% by DADS of 21, 42 to 84 mg/kg body weight
every day for 5 days compared to control tumors (Fig. 2B), suggesting that DADS controlled
xenograft tumor progression.
H&e staining results revealed that the
differentiation effect was induced by 21 mg/kg, ~42 mg/kg DADS in
the HL-60 cells under the renal capsule membrane. Optical
microscopy (×40) showed that the volume of the cells reduced, dye
of nuclei was obviously lighter, with kidney-like or lobulated
nucleus, and the nucleo-cytoplasmic ratio of HL-60 cells was fairly
small, which presented typical myeloblastic morphology, with a
granulocytic lineage differentiation. Whereas, 84 mg/kg DADS
induced necrosis in HL-60 cells clearly under renal capsule
membrane (Fig. 2C).
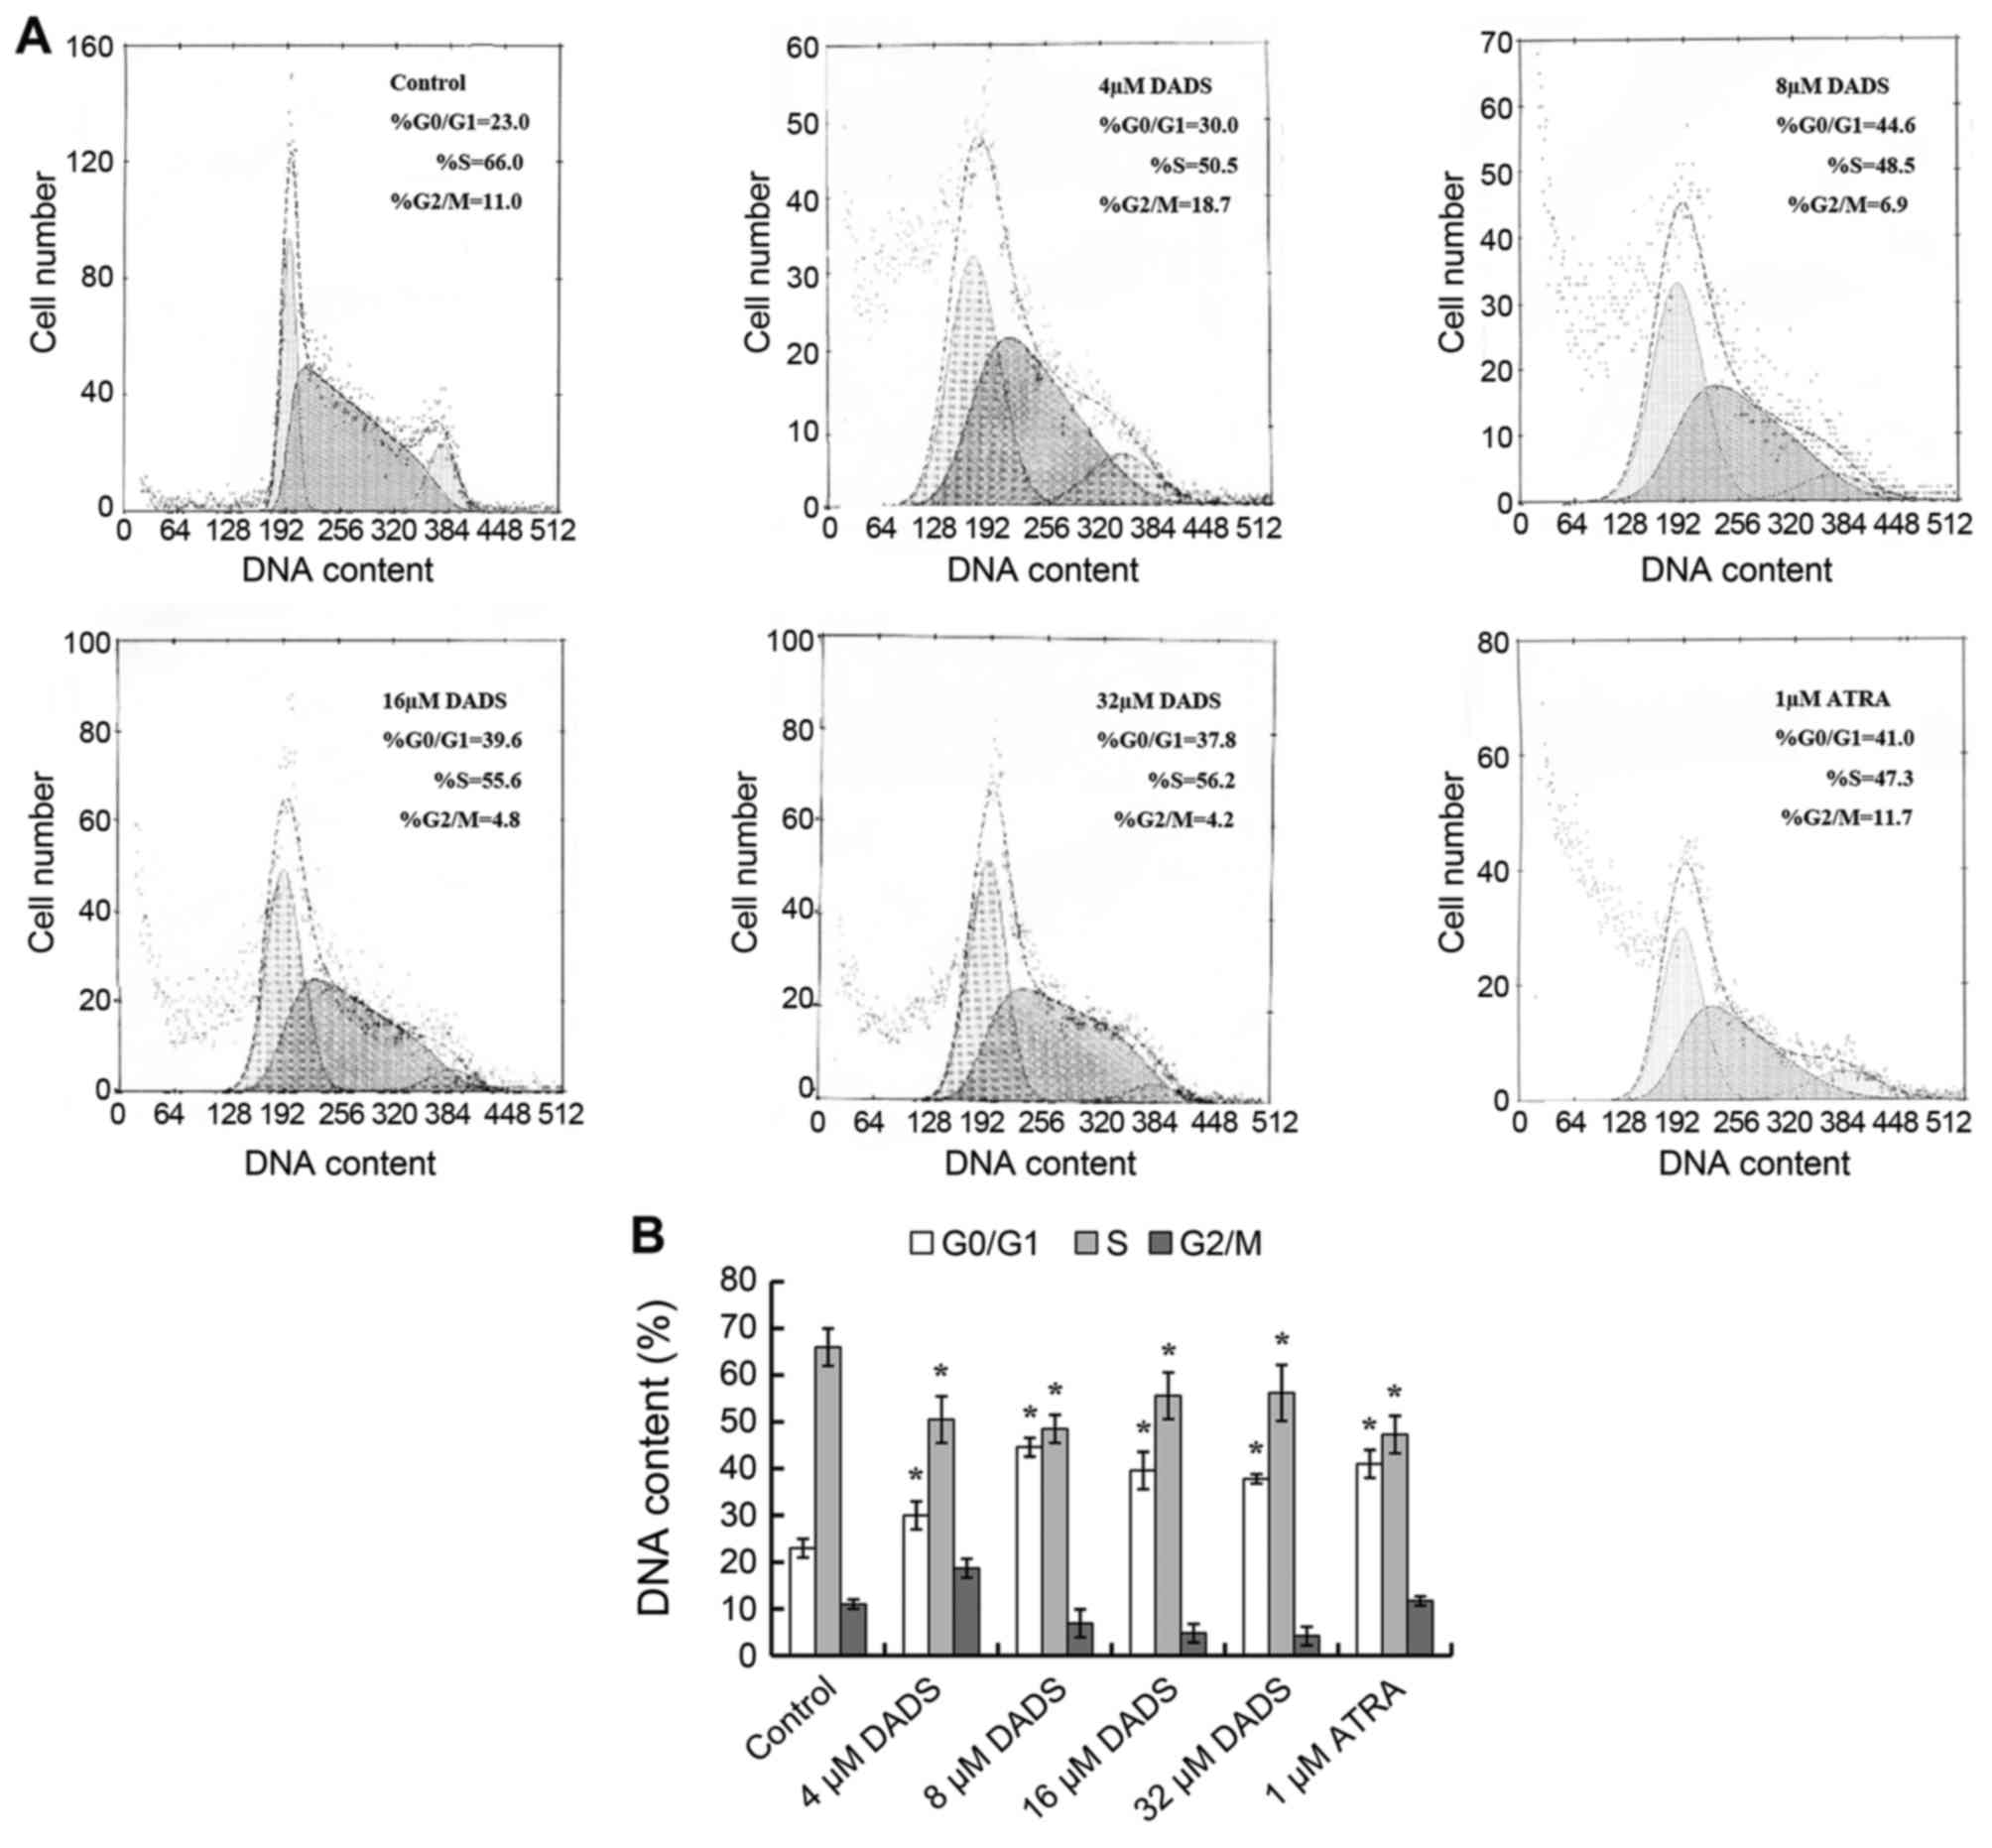
The effect of DADS on cell cycle of HL-60
cells
As shown in Fig. 3,
DNA contents from flow cytometry analysis indicated that among the
untreated HL-60 cells, 66% were distributed in S phase, 23% were
accumulated in G0/G1 phase, and only 11% were
in G2/M phase. Increase of G0/G1 cells and
corresponding decrease of S cells were dose-dependent when HL-60
cells were treated by 4, 8, 16 and 32 μM DADS. It was
detected that G0/G1 cells were raised to the
peak (44.6%, P<0.05), although S phase cells declined to a
minimum (48.5%, P<0.05) respectively at the concentration of 8
μM, similar to effects induced by ATRA.
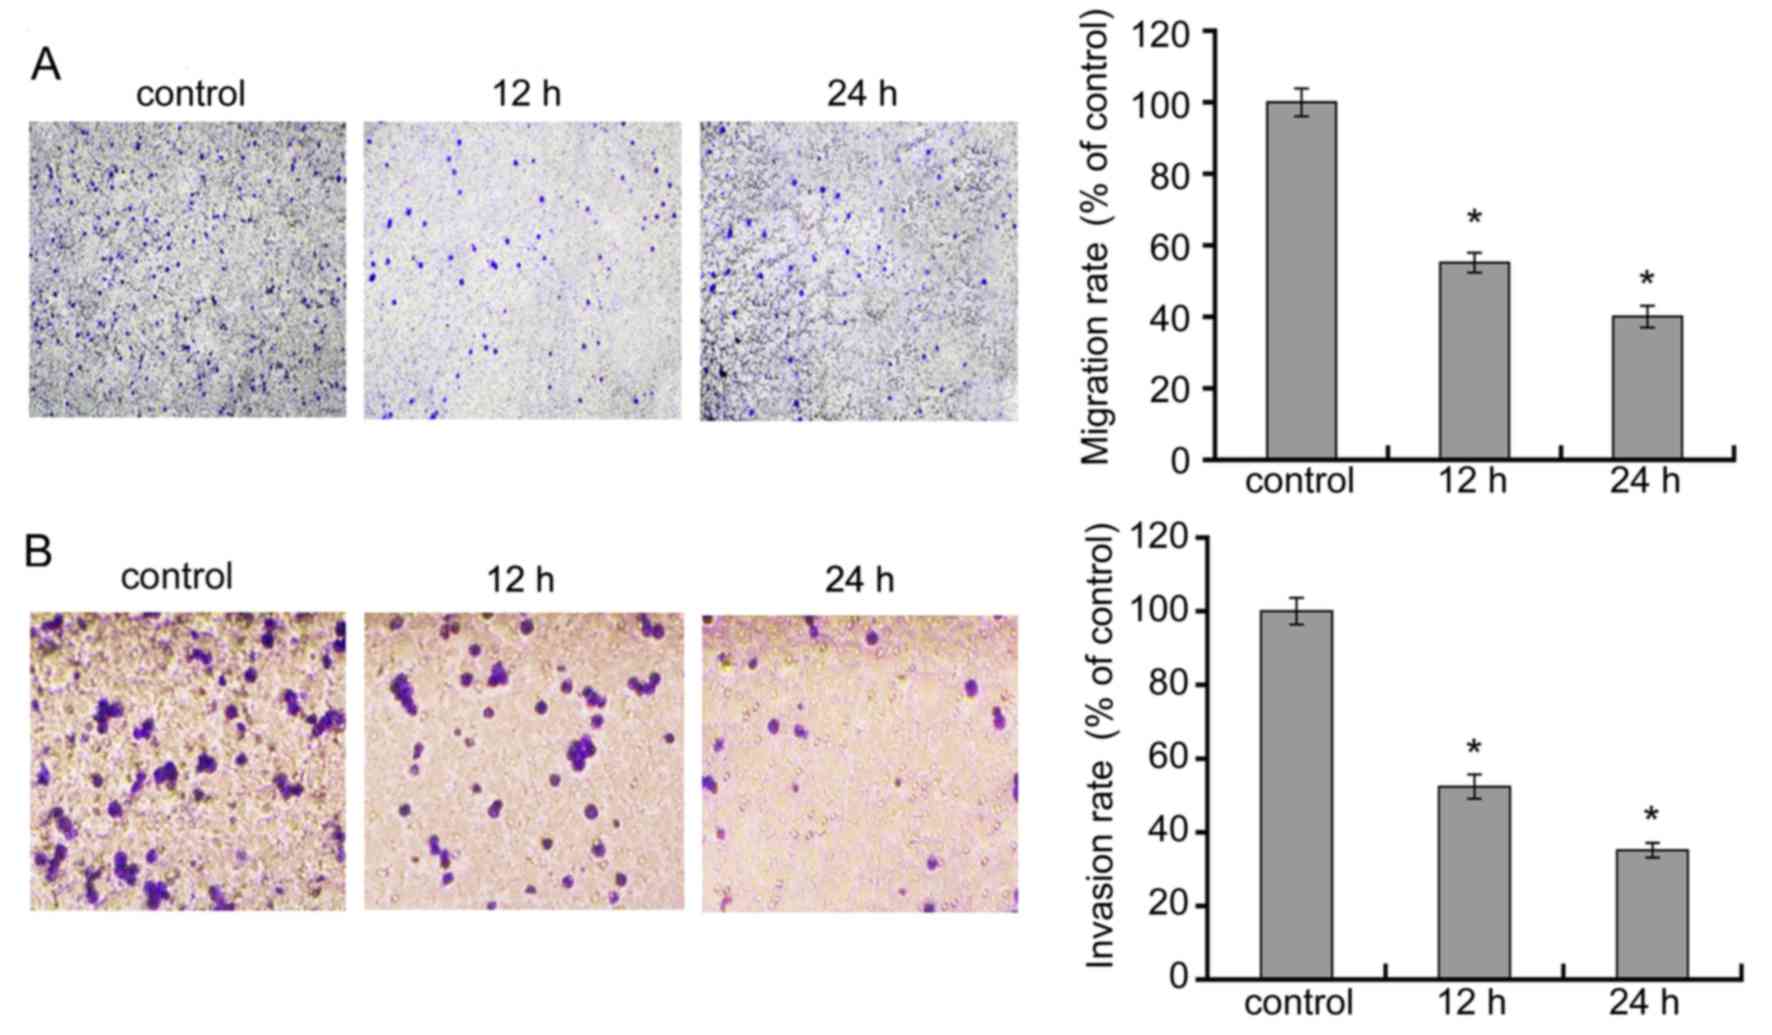
DADS inhibits HL-60 cell migration and
invasion
We treated cells with 8 μM DADS for 12 and 24
h, and observed the effects of DADS on migration and invasion of
leukemia HL-60 cell line. As showed in Fig. 4A, relative to HL-60 control cells,
there was a remarkable decline in the migratory capacity of HL-60
cells in 8 μM DADS for 12 and 48 h. As demonstrated in
Fig. 4B, the amount of cells that
crossed the membrane in the DADS-treatment group were markedly
lower than those in the control group. These data suggest that DADS
significantly suppressed migration and invasion activities of HL-60
cells.
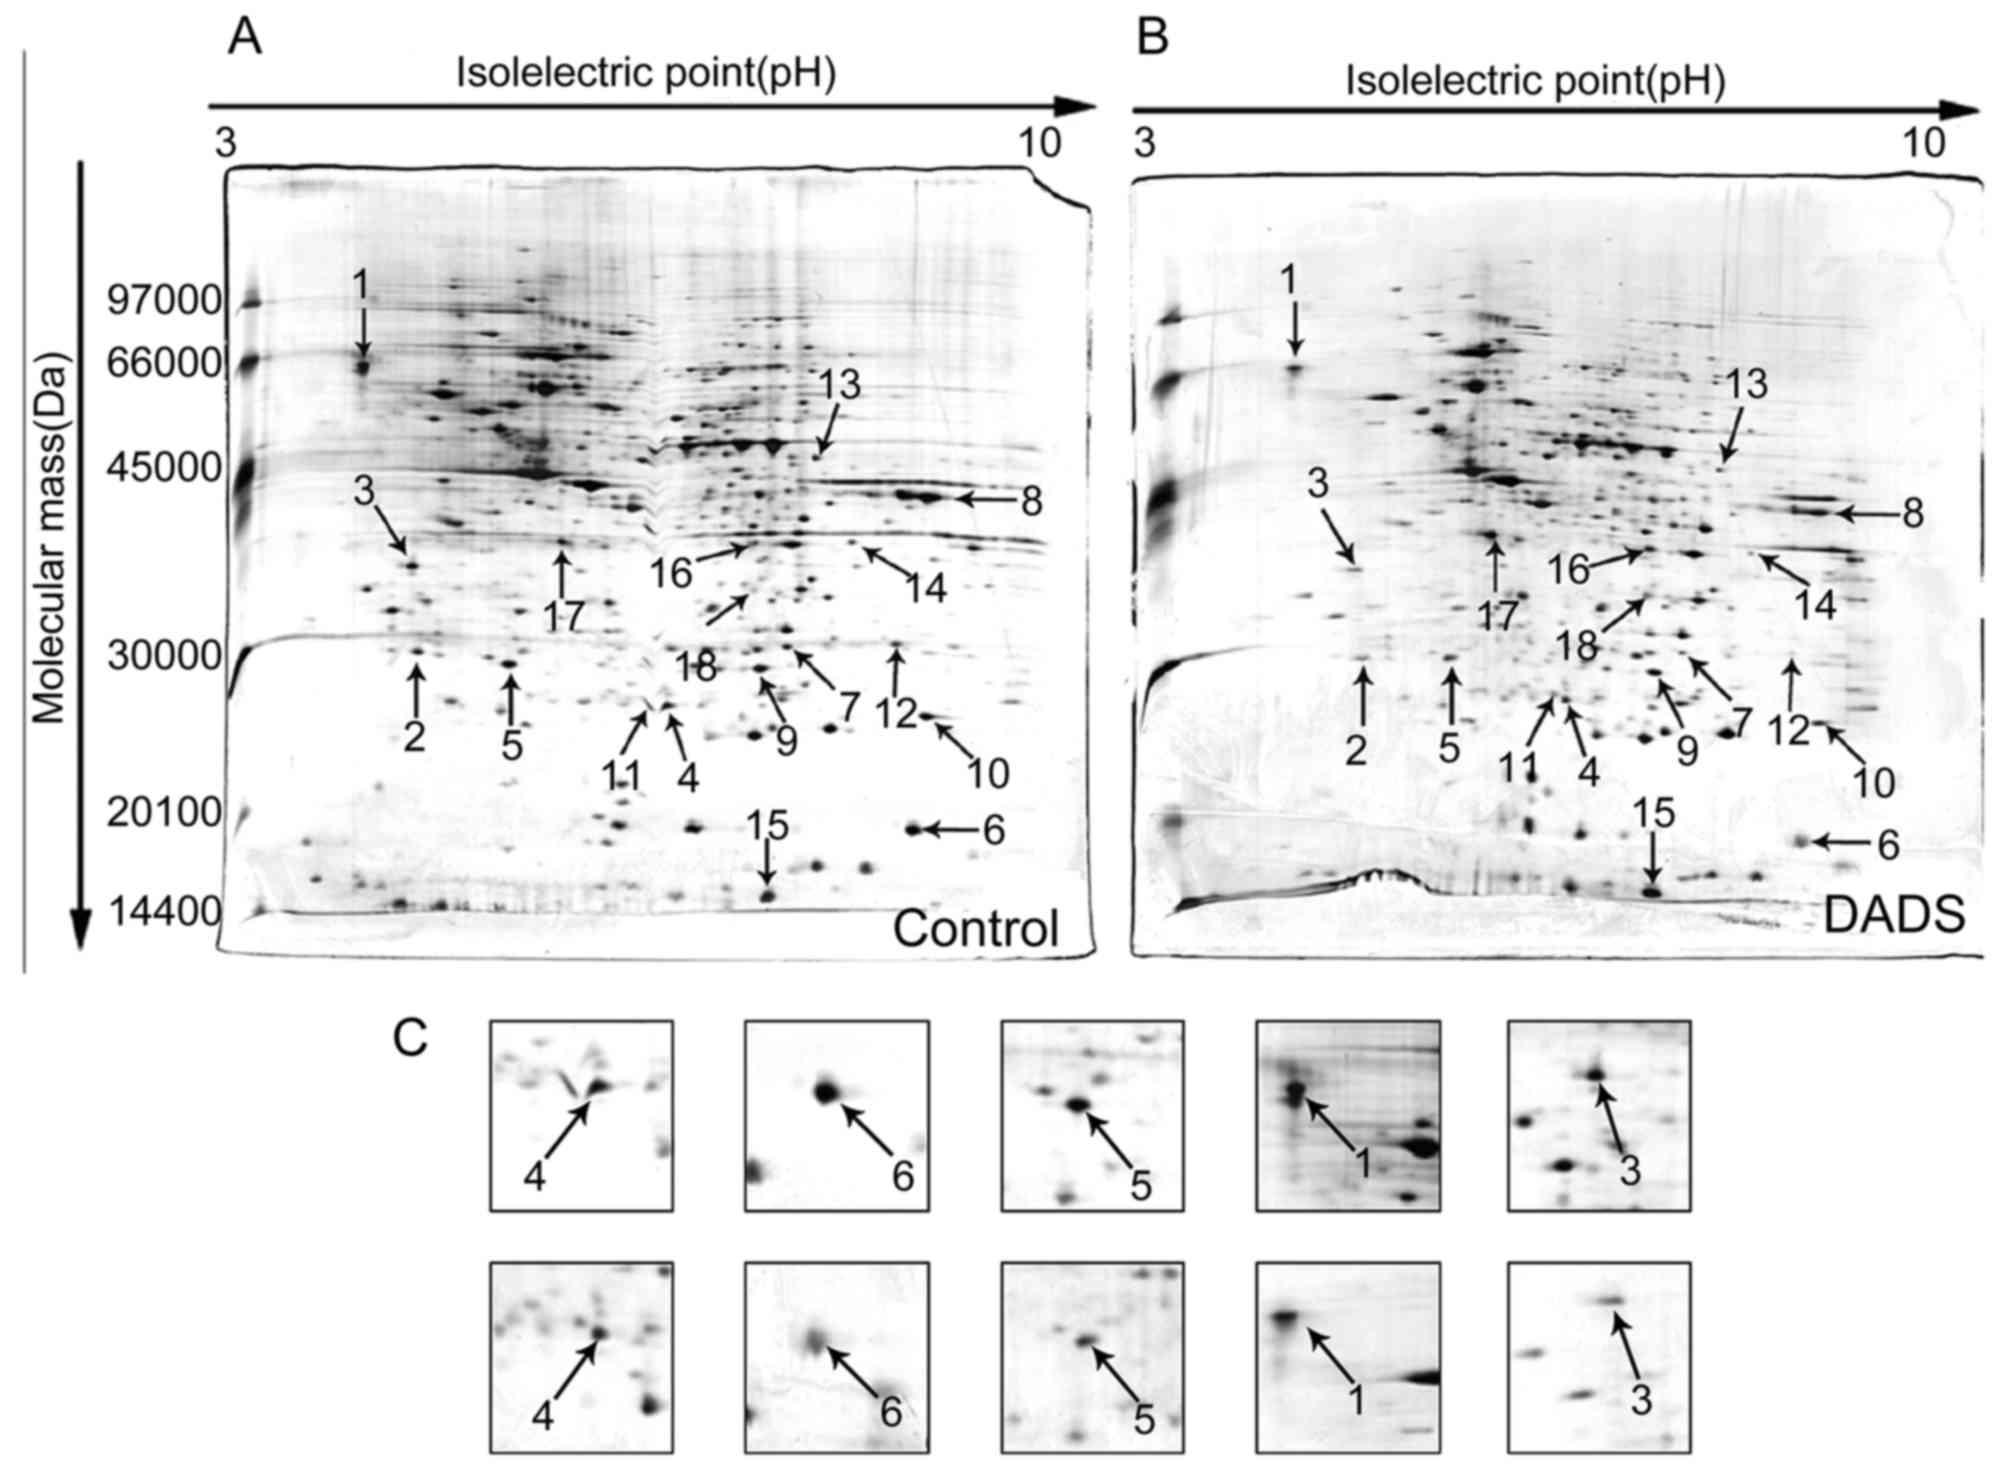
Identification of differential expression
proteins by 2-DE and MS
To detect differential expression proteins induced
by DADS, HL-60 cells were exposed to 8 μM DADS for 72 h.
Proteins from DADS-treated and untreated cells were resolved by
2-DE, respectively, and the gels were stained with silver to make
visible the protein spots in the 2-DE gels. Two typical 2-DE maps
from DADS-treated and untreated groups are exhibited in Fig. 5A and B, respectively. By comparing
the ratio of each spot in the gels, it was identified as
distinguishingly expressed that protein spots have constant
differences (≥2-fold) between DADS-treated group and the untreated
group in triplicate experiments. All differential protein spots
were resected from stained gels and digested with trypsin. Eighteen
differently expressed proteins were identified on the basis of
CapLC-ESI-Q-TOF-MS and database query with NCBI (Table II). These protein spots were
marked with arrows in Fig. 5A and
B. Compared with the untreated group, the expression levels of
four proteins were upregulated, while the expression levels of the
other 14 proteins were downregulated in DADS-treated group.
| Table IIDifferential expression proteins
induced by DADS in HL-60 cells. |
Table II
Differential expression proteins
induced by DADS in HL-60 cells.
| SPOT no. | Accession no. | Protein name | Theoretical Mr
(kDa)/pI | Expression
alteration |
|---|
| 1 | P27797 | Calreticulin
(precursor) | 48.1/4.29 | Downregulated |
| 2 | P28066 | Proteasome subunit
α type 5, Proteasome zeta chain multicatalytic endopeptidase
complex zeta chain | 26.4/4.74 | Downregulated |
| 3 | P12004 | Proliferating cell
nuclear antigen, PCNA, cyclin | 28.8/4.57 | Downregulated |
| 4 | O14805 | RNA-binding protein
regulatory subunit, DJ-1 protein | 19.8/6.33 | Downregulated |
| 5 | P52566 | Rho
GDP-dissociation inhibitor 2, Ly-GDI | 22.99/5.10 | Downregulated |
| 6 | P10668 | Cofilin, non-muscle
isoform, CFL1 | 18.5/8.16 | Downregulated |
| 7 | P00918 | Carbonic anhydrase
II | 29.1/6.86 | Downregulated |
| 8 | P04075 | Aldolase A,
muscle-type aldolase, Fructose-bisphosphate aldolase A | 39.3/8.39 | Downregulated |
| 9 | P60174 | Triosephosphate
isomerase | 26.5/6.51 | Downregulated |
| 10 | Q06830 | Peroxiredoxin 1,
Thioredoxin peroxidase 2 | 22.1/8.27 | Downregulated |
| 11 | P30048 |
Thioredoxin-dependent peroxide reductase,
mitochondrial (precursor), peroxiredoxin 3 | 27.7/7.68 | Downregulated |
| 12 | P54819 | Adenylate kinase
isoenzyme 2, ATP-AMP transphosphorylase | 26.3/7.85 | Downregulated |
| 13 | Q14590 | Zinc finger protein
93 | 1.63e+003 | Downregulated |
| 14 | P04406 |
Glyceraldehyde-3-phosphate
ehydrogenase | 4.77e+004 | Downregulated |
| 15 | Q05315 | Eosinophil
lysophospholipase, Charcot-Leyden crystal protein, Galactin-10 | 16.3/6.80 | Upregulated |
| 16 | Q14103 | Heterogeneous
nuclear ribonucleoprotein D0, hnRNP D0, AUF1 | 38.4/7.61 | Upregulated |
| 17 | Q15149 | Plectin 1,
Hemidesmosomal protein 1 | 531.7/5.73 | Upregulated |
| 18 | P13804 | Electron transfer
flavoprotein α-subunit | 35.1/8.62 | Upregulated |
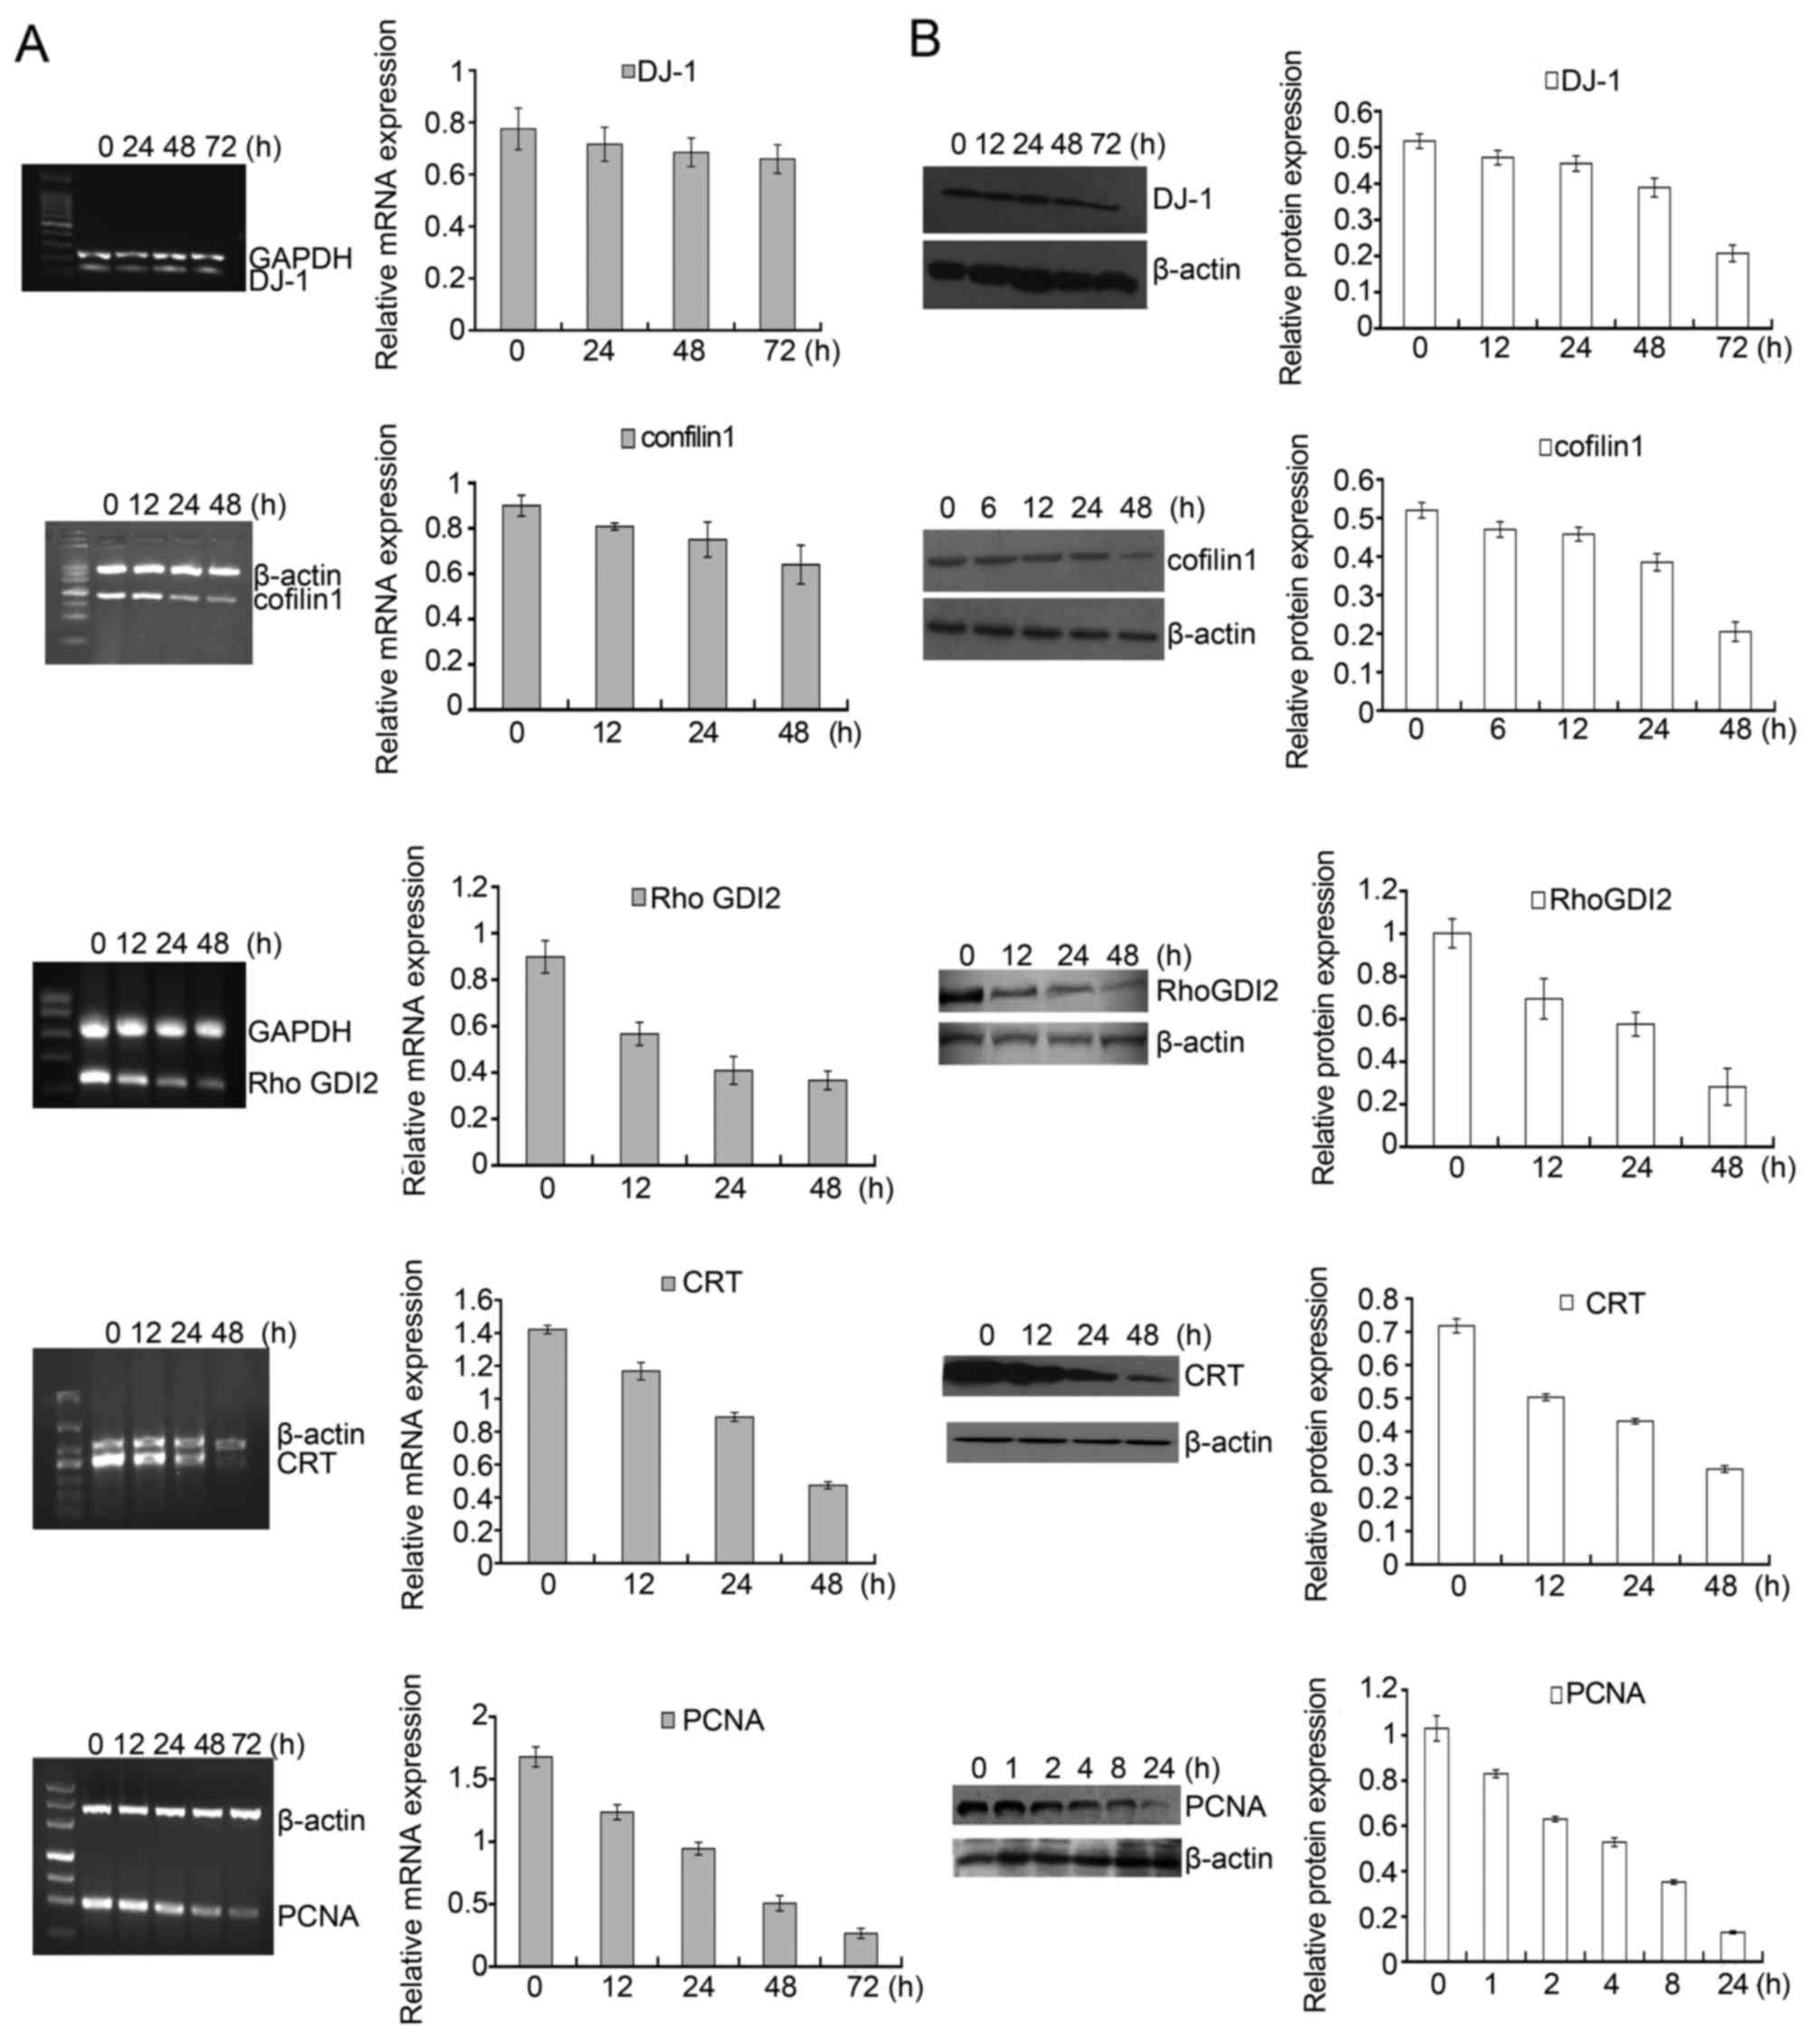
Verification of DADS-induced differential
expression genes in HL-60 cells
Among the identified proteins, DJ-1, cofilin 1,
RhoGDI2, CTR and PCNA displayed significantly differential
expression in DADS-treated cells in contrast to untreated cells.
Fig. 5C showed a representative
comparison of the five proteins. These five proteins were further
verified. RT-PCR and western blot analysis were applied to detect
the expression pattern of these five genes after HL-60 cells were
treated with 8 μM DADS for different time periods. As shown
in Fig. 6A, the mRNA levels of
DJ-1, cofilin 1, RhoGDI2, CTR and PCNA decreased in a
time-dependent manner. Accordingly, similar changes in protein
levels were also showed in HL-60 cells upon DADS treatment
(Fig. 6B). Consequently,
DADS-induced changes in gene expression were identified at the
transcriptional and translational levels, which agreed with the
results from comparative proteomics research.
Discussion
DADS is the main active component of the anticancer
allyl sulphides in garlic, which has been reported to induce
proliferation inhibition in many types of tumor cells (8). Our results suggested that DADS
inhibited proliferation in leukemia cell line HL-60 and arrested
cells in G0/G1 phase. Previously we confirmed
that DADS induced differentiation in human gastric cancer cell line
MGC803 by suppressing the activation of ERK1/2 MAP kinase signaling
pathway (13). In the present
study, we investigated the role of DADS on the differentiation in
human leukemia HL-60 cells in vitro and in vivo. The
cells were examined by Wright-Giemsa staining, NBT reduction,
membrane differentiation marker CD11b expression, as well as the
distribution of cell cycle phase. Our results show that 8 μM
DADS results in greater reduction of NBT and expression of
granulocytic marker CD11b, and induces HL-60 cell granulocytic
lineage of differentiation. Furthermore, DADS induced
G0/G1 arrest as well as growth inhibition and
differentiation effect on HL-60 cell xenografts under renal capsule
membrane in mice. We compared the cell cycle division in 8
μM DADS-treated cells with that in 1 μM ATRA-treated
cells, it showed that DADS can induce increased
G0/G1 cells and corresponding decrease of S
cells similar to effects induced by ATRA. Except that, we have also
found that proliferation inhibition ratios had no significant
difference of HL-60 cells between 8 μM DADS-treated group
and 1 μM ATRA-treated group after 3 days (Table III). In addition, NBT reduction
value of HL-60 cells had no significant difference in DADS-treated
group as compared with that of the 1 μM ATRA-treated group
for 24, 48, 72 and 96 h (Table
IV). That is to say, 8 μM DADS have antiproliferative
and differentiation induction effect in HL-60 cells similar to
effects induced by 1 μM ATRA. These results indicate that
DADS may be an anti-leukemia promising induction compound similar
to ATRA. The mechanisms concerning the induction of differentiation
by DADS have not been thoroughly elucidated.
| Table IIIThe OD570 values and
proliferation inhibition ratios of HL-60 cell treated by DADS or
ATRA after 3 days. |
Table III
The OD570 values and
proliferation inhibition ratios of HL-60 cell treated by DADS or
ATRA after 3 days.
| OD570
value | Proliferation
inhibition ratio (%) |
|---|
| Control | 0.51±0.037 | |
| 8 μM
DADS | 0.34±0.061 | 30 |
| 1 μM
ATRA | 0.32±0.027 | 34 |
| Table IVThe effect of NBT reduction ability
of HL-60 cells treated by DADS or ATRA. |
Table IV
The effect of NBT reduction ability
of HL-60 cells treated by DADS or ATRA.
| Control | 1 μM
ATRA | 8 μM
DADS |
|---|
| 24 h | 0.13±0.03 | 0.16±0.02 | 0.15±0.02a |
| 48 h | 0.18±0.03 | 0.28±0.04 | 0.29±0.03a |
| 72 h | 0.27±0.002 | 0.32±0.03 | 0.32±0.03a |
| 96 h | 1.01±0.23 | 1.41±0.19 | 1.47±0.23a |
It is rarely reported that DADS inhibits the
migration and invasion of cancer cells, and the molecular
mechanisms of DADS have not fully been illuminated. Lai et
al reported that DADS can control the migration and invasion in
human colon cancer Colo 205 cells (14). This study showed that DADS
inhibited migration and invasion of HL-60 cells. However, the
precise molecular mechanisms underlying these antimetastatic
effects of DADS are not completely clarified.
In the present study, we recognized the potential
targets controlled by DADS in HL-60 cells using the comparative
proteomics technique. Among the differentially expressed proteins
regulated by DADS, DJ-1, cofilin 1, RhoGDI2, Calreticulin and PCNA
drew our attention as dysregulation of their expression and
function were associated closely with tumorigenesis and
progression.
DJ-1 was separated during screening for
c-Myc-binding proteins in 1997 (15). Upregulation of DJ-1 expression have
been showed in various cancers, including leukemia (16,17).
Enhanced levels of DJ-1 expression in cancer cells are positively
associated with the severity of cancer with poor prognosis,
including invasion and metastasis (18,19).
The oxidative status of DJ-1 induces cell proliferation and
transformation by regulating PTEN activity (20). The overexpression of DJ-1 and
HSP90α, and a loss of PTEN are related to invasion in urothelial
carcinoma, Lee et al (19).
DJ-1 induces EMT by inhibiting PTEN expression and Akt activation.
As a target of p53 during transformation, DJ-1 plays a key part in
the p53-mediated AKT pathway and p53-driven oxidative-stress
response (21). In this study, it
indicated that the decreased level of DJ-1 by DADS may lead to
differentiation and suppressing growth and invasion in HL-60
cells.
It displayed that the increased level of cofilin 1
expression was definitely related to the progress of human ovarian
cancer differentiation, which demonstrates that the activation of
cofilin 1 may accelerate the proliferation and invasion of cancer
cells, resulting in the development of ovarian cancer (22). Increase level of cofilin expression
induced by diazinon enhanced depolymerization of actin filaments,
and then promoted differentiation in neuroblastoma cell line N2a
(23). Our data revealed that DADS
can decrease cofilin 1 expression in leukemia cells, and
demonstrated that inhibition of cofilin 1 activation may be
correlated with DADS anti-invasion role in leukemia cells.
RhoGDI2 is regarded as a family of Rho GTPase
dissociate inhibitors (GDIs). GDIs are vital regulators of Rho
GTPase function typified by constituting a complex with Rho GTPase,
regulating their nucleotide exchange and membrane association.
Accordingly, they have a crucial effect on mediating the actin
cytoskeleton, cell polarity, microtubule dynamics, membrane
transport pathways and transcription factor activity (24). RhoGDI2 has been confirmed as a
regulator of tumor metastasis, but its function in cancer is still
controversial. RhoGDI2 may conduce to HGF-regulated tumor invasion
and metastasis, which can be used as a hopeful target for gastric
cancer therapy (25). In
hepatocellular carcinoma, RhoGDI2 is upregulated, and has been
identified as a proto-oncogene, and plays a vital part in tumor
growth and invasion (26). RhoGDI2
is reported to have significant effects on cellular apoptosis and
metastasis, and they can lead to the adverse progress of AML
(27). Rac1 was admitted as the
vital co-operator and mediator of RhoGDI2 (28). RhoGDI2 preferentially binds to Rac1
and impacts on its activity, unlike other members of Rho GTPase
(28). Another study showed RhoC
was also regulated by RhoGDI2 (29). Therefore, RhoGDI2 may be a
candidate target for DADS against leukemia cell invasion.
CRT, a multifunctional protein, is mainly located in
endoplasmic reticulum and is extremely conserved in different
species. The relationship between CRT expression levels and
tumorigenesis has been widely analysed in variety of cancers, and
most studies have showed that tumor tissues express remarkably
higher levels of CRT versus normal tissues (30). It also demonstrates that CRT plays
a crucial role in the development of different cancers and the
effect of CRT on tumor formation and progression depends upon cell
types and clinical stages. Upregulated CRT expression may have a
significant impact on cancer progression. Regulation of CRT levels
has deep effects on cancer cell proliferation and angiogenesis as
well as differentiation in neuroblastoma cells; the mechanism that
CRT suppresses cell proliferation, and enhances cell
differentiation is related to upregulating VEGF expression
(31). Lu et al verified
that CRT plays a critical role in the control of cell adhesion and
migration via various mechanisms (32). In this study, we revealed that DADS
decreased CRT expression in leukemia HL-60 cells. We consider that
the inhibitory impact on CRT expression induced by DADS may
contribute to its anticancer role in leukemia HL-60 cells.
It is reported that different protein profiles were
discovered between the melanoma cell line and the melanocytes; the
basic form of protein DJ-1, cofilin 1 and calreticulin were more
significantly expressed in melanoma A375 cells than in melanocytes
(33). When Qin et al
compared the expression profiles of differential proteins of
retinoic acid (RA) resistant group and sensitive cells, they
screened the proteins related to RA resistance by proteomic
analysis, the results indicated that DJ-1 and calreticulin are
involved in the ATRA resistance-associated proteins (34).
PCNA is considered as a molecular marker for
proliferation, which is based on its function in replication. Over
the past decades, further research has given a deeper understanding
of PCNA as a coordinator of fundamental cellular role in cell
growth, death, and maintenance. Research progress in revealing the
potential of targeting PCNA for cancer treatment has not been
comprehensively clarified, although the biology of PCNA in
proliferation has been thoroughly examined (35). It has been shown that the
post-translational modifications of PCNA may take important part in
affecting the cellular choice between various pathways, including
apoptosis, DNA repair, or the cell cycle checkpoint pathways, for
purpose of keeping genomic stability (36). Curcumin decreased PCNA and Rho-A
protein expression and inhibited anchorage-independent growth of
breast cancer cell lines (37).
Similarly, our studies suggest that DADS can inhibit both PCNA and
RhoGDI2 expression, suggesting that a decrease in PCNA and RhoGDI2
protein may result in suppression of cell growth.
In conclusion, antitumor effects of DADS may be due
to inactivation of oncogenes and activation of tumor suppressors.
However, the potential molecular mechanisms controlled by DADS in
leukemia are mainly unknown. Accordingly, we identified
DADS-induced differential expression proteins in leukemia cells
using the comparative proteomics approach in this study. These
findings are worthy not only of unveiling potential targets for
DADS, but also further proving its antitumor mechanisms in future
studies, which conduces to clinical treatment for leukemia.
Abbreviations:
|
DADS
|
diallyl disulfide
|
|
RhoGDI2
|
RhoGDP dissociation inhibitor 2
|
|
CTR
|
calreticulin
|
|
AML
|
acute myeloid leukemia
|
|
ATRA
|
all-trans retinoic acid
|
|
ATO
|
arsenic trioxide
|
|
NBT
|
nitroblue tetrazolium
|
|
PMN
|
polymorphonuclear
|
|
H&E
|
haematoxylin and eosin
|
|
CapLC-ESI-Q-TOF-MS
|
capillary liquid
chromatography-electrospray ionization-quadrupole-time of
flight-mass spectrometry
|
|
TBS
|
Tris-buffered saline
|
|
TBST
|
Tris-buffered saline/Tween-20
|
|
PCNA
|
proliferating cell nuclear antigen
|
Acknowledgments
This study was supported by the National Natural
Science Foundation of China (grant nos. 81100375, 31201027 and
81400117), the Hunan Provincial Natural Science Foundation of China
(grant no. 2015JJ4042), the Patency Foundation of Innovation
Platform of Hunan Provincial University of China (grant no.
11K057). The study was performed using equipment purchased with
funding from the construction program of the key discipline in
Hunan Province, China (Basic Medicine Sciences in University of
South China).
References
|
1
|
Schlenk RF: Post-remission therapy for
acute myeloid leukemia. Haematologica. 99:1663–1670. 2014.
View Article : Google Scholar : PubMed/NCBI
|
|
2
|
Mrózek K, Marcucci G, Nicolet D, Maharry
KS, Becker H, Whitman SP, Metzeler KH, Schwind S, Wu YZ,
Kohlschmidt J, et al: Prognostic significance of the European
LeukemiaNet standardized system for reporting cytogenetic and
molecular alterations in adults with acute myeloid leukemia. J Clin
Oncol. 30:4515–4523. 2012. View Article : Google Scholar : PubMed/NCBI
|
|
3
|
Morceau F, Chateauvieux S, Orsini M,
Trécul A, Dicato M and Diederich M: Natural compounds and
pharmaceuticals reprogram leukemia cell differentiation pathways.
Biotechnol Adv. 33:785–797. 2015. View Article : Google Scholar : PubMed/NCBI
|
|
4
|
Sui M, Zhang Z and Zhou J: Inhibition
factors of arsenic trioxide therapeutic effects in patients with
acute promyelocytic leukemia. Chin Med J (Engl). 127:3503–3506.
2014.
|
|
5
|
Gallagher RE: Retinoic acid resistance in
acute promyelocytic leukemia. Leukemia. 16:1940–1958. 2002.
View Article : Google Scholar : PubMed/NCBI
|
|
6
|
Sanz MA and Montesinos P: How we prevent
and treat differentiation syndrome in patients with acute
promyelocytic leukemia. Blood. 123:2777–2782. 2014. View Article : Google Scholar : PubMed/NCBI
|
|
7
|
Kweon SH, Song JH, Kim HJ, Kim TS and Choi
BG: Induction of human leukemia cell differentiation via PKC/MAPK
pathways by arsantin, a sesquiterpene lactone from Artemisia
santolina. Arch Pharm Res. 38:2020–2028. 2015. View Article : Google Scholar : PubMed/NCBI
|
|
8
|
Yi L and Su Q: Molecular mechanisms for
the anticancer effects of diallyl disulfide. Food Chem Toxicol.
57:362–370. 2013. View Article : Google Scholar : PubMed/NCBI
|
|
9
|
Sundaram SG and Milner JA: Diallyl
disulfide suppresses the growth of human colon tumor cell
xenografts in athymic nude mice. J Nutr. 126:1355–1361.
1996.PubMed/NCBI
|
|
10
|
Yi L, Ji XX, Lin M, Tan H, Tang Y, Wen L,
Ma YH and Su Q: Diallyl disulfide induces apoptosis in human
leukemia HL-60 cells through activation of JNK mediated by reactive
oxygen. Pharmazie. 65:693–698. 2010.PubMed/NCBI
|
|
11
|
Yi L, Ji XX, Tan H, Feng MY, Tang Y, Wen L
and Su Q: Involvement of Mcl1 in diallyl disulfide-induced G2/M
cell cycle arrest in HL-60 cells. Oncol Rep. 27:1911–1917.
2012.PubMed/NCBI
|
|
12
|
Gharahdaghi F, Weinberg CR, Meagher DA,
Imai BS and Mische SM: Mass spectrometric identification of
proteins from silver-stained polyacrylamide gel: A method for the
removal of silver ions to enhance sensitivity. Electrophoresis.
20:601–605. 1999. View Article : Google Scholar : PubMed/NCBI
|
|
13
|
Ling H, Zhang LY, Su Q, Song Y, Luo ZY,
Zhou XT, Zeng X, He J, Tan H and Yuan JP: Erk is involved in the
differentiation induced by diallyl disulfide in the human gastric
cancer cell line MGC803. Cell Mol Biol Lett. 11:408–423. 2006.
View Article : Google Scholar : PubMed/NCBI
|
|
14
|
Lai KC, Hsu SC, Kuo CL, Yang JS, Ma CY, Lu
HF, Tang NY, Hsia TC, Ho HC and Chung JG: Diallyl sulfide, diallyl
disulfide, and diallyl trisulfide inhibit migration and invasion in
human colon cancer colo 205 cells through the inhibition of matrix
metalloproteinase-2, -7, and -9 expressions. Environ Toxicol.
28:479–488. 2013. View Article : Google Scholar
|
|
15
|
Nagakubo D, Taira T, Kitaura H, Ikeda M,
Tamai K, Iguchi-Ariga SM and Ariga H: DJ-1, a novel oncogene which
transforms mouse NIH3T3 cells in cooperation with ras. Biochem
Biophys Res Commun. 231:509–513. 1997. View Article : Google Scholar : PubMed/NCBI
|
|
16
|
Zhou X, Xu N, Li R, Xiao Y, Gao G, Lu Q,
Ding L, Li L, Li Y, Du Q, et al: A comparative proteomic study of
Homoharringtonine-induced apoptosis in leukemia K562 cells. Leuk
Lymphoma. 56:2162–2169. 2015. View Article : Google Scholar
|
|
17
|
Liu H, Wang M, Li M, Wang D, Rao Q, Wang
Y, Xu Z and Wang J: Expression and role of DJ-1 in leukemia.
Biochem Biophys Res Commun. 375:477–483. 2008. View Article : Google Scholar : PubMed/NCBI
|
|
18
|
Bai J, Guo C, Sun W, Li M, Meng X, Yu Y,
Jin Y, Tong D, Geng J, Huang Q, et al: DJ-1 may contribute to
metastasis of non-small cell lung cancer. Mol Biol Rep.
39:2697–2703. 2012. View Article : Google Scholar
|
|
19
|
Lee H, Choi SK and Ro JY: Overexpression
of DJ-1 and HSP90α, and loss of PTEN associated with invasive
urothelial carcinoma of urinary bladder: Possible prognostic
markers. Oncol Lett. 3:507–512. 2012.PubMed/NCBI
|
|
20
|
Kim YC, Kitaura H, Taira T, Iguchi-Ariga
SM and Ariga H: Oxidation of DJ-1-dependent cell transformation
through direct binding of DJ-1 to PTEN. Int J Oncol. 35:1331–1341.
2009.PubMed/NCBI
|
|
21
|
Vasseur S, Afzal S, Tomasini R,
Guillaumond F, Tardivel-Lacombe J, Mak TW and Iovanna JL:
Consequences of DJ-1 upregulation following p53 loss and cell
transformation. Oncogene. 31:664–670. 2012.
|
|
22
|
Zhou J, Wang Y, Fei J and Zhang W:
expression of cofilin 1 is positively correlated with the
differentiation of human epithelial ovarian cancer. Oncol Lett.
4:1187–1190. 2012.PubMed/NCBI
|
|
23
|
Harris W, Sachana M, Flaskos J and
Hargreaves AJ: Proteomic analysis of differentiating neuroblastoma
cells treated with sublethal neurite inhibitory concentrations of
diazinon: Identification of novel biomarkers of effect. Toxicol
Appl Pharmacol. 240:159–165. 2009. View Article : Google Scholar : PubMed/NCBI
|
|
24
|
Heasman SJ and Ridley AJ: Mammalian Rho
GTPases: New insights into their functions from in vivo studies.
Nat Rev Mol Cell Biol. 9:690–701. 2008. View Article : Google Scholar : PubMed/NCBI
|
|
25
|
Koh SA, Kim MK, Lee KH, Kim SW and Kim JR:
RhoGDI2 is associated with HGF-mediated tumor invasion through VEGF
in stomach cancer. Clin exp Metastasis. 31:805–815. 2014.
View Article : Google Scholar : PubMed/NCBI
|
|
26
|
Fang Y, Yi J, Lizhi L and Qiucheng C: Rho
GDP dissociation inhibitor beta promotes cell proliferation and
invasion by modulating the AKT pathway in hepatocellular carcinoma.
DNA Cell Biol. 33:781–786. 2014. View Article : Google Scholar : PubMed/NCBI
|
|
27
|
López-Pedrera C, Villalba JM, Siendones E,
Barbarroja N, Gómez-Díaz C, Rodríguez-Ariza A, Buendía P, Torres A
and Velasco F: Proteomic analysis of acute myeloid leukemia:
Identification of potential early biomarkers and therapeutic
targets. Proteomics. 6(Suppl 1): S293–S299. 2006. View Article : Google Scholar : PubMed/NCBI
|
|
28
|
Griner EM and Theodorescu D: The faces and
friends of RhoGDI2. Cancer Metastasis Rev. 31:519–528. 2012.
View Article : Google Scholar : PubMed/NCBI
|
|
29
|
Griner EM, Dancik GM, Costello JC, Owens
C, Guin S, Edwards MG, Brautigan DL, Theodorescu D and Rho C: RhoC
is an unexpected target of RhoGDI2 in prevention of lung
colonization of bladder cancer. Mol Cancer Res. 13:483–492. 2015.
View Article : Google Scholar :
|
|
30
|
Zamanian M, Veerakumarasivam A, Abdullah S
and Rosli R: Calreticulin and cancer. Pathol Oncol Res. 19:149–154.
2013. View Article : Google Scholar : PubMed/NCBI
|
|
31
|
Weng WC, Lin KH, Wu PY, Lu YC, Weng YC,
Wang BJ, Liao YF, Hsu WM, Lee WT and Lee H: Calreticulin regulates
VEGF-A in neuroblastoma cells. Mol Neurobiol. 52:758–770. 2015.
View Article : Google Scholar
|
|
32
|
Lu YC, Weng WC and Lee H: Functional roles
of calreticulin in cancer biology. Biomed Res Int. 2015:5265242015.
View Article : Google Scholar : PubMed/NCBI
|
|
33
|
Caputo E, Maiorana L, Vasta V, Pezzino FM,
Sunkara S, Wynne K, Elia G, Marincola FM, McCubrey JA, Libra M, et
al: Characterization of human melanoma cell lines and melanocytes
by proteome analysis. Cell Cycle. 10:2924–2936. 2011. View Article : Google Scholar : PubMed/NCBI
|
|
34
|
Qin H, Liu T, Yang JL, Huang X, Liu B,
Song X, Zhao X and Wei YQ: Screening proteins related to retinoic
acid resistance by proteomic analysis. Zhonghua Yi Xue Za Zhi.
87:520–525. 2007.In Chinese. PubMed/NCBI
|
|
35
|
Wang SC: PCNA: A silent housekeeper or a
potential therapeutic target? Trends Pharmacol Sci. 35:178–186.
2014. View Article : Google Scholar : PubMed/NCBI
|
|
36
|
Zhu Q, Chang Y, Yang J and Wei Q:
Post-translational modifications of proliferating cell nuclear
antigen: A key signal integrator for DNA damage response (Review).
Oncol Lett. 7:1363–1369. 2014.PubMed/NCBI
|
|
37
|
Calaf GM, Echiburú-Chau C, Wen G, Balajee
AS and Roy D: Effect of curcumin on irradiated and
estrogen-transformed human breast cell lines. Int J Oncol.
40:436–442. 2012.
|