Introduction
Gastric cancer (GC) is the fifth most common cancer
in both sexes and the third most common cause of cancer-associated
mortality worldwide (1). Due to
the advances in diagnostic and therapeutic approaches, long-term
survival for patients with early stage of GC has improved; however,
the outlook for individuals with advanced GC is still disappointing
because of poor prognosis and limited treatment options (2,3).
Poor prognosis is frequently explained by the lack of early
diagnostic biomarkers and effective therapeutic treatments
(3). As the prognosis of GC is
closely associated with the stage of the disease at diagnosis,
novel diagnostic modalities for early stages and novel therapeutics
are urgently required (4). Several
diagnostic biomarkers, such as aberrantly methylated DNA, have
aided the diagnoses and disease monitoring efforts in GC.
Changes in DNA methylation have crucial roles during
the early stages of GC; therefore, aberrant DNA methylation is
highlighted as the main change differentiating GC subtypes from the
very first stage (2,5,6).
Over 550 studies have demonstrated that aberrant epigenetic changes
of >100 genes have crucial roles during the early stages of GC
(7,8). For example, a recent report
associated promoter methylation of CAP-Gly domain containing linker
protein family member 4 (CLIP4) with the increase in
severity of gastritis with no metaplasia to gastritis with
metaplasia and GC, which may be a potentially useful molecular tool
for GC risk stratification in endoscopic biopsies (9).
CLIP4, also known as UBASH3A or TULA, is a member of
the T-cell ubiquitin ligand family. These proteins can suppress
T-cell signaling, facilitate growth factor withdrawal-induced
apoptosis in T-cells and promote the accumulation of various
activated target receptors, such as T-cell receptors and epidermal
growth factor receptors (EGFRs), which can induce cell invasiveness
and metastasis (10–12). Additionally, CLIP4 is involved in
regulating the expression of several tumor-associated genes, such
as spleen associated tyrosine kinase, a member of the
protein tyrosine kinase family associated with cell motility and
increased cell migration (13–15),
and Cbl proto-oncogene, which downregulates EGFR and
activates the epithelial-mesenchymal transition-associated EGFR
signaling pathway (10,16). CLIP4 expression is also suggested
to stimulate tumor metastasis in certain tumor types (17).
Considering the involvement of CLIP4 in tumor
metastasis and the association between its promoter methylation and
GC, it is worth exploring the CLIP4 DNA
methylation-associated genes that may facilitate further
understanding of the function of CLIP4 in the pathogenesis of GC
and provide potential diagnostic biomarkers for clinical
treatment.
In the present study, large quantities of
methylation sequencing information and the mRNA expression
profiling data from GC samples published in The Cancer Genome Atlas
(TCGA) database were used to screen out the significant
differentially expressed genes (DEGs) associated with CLIP4
DNA methylation. A prognostic scoring system was established based
on the screened genes and simultaneously validated by the datasets
from the independent Gene Expression Omnibus (GEO) database. The
reliability of the prognostic scoring system was further validated
by correlation analysis between clinical characteristics and
prognosis. Functional enrichment analysis of DEGs related to
prognosis was performed using gene ontology (GO) and gene set
enrichment analysis (GSEA).
Materials and methods
Samples and datasets
Information of the samples in the training dataset.
The training dataset, containing 393 GC samples with both
methylation sequencing information (Illumina Human Methylation 450
platform) and mRNA expression profiling data (Illumina platform),
was downloaded from the TCGA database (https://portal.gdc.cancer.gov/) on February 10, 2017.
The 393 patients with GC consisted of 258 males and 135 females
with 65.761±10.706 years [mean ± standard deviation (SD)]. There
were 251 Caucasian patients, 107 non-Caucasian patients, and the
race of the remaining patients was unavailable. There were 52 stage
I, 125 stage II, 173 stage III, 32 stage IV cases and the remaining
cases were at unknown stages. A total of 152 patients had succumbed
to disease when data was submitted, with an average survival time
of 438.88±384.35 days. Information of the samples in the training
dataset is summarized in Table
I.
 | Table IInformation of samples in training
and validation datasets. |
Table I
Information of samples in training
and validation datasets.
| Parameter | TCGA
(n=393) | GSE30601 and
GSE15460
(n=157) |
|---|
| Age (mean ±
SD) | 65.761±10.706 | 63.242±12.607 |
| Sex
(male/female) | 258/135 | 100/57 |
| Stage
(I/II/III/IV) | 52/125/173/32 | 23/25/59/20 |
| Overall survival
(mean ± SD) | 438.88±384.35 | 699.88±728.17 |
| Radiotherapy
(yes/no) | 77/366 | |
| Chemotherapy
(yes/no) | 183/260 | |
| Targeted molecular
therapy (yes/no) | 190/253 | |
Information of the samples in the
validation dataset
The validation dataset, containing 157 GC samples
with methylation sequencing information (GSE30601; Illumina
HumanMethylation27 BeadChip; ncbi.nlm.nih.gov/geo/query/acc.cgi?acc=GSE30601) and
mRNA expression profiling data (GSE15460; Affymetrix GeneChip Human
Genome U133 Plus 2.0; ;ncbi.nlm.nih.gov/geo/query/acc.cgi?acc=GSE15460), was
downloaded from the GEO database (18). The 157 GC patients consisted of 100
males and 57 females with 63.242±12.607 years (mean ± SD). There
were 23 stage I, 25 stage II, 59 stage III and 20 stage IV cases,
and the remaining stages were unavailable. The average survival
time for 81 patients was 699.88±728.17 days (mean ± SD).
Information on the samples in the validation dataset is summarized
in Table I.
Selection of candidate expression
factors
Samples were divided into CLIP4
hypermethylation and CLIP4 hypomethylation groups according
to the median CLIP4 methylated value of 0.326. The gene
expression differences between the two groups were compared using
the limma package in the R software 3.3.1 (19), and genes with |log fold change
(FC)| >1 and Benjamini-Hochberg (BH)-adjusted P<0.01 were
considered to be significant DEGs. Subsequently, survival analysis
associated with these DEGs was performed by Kaplan-Meier analysis
and univariate Cox regression analysis using the ‘survidiff’
function in the survival package of R 3.3.1 (20,21)
and P<0.05 was set as the significance threshold. As mortality
of patients with an overall survival (OS) of <30 days may due to
other factors, these patients and those without survival data were
excluded from the survival analysis. The KM diagram was generated
using ‘ggsurvplot’. The top three genes that were
significantly associated with OS (P<0.005) were selected as
signature genes.
Establishment of the risk assessment
model
Each risk value was calculated as a linear
combination of the mRNA expression value (expr) following weighting
by regression coefficients (β) (22–24).
The risk score for each patient was calculated according to the
following formula: Risk score = βgene1 ×
exprgene1 + βgene2 × exprgene2 +
βgene3 × exprgene3 β represents the gene risk
coefficient, expr represents the gene expression level and gene1,
gene2 and gene3 represents the three genes. The high- and low-risk
groups were classified based on the median of the risk values.
Functional annotation of the prognostic
genes
BH-adjusted P<0.01 was used as the threshold to
screen out genes significantly associated with high- and low-risk
groups using the limma package. According to the association
between the genes and their risk values, the genes positively or
negatively associated with the risk value were defined as the
high-risk group and high expression genes, or low-risk group and
low expression genes, respectively. The top 100 (alternatively 50)
genes with high and low expression were chosen to generate a
heatmap plot using the ggplot2 drawing package. Subsequently,
functional enrichment analysis and mapping of the top 500 genes
with high and low expression levels were performed using the DAVID
6.8 online software (https://david.ncifcrf.gov) (25,26).
Verification of gene functions was performed via the
screening standard, nominal P<0.05, using the GSEA software
(software.broadinstitute.org/gsea/index.jsp)
(27,28). GSEA analysis is a statistical
method for calculating the enrichment of a gene list in a pathway.
Briefly, all the genes in a particular gene list are scored and
ranked by a statistical method based on their expression levels.
The primary result of GSEA is the enrichment score (ES), which
reflects the degree to which a pathway is overrepresented at the
top or bottom of the ranked list of genes. The ES was calculated by
walking down the ranked list of genes, increasing a running-sum
statistic when a gene is in the pathway while decreasing it when it
is not. The ES is the maximum deviation from zero encountered in
walking the list. The score at the peak of the plot is the ES for
the gene set. Gene sets with a distinct peak at the beginning or
end of the ranked list are generally the most interesting. For this
process, the significant P-values calculated by permutation 1,000
times determined whether the genes were enriched or not.
Statistical analysis
In addition to the statistical methods noted above,
the statistical method used in this study was t-test. Univariate
Cox regression was used to analyzed the clinical features and risk
score for association with patient OS. Multivariate Cox regression
analysis were conducted to evaluate whether the clinical features
and risk score was independent of other clinical variables, with
hazard ratios were calculated. P<0.05 was considered to indicate
a statistically significant difference using R 3.3.1.
Results
Identification and validation of a
three-gene prognostic signature in two datasets
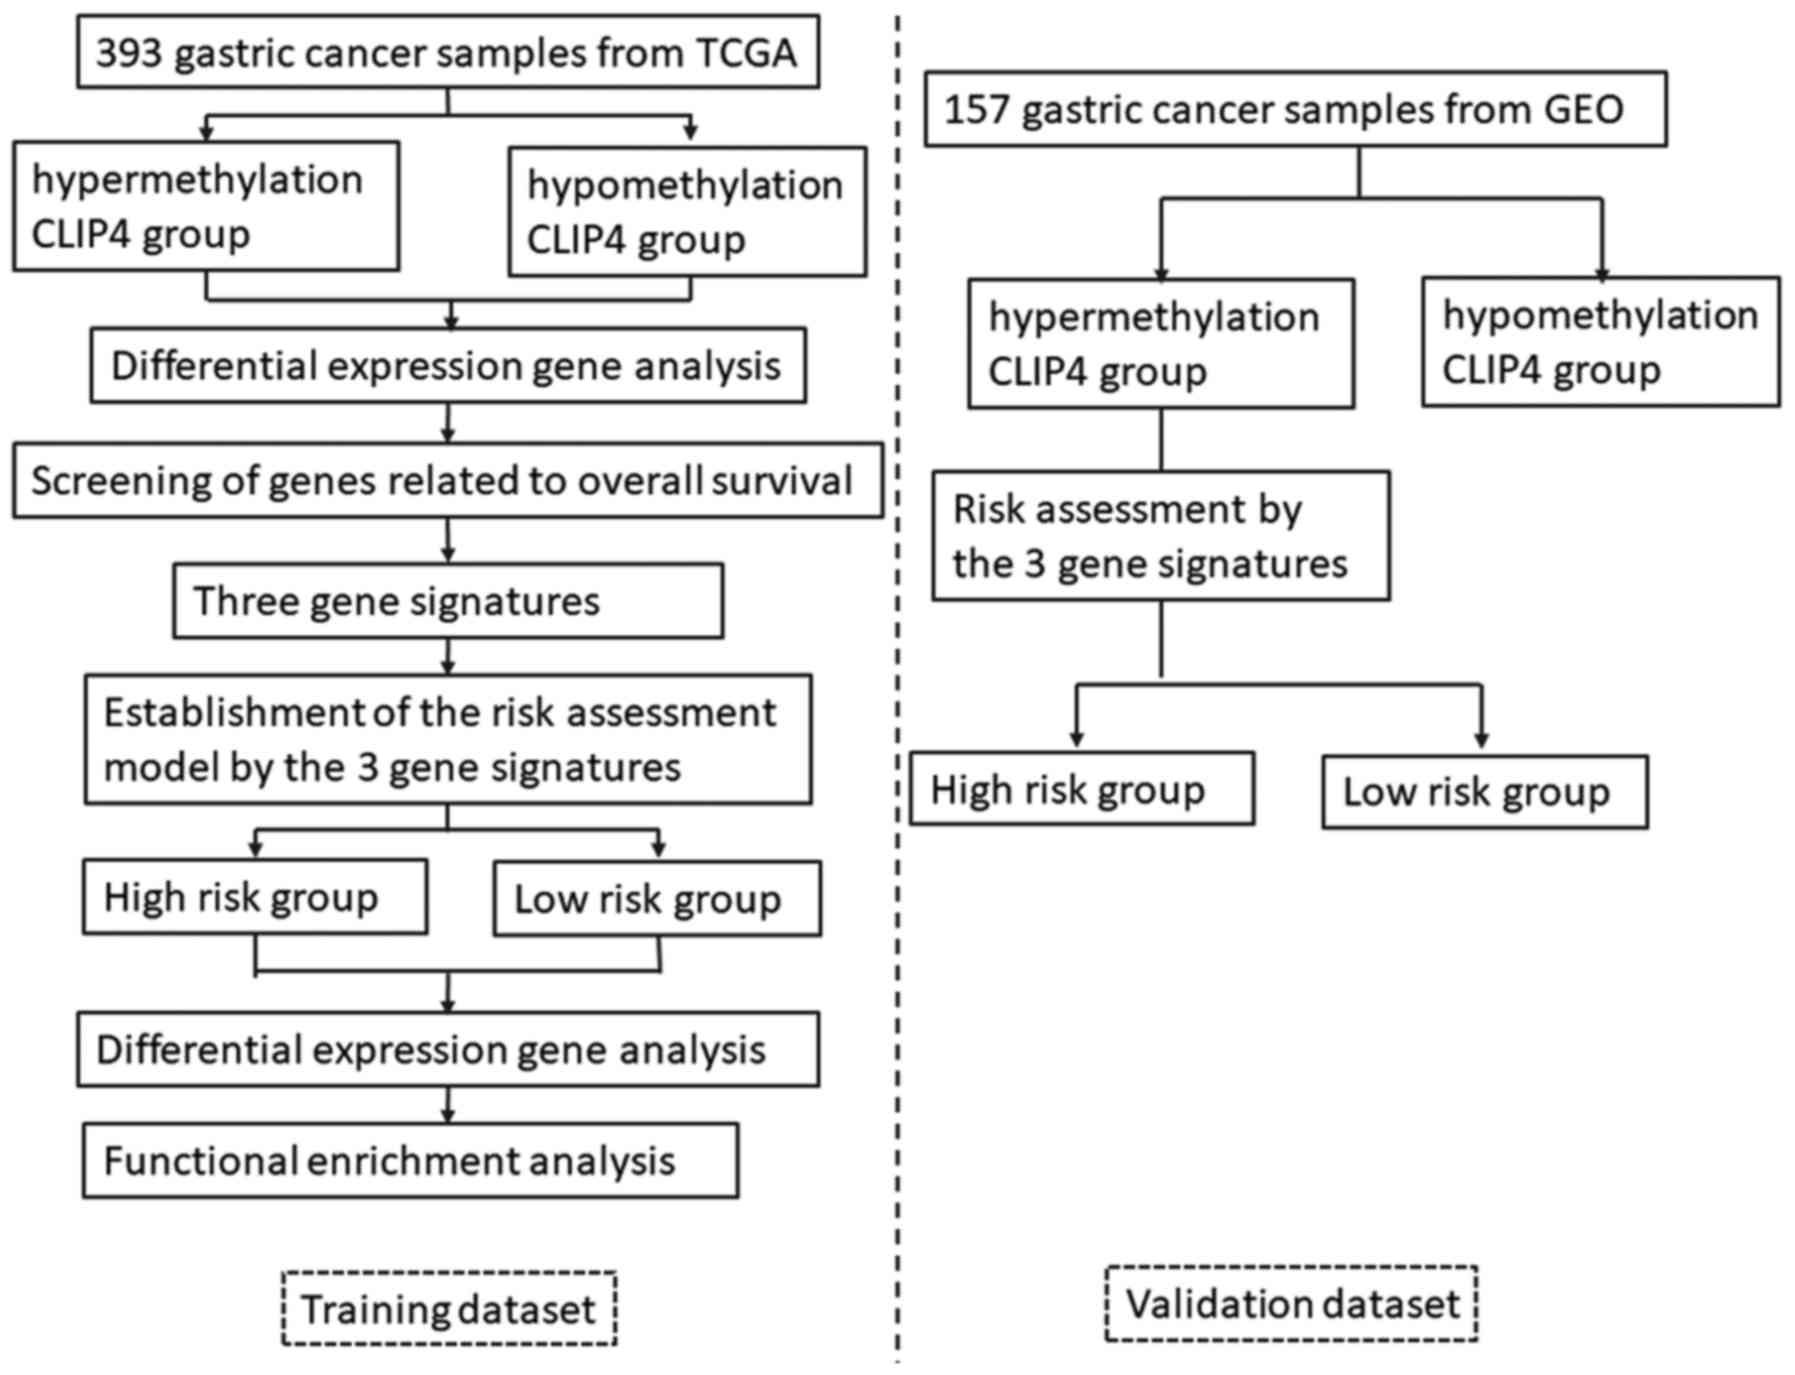
The workflow of the current study is presented in
Fig. 1. In the training dataset,
the samples were divided into the hypermethylated and
hypomethylated groups, each with 168 individuals, based on 0.326 as
the median of the CLIP4 methylated values. The gene
expression differences between the two groups were compared using
the limma package, and 279 DEGs were filtered via the threshold
|logFC| >1 and BH-adjusted P<0.01. This revealed the
expression level of 35 genes were significantly associated with
prognosis, obtained using the univariate Cox regression analysis
(data not shown). High expression levels of 32 genes out of 35 were
associated with shorter OS; while higher expression levels of the
other 3 genes were associated with longer OS. The top three genes
with lowest P-value (P<0.005), claudin-11 (CLDN11),
apolipoprotein D (APOD), and chordin like 1 (CHRDL1),
were selected as the prognostic gene signatures in the CLIP4
DNA hypermethylation patients.
Using these three genes, a risk assessment system
for cancer patients was established via regression-weighted gene
expression based on linear combination. The risk score for each
patient was calculated according to the following formula: Risk
score = 0.30 × CLDN11 expression + 0.16 × APOD
expression + 0.14 × CHRDL1 expression.
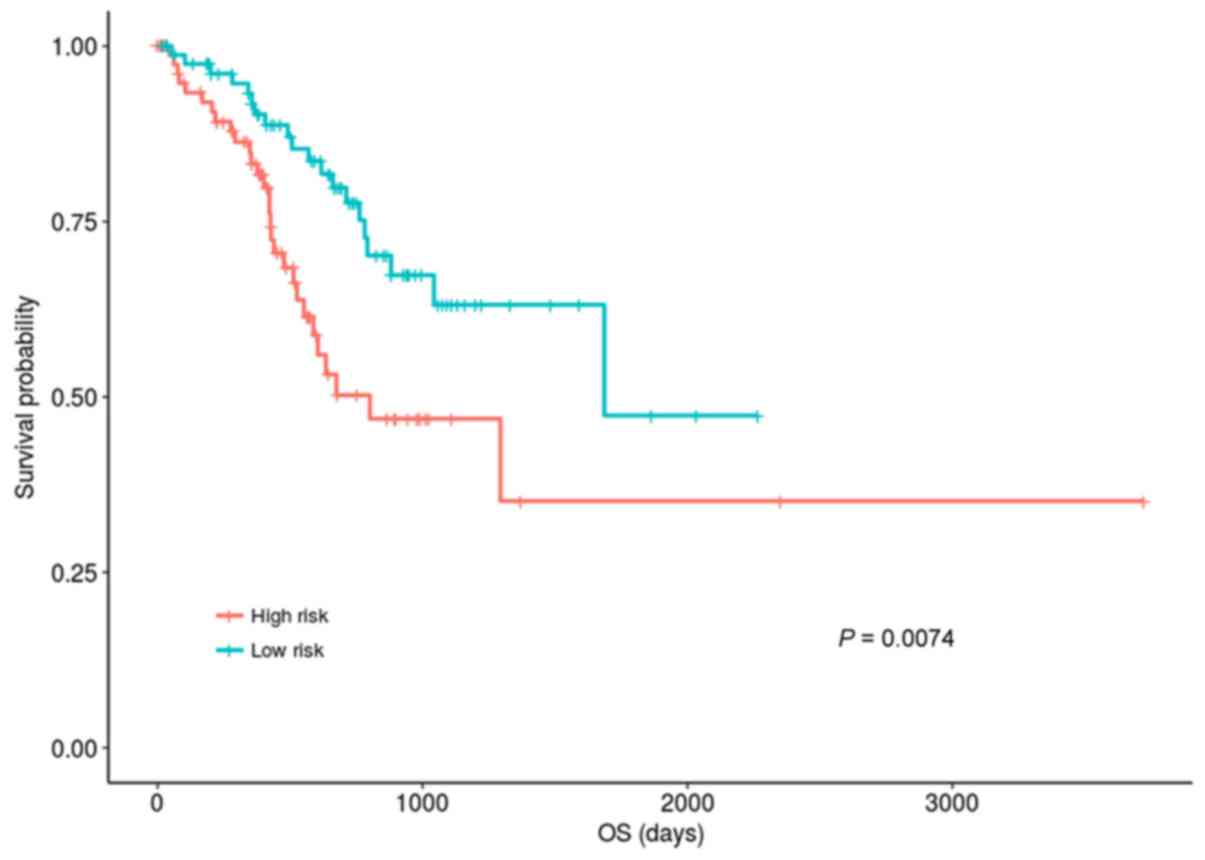
Patients in the hypermethylation group were divided
into high- and low-risk groups according to median risk score of
0.4289. Fig. 2 indicated that the
OS of the patients in the low-risk group was significantly improved
compared with those in the high-risk group (P=0.00744; KM analysis
and log-rank test). The OS median values of the low- and high-risk
groups were 538.5 days and 422 days, respectively.
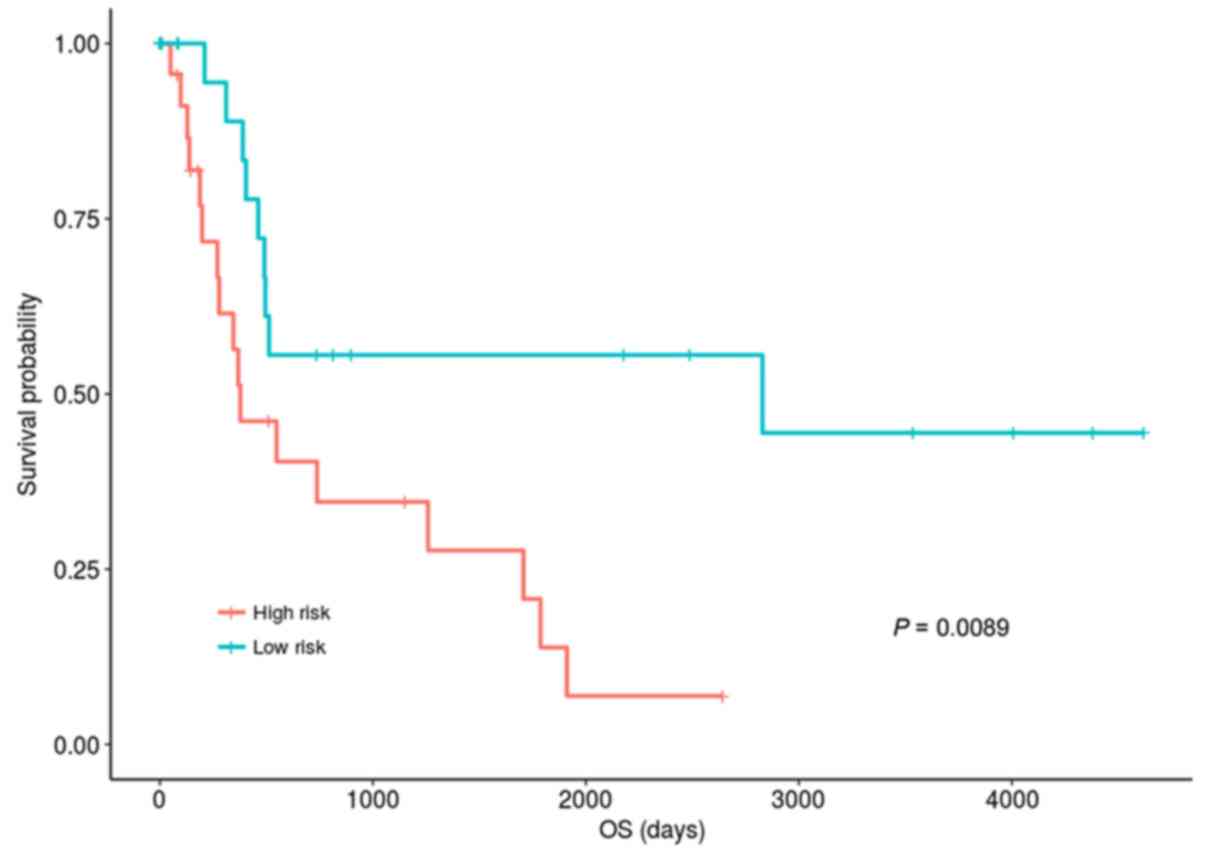
The median of methylation in the training set was
used as the standard for dividing samples in validation dataset
into hypomethylation and hypermethylation groups. In the validation
dataset, 48 patients were classified into the hypermethylation
group. The risk scores of samples in the hypermethylation group of
validation set were calculated according to the risk assessment
system, and the samples were also divided into high-risk group and
low-risk group according to the median risk score. Using the median
risk score of 5.04 as the dividing point, the samples were divided
into high- and low-risk groups with 24 individuals in each group.
Fig. 3 demonstrated that the OS of
the patients in the low-risk group was significantly improved
compared with those in the high-risk group (P=0.0083, KM analysis
and log-rank test). The OS median values of the low- and high-risk
groups were 462 days and 345 days, respectively. This result
suggested that the risk assessment was also effective in the
validation dataset.
Clinical and molecular features of the
low- and high-risk patients with CLIP4 promoter methylation
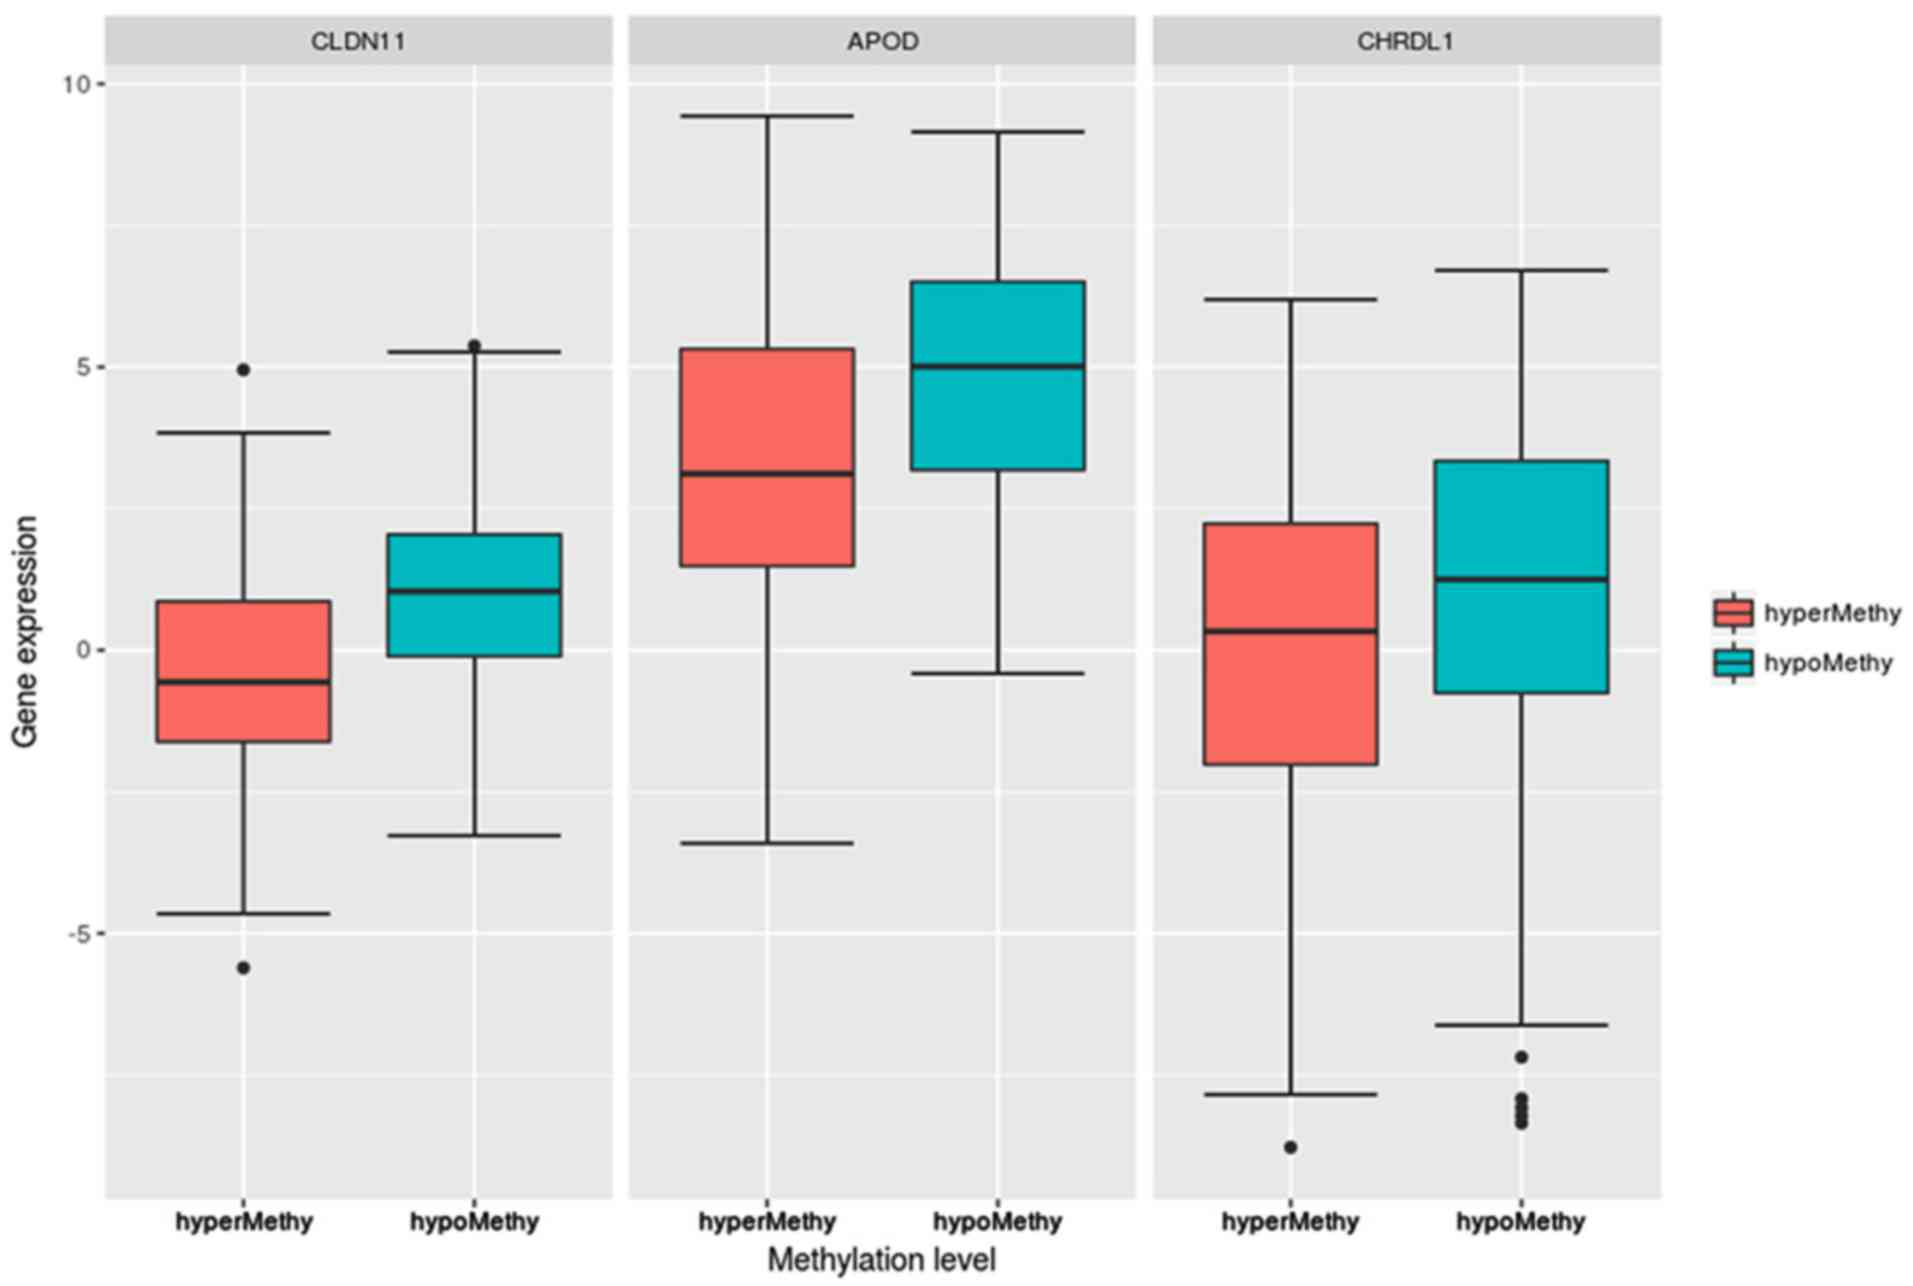
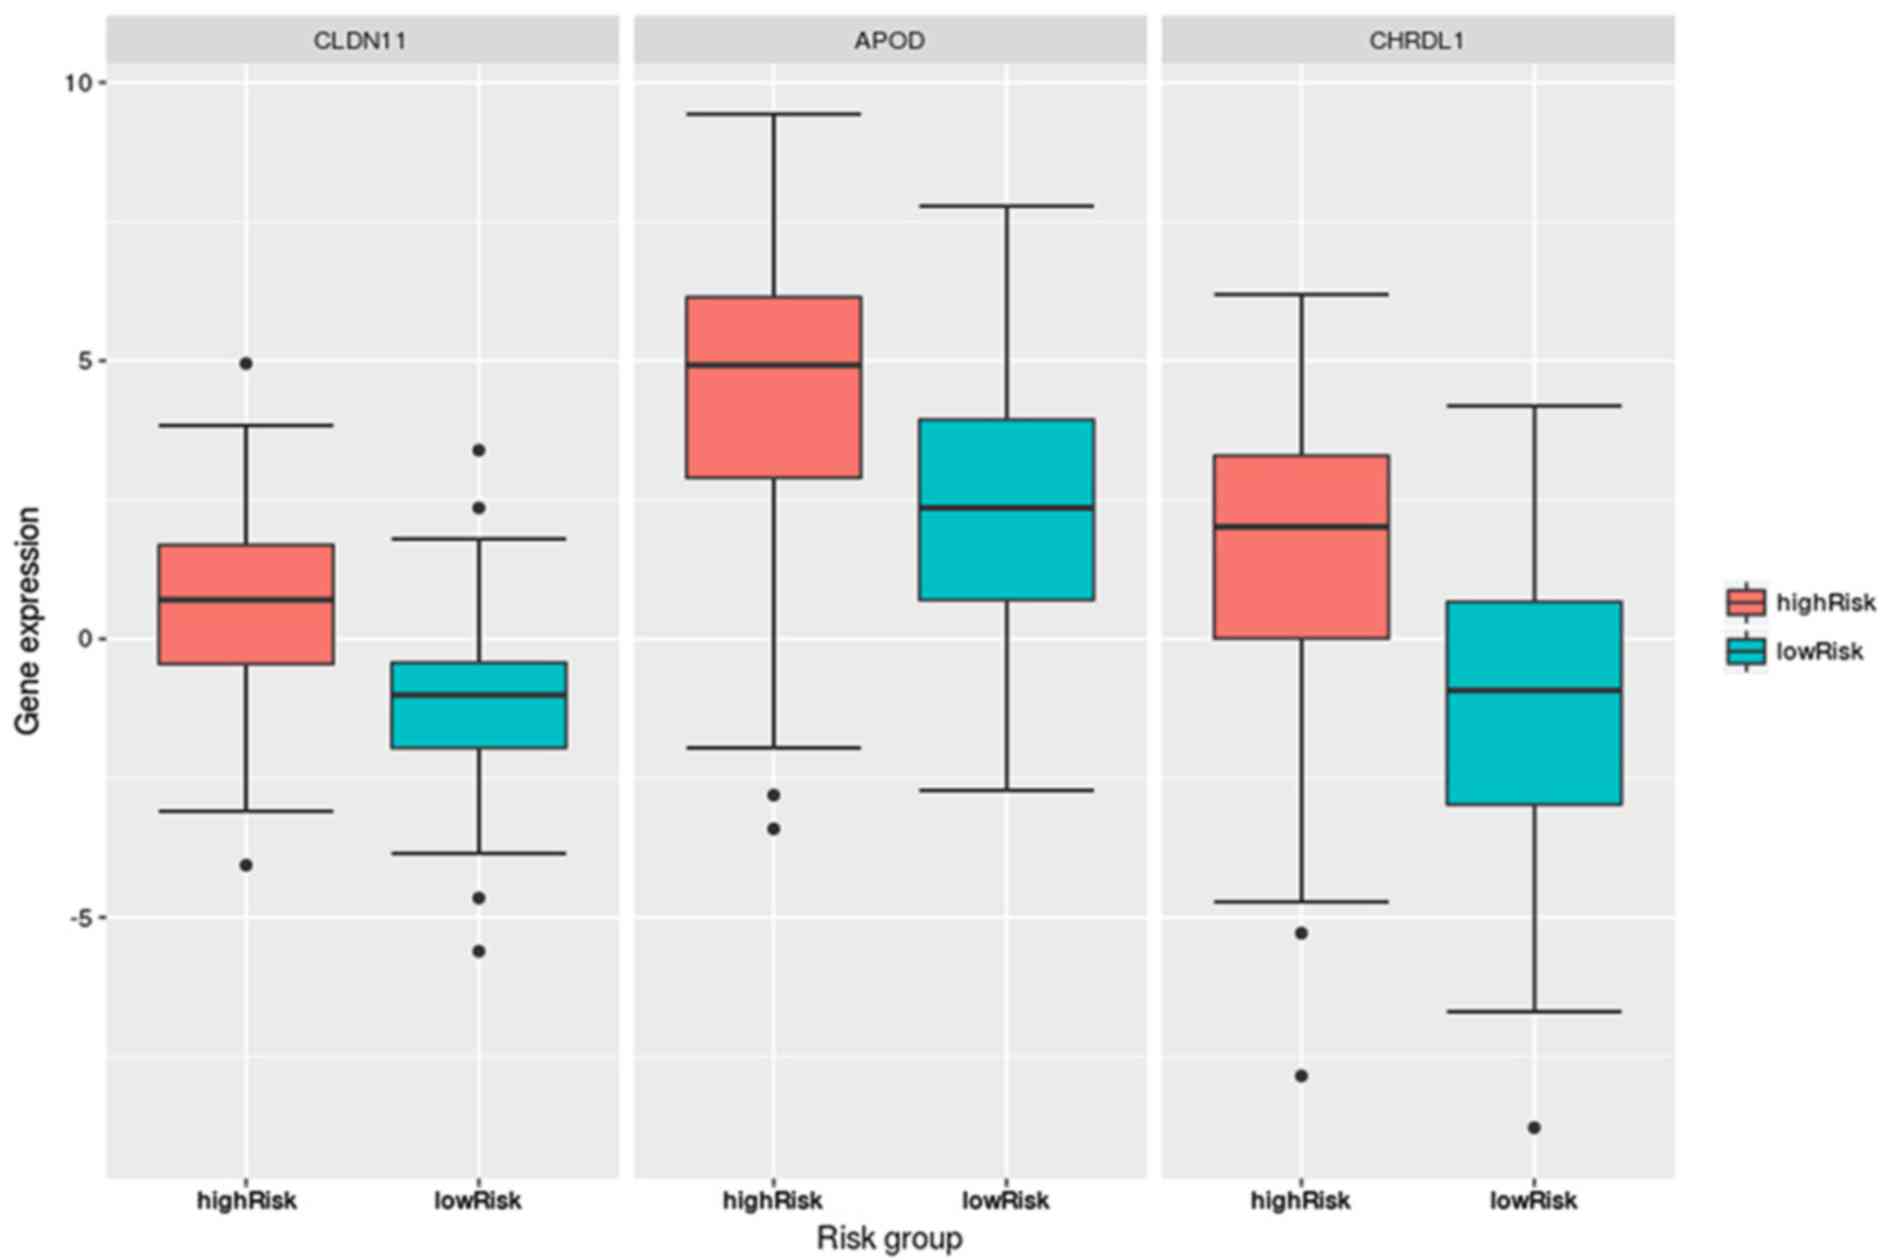
Fig. 4 indicated
that the expression levels of the three DEGs, CLDN11,
APOD and CHRDL1, in the hypermethylation group were
significantly lower than those in the hypomethylation group. The
P-values, determined via Student’s t-test, were
1.09×10⁻¹³ (CLDN11), 4.12×10⁻⁸
(APOD) and 0.00128 (CHRDL1). Further, their
expression levels were significantly different between the high-
and low-risk groups in the CLIP4 DNA hypermethylation
patients, as presented in Fig.
5.
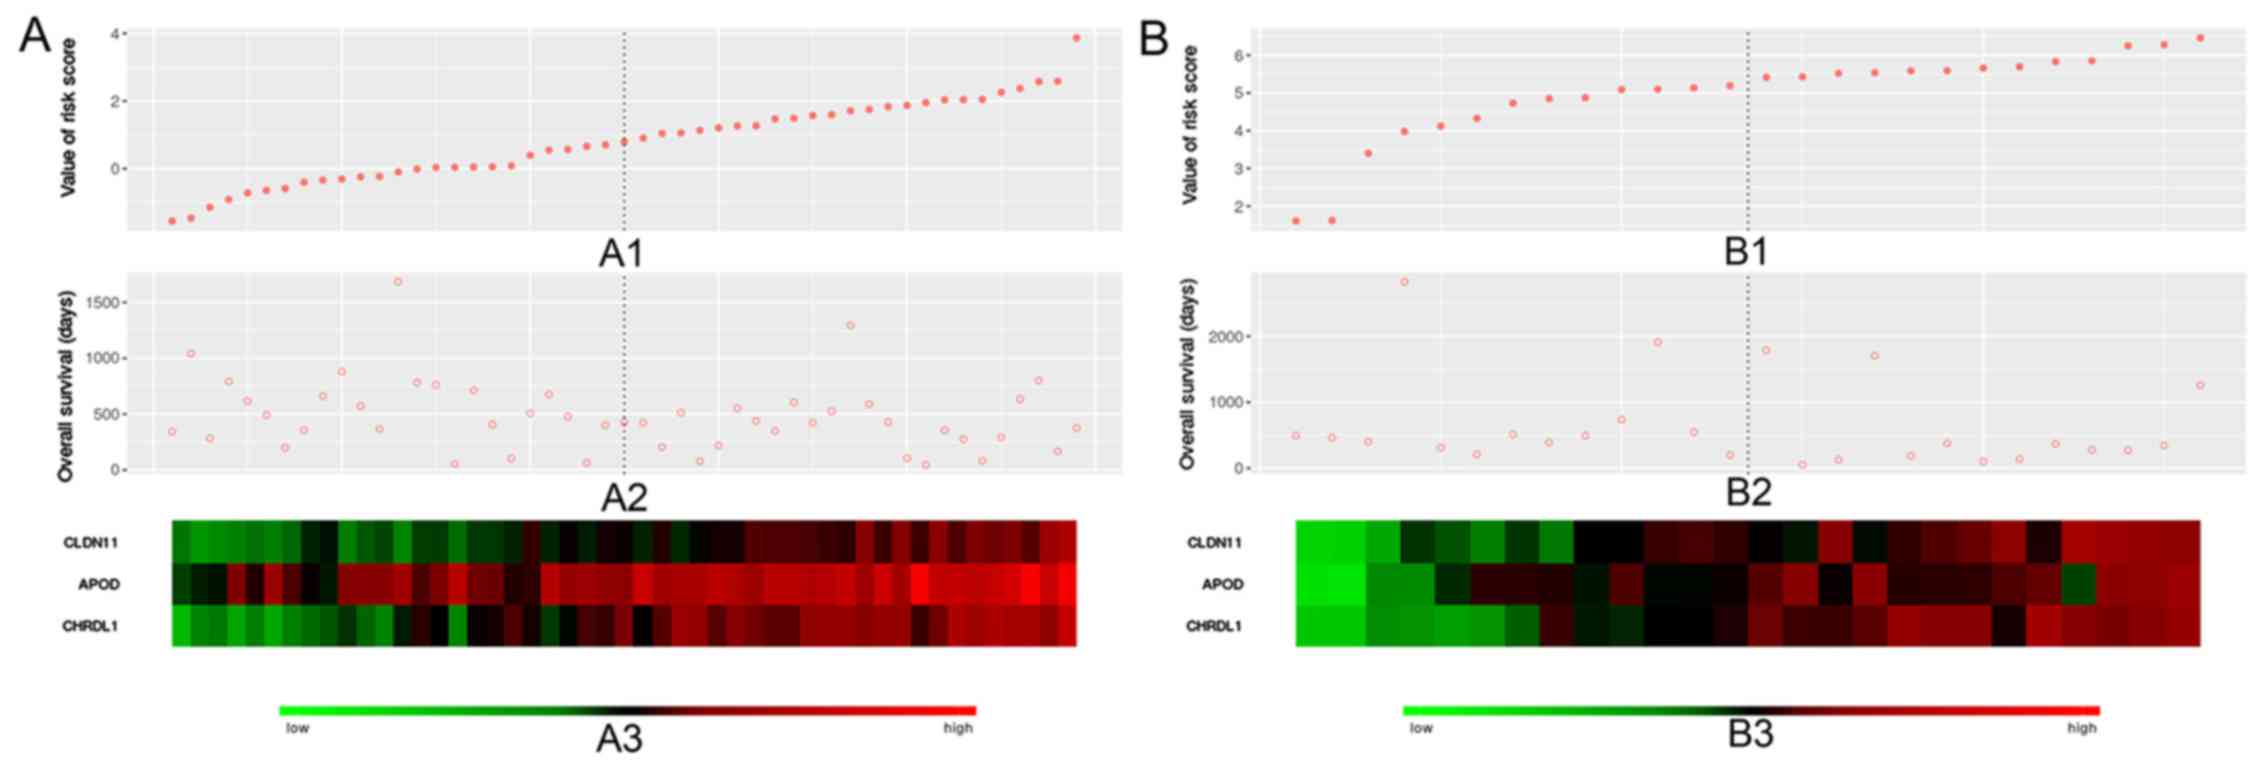
The independence of the three important factors was
also evaluated. In the training dataset, univariate Cox regression
analysis of patient age, sex, race, chemotherapy, targeted
molecular therapy, radiotherapy and risk value were analyzed for
association with patient OS. Targeted molecular therapy,
radiotherapy and risk value were associated with GC patient overall
survival time (P<0.05; Table
II). Multivariate Cox analysis was also performed on targeted
molecular therapy, radiotherapy and risk value. The results showed
radiotherapy and risk value to be independent prognostic factors.
Fig. 6 demonstrated the risk
values, OS and expression levels of the three genes in the training
(left) and validation (right) datasets.
| Table IIUnivariate and multivariate Cox
analysis of clinical data with overall survival of samples in the
training dataset. |
Table II
Univariate and multivariate Cox
analysis of clinical data with overall survival of samples in the
training dataset.
| Variable | Univariate Cox
| Multivariate Cox
|
|---|
| P-value | HR | P-value | HR |
|---|
| Age
(>60/≤60) | 0.0745 | 1.0142 | | |
| Sex
(male/female) | 0.0899 | 1.3700 | | |
| Race
(white/non-white) | 0.6412 | 1.0352 | | |
| Chemotherapy
(yes/no) | 0.0646 | 0.7302 | | |
| Targeted molecular
therapy (yes/no) | 0.0300 | 0.6886 | 0.7461 | 0.9342 |
| Radiotherapy
(yes/no) | 0.0013 | 0.4544 | 0.0296 | 0.5260 |
| Risk value
(>median/≤median) | 0.0089 | 0.4635 | 0.0065 | 0.6091 |
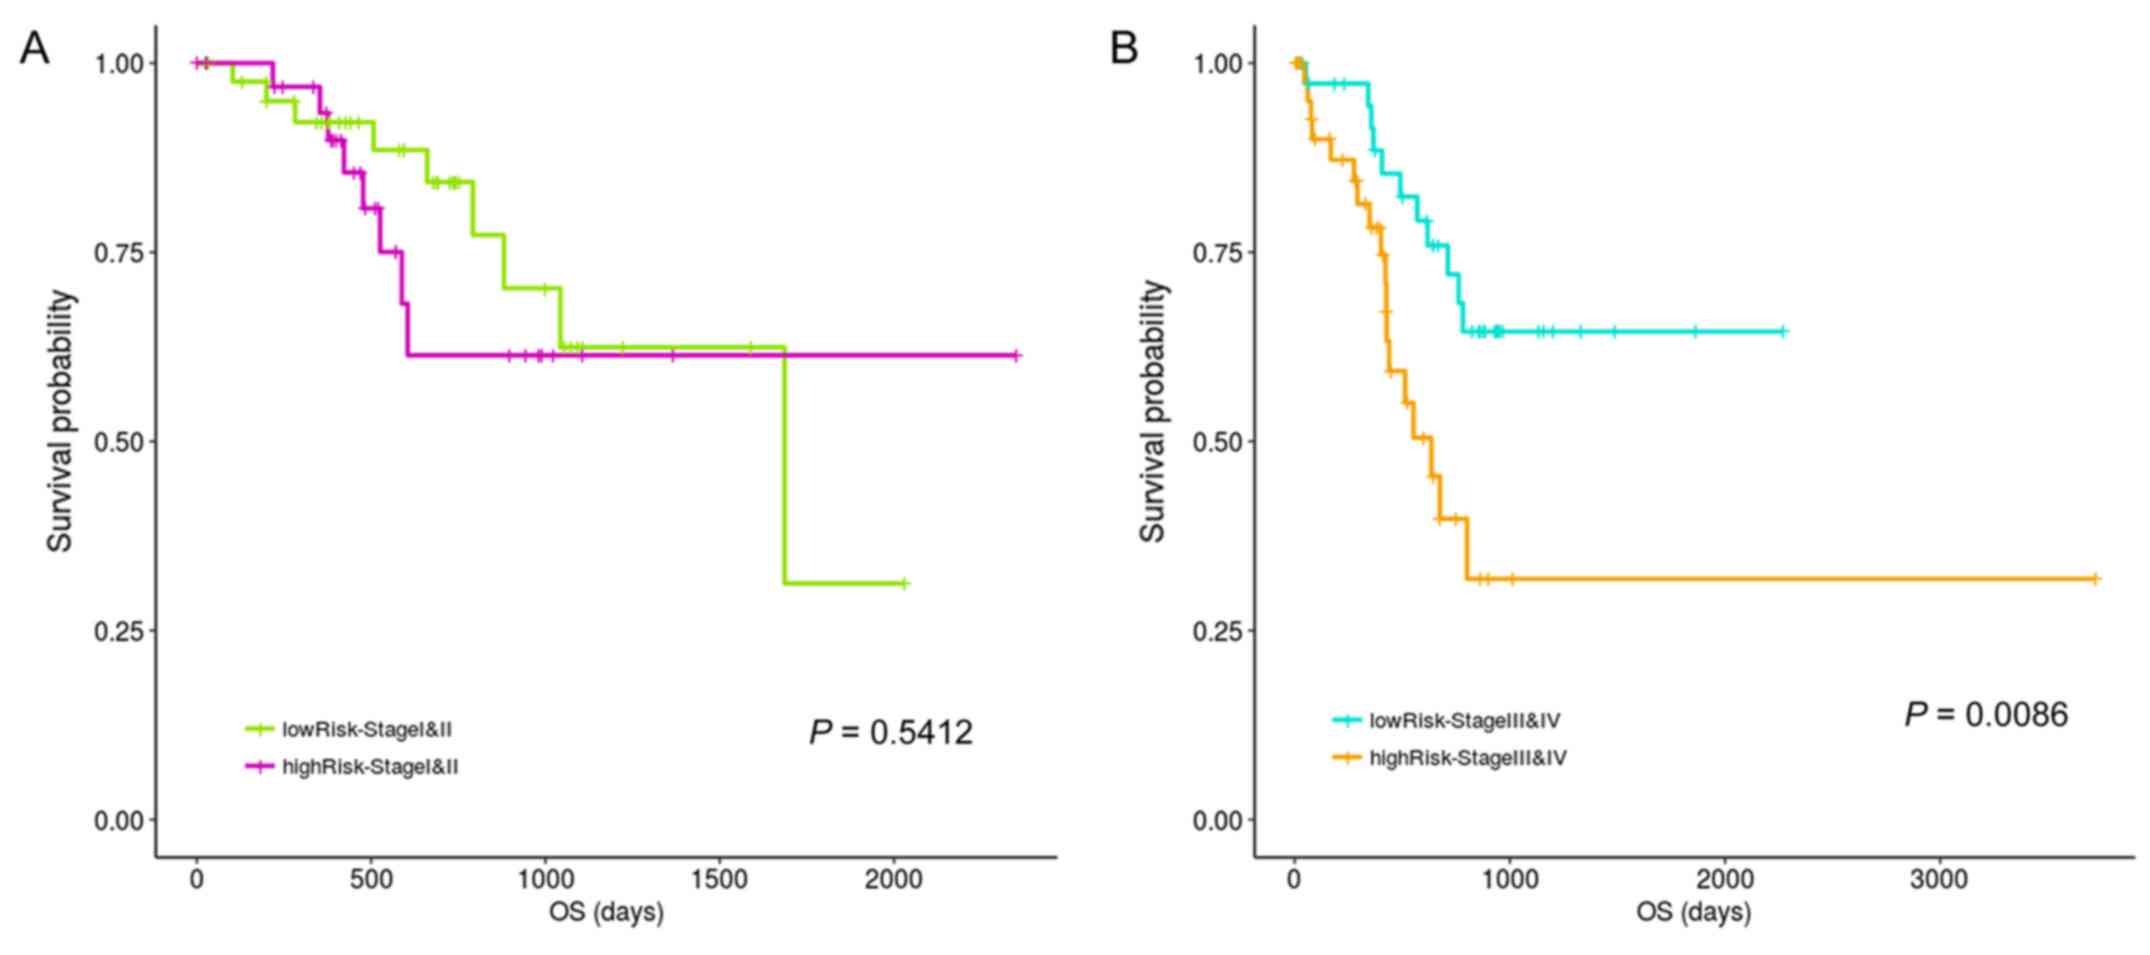
Association of the three-gene signature
prognosis values with pathological stage and radiotherapy
CLIP4 is reported to be closely associated with to
cancer development (9,29). Therefore, prognostic differences
between the high- and low-risk groups in patients with CLIP4
hypermethylation during different stages were explored in the
current study. Fig. 7 results
indicated no significant prognostic difference between the high-
and low-risk groups during stages 1 and 2, potentially due to an
insufficient amount of total statistical samples, even though a
difference in the trend could be observed. However, significant
differences were observed between the high- and low-risk groups in
stage 3 and 4 patients.
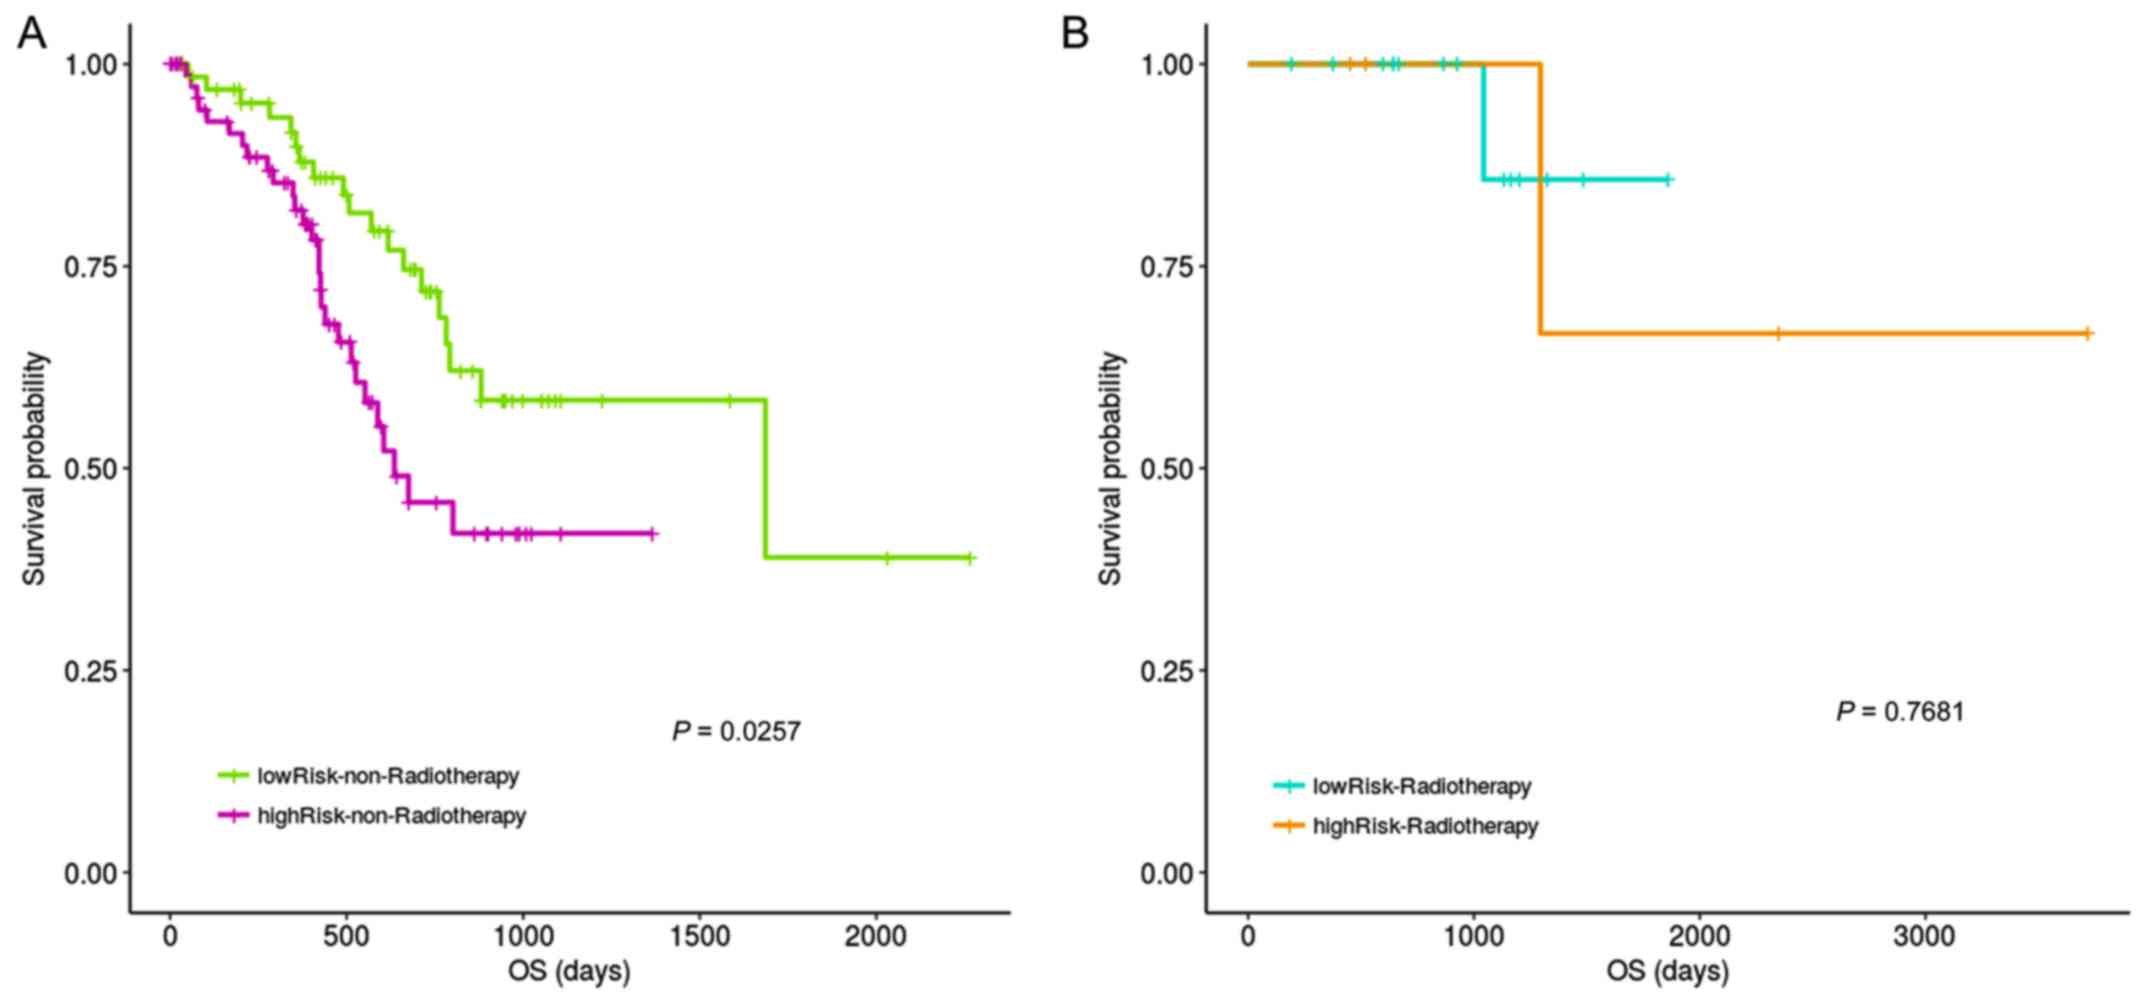
The impact of radiotherapy on risk assessment was
also examined. Fig. 8 results
indicated significant prognostic differences between the high- and
low-risk groups for non-radiotherapy patient, with no difference in
survival for those that had received radiotherapy.
Functional enrichment analysis of the
DEGs related to prognosis
In the training dataset, DEGs were screened between
the high- and low-risk groups using BH-adjusted P<0.01 as the
threshold via the limma package. The top 500 DEGs that were
positively and negatively associated with risk value were
functionally enriched and DEG expression patterns were analyzed
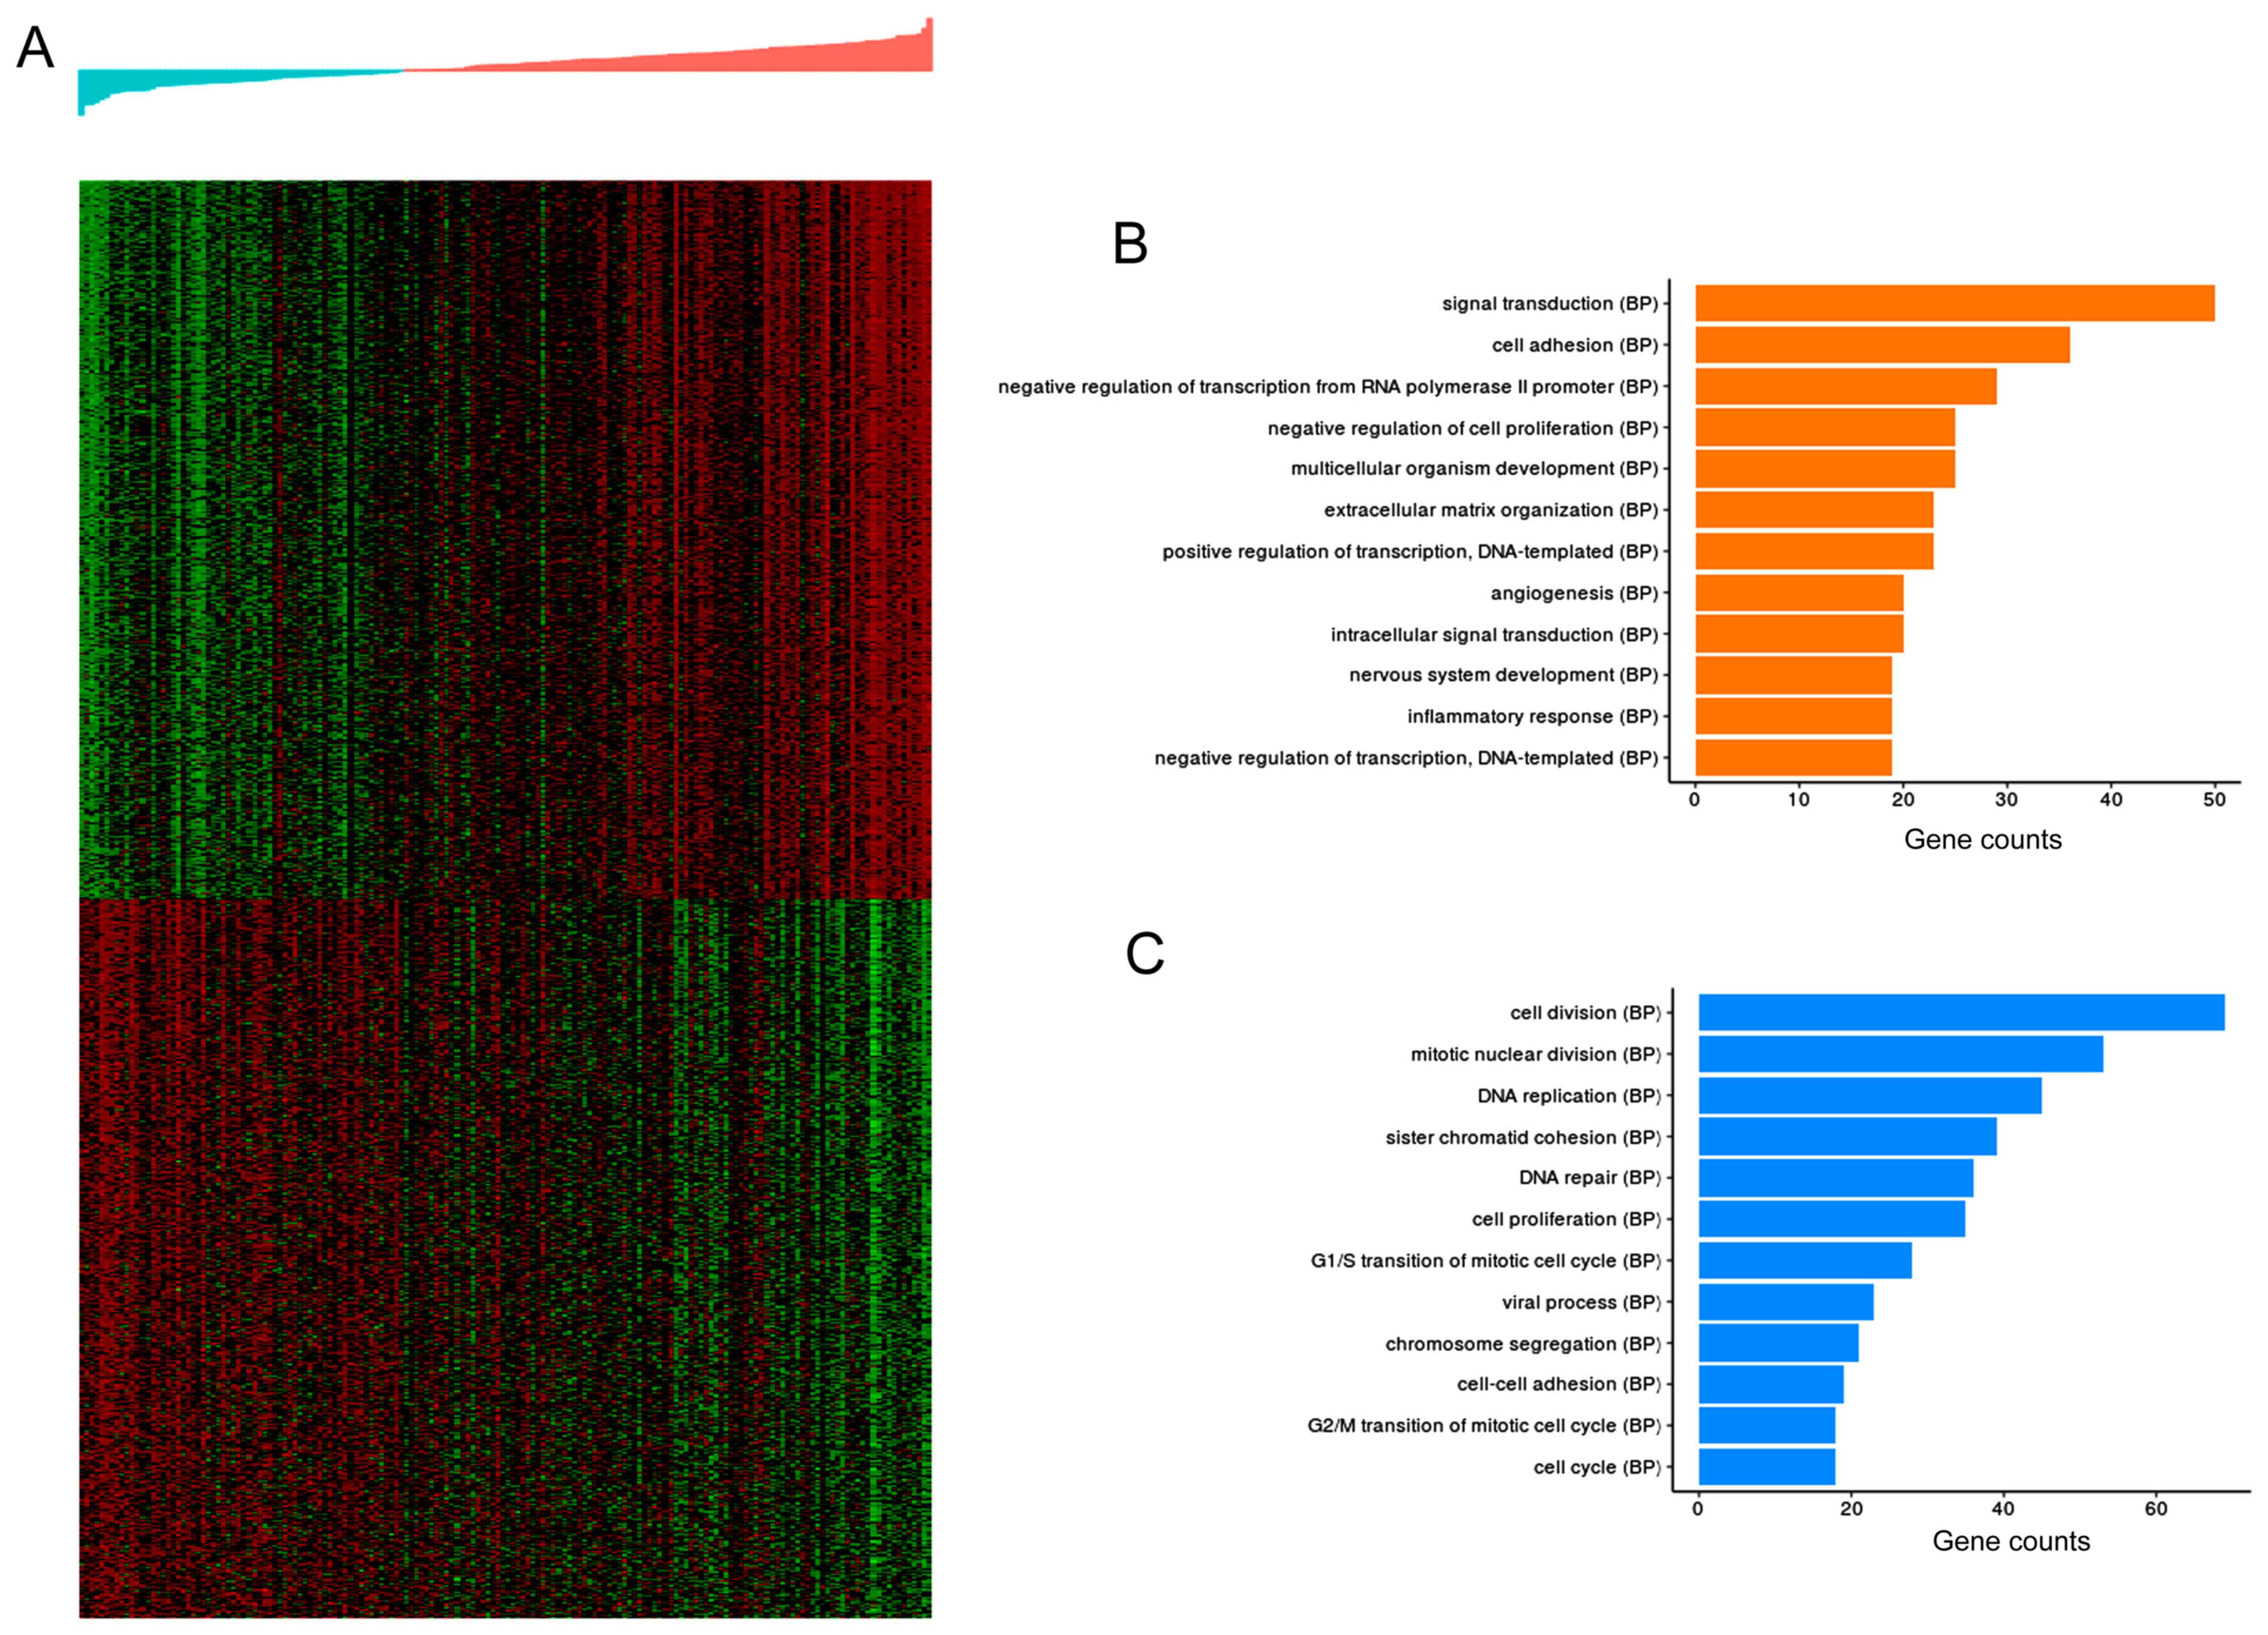
using hierarchical clustering. In Fig.
9, the upper and lower heatmaps represented 500 genes that were
positively and negatively associated with risk values,
respectively. Fig. 9 also presents
the top 12 biological process terms involving DEGs that had a
significant positive or negative association with the risk values.
Functional enrichment analysis showed that CLDN11,
APOD and CHRDL1 are involved in six functional terms
(‘cell adhesion’, ‘cell-cell adhesion’, ‘nervous system
development’, ‘signal transduction’, ‘cell proliferation’ and
‘negative regulation of cell proliferation’).
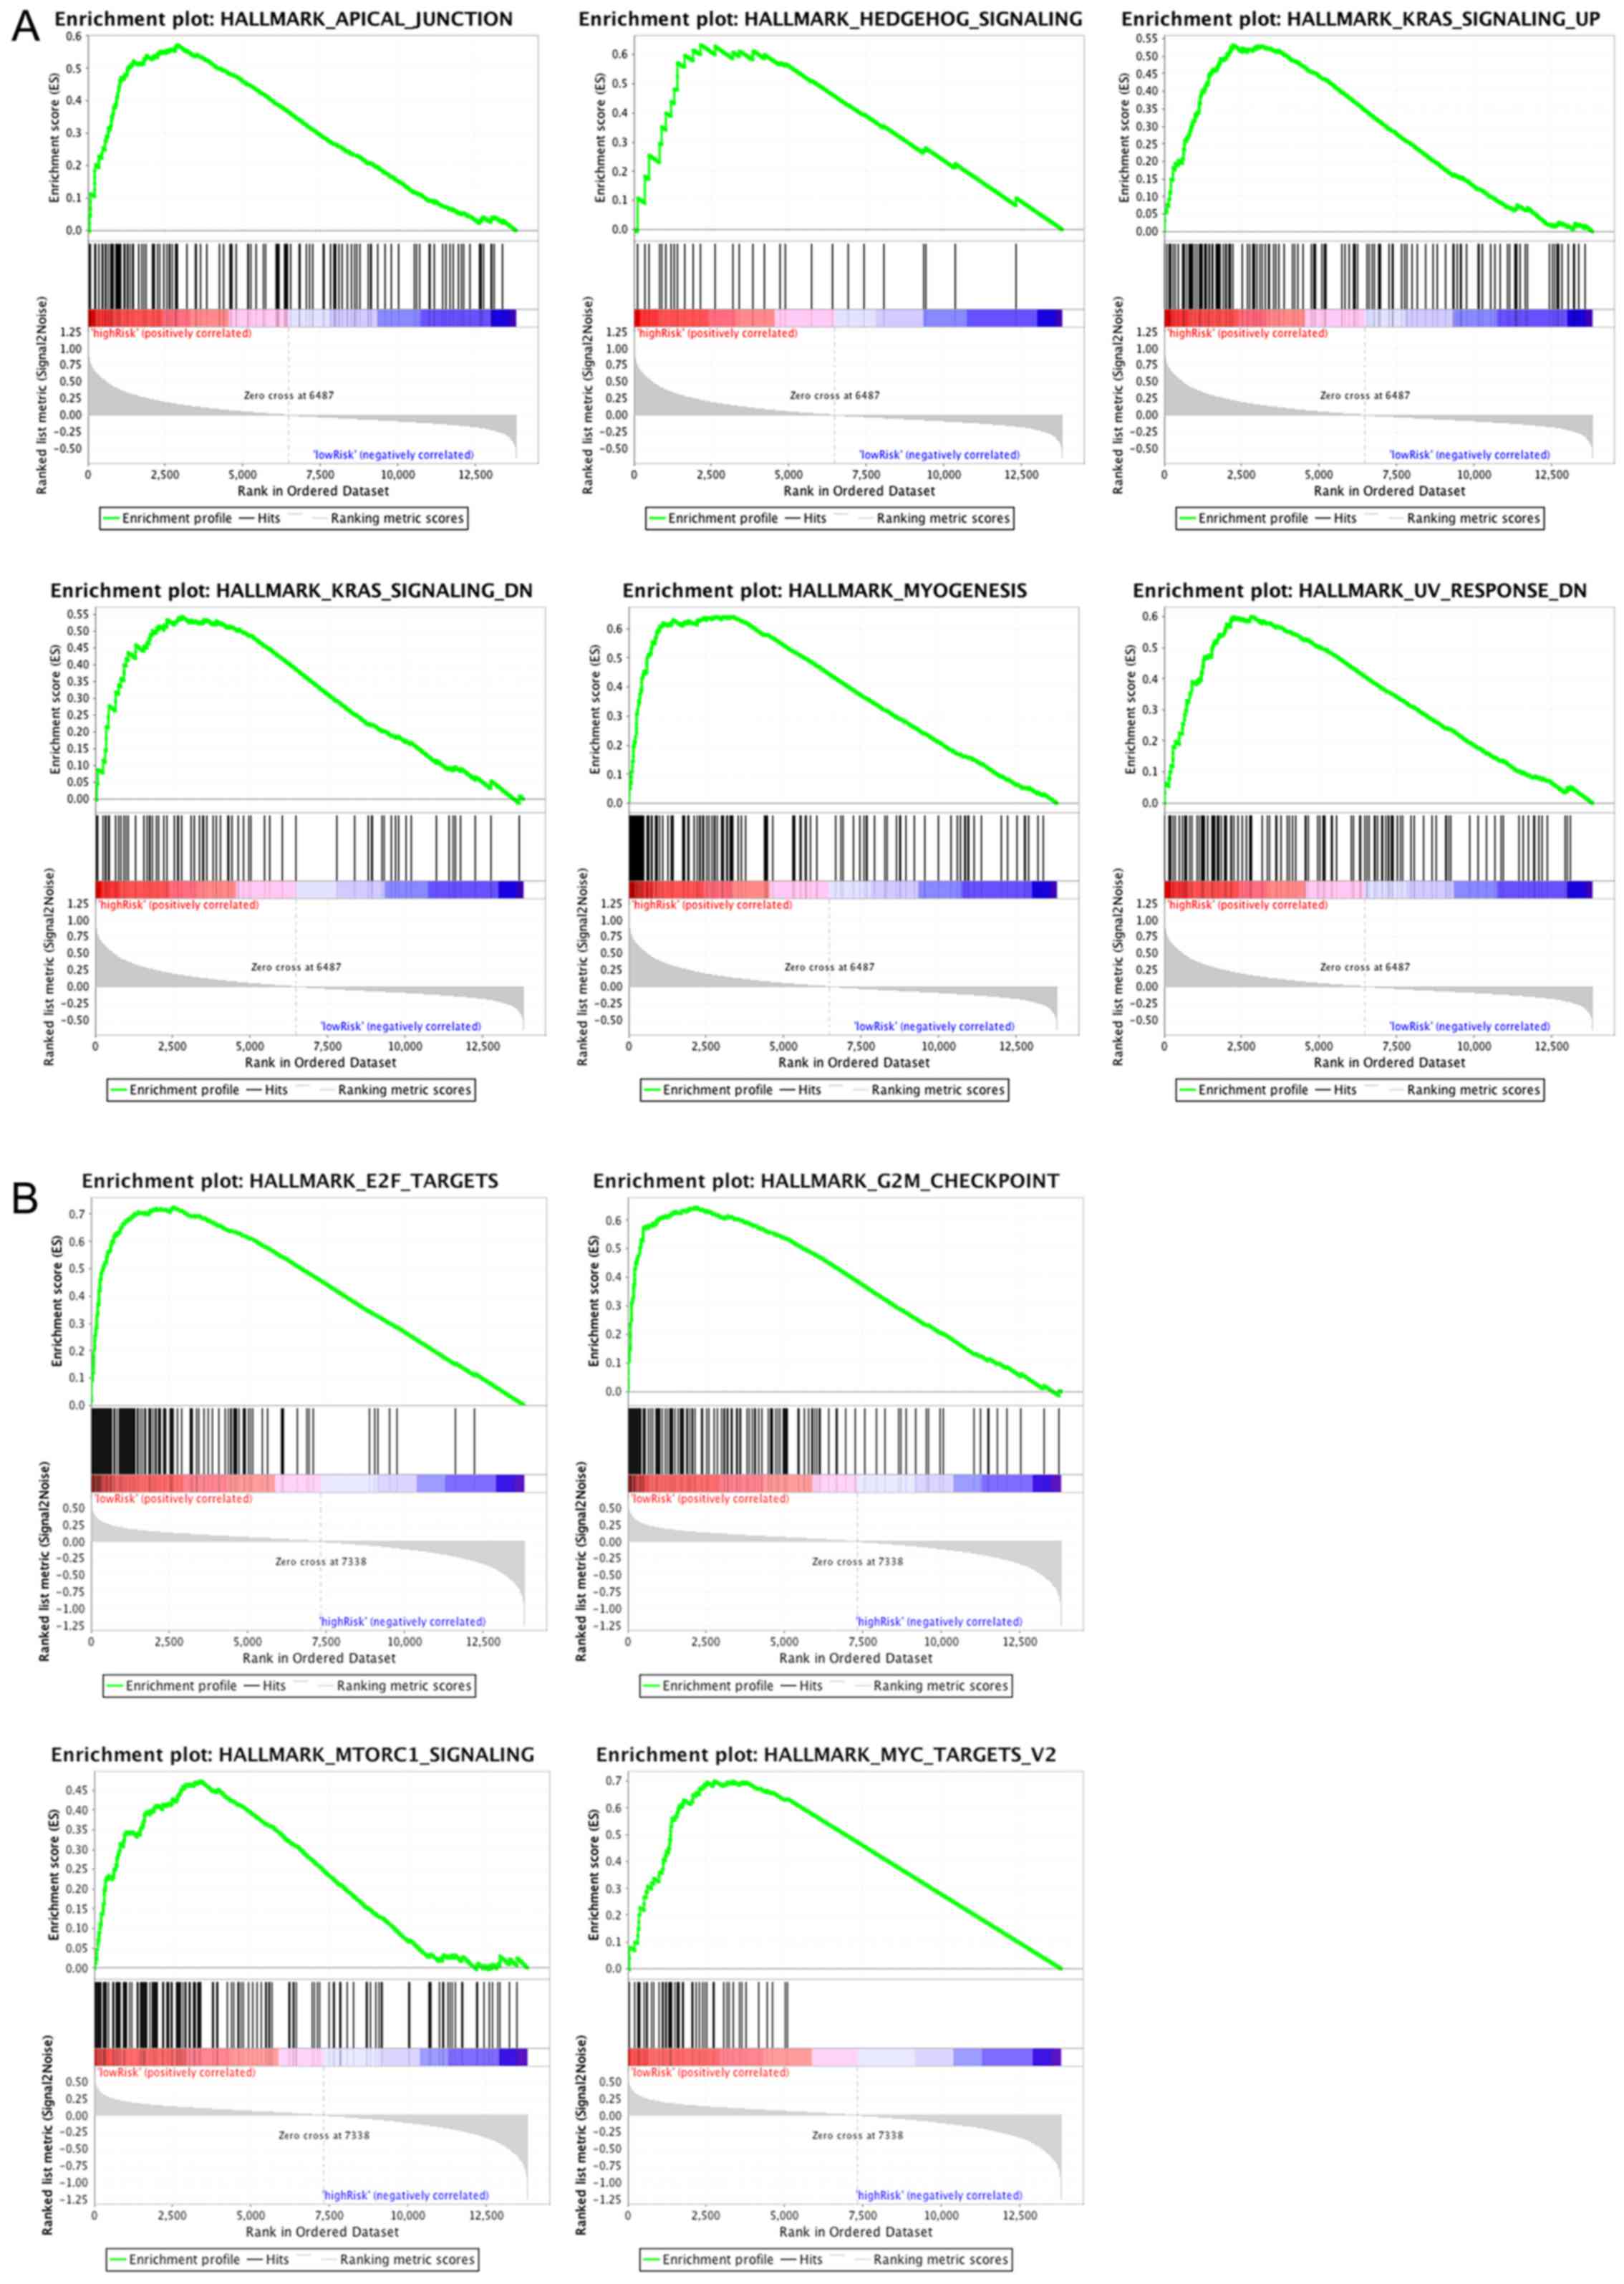
The pathways significantly enriched in the high- and
low-risk groups were stored in the GSEA folder, of which six and
four pathways were respectively enriched in the two groups shown in
Fig. 10. The increasing curve
trends demonstrated that the top-ranked genes were preferentially
enriched in the aforementioned pathways. However, the declining
curves showed a gradual decrease in the number of genes that were
enriched in pathways. CLDN11, APOD and CHRDL1
are involved in a total of five GSEA pathways
(‘Hallmark_Apical_Junction’, ‘Hallmark_Mtorc1_Signaling’,
‘Hallmark_Kras_Signaling_Up’, ‘Hallmark_Hedgehog_ Signaling’ and
‘Hallmark_Kras_Signaling_Dn’).
Discussion
Changes in DNA methylation have crucial roles during
the early stages of GC; therefore, aberrant DNA methylation is a
major change differentiating GC subtypes from the very first stage
(2,5,6).
Among the 100 genes with aberrant epigenetic changes that have
crucial roles during the early stages of GC (7,8),
CLIP4 is of particular interest as it is involved in tumor
metastasis and its promoter methylation is associated with an
increase in GC severity (9). Thus,
it is worth exploring CLIP4 DNA methylation-associated genes
that may help to further understand the function of CLIP4 in
the pathogenesis of GC and provide potential diagnostic biomarkers
for clinical treatment.
In the present study, the methylation sequencing
information and mRNA expression profiling data of 393 GC samples
were downloaded from the TCGA database and used as the training
dataset to screen for significant DEGs associated with CLIP4
DNA methylation. The TCGA database is a large-scale cancer genomics
project that has generated an overwhelming amount of cancer
genomics data from multiple technical platforms that is of great
value to cancer research (30).
Consequently, several elegant studies have demonstrated the value
of analyzing networks based on this database (31). Of the DEGs with differential
expression between samples with CLIP4 hyper- and hypo-methylation,
35 genes were identified to be significantly associated with GC
prognosis (OS) using the univariate Cox regression analysis, out of
which three genes (CLDN11, APOD and CHRDL1)
were significantly associated with OS. These genes were selected as
prognostic gene signatures to establish a risk assessment system,
which indicated that the prognosis of patients in the low-risk
group was significantly improved compared with those in the
high-risk group. Reliability tests were performed using a
validation dataset that included the methylation sequencing
information and mRNA expression profiling data of the other 157 GC
samples (18) downloaded from the
GEO database (32).
All three genes were associated with CLIP4
DNA methylation and prognosis of patients with GC. CLDN11 is a
member of the claudin family of proteins, which are transmembrane
proteins that have crucial roles in tight junction (TJ) formation
and function (33). TJs are
intercellular junctions that are crucial for paracellular solute
transport and cell polarity maintenance. Tumor cells commonly
exhibit structural and functional deficiencies in their TJs
(34), and aberrant expression of
claudin proteins is also observed in various cancer types (35,36).
For example, CLDN11 is silenced in GC via hypermethylation of its
promoter region, which contributes to GC by increasing cellular
motility and invasiveness (33).
DEGs associated with risk were confirmed to be enriched in ‘cell
adhesion’ and ‘cell-cell adhesion’ GO terms, and enriched in the
‘Hallmark_Apical_Junction’ pathway in GSEA analysis. ApoD is a
small, soluble lipid carrier expressed in most human tissues,
particularly in the glia of the nervous system (37,38).
It is elevated in various pathological situations, particularly in
patients with nervous system diseases, including Alzheimer’s
disease, Parkinson’s disease and schizophrenia (39,40).
It has also been indicated in the transport of membrane lipids and
may be involved in the clearance and/or repair of damaged
membranes, potentially by the quenching of harmful materials
released by neurons and glial cells in response to damage or
recruitment of lipids to expanding membranes (37). GO analysis indicated that the DEGs
were enriched in ‘nervous system development’. CHRDL1 is a secreted
protein that acts as an antagonist of bone morphogenetic protein
(BMP), which activates BMP receptor (BMPR) II (41,42).
The activation of intracellular signaling via BMPR induces a series
of responses, including proliferation, migration and invasion in
various tumor types (43).
Furthermore, direct experimental evidence suggests that CHRDL1 has
an important role in embryonic cell differentiation and in the
adult brain (44,45), and that CHRDL1 expression is
significantly downregulated in GC tissues and associated with poor
survival (39). In the current
study, DEGs were confirmed to be enriched in ‘signal transduction’,
‘cell proliferation’, and ‘negative regulation of cell
proliferation’ via GO analysis, and enriched in
‘Hallmark_Mtorc1_Signaling’, ‘Hallmark_Kras_Signaling_Up’,
‘Hallmark_Hedgehog_ Signaling’, and ‘Hallmark_Kras_Signaling_Dn’
via GSEA analysis. As CLDN11 and CHRDL1 are established factors
involved in GC (31,39), it is reasonable to hypothesize that
the risk assessment system constructed in the present study is
reliable and may prove useful in clarifying the pathogenic process
of GC.
However, there are several limitations in the
present study. The predictive capability of the present model was
established by bioinformatics analysis and it has not been
validated in direct experiments. Thus, this model may only provide
a direction for further investigation of GC patients with
CLIP4 promoter methylation. Additionally, the survival time
and pathological staging of different individuals in the two
data-sets were different, and the therapy data was not available in
the validation dataset. Some data bias between training and
validation cohort may exist and may impact the accuracy of the
analysis. Furthermore, certain information was not available from
the original dataset, including the type of chemotherapy or
radiotherapy, and whether surgery was performed. However, from
Table II, the P-value of
chemotherapy in univariate Cox analysis and that of targeted
molecular therapy in multivariate Cox analysis are both >0.05.
Therefore, these two factors were not considered as independent
risk factors for OS. Whereas, the risk score established by our
study can be considered as independent risk factor for prognosis as
the produced P<0.05 in univariate and multivariate Cox analyses.
Therefore, the scoring system established in the current study may
be useful in predicting the prognosis of GC although further
studies are required prior to clinical use.
In summary, the current study study provided a
credible risk assessment model for the predicting GC prognosis
based on comprehensive bioinformatic analysis of three CLIP4
DNA methylation-associated genes (CLDN11, APOD and
CHRDL1) in two independent datasets. The risk value may be
useful as an independent prognostic factor. CLDN11,
APOD and CHRDL1 expression was significantly
associated with CLIP4 DNA methylation and GC diagnosis and
thus, may be potential prognostic biomarkers.
Funding
No funding was received.
Availability of data and materials
The datasets used and/or analyzed during the current
study are available from the corresponding author on reasonable
request.
Authors’ contributions
CH performed data analyses and wrote the manuscript.
YZ and CL contributed significantly in data analyses. YK conceived
and designed the study. All authors read and approved the final
manuscript.
Ethics approval and consent to
participate
In the original articles of the datasets, the trials
were approved by the local institutional review boards of all
participating centres, and informed consent was obtained from all
patients.
Patient consent for publication
Not applicable.
Competing interests
The authors declare that they have no competing
interests.
Acknowledgments
Not applicable.
Abbreviations:
|
GC
|
gastric cancer
|
|
DEGs
|
differentially expressed genes
|
|
CLIP4
|
CAP-Gly domain containing linker
protein family member 4
|
|
TCGA
|
The Cancer Genome Atlas
|
|
EGFR
|
epidermal growth factor receptor
|
|
GEO
|
Gene Expression Omnibus
|
|
GO
|
gene ontology
|
|
GSEA
|
gene set enrichment analysis
|
|
BH
|
Benjamini-Hochberg
|
|
OS
|
overall survival
|
|
KM
|
Kaplan-Meier
|
|
CLDN11
|
claudin-11, APOD, apolipoprotein D
|
|
CHRDL1
|
chordin-like 1
|
|
BMP
|
bone morphogenetic protein
|
|
BMPR
|
bone morphogenetic protein
receptor
|
References
|
1
|
Ferlay J, Soerjomataram I, Dikshit R, Eser
S, Mathers C, Rebelo M, Parkin DM, Forman D and Bray F: Cancer
incidence and mortality worldwide: Sources methods and major
patterns in GLOBOCAN 2012. Int J Cancer. 136:E359–E386. 2015.
View Article : Google Scholar
|
|
2
|
Chong Y, Mia-Jan K, Ryu H, Abdul-Ghafar J,
Munkhdelger J, Lkhagvadorj S, Jung SY, Lee M, Ji SY and Choi E: DNA
methylation status of a distinctively different subset of genes is
associated with each histologic Lauren classification subtype in
early gastric carcinogenesis. Oncol Rep. 31:2535–2544. 2014.
View Article : Google Scholar
|
|
3
|
Lei Li Z, Luo H, Wang M, Dong Y, Ma L, Liu
Y, Song C, Wang W and Zhang FJ: DNA methylation downregulated
mir-10b acts as a tumor suppressor in gastric cancer. Gastric
Cancer. 18:43–54. 2015. View Article : Google Scholar
|
|
4
|
Ng EK, Chong WW, Jin H, Lam EK, Shin VY,
Yu J, Poon TC, Ng SS and Sung JJ: Differential expression of
microRNAs in plasma of patients with colorectal cancer: A potential
marker for colorectal cancer screening. Gut. 58:1375–1381. 2009.
View Article : Google Scholar
|
|
5
|
Oue N, Mitani Y, Motoshita J, Matsumura S,
Yoshida K, Kuniyasu H, Nakayama H and Yasui W: Accumulation of DNA
methylation is associated with tumor stage in gastric cancer.
Cancer. 106:1250–1259. 2006. View Article : Google Scholar
|
|
6
|
Yamamoto E, Suzuki H, Takamaru H, Yamamoto
H, Toyota M and Shinomura Y: Role of DNA methylation in the
development of diffuse-type gastric cancer. Digestion. 83:241–249.
2011. View Article : Google Scholar
|
|
7
|
Choi J, Cho MY, Jung SY, Jan KM and Kim
HS: CpG Island methylation according to the histologic patterns of
early gastric adenocarcinoma. Korean J Pathol. 2011.469–476. 2011.
View Article : Google Scholar
|
|
8
|
Sapari NS, Loh M, Vaithilingam A and Soong
R: Clinical potential of DNA methylation in gastric cancer: A
meta-analysis. PLoS One. 7:e362752012. View Article : Google Scholar
|
|
9
|
Pirini F, Noazin S, Jahuira-Arias MH,
Rodriguez-Torres S, Friess L, Michailidi C, Cok J, Combe J, Vargas
G and Prado W: Early detection of gastric cancer using global,
genome-wide and IRF4, ELMO1, CLIP4 and MSC DNA methylation in
endoscopic biopsies. Oncotarget. 8:38501–38516. 2017. View Article : Google Scholar
|
|
10
|
Feshchenko EA, Smirnova EV, Swaminathan G,
Teckchandani AM, Agrawal R, Band H, Zhang X, Annan RS, Carr SA and
Tsygankov AY: TULA: An SH3- and UBA-containing protein that binds
to c-Cbl and ubiquitin. Oncogene. 23:4690–4706. 2004. View Article : Google Scholar
|
|
11
|
Kowanetz K, Crosetto N, Haglund K, Schmidt
MH, Heldin CH and Dikic I: Suppressors of T-cell receptor signaling
Sts-1 and Sts-2 bind to Cbl and inhibit endocytosis of receptor
tyrosine kinases. J Biol Chem. 279:32786–32795. 2004. View Article : Google Scholar
|
|
12
|
Tsygankov AY: TULA-family proteins: A new
class of cellular regulators. J Cell Physiol. 228:43–49. 2013.
View Article : Google Scholar
|
|
13
|
Agrawal R, Carpino N and Tsygankov A: TULA
proteins regulate activity of the protein tyrosine kinase Syk. J
Cell Biochem. 104:953–964. 2008. View Article : Google Scholar
|
|
14
|
Chuang JY, Huang YL, Yen WL, Chiang IP,
Tsai MH and Tang CH: Syk/JNK/AP-1 signaling pathway mediates
interleukin-6-promoted cell migration in oral squamous cell
carcinoma. Int J Mol Sci. 15:545–559. 2014. View Article : Google Scholar
|
|
15
|
Luangdilok S, Box C, Patterson L, Court W,
Harrington K, Pitkin L, Rhŷs-Evans P, O-charoenrat P and Eccles S:
Syk tyrosine kinase is linked to cell motility and progression in
squamous cell carcinomas of the head and neck. Cancer Res.
67:7907–7916. 2007. View Article : Google Scholar
|
|
16
|
Holz C, Niehr F, Boyko M, Hristozova T,
Distel L, Budach V and Tinhofer I:
Epithelial-mesenchymal-transition induced by EGFR activation
interferes with cell migration and response to irradiation and
cetuximab in head and neck cancer cells. Radiother Oncol.
101:158–164. 2011. View Article : Google Scholar
|
|
17
|
Lee ST, Feng M, Wei Y, Li Z, Qiao Y, Guan
P, Jiang X, Wong CH, Huynh K and Wang J: Protein tyrosine
phosphatase UBASH3B is overexpressed in triple-negative breast
cancer and promotes invasion and metastasis. Proc Natl Acad Sci
USA. 110:11121–11126. 2013. View Article : Google Scholar
|
|
18
|
Zouridis H, Deng N, Ivanova T, Zhu Y, Wong
B, Huang D, Wu YH, Wu Y, Tan IB, Liem N, et al: Methylation
subtypes and large-scale epigenetic alterations in gastric cancer.
Sci Transl Med. 4:156ra1402012. View Article : Google Scholar
|
|
19
|
Ritchie ME, Phipson B, Wu D, Hu Y, Law CW,
Shi W and Smyth GK: limma powers differential expression analyses
for RNA-sequencing and microarray studies. Nucleic Acids Res.
43:e472015. View Article : Google Scholar
|
|
20
|
Musci RJ, Masyn KE, Uhl G, Maher B, Kellam
SG and Ialongo NS: Polygenic score x intervention moderation: An
application of discrete-time survival analysis to modeling the
timing of first tobacco use among urban youth. Dev Psychopathol.
27:111–122. 2015. View Article : Google Scholar
|
|
21
|
Therneau TM and Grambsch PM: Modeling
Survival Data: Extending the Cox Model. Springer; New York, NY:
2000
|
|
22
|
Bao ZS, Li MY, Wang JY, Zhang CB, Wang HJ,
Yan W, Liu YW, Zhang W, Chen L and Jiang T: Prognostic value of a
nine-gene signature in glioma patients based on mRNA expression
profiling. CNS Neurosci Ther. 20:112–118. 2014. View Article : Google Scholar
|
|
23
|
Cheng W, Ren X, Cai J, Zhang C, Li M, Wang
K, Liu Y, Han S and Wu A: A five-miRNA signature with prognostic
and predictive value for MGMT promoter-methylated glioblastoma
patients. Oncotarget. 6:29285–29295. 2015. View Article : Google Scholar
|
|
24
|
Zhang CB, Zhu P, Yang P, Cai JQ, Wang ZL,
Li QB, Bao ZS, Zhang W and Jiang T: Identification of high risk
anaplastic gliomas by a diagnostic and prognostic signature derived
from mRNA expression profiling. Oncotarget. 6:36643–36651.
2015.
|
|
25
|
Huang W, Sherman BT and Lempicki RA:
Bioinformatics enrichment tools: Paths toward the comprehensive
functional analysis of large gene lists. Nucleic Acids Res.
37:1–13. 2009. View Article : Google Scholar
|
|
26
|
Huang W, Sherman BT and Lempicki RA:
Systematic and integrative analysis of large gene lists using DAVID
bioinformatics resources. Nat Protoc. 4:44–57. 2009. View Article : Google Scholar
|
|
27
|
Mootha VK, Lindgren CM, Eriksson K-F,
Subramanian A, Sihag S, Lehar J, Puigserver P, Carlsson E,
Ridderstråle M and Laurila E: PGC-1alpha-responsive genes involved
in oxidative phosphorylation are coordinately downregulated in
human diabetes. Nat Genet. 34:267–273. 2003. View Article : Google Scholar
|
|
28
|
Subramanian A, Tamayo P, Mootha VK,
Mukherjee S, Ebert BL, Gillette MA, Paulovich A, Pomeroy SL, Golub
TR and Lander ES: Gene set enrichment analysis: A knowledge-based
approach for interpreting genome-wide expression profiles. Proc
Natl Acad Sci USA. 102:15545–15550. 2005. View Article : Google Scholar
|
|
29
|
Ahn J, Han KS, Heo JH, Bang D, Kang YH,
Jin HA, Hong SJ, Lee JH and Ham WS: FOXC2 and CLIP4 : A potential
biomarker for synchronous metastasis of ≤7-cm clear cell renal cell
carcinomas. Oncotarget. 7:51423–51434. 2016. View Article : Google Scholar
|
|
30
|
Hudson TJ, Anderson W, Artez A, Barker AD,
Bell C, Bernabé RR, Bhan MK, Calvo F, Eerola I, Gerhard DS, et al:
International Cancer Genome Consortium: International network of
cancer genome projects. Nature. 464:993–998. 2010. View Article : Google Scholar
|
|
31
|
Yang Y, Han L, Yuan Y, Li J, Hei N and
Liang H: Gene co-expression network analysis reveals common
system-level properties of prognostic genes across cancer types.
Nat Commun. 5:32312014. View Article : Google Scholar
|
|
32
|
Barrett T, Troup DB, Wilhite SE, Ledoux P,
Rudnev D, Evangelista C, Kim IF, Soboleva A, Tomashevsky M and
Marshall KA: NCBI GEO: Archive for high-throughput functional
genomic data. Nucleic Acids Res. 37:D885–D890. 2009. View Article : Google Scholar
|
|
33
|
Agarwal R, Mori Y, Cheng Y, Jin Z, Olaru
AV, Hamilton JP, David S, Selaru FM, Yang J, Abraham JM, et al:
Silencing of claudin-11 is associated with increased invasiveness
of gastric cancer cells. PLoS One. 4:e80022009. View Article : Google Scholar
|
|
34
|
Weinstein RS, Merk FB and Alroy J: The
structure and function of intercellular junctions in cancer. Adv
Cancer Res. 23:23–89. 1976. View Article : Google Scholar
|
|
35
|
Hewitt KJ, Agarwal R and Morin PJ: The
claudin gene family: Expression in normal and neoplastic tissues.
BMC Cancer. 6:1862006. View Article : Google Scholar
|
|
36
|
Morin PJ: Claudin proteins in human
cancer: Promising new targets for diagnosis and therapy. Cancer
Res. 65:9603–9606. 2005. View Article : Google Scholar
|
|
37
|
Provost PR, Villeneuve L, Weech PK, Milne
RW, Marcel YL and Rassart E: Localization of the major sites of
rabbit apolipoprotein D gene transcription by in situ
hybridization. J Lipid Res. 32:1959–1970. 1991.
|
|
38
|
Rassart E, Bedirian A, Do Carmo S, Guinard
O, Sirois J, Terrisse L and Milne R: Apolipoprotein d. Biochimica
et Biophysica Acta (BBA). Protein Struct Mol Enzymol. 1482:185–198.
2000. View Article : Google Scholar
|
|
39
|
Muffat J, Walker DW and Benzer S: Human
ApoD, an apolipoprotein up-regulated in neurodegenerative diseases,
extends lifespan and increases stress resistance in Drosophila.
Proc Natl Acad Sci USA. 105:7088–7093. 2008. View Article : Google Scholar
|
|
40
|
Terrisse L, Poirier J, Bertrand P, Merched
A, Visvikis S, Siest G, Milne R and Rassart E: Increased levels of
apolipoprotein D in cerebrospinal fluid and hippocampus of
Alzheimer’s patients. J Neurochem. 71:1643–1650. 1998. View Article : Google Scholar
|
|
41
|
Pei YF, Zhang YJ, Lei Y, Wu DW, Ma TH and
Liu XQ: Hypermethylation of the CHRDL1 promoter induces
proliferation and metastasis by activating Akt and Erk in gastric
cancer. Oncotarget. 8:23155–23166. 2017.
|
|
42
|
Wang Z, Shen Z, Li Z, Duan J, Fu S, Liu Z,
Bai H, Zhang Z, Zhao J and Wang X: Activation of the BMP-BMPR
pathway conferred resistance to EGFR-TKIs in lung squamous cell
carcinoma patients with EGFR mutations. Proc Natl Acad Sci USA.
112:9990–9995. 2015. View Article : Google Scholar
|
|
43
|
Lei H, Wang J, Lu P, Si X, Han K, Ruan T
and Lu J: BMP10 inhibited the growth and migration of gastric
cancer cells. Tumour Biol. 37:3025–3031. 2016. View Article : Google Scholar
|
|
44
|
Sawala A, Sutcliffe C and Ashe HL:
Multistep molecular mechanism for bone morphogenetic protein
extracellular transport in the Drosophila embryo. Proc Natl Acad
Sci USA. 109:11222–11227. 2012. View Article : Google Scholar
|
|
45
|
Watanabe T, Nagai A, Sheikh AM, Mitaki S,
Wakabayashi K, Kim SU, Kobayashi S and Yamaguchi S: A human neural
stem cell line provides neuroprotection and improves neurological
performance by early intervention of neuroinflammatory system.
Brain Res. 1631:194–203. 2016. View Article : Google Scholar
|