Introduction
Despite the known pathogenic risks and the
development of progressive therapeutic strategies, colorectal
cancer (CRC) has the fourth highest incidence rate among all
cancers and the fifth highest incidence rate of tumor-related
mortalities in China (1-3). CRC development involves a complex
transformation of molecular events; increasing our understanding of
the molecular mechanisms involved in tumor formation and
progression will contribute to the development of novel therapeutic
targets.
Aberrant cellular growth and division are common
features in malignant cells, including CRC cell lines (4). Cell cycle phase progression relies on
a complex network of regulatory proteins, and the relationship
between tumorigenesis and these molecules has been reported in a
number of previous studies (5,6). A
previous attempted to target the cell cycle to suppress the
prominent proliferative capacity of cancer cells (4). Combination treatments, including cell
cycle mediator agents, may be a potential model for improved
curative effects.
Cell division cycle-associated protein 3 (CDCA3) is
referred to as a ‘trigger’ of mitotic entry, and has been reported
to mediate cell cycle progression (7). CDCA3 functions as a part of S phase
kinase-associated protein 1/Cullin 1/F-box (SCF) E3 ubiquitin
ligase complex to mediate destruction of the mitosis- inhibitory
kinase wee1, thus imparting an important effect on the cell cycle
(7-11). SCF E3 ligases regulate numerous
short- acting proteins, such as cell cycle regulators, and mediate
several biological processes, including cancer cellular activities
(12). An increasing number of
reports have demonstrated that CDCA3 expression is increased in
liver cancer (13), oral squamous
cell carcinoma tissue (14),
non-small cell lung cancer (15)
and prostate cancer cells (16),
and may be associated to malignant diseases. However, the role of
CDCA3 in CRC remains unclear. In the present study, the role of
CDCA3 in CRC was examined, and the data provide evidence that
irregular CDCA3 expression may be common in CRCs. In addition, it
was demonstrated that interfering with CDCA3 expression results in
alterations in cell proliferation, which suggested that CDCA3 may
be a promising target for treating CRC.
Materials and methods
Tissue collection
A total of 124 CRC and 124 (71 male; 53 female; age,
23-88 years) adjacent non-tumor colorectal tissue samples,
including a total of 84 patients that were detected in Table I, were surgically obtained between
June 2009 and June 2011 at the First Affiliated Hospital of Nanjing
Medical University (NJMU; Jiangsu, China). The exclusion criteria
were as follows: i) histological diagnosis revealed that the tissue
was not CRC; ii) patients suffered malignancies other than CRC;
iii) patients that have received preoperative radiotherapy and
chemotherapy. The present study was approved by the Research Ethics
Committee of NJMU and written informed consent was obtained from
all patients prior to enrolment in the study. All collected tissues
were frozen in liquid nitrogen immediately following surgical
excision and stored at -80°C. Tumor, node and metastasis (TNM)
stage was classified on the basis of The National Comprehensive
Cancer Network guidelines (17).
Patients who received any preoperative treatments were excluded
from the study.
 | Table IRelationship between CDCA3 expression
and the clinicopathological characteristics of patients with
CRC. |
Table I
Relationship between CDCA3 expression
and the clinicopathological characteristics of patients with
CRC.
|
Characteristics | n | CDCA3 expression
level
| P-value (χ2) |
|---|
Low
(n=42) | High
(n=42) |
|---|
| Age (years) |
| <60 | 27 | 16 | 11 | 0.243 |
| ≥60 | 57 | 26 | 31 | |
| Sex |
| Male | 49 | 23 | 26 | 0.507 |
| Female | 35 | 19 | 16 | |
| Tumor diameter
(cm) |
| <5 | 47 | 31 | 16 | 0.001a |
| ≥5 | 37 | 11 | 26 | |
| TNM stage |
| I/II | 43 | 26 | 17 | 0.049b |
| III/IV | 41 | 16 | 25 | |
| Lymph node
invasion |
| Negative | 46 | 28 | 18 | 0.028b |
| Positive | 38 | 14 | 24 | |
| Depth of
invasion |
| T1 + T2 | 21 | 14 | 7 | 0.078 |
| T3 + T4 | 63 | 28 | 35 | |
| Distant
metastasis |
| Negative | 73 | 38 | 35 | 0.332 |
| Positive | 11 | 4 | 7 | |
| Primary tumor
site |
| Colon | 40 | 18 | 22 | 0.382 |
| Rectum | 44 | 24 | 20 | |
Immunohistochemistry (IHC) analysis
CDCA3 expression in 40 CRC tissues and 40 adjacent
normal specimens were detected by IHC. Immunohistochemical staining
was performed using a standard immunoperoxidase staining procedure.
The tissues were fixed in 10% formalin for 48 h at room
temperature. The paraffin-embedded tumor tissue sections (4
µm) were deparaffinized in xylene at 60°C for 3-4 h and
rehydrated in a graded ethanol series, followed by 15 min of
microwave antigen retrieval in a retrieval buffer [1,000 ml buffer
comprises 2.94 g Tri-sodium citrate, 22.0 ml 0.2 M hydrochloric
acid solution and 978 ml UltraPure Sterile Water (Rockland
Immunochemicals Inc., Limerick, Pennsylvania, USA)]. The sections
were washed in phosphate-buffered saline (PBS) three times and were
placed in 3% H2O2 for 20 min in the dark,
followed by three washes with PBS. The tissues were blocked in 5%
bovine serum albumin (Servicebio, Wuhan, China) for 30 min at room
temperature. The sections were incubated with rabbit polyclonal
anti-CDCA primary antibodies (1:200; cat. no. ab167037; Abcam,
Cambridge, UK) overnight at 4°C, followed by incubation with
horseradish peroxidase (HRP)-conjugated polyclonal goat anti-rabbit
secondary antibodies (1:1,000; cat. no. ab6721; Abcam) at room
temperature for 50 min. The sections were subsequently stained with
the color agent 3,3′-diaminobenzidine and the nuclei were
counterstained with hematoxylin; the sections were dehydrated using
different grades of ethyl alcohol and xylene. Two experienced
pathologists independently reviewed all IHC stainings under an
inverted light microscope (Nikon Eclipse TI-SR; Nikon Corporation,
Tokyo, Japan). The staining intensity was visually scored as
follows: - (score 0), + (score 1), ++ (score 2) and +++ (score 3).
The percentage of CDCA3-positive cells was also classified into
four levels: - (0-1%; score 0), + (1-33%; score 1), ++ (34-66%;
score 2) and +++ (67-100%; score 3). The final CDCA3 staining
scores (Table II) were determined
by the sum of the intensity and percentage scores, defined as
follows: -, no expression (total score 0); +, weak expression
(total score 1-2); ++, moderate expression (total score 3-4); and
+++, strong expression (total score 5-6).
| Table IIStatistical analysis of CDCA3 protein
expression in CRC and adjacent normal tissues. |
Table II
Statistical analysis of CDCA3 protein
expression in CRC and adjacent normal tissues.
| Tissue | n | Total score
| P-value |
|---|
| − | + | ++ | +++ |
|---|
| CRC | 40 | 8 | 10 | 19 | 3 | 0.003 |
| Adjacent normal
tissue | 40 | 16 | 16 | 7 | 1 | |
Cell lines and cell culture
CRC cell lines SW480, LoVo, DLD-1, HCT116, Caco-2
and HT29, and the normal human colorectal epithelial cells NCM460
were maintained in our laboratory. All cell lines were cultured in
Dulbecco’s modified Eagle’s medium (DMEM) supplemented with 10%
fetal bovine serum (Wisent, Inc. St. Bruno, QC, Canada), 100 U/ml
penicillin and 100 µg/ml streptomycin at 37°C in an
atmosphere of humidified air with 5% CO2.
RNA extraction and reverse
transcription-quantitative polymerase chain reaction (RT-qPCR)
assays
Total RNA was extracted from ~100 mg tissues or
cultured cells when they reached a density of 90% using
TRIzol® Reagent (Invitrogen; Thermo Fisher Scientific,
Inc., Waltham, MA, USA), according to the manufacturer’s protocol.
Total RNA was reverse transcribed into cDNA using the PrimeScript
RT reagent kit (Takara Biotechnology Co., Ltd., Dalian, China).
qPCR was performed in a 20 µl volume (2 µl cDNA; 1.2
µl primers; 6.8 µl dH2O; 10 µl
SYBR-Green) using FastStart Universal SYBR-Green Master kit (Roche
Diagnostics, Indianapolis, IN, USA) and a StepOnePlus Real-time PCR
system (Applied Biosystems; Thermo Fisher Scientific, Inc.)
Thermocycling conditions were as follow: Hot-start DNA polymerase
activation at 95°C for 10 min; 40 cycles of 95°C for 15 sec and
60°C for 1 min; followed by one cycle of melt curve analysis at
95°C for 15 sec, 60°C for 1 min, and 95°C for 15 sec. The gene-
specific primer sequences are provided in Table III. The data were analyzed using
the 2−ΔΔCq method (18)
and the mRNA expression levels were normalized to GAPDH. All
RT-qPCR reactions were performed in triplicate.
| Table IIIPrimer sequences used for reverse
transcription- quantitative polymerase chain reaction. |
Table III
Primer sequences used for reverse
transcription- quantitative polymerase chain reaction.
| Gene | Sequence
(5′→3′) |
|---|
| BUB1 | F:
AAATGACCCTCTGGATGTTTGG |
| R:
GCATAAACGCCCTAATTTAAGCC |
| BUB1B | F:
AAATGACCCTCTGGATGTTTGG |
| R:
GCATAAACGCCCTAATTTAAGCC |
| BUB3 | F:
GGTTCTAACGAGTTCAAGCTGA |
| R:
GGCACATCGTAGAGACGCAC |
| CCNA2 | F:
CGCTGGCGGTACTGAAGTC |
| R:
GAGGAACGGTGACATGCTCAT |
| CCNB1 | F:
TCGCATCAAACTCTCTGGCTA |
| R:
TGAGCGACTAAACTCACCACT |
| CCNB2 | F:
CCGACGGTGTCCAGTGATTT |
| R:
TGTTGTTTTGGTGGGTTGAACT |
| CCNE1 | F:
AAGGAGCGGGACACCATGA |
| R:
ACGGTCACGTTTGCCTTCC |
| CDCA3 | F:
TGGTATTGCACGGACACCTA |
| R:
TGTTTCACCAGTGGGCTTG |
| CDC20 | F:
GCACAGTTCGCGTTCGAGA |
| R:
CTGGATTTGCCAGGAGTTCGG |
| CDC25A | F:
GTGAAGGCGCTATTTGGCG |
| R:
TGGTTGCTCATAATCACTGCC |
| CDC25C | F:
TCTACGGAACTCTTCTCATCCAC |
| R:
TCCAGGAGCAGGTTTAACATTTT |
| CDC45 | F:
TTCGTGTCCGATTTCCGCAAA |
| R:
TGGAACCAGCGTATATTGCAC |
| CDC6 | F:
GCCGAACTAGAACAGCATCTT |
| R:
GGGCTGGTCTAATTTTTCCTGC |
| CDK1 | F:
TGGGAAGTTGGTAGCTCTGAA |
| R:
CCAGGGTGCTTGTCCATGTA |
| CDK2 | F:
TGTTTAACGACTTTGGACCGC |
| R:
CCATCTCCTCTATGACTGACAGC |
| CDK4 | F:
GGGGACCTAGAGCAACTTACT |
| R:
CAGCGCAGTCCTTCCAAAT |
| CHEK1 | F:
ATATGAAGCGTGCCGTAGACT |
| R:
TGCCTATGTCTGGCTCTATTCTG |
| CHEK2 | F:
TCTCGGGAGTCGGATGTTGAG |
| R:
CCTGAGTGGACACTGTCTCTAA |
| E2F1 | F:
ACGCTATGAGACCTCACTGAA |
| R:
TCCTGGGTCAACCCCTCAAG |
| E2F2 | F:
CGTCCCTGAGTTCCCAACC |
| R:
GCGAAGTGTCATACCGAGTCTT |
| ESPL1 | F:
CCGCCTTGAAGGAGTTCCTG |
| R:
GGGGTAGACACTAAGTAGCCAT |
| GAPDH | F:
GTGGACATCCGCAAAGAC |
| R:
AAAGGGTGTAACGCAACTA |
| MAD2L1 | F:
GAGAAGTCCGAAGAAACTCACG |
| R:
CCGAAGCGTTGAGAGGTTCC |
| MCM2 | F:
ATGGCGGAATCATCGGAATCC |
| R:
GGTGAGGGCATCAGTACGC |
| MCM3 | F:
TCTAAGCCGCCATTTCGATTT |
| R:
AAGACGCTGGAAAGCTGGATA |
| MCM6 | F:
GAGGAACTGATTCGTCCTGAGA |
| R:
CAAGGCCCGACACAGGTAAG |
| MCM7 | F:
CCTACCAGCCGATCCAGTCT |
| R:
CCTCCTGAGCGGTTGGTTT |
| PKMYT1 | F:
CATGGCTCCTACGGAGAGGT |
| R:
ACATGGAACGCTTTACCGCAT |
| p21 | F:
TGCAACTACTACAGAAACTGCTG |
| R:
CAAAGTGGTCGGTAGCCACA |
| PLK1 | F:
CAGTCACTCTCCGCGACAC |
| R:
GAGTAGCCGAATTGCTGCTG |
| PTTG1 | F:
ACCCGTGTGGTTGCTAAGG |
| R:
ACGTGGTGTTGAAACTTGAGAT |
| TTK | F:
GTGGAGCAGTACCACTAGAAATG |
| R:
CCCAAGTGAACCGGAAAATGA |
Knockdown and overexpression of CDCA3 and
E2F1
Small interfering (si)RNAs against CDCA3 (siCDCA3),
E2F1 (siE2F1) and negative control (siNC) were designed and
synthesized by Shanghai GenePharma Co., Ltd. (Shanghai, China). The
sequences for the CDCA3 siRNAs were as follows: siRNA1-CDCA3,
sense, 5′-GCAAUAGAUGGAAACCAA ATT-3′ and antisense,
5′-UUUGGUUUCCAUCUAUUGCTT-3′; siRNA2-CDCA3, sense,
5′-GAGUGAAGUAUUUGAAAC UTT-3′, antisense, 5′-AGUUUCAAAUACUCTT-3′;
siRNA3- CDCA3, sense, 5′-GCUCUCCUACUCUUGGUAUTT-3′, antisense,
5′-AUACCAAGAGUAGGAGAGCTT-3′; siE2F1, sense,
5′-CCUGGAAACUGACCAUCAGTT-3′, antisense,
5′-CUGAUGGUCAGUUUCCAGGTT-3′; and siNC, sense,
5′-UUCUCCGAACGUGUCACGUTT-3′, antisense,
5′-ACGUGACACGUUCGGAGAATT-3′. siRNAs (5 µg/ml) were
transfected into SW480 cells using Lipofectamine® 3000
(Invitrogen; Thermo Fisher Scientific, Inc.), following the
manufacturer’s instructions. Following incubation at 37°C for 2
days, assays were performed to assess the knockdown efficiency.
Additionally, an inhibitor lentiviral short hairpin (sh) RNA
against CDCA3 (shCDCA3; 5′-GCAATAGATGGAAACC AAA-3′) synthesized by
Shanghai GenePharma Co., Ltd., which was transfected into SW480
cells (shRNA-SW480) and used in in vitro and in vivo
study, which was designed according to the siRNA1-CDCA3
sequence.
For the CDCA3 overexpression assays, a mammalian
expression plasmid pReceiver-M02-CDCA3 (CDCA3-OE; GeneCopoeia,
Inc., Rockville, MD, USA) was designed to specifically express
CDCA3 and used empty vectors (pReceiver-M02-control) as the
control. Plasmids (5 µg/ml) were transfected into LoVo cells
using Lipofectamine 3000 at 37°C for 24 h, according to the
manufacturer’s protocol. To establish cell lines that stably
overexpress CDCA3 (CDCA3-SOE) or the control (control-SOE), LoVo
cells that transiently transfected with pReceiver-M02-CDCA3 or
pReceiver-M02-control were incubated with G418 (400 µg/ml)
(Sigma-Aldrich; Merck KGaA, Darmstadt, Germany) at 37°C for 12
days; the medium refreshed every 3 days.
shRNA- and shNC-SW480 cells were transiently
transfected with pReceiver-M02-E2F1 (pR-E2F1) or
pReceiver-M02-control (pR-contol) (GeneCopoeia, Inc.) as
aforementioned. In addition, CDCA3-SOE- and control-SOE-LoVo cells
were transiently transfected with si-E2F1 or si-NC (GenePharma Co.,
Ltd, Shanghai, China) following the above process.
Colony formation assay
For colony formation assays, 500 SW480 cells
transfected with siRNA1-CDCA3 or siNC, and CDCA3-OE-LoVo or cells
with empty vectors (control-OE), were plated into 6-well plates 48
h post-transfection. Following incubation at 37°C for 14 days, the
clones were visible. Each well was washed with PBS three times,
fixed with ethyl alcohol for 30 sec and stained with 0.05% crystal
violet for 20 min at room temperature. After washing, the colonies
(≥50 cells/colony) were counted using a Nikon TI-DH light
microscope (Nikon Corporation, Tokyo, Japan) and images captured
using a Canon DS126211 digital camera (Canon, Inc., Tokyo, Japan).
In the later assays, shRNA- and shNC-SW480 cells transiently
transfected with pReceiver-M02-E2F1 (pR-E2F1) or
pReceiver-M02-control (pR-control) (GeneCopoeia, Inc.), as well as
the CDCA3-SOE- and control-SOE-LoVo cells transiently transfected
with si-E2F1 or si-NC (GenePharma Co., Ltd.), were plated into
6-well plates 48 h following transfection and treated as
aforementioned.
Cell proliferation assay
The Cell Counting Kit-8 (CCK-8; Dojindo Molecular
Technologies, Inc., Kumamoto, Japan) assay was used to detect cell
proliferation, according to the manufacturer’s protocol. Cells
(2×10³ cells/well) were seeded in 96-well plates with
100 µl complete culture medium. At 24, 48, 72 and 96 h
incubation, 10 µl CCK-8 was added to each well and the
absorbance was measured 2 h later using a microplate reader at a
test wavelength of 450 nm and a reference wavelength of 630 nm.
Experiments were performed in triplicate.
5-Ethynyl-2′-deoxyuridine (EdU)
assay
The EdU assay kit (cat. no. C10310-3; Guangzhou
RiboBio Co., Ltd., Guangzhou, China) was also used to measure cell
proliferation. Briefly, cells were seeded (2×10⁴
cells/well) into 24-well plates and cultured with DMEM for 24 h.
Subsequently, cells were incubated with EdU (200 µl; 50
µM) for 2 h at 37°C, fixed in 4% formaldehyde for 30 min and
permeabilized at room temperature with 0.5% Triton X-100 for 10
min. A total of 400 µl 1X ApolloR (every 400 µl
consists of 374.8 µl H2O, 20 µl reagent B,
4 µl reagent C, 1.2 µl reagent D and 4 mg reagent E)
reaction cocktail was added and the cells were incubated for 30
min; Hoechest 33342 (400 µl) was added for 30 min to
visualize the nuclei. A Nikon TI-DH light microscope (Nikon
Corporation, Tokyo, Japan) was used to capture images of the cells.
The mean number cells in three fields for each sample was
calculated to assess cell proliferation.
Flow cytometric analysis of the cell
cycle and apoptosis
Following 48 h transfection, cells were digested
with trypsin and centrifuged at room temperature for 5 min at 300 x
g. Cells were washed carefully with PBS two times, fixed in 75%
ethanol and stored at -20°C overnight. Subsequently, the cells were
washed twice with PBS and stained with propidium iodide (PI)
staining solution (500 µl) for 15 min at room temperature in
the dark. Cell cycle analysis was performed using a
fluorescence-activated cell sorting (FACS)Calibur flow cytometer
with BD CellQuest software version 3.0 (BD Biosciences, Franklin
Lakes, NJ, USA).
For apoptosis, cells were stained with PI (10
µg/ml; Sigma-Aldrich; Merck KGaA) and Annexin V-Fluorescein
isothiocyanate (50 µg/ml; BD Biosciences) in the dark for 15
min at room temperature, according to the manufacturer’s
instructions. The data were acquired on a FACScan flow cytometer
and analyzed using flow cytometry (both from BD Biosciences).
Western blotting
Protein lysates were prepared from the cells when
they reached a density of 90% by using a Radioimmunoprecipitation
assay kit (Beyotime Institute of Biotechnology, Shanghai, China),
according to the manufacturer’s protocols. The protein
concentration was determined using the Bicinchoninic Acid Protein
Assay kit (Beyotime Institute of Biotechnology). Proteins (40
µg) of different molecular weights were separated on 10%
SDS-PAGE and subsequently transferred to polyvinylidene difluoride
membranes (EMD Millipore, Billerica, MA, USA). The membranes were
blocked in 5% non-fat milk at room temperature for 2-4 h and
incubated at 4°C overnight with the primary antibodies. The
membranes were subsequently incubated with anti-mouse or
anti-rabbit immunoglobulin G at room temperature for 2 h and washed
with TBS + 0.001% Tween-20 buffer three times. The protein bands
were visualized using Enhanced Chemiluminescence Plus (EMD
Millipore) with a Bio-Imaging System. The specific primary and
secondary antibodies were as follows: polyclonal rabbit anti-CDCA3
(1:500; cat. no. ab167037); monoclonal rabbit anti-E2F1 (1:2,000;
cat. no. ab179445); monoclonal rabbit anti-p21 (1:5,000; cat. no.
ab109520); monoclonal rabbit anti-p27 KIP1 (1:5,000; cat. no.
ab32034); monoclonal rabbit anti-cyclin-dependent kinase 2 (CDK2;
1:5,000; cat. no. ab32147) (all from Abcam); monoclonal rabbit
anti-cyclin D1 (1:20,000; cat. no. ab134175); HRP-conjugated
polyclonal anti-rabbit secondary antibody (1:5,000; cat. no.
GAB007); and HRP-conjugated polyclonal anti-mouse secondary
antibody (1:5,000; cat. no. GAM007) (both from Hangzhou
MultiSciences (Lianke) Biotech Co., Ltd.). Monoclonal mouse
anti-β-actin (1:5,000; cat. no. ab8226; Abcam) was used as an
internal control.
Data of patients and samples from
TCGA
RNA expression data (level 3) were downloaded from
The Cancer Genome Atlas (TCGA; https://cancergenome.nih.gov) database, which provides
normalized data by the RNASeq v2 system. The exclusion criteria
were as follows: i) histological diagnosis revealed that the tissue
was not CRC; ii) patients suffered malignancies other than CRC;
iii) samples without enough data for analysis; and iv) patients
that have received preoperative radiotherapy and chemotherapy.
Subsequently, a total of 337 tumor tissues were used in the
study.
Functional enrichment analysis
Database for Annotation, Visualization and
Integrated Discovery (DAVID) bioinformatics resources (https://david.ncifcrf.gov/) was used for the
functional enrichment analysis, and the Gene Ontology (GO)
biological processes and the Kyoto Encyclopedia of Genes and
Genomes (KEGG) pathways. The criteria were set as P<0.05 and an
enrichment score >1.5.
In vivo tumor xenograft model
A total of 12 Balb/c nude male mice (age, 3-4 weeks;
weight, 13-15 g) were purchased from the Animal Center of NJMU. The
12 mice were randomly divided into two groups (n=6 per group) and
were maintained at 20-26°C, 40-70% humidity, ammonia concentration
<14 mg/m3, with a 12-h light/dark cycle and received
5 g food and 100 ml water per 100 g body weight per day. A total of
2×10⁶ stably transfected cells (shCDCA3 or shNC) were
randomly and subcutaneously injected into each mouse in their right
armpit. Bidimensional tumor measurements were taken with Vernier
calipers every 4 days. All mice were sacrificed 4 weeks later and
the tumors were surgically removed. Implanted tumor volume was
calculated according to the following the formula: Volume =
(width2 x length)/2. Following sacrifice, tumor tissues
were prepared for IHC as aforementioned and stained with rabbit
monoclonal anti-Ki-67 (1:500; cat. no. ab92742; Abcam). The
staining intensity was visually scored as follows (19): - (score 0), + (score 16), ++ (score
32) and +++ (score 50). The percentage scores were determined by
half the percentage of Ki-67-positive cells, for example, 100%
Ki-67-positive cells scored 50. The final staining scores (a
minimum value of 0 and a maximum of 100) were determined by the sum
of the intensity and percentage scores. All animal experiments were
approved and conducted according to the guidelines of The NJMU
Institutional Animal Care and Use Committee.
Statistical analysis
Data are expressed as the mean ± standard deviation.
GraphPad Prism 5.0 software (GraphPad Software Inc., La Jolla, CA,
USA) and the Statistical Program for Social Sciences 20.0 (IBM
Corp., Armonk, NY, USA) were used to analyze the data. The clinical
features were analyzed using χ2 test. The Wilcoxon
rank-sum test was used to compare CDCA3 protein expression in CRC
and adjacent normal tissue. Student’s t-test was used to compare
the treated and control groups. One-way analysis of variance and
the least-significant difference post hoc test were used to compare
data sets containing multiple groups. Pearson’s correlation test
was used to examine gene co-expressions; r≥0.5 was considered to
indicate a relatively strong correlation. Cumulative survival
analysis was assessed using the Kaplan-Meier method followed by
log-rank test. P<0.05 was considered to indicate a statistically
significant difference.
Results
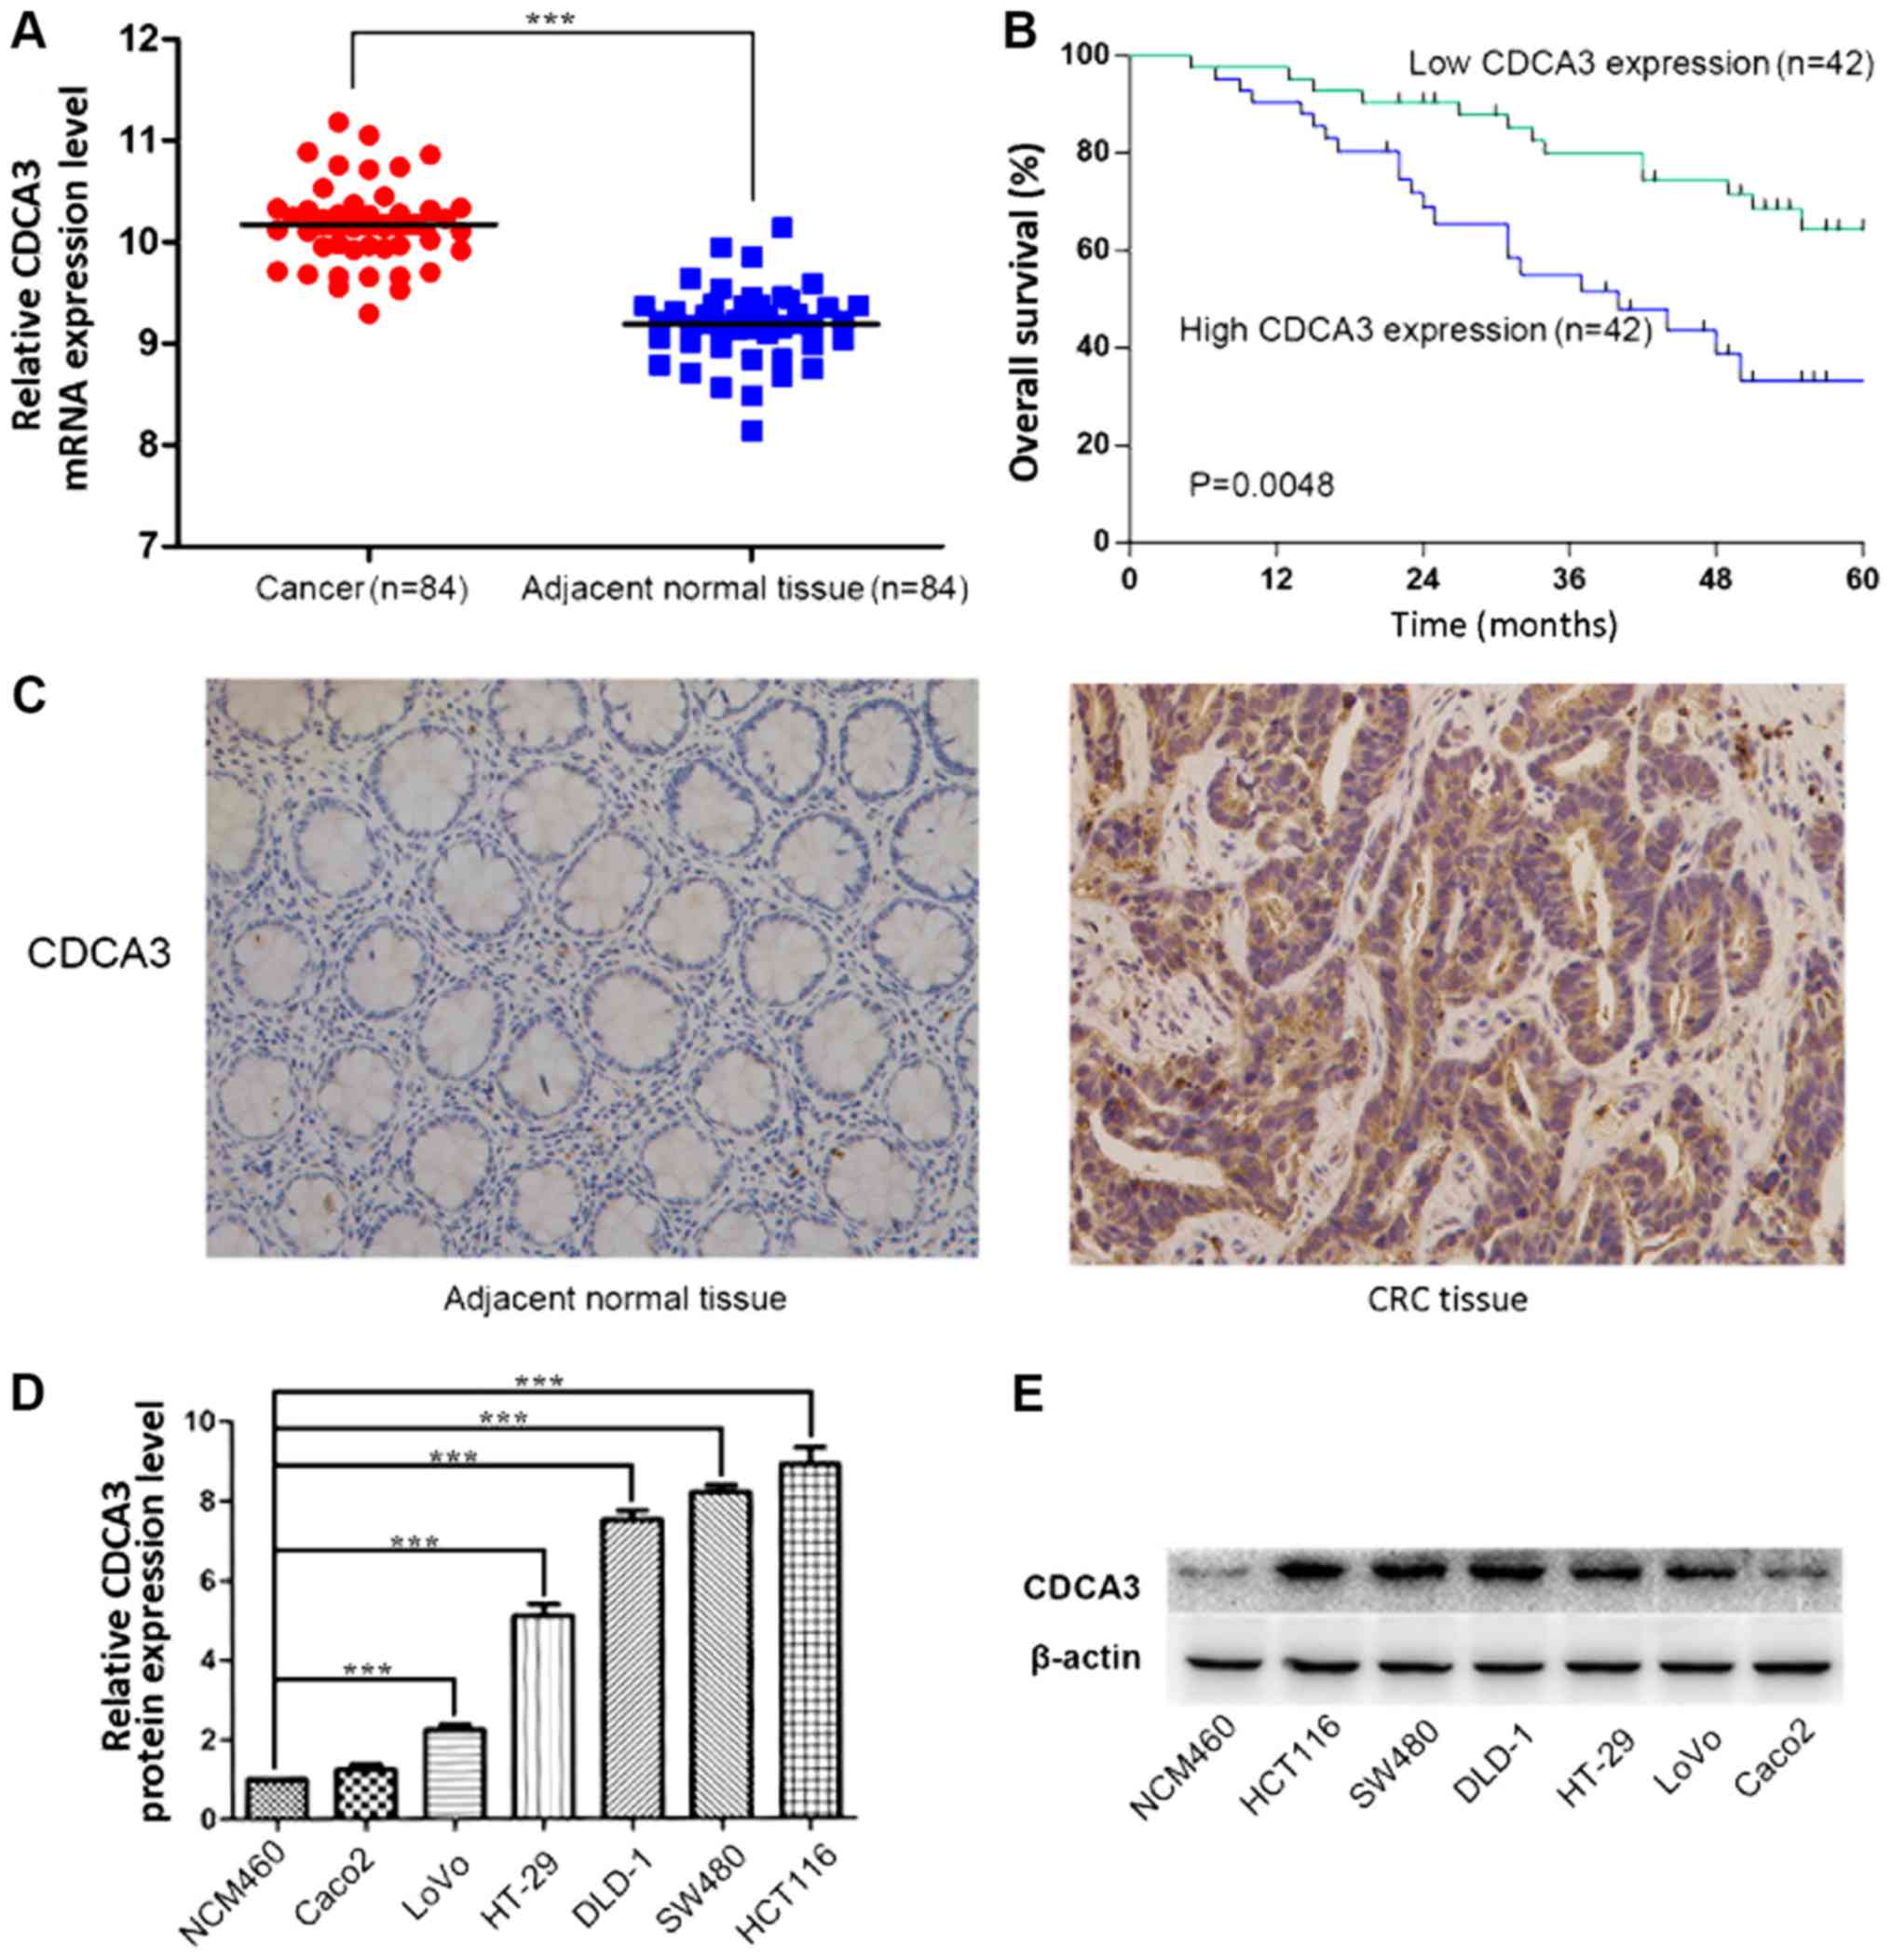
CDCA3 expression is increased in human
CRC tissues and is associated with poor prognosis
To investigate the functional role of CDCA3 in CRC,
the mRNA expression levels of CDCA3 were compared in 84 pairs of
CRC and adjacent normal tissues using RT-qPCR, which indicated that
CDCA3 expression was significantly higher in CRC tissues compared
with adjacent normal tissue (P<0.001; Fig. 1A). The relationship between CDCA3
expression and clinicopathological features of patients with CRC
was examined; the 84 CRC tissues were classified into two groups
according to the median CDCA3 expression (10.15), high (n=42) and
low (n=42) CDCA3 expression (Table
I). Notably, high CDCA3 expression levels were significantly
related with larger tumor size (P=0.001), TNM stage (P=0.049) and
lymph node invasion (P=0.028). However, no significant differences
were identified between CDCA3 expression and other features, such
as age (P=0.243) and sex (P=0.507). Kaplan-Meier curve analysis
indicated that the overall survival for patients with high CDCA3
expression was significantly shorter compared with patients with
low CDCA3 expression (P=0.0048; Fig.
1B). CDCA3 expression in 40 CRC tissues and 40 adjacent normal
specimens were detected by IHC. The results demonstrated that CDCA3
protein is mainly expressed in the cytoplasm and that CDCA3 protein
was significantly overexpressed in cancerous tissues compared to
adjacent normal tissues (Fig. 1C
and Table II, respectively).
These results indicated that the overexpression of CDCA3 may be
related to poor prognosis of CRC.
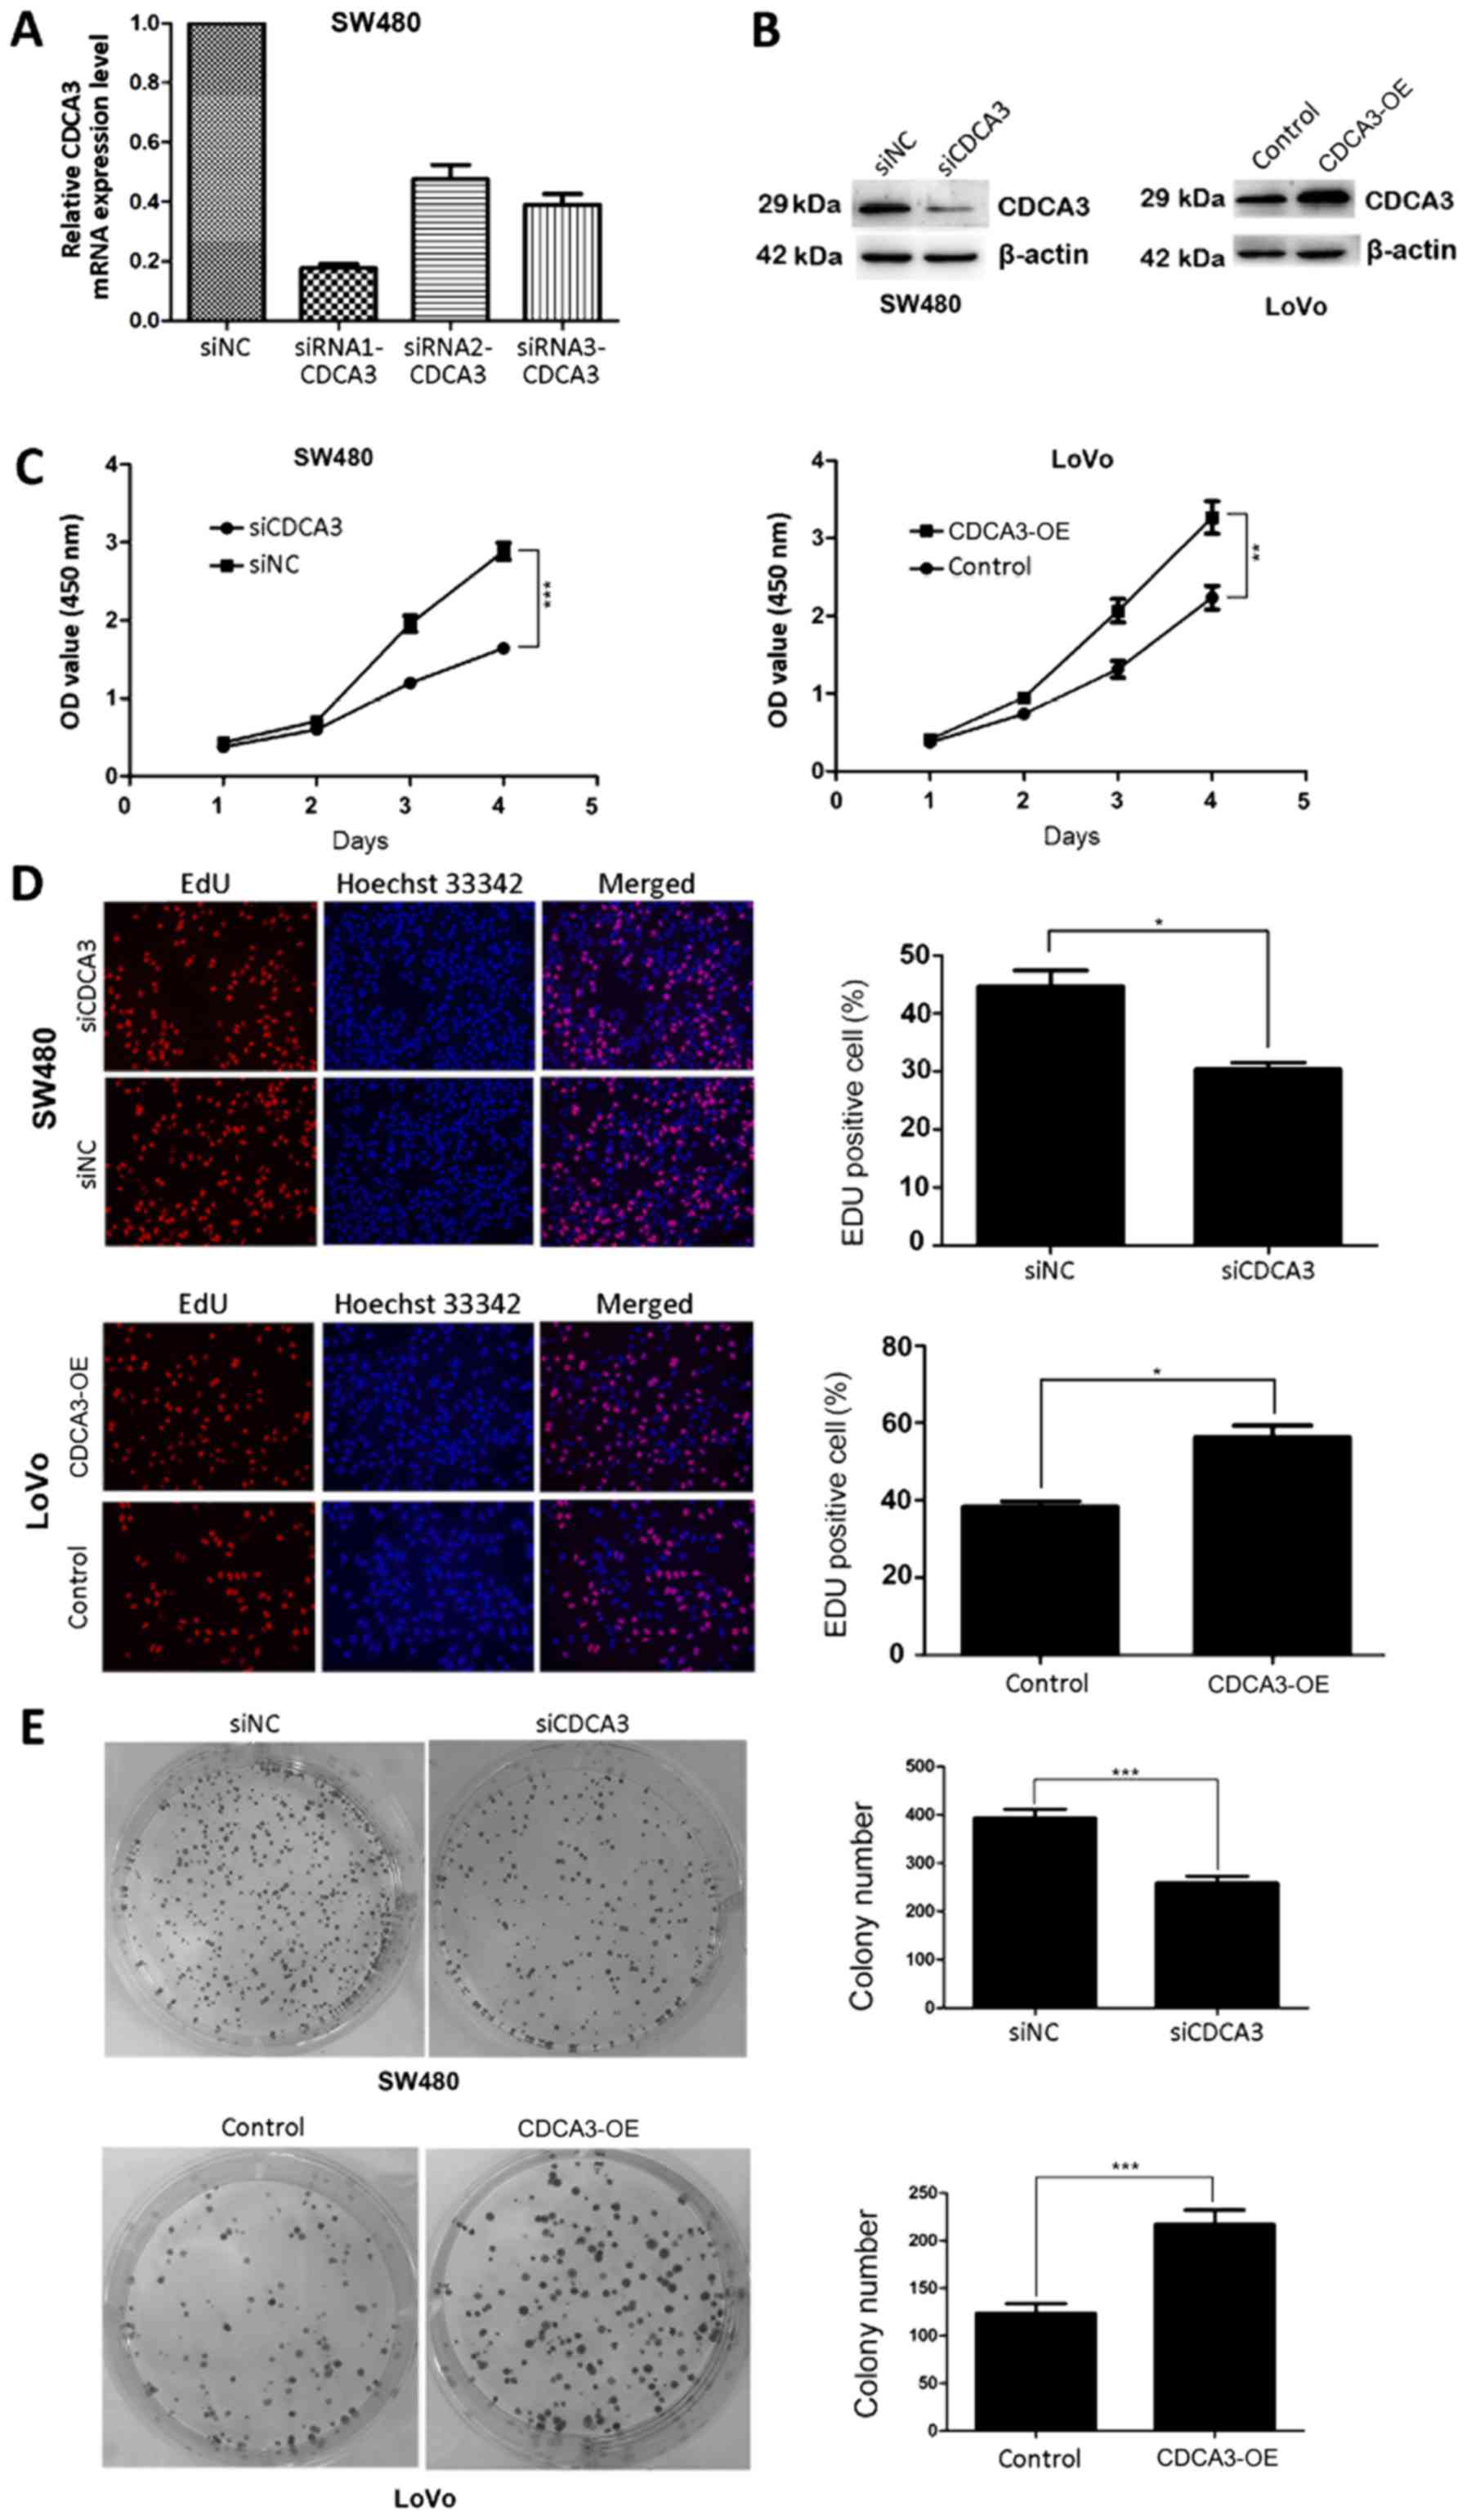
Expression of CDCA3 is upregulated in CRC
tissues and cell lines
To further investigate the functional role of CDCA3
in CRC cells, CDCA3 mRNA and protein expression levels were
examined in six CRC cell lines using RT-qPCR and western blotting
(Fig. 1D and E, respectively),
which demonstrated that the expression of CDCA3 is upregulated in
CRC cells. Subsequently, considering that SW480 cells presented
high expression of CDCA3 and cultures were easy to maintain, these
cells were transiently transfected with siRNAs targeting CDCA3
(siRNA1-CDCA3, siRNA2-CDCA3 and siRNA3-CDCA3) or with siNC. RT-qPCR
analysis was performed 48 h post-transfection and it was revealed
that siRNA1-CDCA3 exhibited a higher efficiency of interference
compared with siRNA2-CDCA3 and siRNA3-CDCA3 (Fig. 2A); siRNA1-CDCA3-transfected SW480
cells were selected for use in subsequent experiments and, for
simplicity, will be referred to as siCDCA3. Considering that LoVo
cells exhibited a relatively low level of CDCA3 expression of
CDCA3, but still higher than NCM460 cells, LoVo cells were
transiently transfected with either CDCA3 overexpression plasmids
or with empty vector. The results of western blotting demonstrated
that the expression level of CDCA3 was suppressed in
siCDCA3-transfected SW480 cells and upregulated in
CDCA3-OE-transfected LoVo cells (Fig.
2B).
Reduced CDCA3 expression inhibits cell
growth in CRC cells
CDCA3 is a known ‘trigger’ of mitosis entry
(7), it was hypothesized that
CDCA3 may serve a role in CRC cell proliferation. Results from
CCK-8 assays indicated that siCDCA3-transfected CRC cells exhibited
significantly decreased proliferation compared with cells
transfected with siNC (Fig. 2C).
EdU and Hoechst 33342 staining further confirmed that knockdown of
CDCA3 expression significantly decreased the rate of proliferation
(Fig. 2D). Similarly,
colony-formation assay results demonstrated that CDCA3 knockdown
significantly decreased clonogenic survival of SW480 cells
(Fig. 2E). Conversely,
CDCA3-OE-transfected LoVo cells exhibited significantly increased
cell proliferation (Fig. 2C-E).
Therefore, these results provided evidence that CDCA3 may promote
proliferation in CRC cell lines.
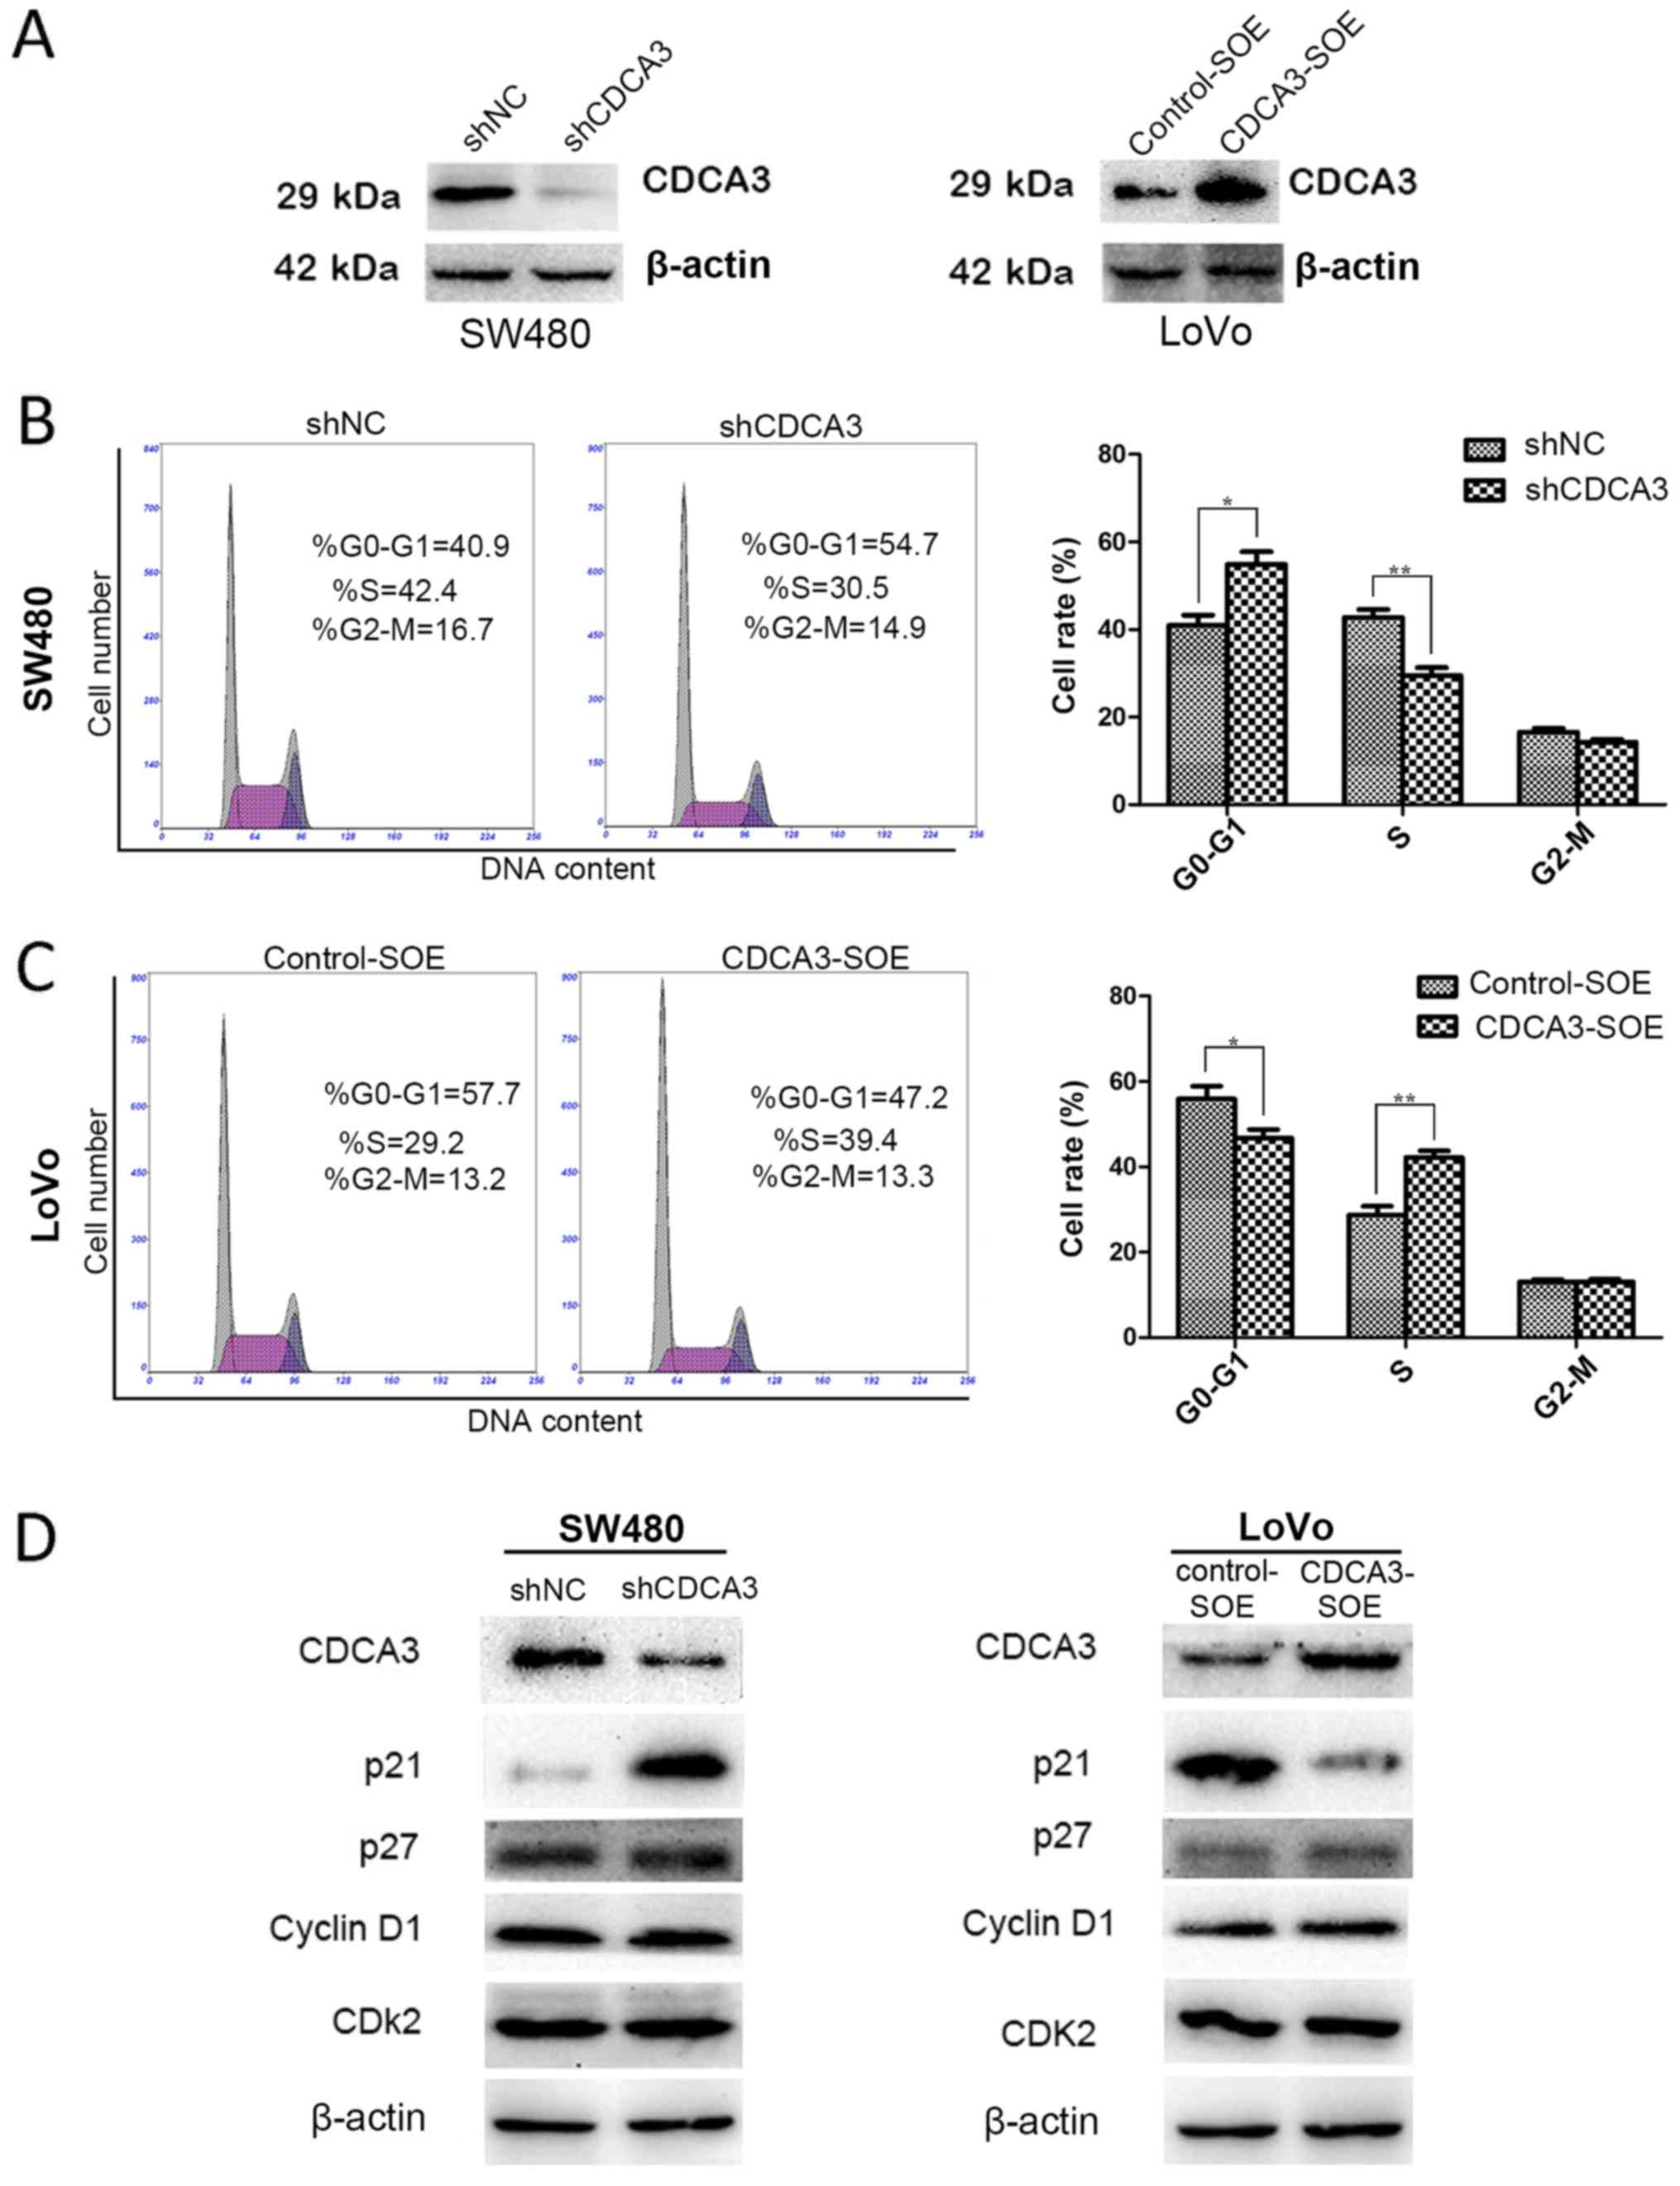
CDCA3 influences the G1/S phase
transition of the cell cycle by regulating p21 expression
To explore the possible roles of CDCA3 in
influencing CRC cell proliferation, cell cycle distribution and
apoptotic cell fraction were examined. To constitutively suppress
or overexpress CDCA3, four stable cell lines were constructed:
shCDCA3-SW480 and shNC-SW480, as well as CDCA3-SOE-LoVo and
Control-SOE-LoVo. The efficiency of knockdown or overexpression was
confirmed by western blotting (Fig.
3A). shCDCA3 significantly increased the number of cells in G1
phase and decrease the number of cells in S phase compared with
shNC (Fig. 3B). Conversely,
CDCA3-SOE promoted the G1/S transition in LoVo cell lines (Fig. 3C). However, no significant
difference was detected in the apoptotic cell fraction (data not
shown). Expressions of key regulators of the G1 phase were
evaluated by western blotting to clarify the role of CDCA3 in the
G1/S phase transition. Knockdown of CDCA3 led to a notably
increased expression of p21 in SW480 cells, whereas p21 expression
was decreased in the CDCA3-overexpressing LoVo cells (Fig. 3D). No obvious differences were
detected in the protein expression levels of p27, cyclin D1 or CDK2
proteins (Fig. 3D).
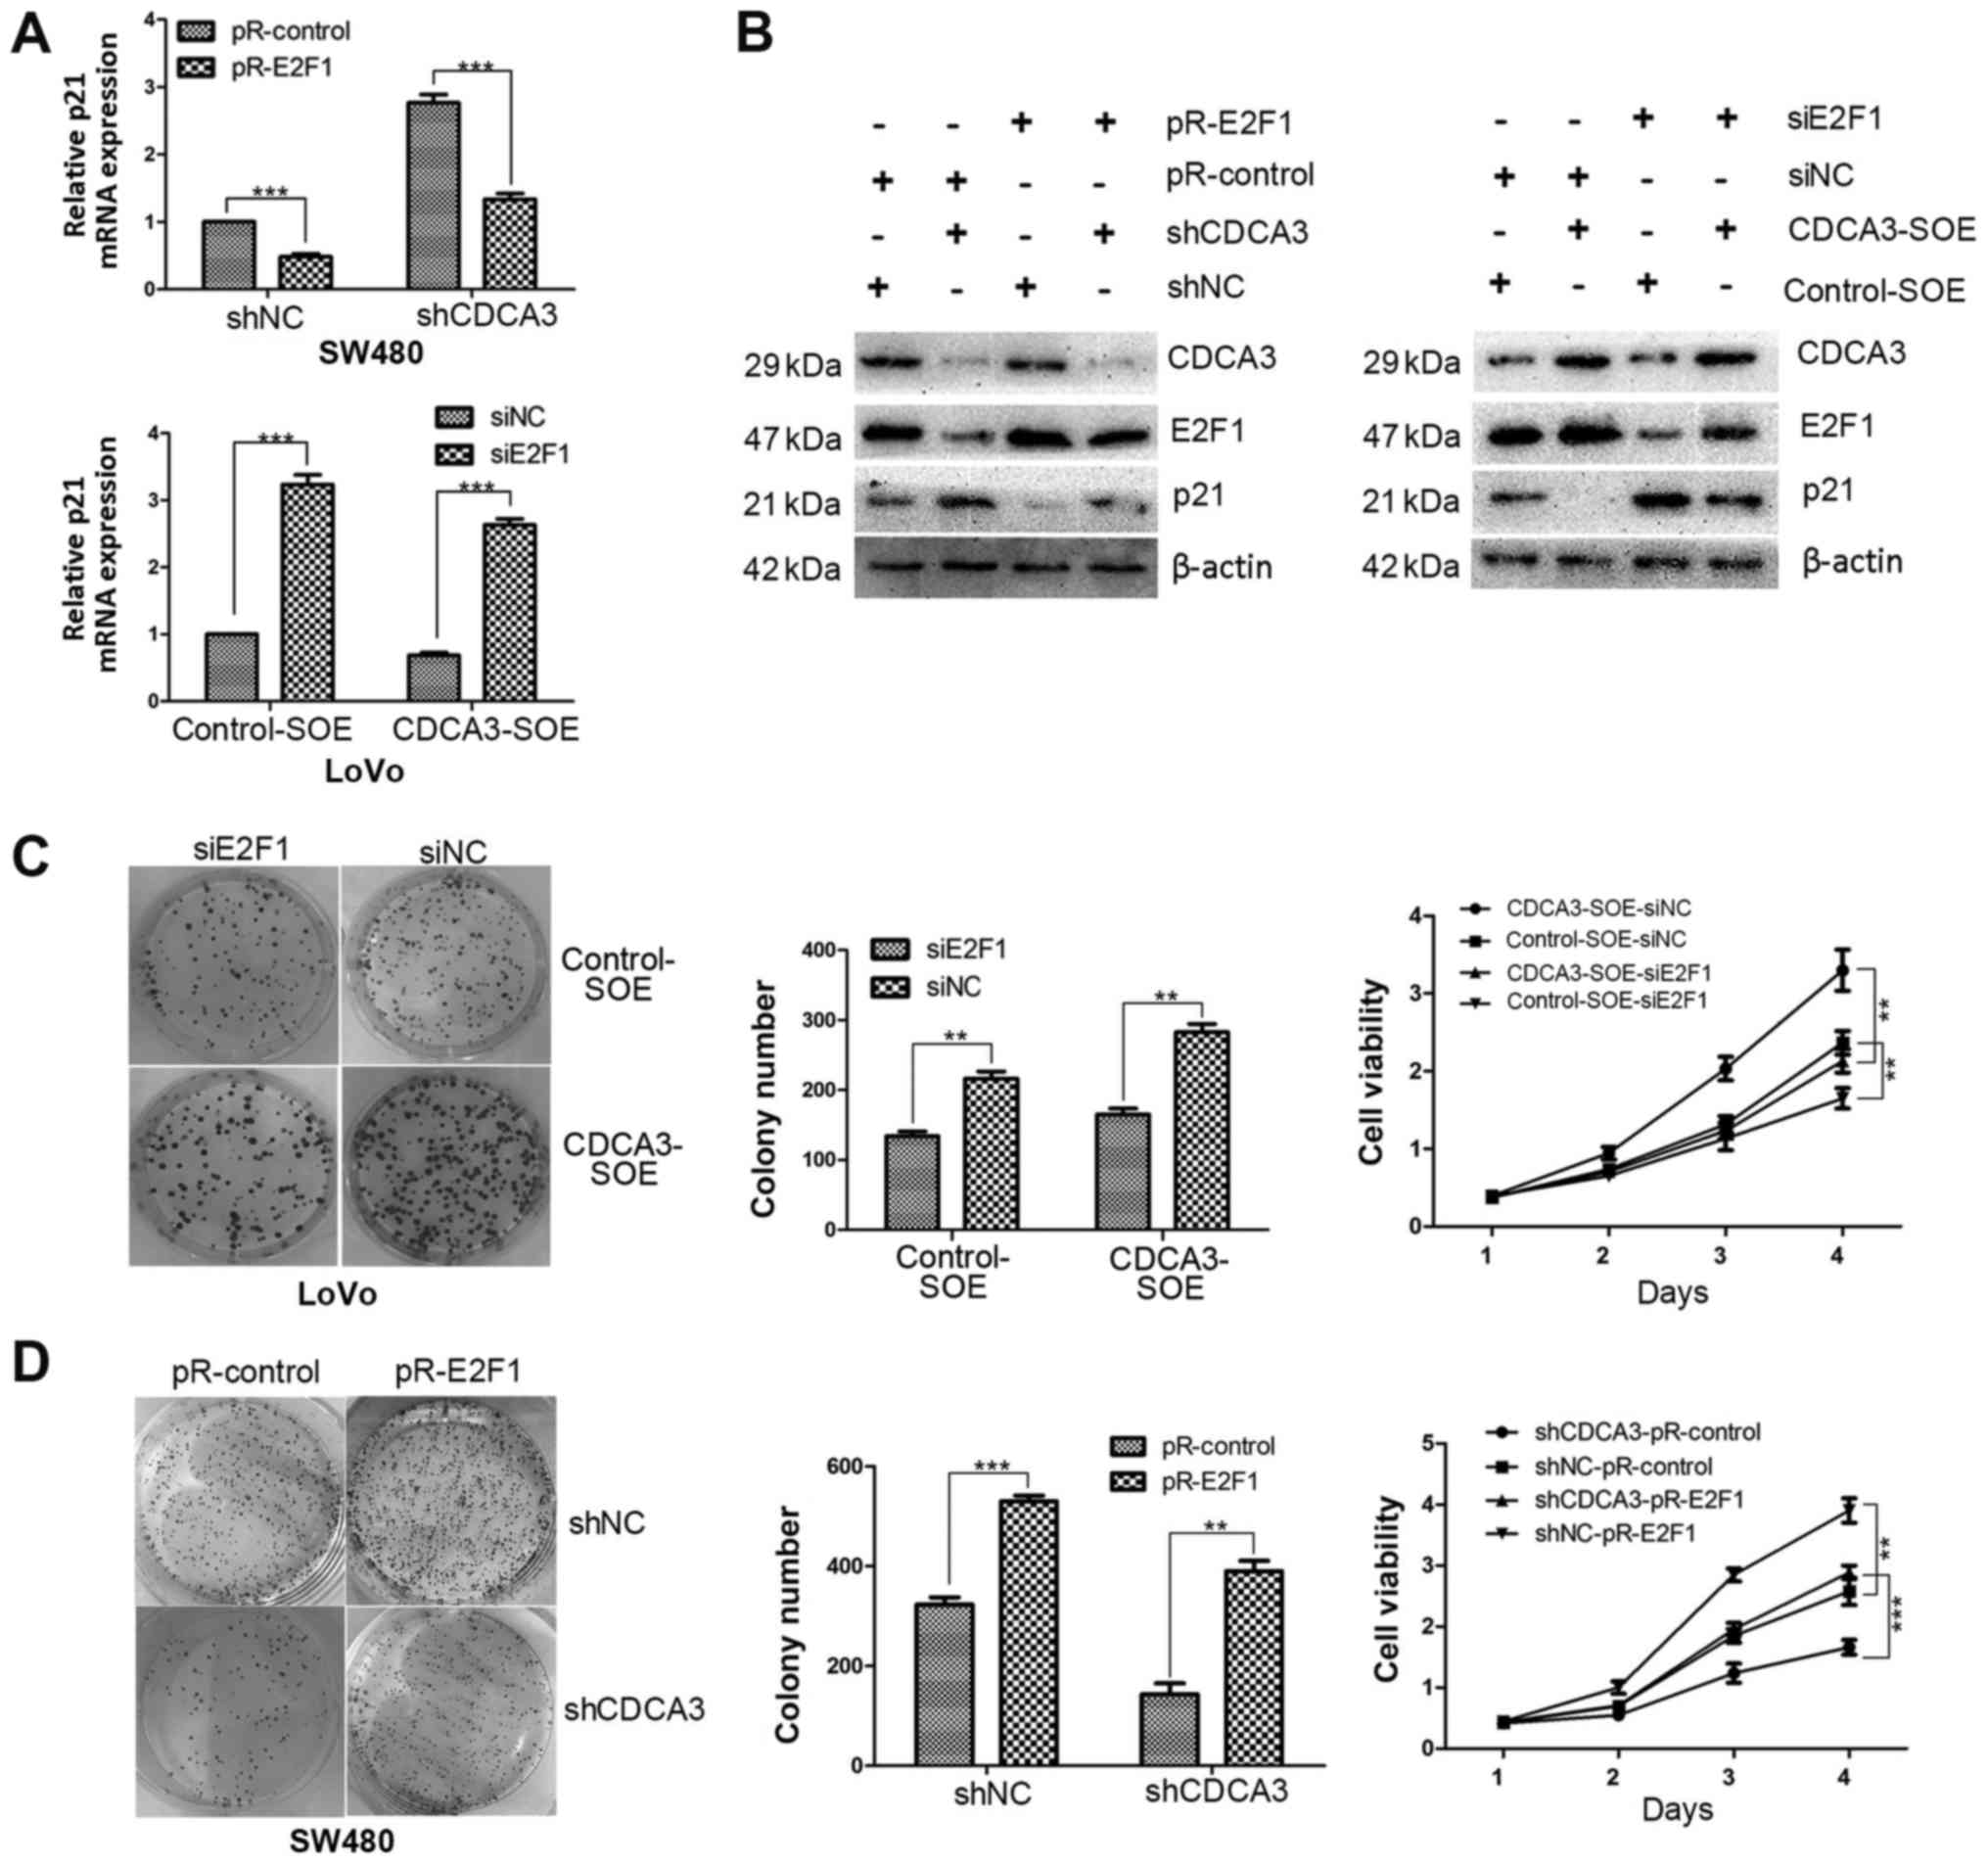
CDCA3 mediates p21-dependent
proliferation by regulating E2F1 expression
To further explore the mechanism how CDCA3 mediates
p21 expression, correlation analysis was performed using the R
software (version 3.4.0) through analyzing the data obtained from
TCGA. A total of 355 genes whose correlation coefficients were ≥0.5
were selected. Subsequently, GO analysis and a KEGG pathway
analysis were examined using DAVID to determine whether any GO
terms or KEGG pathways were enriched. As observed from the gene
enrichment of GO and KEGG analysis, the cell cycle is the largest
group in both analyses (Fig. 4A
and B, respectively). After selecting the intersection of the two
groups, which contained 32 and 119 genes, respectively, 29 genes
that may possibly interact with CDCA3 were identified (Table IV). Subsequently, the mRNA
expression levels of these 29 genes were determined in the
shCDCA3-SW480 and shNC-SW480 cells. A significant difference in the
expression levels of observed in two genes: E2F1 and protein
kinase, membrane-associated tyrosine/threonine 1 (PKMYT1; Fig. 4C; P<0.001). Following
examination of previous literature, it was noted that E2F1 serves a
crucial role in CRC and is an important molecular regulator
upstream of p21 (20,21). Therefore, it was hypothesized that
E2F1 may participate in the regulation of p21 expression by
CDCA3.
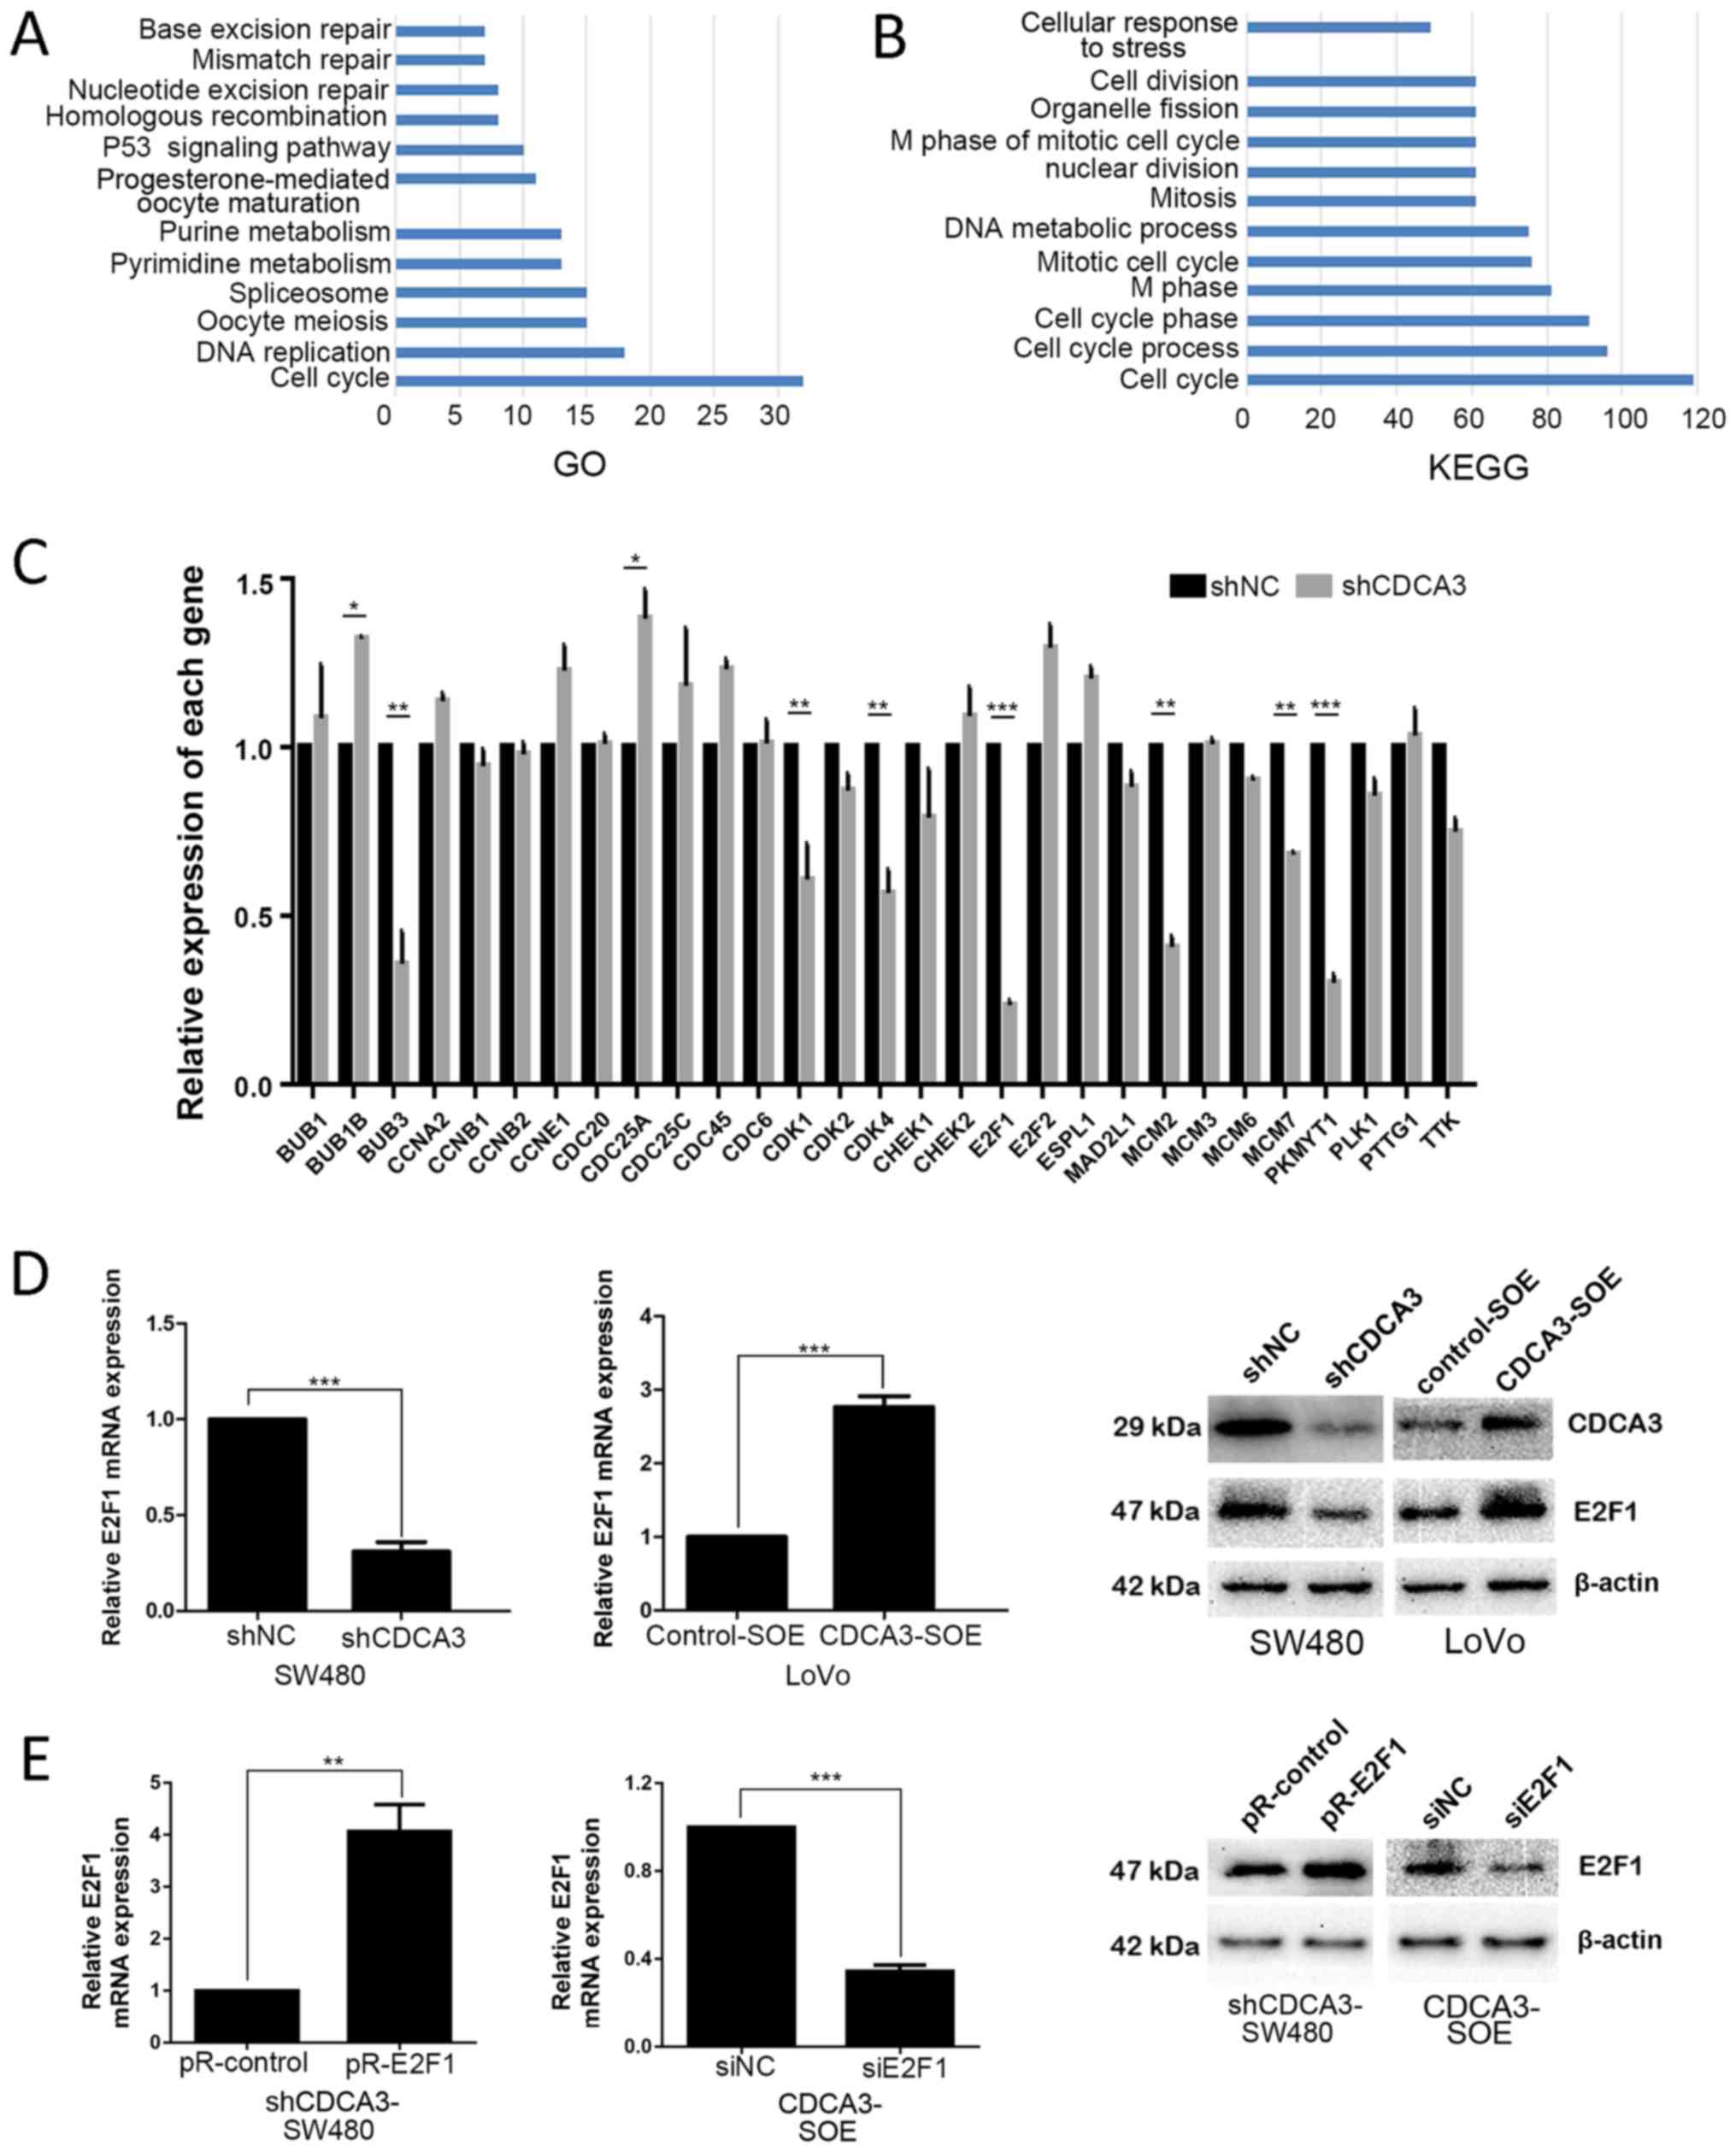 | Figure 4E2F1 may be a potential downstream
target of CDCA3. (A) Gene ontology analysis of the selected 355
genes. (B) Kyoto Encyclopedia of Genes and Genomes pathway analysis
of the selected 355 genes. (C) mRNA expression levels of 29 genes
in shCDCA3-SW480 and shNC-SW480 cells. (D) E2F1 expression was
detected by RT-qPCR and western blotting in SW480 and LoVo cells,
respectively. (E) E2F1 expression levels were measured by RT-qPCR
and western blotting following downregulation of CDCA3 in SW480 and
upregulation of CDCA3 in LoVo cells. Results are presented as the
mean ± standard deviation; *P<0.05,
**P<0.01 and ***P<0.001. BUB1, BUB1
mitotic checkpoint serine/threonine kinase; BUB1B, BUB1 mitotic
checkpoint serine/threonine kinase B; BUB3, BUB3 mitotic checkpoint
protein; CCN, cyclin; CDC20, cell division cycle; CDCA3, cell
division cycle-associated protein 3; CDK, cyclin-dependent kinase;
CHEK, checkpoint kinase; ESPL1, extra spindle pole bodies-like 1,
separase; MAD2L1, mitotic arrest deficient 2-like 1; MCM,
minichromosome maintenance complex component; NC, negative control;
PKMYT1, protein kinase, membrane-associated tyrosine/threonine 1;
PLK1, polo-like kinase 1; PTTG1, pituitary tumor-transforming 1;
RT-qPCR, reverse transcription-quantitative polymerase chain
reaction; sh, short hairpin RNA; si, small interfering RNA; TTK,
TTK protein kinase. |
| Table IVCorrelation between the expression of
CDCA3 and the other 29 genes. |
Table IV
Correlation between the expression of
CDCA3 and the other 29 genes.
| Gene symbol | P-value | R-value | Gene symbol | P-value | R-value |
|---|
| BUB1 | 4.73E-32 | 0.57 | CHEK1 | 1.23E-33 | 0.59 |
| BUB1B | 5.99E-30 | 0.56 | CHEK2 | 1.67E-33 | 0.58 |
| BUB3 | 2.20E-26 | 0.53 | E2F1 | 1.28E-40 | 0.63 |
| CCNA2 | 2.80E-51 | 0.69 | E2F2 | 4.56E-33 | 0.58 |
| CCNB1 | 1.14E-55 | 0.71 | ESPL1 | 4.82E-40 | 0.63 |
| CCNB2 | 1.13E-52 | 0.70 | MAD2L1 | 5.38E-43 | 0.65 |
| CCNE1 | 5.87E-27 | 0.53 | MCM2 | 1.73E-30 | 0.56 |
| CDC20 | 1.18E-56 | 0.72 | MCM3 | 7.56E-26 | 0.52 |
| CDC25A | 7.50E-46 | 0.66 | MCM6 | 8.27E-26 | 0.52 |
| CDC25C | 1.15E-52 | 0.70 | MCM7 | 1.42E-33 | 0.58 |
| CDC45 | 1.13E-49 | 0.68 | PKMYT1 | 3.15E-51 | 0.69 |
| CDC6 | 1.09E-32 | 0.58 | PLK1 | 4.59E-56 | 0.71 |
| CDK1 | 2.73E-62 | 0.74 | PTTG1 | 2.75E-60 | 0.73 |
| CDK2 | 1.26E-31 | 0.57 | TTK | 1.58E-35 | 0.60 |
| CDK4 | 4.78E-33 | 0.58 | | | |
To verify this hypothesis, E2F1 expression in
shCDCA3- SW480 and CDCA3-SOE-LoVo cells was examined using RT-qPCR
and western blotting. The results demonstrated that E2F1 mRNA and
protein expression levels were notably decreased shCDCA3-SW480
cells and increased in the CDCA3-SOE-LoVo cells (Fig. 4D). The efficiency of knockdown or
overexpression of E2F1 by siE2F1 or pR-E2F1 transfection,
respectively, was examined by RT-qPCR and western blotting
(Fig. 4E). The results
demonstrated that expression of E2F1 was downregulated or
upregulated by siE2F1 or pR-E2F1, respectively. Subsequently,
E2F1-overexpression (pR-E2F1) or pR-Control vectors were
transfected into the shCDCA3- or shNC-SW480 stable cell lines and
siE2F1 or siNC were transfected into CDCA3-SOE- or control-SOE-
LoVo stable cell lines. The results demonstrated that the p21
accumulation noted in shCDCA-SW480 cells was reduced when E2F1 was
overexpressed compared with control cells, at both the mRNA and
protein expression levels (Fig. 5A
and B). Conversely, the reduced p21 expression observed in CDCA3-
SOE-LoVo cells was notably increased following transient
transfection of siE2F1 in CDCA3-SOE cell lines compared with
siNC-transfected cells (Fig. 5A
and B).
Additional experiments were conducted to determine
whether E2F1 was able to reverse the inhibition of proliferation
induced by CDCA3 downregulation. The colony formation assay and
CCK-8 assay indicated that overexpression of CDCA3 promoted cell
proliferation in LoVo cells; however, this promotion of cell
proliferation was inhibited by si-E2F1 (Fig. 5C). In addition, the results
indicated that downregulation of CDCD3 suppressed cell
proliferation in SW480 cells; however, the suppression of cell
proliferation was reversed by overexpression of E2F1 (Fig. 5D). Taken together, these data
suggested that CDCA3 mediated p21 by regulating E2F1
expression.
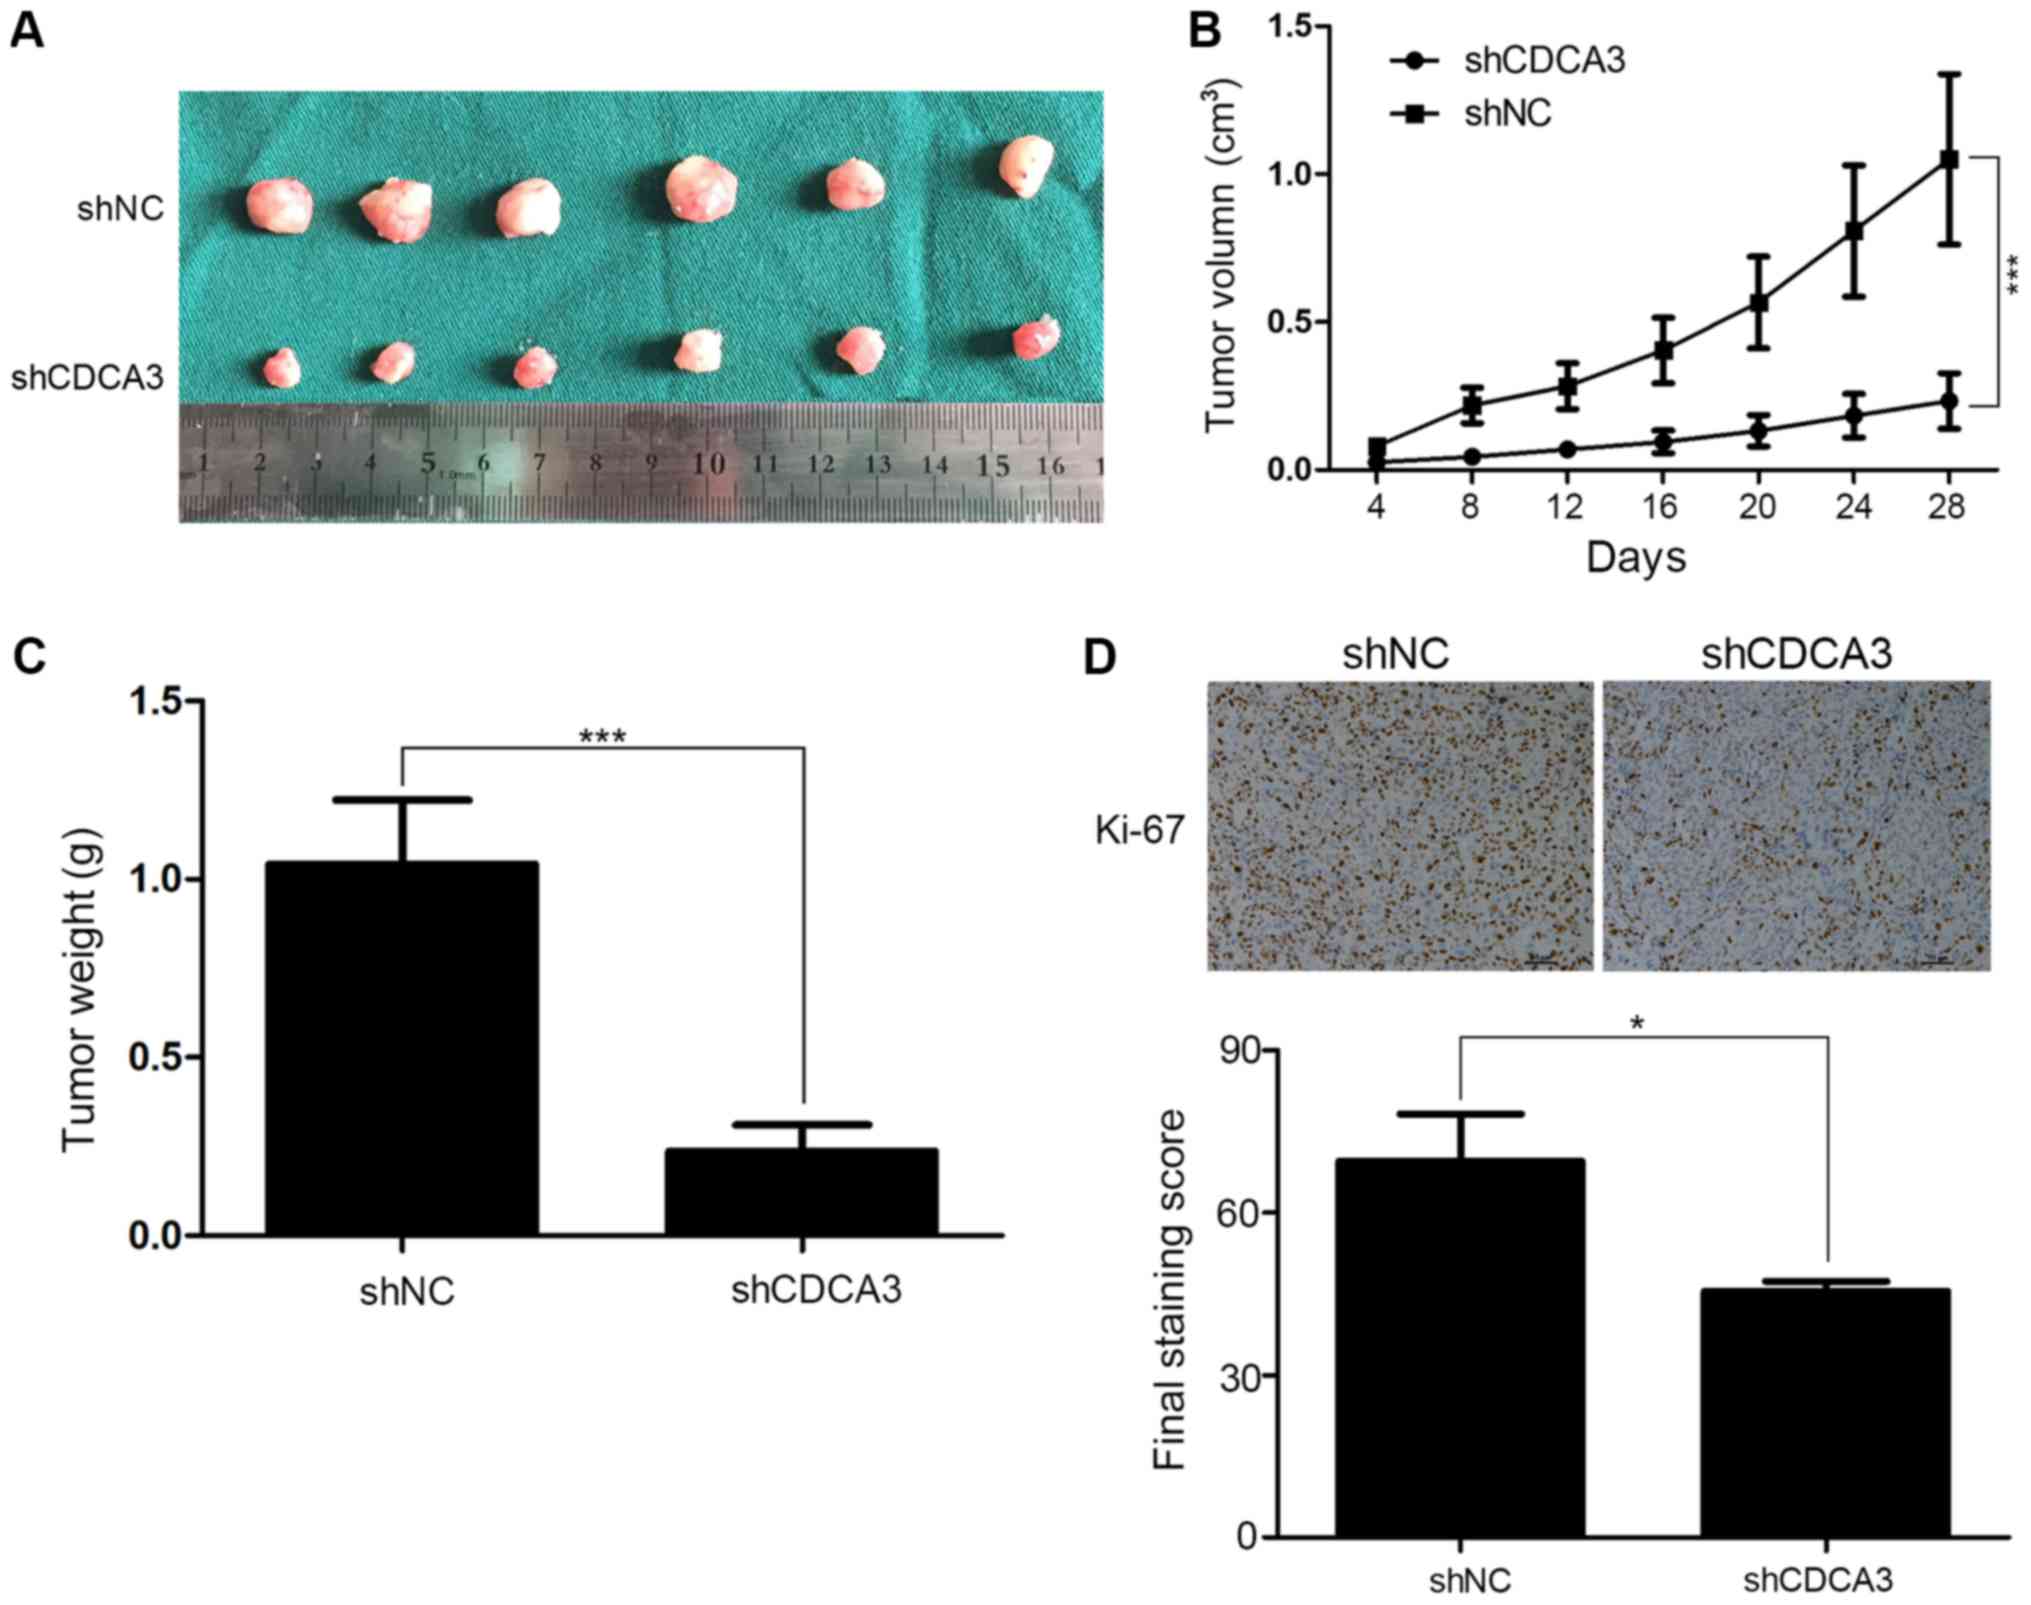
Downregulation of CDCA3 inhibits CRC
tumorigenesis in vivo
To further confirm the effects of CDCA3 in
vivo, tumorigenesis assays were performed. shCDCA3-SW480 or
shNC-SW480 cells were injected subcutaneously into male nude Balb/c
mice. Tumor size was measured every 4 days, and the tumor volume
was calculated. All the mice had subcutaneous tumors at 4 weeks
post-injection. Tumor size in the shCDCA3 group was notably smaller
compared with the shNC group (Fig.
6A). In addition, tumor growth was slower (Fig. 6B) and the mean weight of shCDCA3
tumors was significantly lower in the shCDCA3 group compared with
the shNC group (Fig. 6C). Results
from the IHC assays indicated that tumors from the shCDCA3 group
contain fewer Ki-67 positive cells compared with those from the
shNC group (Fig. 6D). These
results further confirmed that CDCA3 may contribute to tumor
proliferation in CRC.
Discussion
CDCA3 is part of the SCF E3 ligase complex that
regulates mitotic entry (7).
However, the molecular regulation of CDCA3 and its functions may
vary across malignancies of different origin. For example, in lung
cancer, CDCA3 depletion was revealed to induce cell cycle arrest in
the G2/M phase and apoptosis in non-small cell lung carcinoma cell
lines (15). A previous
bioinformatics study using a microarray data set of 163 tumor types
reported a network of closely regulated genes that included CDCA3
with strong prognostic importance (22). The authors of that study verified
the bioinformatics analysis results by RT-qPCR and demonstrated
that CDCA3 transcripts were upregulated in breast, kidney, lung and
ovarian cancers compared with expression levels in normal tissue.
Results from the present study are consistent with previous
studies, which reported that overexpression of CDCA3 in hepatoma
cells promoted cell proliferation but did not affect apoptosis
(22). Another previous study
demonstrated that CDCA3 expression was increased in oral squamous
cell carcinoma (14), and
suppression of CDCA3 expression in oral cancer cells resulted in
G1/S phase cell cycle arrest and alterations in CDK or CDK
inhibitor (CKI) expression. Consistently, the present study
determined a defective cell cycle progression with an increased
proportion of cells in the G1 phase following CDCA3 downregulation
in CRC cell lines.
p21, one of the key regulators of cell cycle
progression at the G1/S transition, serves a crucial role in
tumorigenesis (23-25). p21 is widely accepted as a tumor
suppressive protein and a negative regulator in the G1/S transition
(26). A number of studies have
reported that downregulation of p21 expression is involved in
various human cancers and is correlated with cell growth (27,28).
p21 may acts independently as well as with other cell cycle
regulators, such as CDK4/6 complex and p53 (29,30).
The present study aimed to identify molecules that may be regulated
by CDCA3 in the cell cycle, the expressions of several CDKs or CKI
were detected by western blotting, and the results indicated that
CDCA3 may upregulate p21 expression. Previous studies have
demonstrated that E2F1 is an important mediator in modulating cell
proliferation (21); E2F1 is an
important molecular regulator upstream of p21 (31-33).
In the present study, E2F1 exhibited a proliferation promoting
effect, which was similar to previously published studies.
However, there are still many topics that remain to
be explored. For example, the effects of CDCA3 on E2F1 and the
mechanisms involved need further investigation. In addition,
considering that CDCA3 expression is significantly associated with
lymph node invasion in CRC, in vitro and in vivo
experiments investigating the role of CDCA3 in promoting metastasis
and invasiveness are needed. In conclusion, the results of the
present study demonstrated that CDCA3 may target p21 to promote CRC
cell proliferation and tumorigenesis, at least partially in an
E2F1-mediated manner, and that CDCA3 may serve as a potential
prognostic and therapeutic target of CRC.
Funding
The present study was funded by Jiangsu Key Medical
Discipline- General Surgery (grant no. ZDXKA2016005).
Availability of data and materials
The data sets used and/or analyzed during the
current study are available from the corresponding author on
reasonable request.
Authors’ contributions
YS conceptualized and designed the research. WQ
performed experiments, analyzed and interpreted the results, made
figures and wrote the paper. ZZ, WP and JL performed experiments
and analyzed data. JL provided patient tissues. QG, DJ, QW and YZ
helped design the experimental studies and edited the manuscript.
BJ, SW and DZ interpreted the results and wrote the manuscript. All
authors have read and approved the manuscript.
Ethics approval and consent to
participate
The present study was approved by the Research
Ethics Committee of The First Affiliated Hospital of Nanjing
Medical University and written informed consent was obtained from
all patients prior to enrolment in the study.
Patient consent for publication
Not applicable.
Competing interests
The authors declare that they have no competing
interests.
Acknowledgments
The authors would like to thank the faculty and
staff of the Department of General Surgery (First Affiliated
Hospital of Nanjing Medical University, Jiangsu, China) for
providing language and technology support.
References
|
1
|
Siegel R, Desantis C and Jemal A:
Colorectal cancer statistics, 2014. CA Cancer J Clin. 64:104–117.
2014. View Article : Google Scholar : PubMed/NCBI
|
|
2
|
Haggar FA and Boushey RP: Colorectal
cancer epidemiology: Incidence, mortality, survival, and risk
factors. Clin Colon Rectal Surg. 22:191–197. 2009. View Article : Google Scholar :
|
|
3
|
Liu R, Huang S, Lei Y, Zhang T, Wang K,
Liu B, Nice EC, Xiang R, Xie K, Li J, et al: FGF8 promotes
colorectal cancer growth and metastasis by activating YAP1.
Oncotarget. 6:935–952. 2015.
|
|
4
|
Chairatvit K and Ngamkitidechakul C:
Control of cell proliferation via elevated NEDD8 conjugation in
oral squamous cell carcinoma. Mol Cell Biochem. 306:163–169. 2007.
View Article : Google Scholar : PubMed/NCBI
|
|
5
|
Todd R, Hinds PW, Munger K, Rustgi AK,
Opitz OG, Suliman Y and Wong DT: Cell cycle dysregulation in oral
cancer. Crit Rev Oral Biol Med. 13:51–61. 2002. View Article : Google Scholar : PubMed/NCBI
|
|
6
|
Izzo JG, Papadimitrakopoulou VA, Li XQ,
Ibarguen H, Lee JS, Ro JY, El-Naggar A, Hong WK and Hittelman WN:
Dysregulated cyclin D1 expression early in head and neck
tumorigenesis: In vivo evidence for an association with subsequent
gene amplification. Oncogene. 17:2313–2322. 1998. View Article : Google Scholar : PubMed/NCBI
|
|
7
|
Ayad NG, Rankin S, Murakami M,
Jebanathirajah J, Gygi S and Kirschner MW: Tome-1, a trigger of
mitotic entry, is degraded during G1 via the APC. Cell.
113:101–113. 2003. View Article : Google Scholar : PubMed/NCBI
|
|
8
|
Smith A, Simanski S, Fallahi M and Ayad
NG: Redundant ubiquitin ligase activities regulate wee1 degradation
and mitotic entry. Cell Cycle. 6:2795–2799. 2007. View Article : Google Scholar : PubMed/NCBI
|
|
9
|
Yoshida K: Cell-cycle-dependent regulation
of the human and mouse Tome-1 promoters. FEBS Lett. 579:1488–1492.
2005. View Article : Google Scholar : PubMed/NCBI
|
|
10
|
Kraft C: Mitotic entry: Tipping the
balance. Curr Biol. 13:R445–R446. 2003. View Article : Google Scholar : PubMed/NCBI
|
|
11
|
Lim HH and Surana U: Tome-1, wee1, and the
onset of mitosis: Coupled destruction for timely entry. Mol Cell.
11:845–846. 2003. View Article : Google Scholar : PubMed/NCBI
|
|
12
|
Jia L and Sun Y: RBX1/ROC1-SCF E3
ubiquitin ligase is required for mouse embryogenesis and cancer
cell survival. Cell Div. 4:162009. View Article : Google Scholar : PubMed/NCBI
|
|
13
|
Hu Q, Fu J, Luo B, Huang M, Guo W, Lin Y,
Xie X and Xiao S: OY-TES-1 may regulate the malignant behavior of
liver cancer via NANOG, CD9, CCND2 and CDCA3: A bioinformatic
analysis combine with RNAi and oligonucleotide microarray. Oncol
Rep. 33:1965–1975. 2015. View Article : Google Scholar : PubMed/NCBI
|
|
14
|
Uchida F, Uzawa K, Kasamatsu A, Takatori
H, Sakamoto Y, Ogawara K, Shiiba M, Tanzawa H and Bukawa H:
Overexpression of cell cycle regulator CDCA3 promotes oral cancer
progression by enhancing cell proliferation with prevention of G1
phase arrest. BMC Cancer. 12:3212012. View Article : Google Scholar : PubMed/NCBI
|
|
15
|
Adams MN, Burgess JT, He Y, Gately K,
Snell C, Zhang SD, Hooper JD, Richard DJ and O’Byrne KJ: Expression
of CDCA3 is a prognostic biomarker and potential therapeutic target
in non-small cell lung cancer. J Thorac Oncol. 12:1071–1084. 2017.
View Article : Google Scholar : PubMed/NCBI
|
|
16
|
Chen J, Zhu S, Jiang N, Shang Z, Quan C
and Niu Y: HoxB3 promotes prostate cancer cell progression by
transactivating CDCA3. Cancer Lett. 330:217–224. 2013. View Article : Google Scholar
|
|
17
|
Benson AB III, Venook AP, Bekaii-Saab T,
Chan E, Chen YJ, Cooper HS, Engstrom PF, Enzinger PC, Fenton MJ,
Fuchs CS, et al: National Comprehensive Cancer Network: Colon
cancer, version 3.2014. J Natl Compr Canc Netw. 12:1028–1059. 2014.
View Article : Google Scholar : PubMed/NCBI
|
|
18
|
Livak KJ and Schmittgen TD: Analysis of
relative gene expression data using real-time quantitative PCR and
the 2(-ΔΔC(T)) method. Methods. 25:402–408. 2001. View Article : Google Scholar
|
|
19
|
Sun J, Shi R, Zhao S, Li X, Lu S, Bu H, Ma
X and Su C: E2F8, a direct target of miR-144, promotes papillary
thyroid cancer progression via regulating cell cycle. J Exp Clin
Cancer Res. 36:402017. View Article : Google Scholar : PubMed/NCBI
|
|
20
|
Chen J, Gong C, Mao H, Li Z, Fang Z, Chen
Q, Lin M, Jiang X, Hu Y, Wang W, et al: E2F1/SP3/STAT6 axis is
required for IL-4-induced epithelial-mesenchymal transition of
colorectal cancer cells. Int J Oncol. 53:567–578. 2018.PubMed/NCBI
|
|
21
|
Itzel T, Scholz P, Maass T, Krupp M,
Marquardt JU, Strand S, Becker D, Staib F, Binder H, Roessler S, et
al: Translating bioinformatics in oncology: Guilt-by-profiling
analysis and identification of KIF18B and CDCA3 as novel driver
genes in carcinogenesis. Bioinformatics. 31:216–224. 2015.
View Article : Google Scholar :
|
|
22
|
Egilmez R, Elagoz S and Kanik EA:
Cdk1/P34Cdc2 and P21waf expression in colorectal adenomas and
carcinomas. J Exp Clin Cancer Res. 20:549–552. 2001.
|
|
23
|
Pines J and Rieder CL: Re-staging mitosis:
A contemporary view of mitotic progression. Nat Cell Biol. 3:E3–E6.
2001. View Article : Google Scholar : PubMed/NCBI
|
|
24
|
Calvisi DF, Donninger H, Vos MD, Birrer
MJ, Gordon L, Leaner V and Clark GJ: NORE1A tumor suppressor
candidate modulates p21CIP1 via p53. Cancer Res. 69:4629–4637.
2009. View Article : Google Scholar : PubMed/NCBI
|
|
25
|
Thaler S, Hähnel PS, Schad A, Dammann R
and Schuler M: RASSF1A mediates p21Cip1/Waf1-dependent cell cycle
arrest and senescence through modulation of the Raf-MEK-ERK pathway
and inhibition of Akt. Cancer Res. 69:1748–1757. 2009. View Article : Google Scholar : PubMed/NCBI
|
|
26
|
Niculescu AB III, Chen X, Smeets M, Hengst
L, Prives C and Reed SI: Effects of p21(Cip1/Waf1) at both the G1/S
and the G2/M cell cycle transitions: pRb is a critical determinant
in blocking DNA replication and in preventing endoreduplication.
Mol Cell Biol. 18:629–643. 1998. View Article : Google Scholar : PubMed/NCBI
|
|
27
|
Stein JP, Ginsberg DA, Grossfeld GD,
Chatterjee SJ, Esrig D, Dickinson MG, Groshen S, Taylor CR, Jones
PA, Skinner DG, et al: Effect of p21WAF1/CIP1 expression on tumor
progression in bladder cancer. J Natl Cancer Inst. 90:1072–1079.
1998. View Article : Google Scholar : PubMed/NCBI
|
|
28
|
Cai K and Dynlacht BD: Activity and nature
of p21(WAF1) complexes during the cell cycle. Proc Natl Acad Sci
USA. 95:12254–12259. 1998. View Article : Google Scholar : PubMed/NCBI
|
|
29
|
Parker SB, Eichele G, Zhang P, Rawls A,
Sands AT, Bradley A, Olson EN, Harper JW and Elledge SJ:
p53-independent expression of p21Cip1 in muscle and other
terminally differentiating cells. Science. 267:1024–1027. 1995.
View Article : Google Scholar : PubMed/NCBI
|
|
30
|
Peng YP, Zhu Y, Yin LD, Zhang JJ, Wei JS,
Liu X, Liu XC, Gao WT, Jiang KR and Miao Y: PEG10 overexpression
induced by E2F1promotes cell proliferation, migration, and invasion
in pancreatic cancer. J Exp Clin Cancer Res. 36:302017. View Article : Google Scholar
|
|
31
|
Teplyuk NM, Uhlmann EJ, Wong AH, Karmali
P, Basu M, Gabriely G, Jain A, Wang Y, Chiocca EA, Stephens R, et
al: MicroRNA-10b inhibition reduces E2F1-mediated transcription and
miR-15/16 activity in glioblastoma. Oncotarget. 6:3770–3783. 2015.
View Article : Google Scholar : PubMed/NCBI
|
|
32
|
Zhang E, Yin D, Han L, He X, Si X, Chen W,
Xia R, Xu T, Gu D, De W, et al: E2F1-induced upregulation of long
noncoding RNA LINC00668 predicts a poor prognosis of gastric cancer
and promotes cell proliferation through epigenetically silencing of
CKIs. Oncotarget. 7:23212–23226. 2016.PubMed/NCBI
|
|
33
|
Feldstein O, Ben-Hamo R, Bashari D, Efroni
S and Ginsberg D: RBM38 is a direct transcriptional target of E2F1
that limits E2F1-induced proliferation. Mol Cancer Res.
10:1169–1177. 2012. View Article : Google Scholar : PubMed/NCBI
|