Introduction
Major depressive disorder (MDD) is one of the most
prevalent mental disorders in developed countries such as Japan,
and its frequency is rapidly increasing (1,2).
However, the etiological and psychobiological mechanisms for the
development of MDD remain unclear, even though pharmacological
agents for MDD have been extensively investigated, with a
particular focus on serotonergic, adrenergic and/or dopaminergic
dysfunction (3). Clinical and
basic research of depressive status has indicated that there are
close associations and strong interactions among the prefrontal
cortex (PFC), thalamus and hippocampus (4–7). For
example, stressful conditions increase activity in the PFC and
limbic or prelimbic regions, resulting in hyperactivity of the
hypothalamic-pituitary-adrenal axis and hippocampus (4,5).
Despite such associations between these parts of the brain in
healthy people and in depressive subjects, the mechanism underlying
their interactions remains unknown.
Previous studies have indicated significant
associations between MDD and biomarkers that can be detected in
serum, including cytokines, brain-derived neurotrophic factor
(BDNF) and hormones in patients treated with corticosteroids or
interferon therapy (8–12). For example, levels of serum BDNF
decreased and levels of inflammatory cytokines increased in
patients with MDD (13–15). However, these factors were also
affected by diurnal variation or by physical conditions (16,17).
Therefore, there is still insufficient evidence to support their
validity and applicability as diagnostic markers or as biological
indicators for assessing the severity of MDD. Thus, even though MDD
is a disorder associated with psychological, sociocultural or
neurobiological factors and also with more pervasive physiological
dysfunctions, the underlying mechanisms for interactions between
these factors have yet to be elucidated.
The group have previously performed molecular
analyses to assess the associations between MDD and dysregulation
of physiological homeostasis. Hepatocyte nuclear factor 4α
(Hnf4α) was identified as a candidate central regulator that
has crucial influence on immunological function, lipid metabolism,
coagulation, hormonal activity and the synthesis of amines
(18). As Hnf4α is a
transcription factor, it is difficult to measure in serum, and the
target molecules regulated by Hnf4α that are detectable in
serum have not been examined. Therefore, the influence of
Hnf4α on the development of clinical MDD or depressive
status in humans has not been determined.
The aim of the present study was to investigate: i)
the molecular mechanism of the depressive state in the PFC; and ii)
the involvement of genes extracted from comparative gene expression
analysis that may mediate the associations between MDD and
physiological diseases using a chronic mild stress (CMS) animal
model of MDD. In addition, the present study determined whether
specific molecules regulated by Hnf4α may exist in the PFC
and serum, and examined the possibility that these molecules may be
reliable indicators of clinical MDD.
Materials and methods
Details regarding the experimental animals, the CMS
procedure, sample collection, RNA purification, microarray
analysis, reverse transcription-quantitative polymerase chain
reaction (RT-qPCR), western blotting and Ingenuity Pathway Analysis
(IPA) have been described in our previous studies (18,19).
Animals
A total of 50 experimentally naïve male C57BL/6N
mice (Japan SLC, Inc., Shizuoka, Japan) were used. Mice were 9–10
weeks old and weighed 22.3 g on average at the start of the
experiment. Mice were housed in groups of 3, 4 or 5 in
polycarbonate cages that were placed in a colony room maintained at
a constant temperature (22±1°C) and humidity (50–60%), under a 12-h
light/dark cycle (lights on at 7:00 am) with free access to food
and water.
Animals were randomly assigned to one of two groups:
The control group (C group) mice and the chronic mildly stressed
(CMS) group mice, as previously described (18). The procedure to induce CMS is
described in Table I and was
performed over 4 weeks. A total of 16 mice from each group were
euthanized by decapitation using a guillotine, and brain samples
were collected for molecular analyses.
 | Table I.Weekly schedule for the induction of
chronic mild stress. |
Table I.
Weekly schedule for the induction of
chronic mild stress.
| Day | Light phase | Dark phase |
|---|
| 1 | Water deprivation
(8 h)/isolation | Changed
room/isolation |
| 2 | Isolation (12
h) | Overnight
illumination (36 h) |
| 3 | A wet cage (4
h)/isolation (12 h) | Changed
room/isolation |
| 4 | Cage tilt (8
h)/isolation (12 h) | Changed
room/isolation |
| 5 | Physical restraint
(4 h)/isolation (12 h) | Changed
room/isolation |
| 6 | Forced swimming (30
mins)/isolation (12 h) | Changed
room/isolation |
| 7 | Electric shocks (60
times)/isolation (12 h) | Changed
room/isolation |
Animal experiments were conducted according to the
Guide for Care and Use of Laboratory Animals published by the
National Institutes of Health, and was approved by the Ethical
committee of Behavioral and Medical Science Research Consortium
(Hyōgo, Japan; approval IDs: 2012-B-09 and 2012-B-10). All efforts
were made to minimize the number of mice used and the suffering of
animals.
RNA purification
Total RNA was purified from the mouse brain using a
Sepasol-RNA I Super kit (Nacalai Tesque, Inc., Kyoto, Japan),
according to the manufacturer's instructions, and was treated with
5 units of RNase-free DNase I at 37°C for 30 min to remove genomic
DNA contamination. Following phenol/chloroform (Wako Pure Chemical
Industries, Ltd., Osaka, Japan) extraction and 100% ethanol (Wako
Pure Chemical Industries, Ltd.) precipitation, as previously
described (18,19), total RNA was dissolved in deionized
distilled water. RNA concentrations were determined using a
NanoDrop-1000 spectrophotometer (NanoDrop Technologies; Thermo
Fisher Scientific, Inc., Pittsburgh, PA, USA).
Microarray analysis
The microarray analysis of the whole genome was
outsourced to Takara Bio, Inc. (Mie, Japan). The protocol details
are described below (series entry, GSE49867).
RNA quality check
RNA was re-quantified using a NanoDrop-2000
spectrophotometer (NanoDrop Technologies; Thermo Fisher Scientific,
Inc.), according to the manufacturer's protocol, and the quality
was monitored with an Agilent 2100 Bioanalyzer (Agilent
Technologies, Inc., Santa Clara, CA, USA).
Labeling protocol (1 color)
Cyanine-3 (Cy3)-labeled cRNA was prepared from 0.1
µg total RNA using the Low Input Quick Amp Labeling kit (Agilent
Technologies, Inc.), followed by RNeasy column purification
(Qiagen, Inc., Valencia, CA, USA), according to the manufacturer's
protocol. Dye incorporation and the cRNA yield were checked with a
NanoDrop ND-2000 spectrophotometer (NanoDrop Technologies; Thermo
Fisher Scientific, Inc.).
Hybridization protocol
A total of 0.6 µg Cy3-labeled cRNA was fragmented at
60°C for 30 min in a reaction volume of 25 µl containing 1X Agilent
fragmentation buffer and 2X Agilent blocking agent, following the
manufacturer's instructions (Agilent Technologies, Inc.). Upon
completion of the fragmentation reaction, 25 µl 2X Agilent
hybridization buffer was added to the fragmentation mixture and
hybridized to an Agilent SurePrint G3 Mouse GE 8×60 K array (cat.
no. G4858A-028005) for 17 h at 65°C in a rotating Agilent
hybridization oven (Agilent Technologies, Inc.).
Following hybridization, microarrays were washed for
1 min at room temperature with GE Wash buffer 1 (Agilent
Technologies, Inc.) and for 1 min at 37°C with GE Wash buffer 2
(Agilent Technologies, Inc.).
Scanning protocol
Following washing, slides were immediately scanned
on the Agilent DNA Microarray Scanner (cat. no. G2565CA; Agilent
Technologies, Inc.) using a one-color scan setting for 8×60 K array
slides (scan area, 61×21.6 mm; scan resolution, 3-µm; the dye
channel set was to green, and the green photomultipier was set to
100%).
Data processing
The scanned images were analyzed with Feature
Extraction Software v10.10.1.1 (Agilent Technologies, Inc.) using
default parameters to obtain background subtracted and spatially
detrended processed signal intensities.
Value definition
Scaled signal intensities were adjusted to an
average intensity value of 2,500 (in arbitrary units).
IPA
Microarray data were analyzed using IPA software
version spring 2016 (Ingenuity® Systems; http://www.ingenuity.com), to provide functionality
for the interpretation of gene expression data. The network
explorer of IPA was used to identify relevant interactions,
functions and diseases among the CMS and C group genes, and to
determine the shortest direct paths between genes. Firstly, to
investigate the molecular mechanism of MDD and the influence of
Hnf4α, core analysis settings of microarray results were
performed as follows: Network, Interaction; Data Sources, all;
Confidence, Experimentally Observed; Species, human and mice;
Tissues, Cerebral cortex; Mutation, all. Subsequently, for
investigating novel molecules that are able to be detected in
serum, core analysis settings were set to default. Analysis was
performed as described in our previous studies (18,19).
RT-qPCR
To validate the results obtained by the microarray
analysis and IPA, RT-qPCR was performed. Total RNA (10 ng/reaction)
extracted from the CMS and C groups was used with the RNA-direct
SYBR® Green Real-Time PCR Master mix: One-step qPCR kit
(Toyobo Co., Ltd., Osaka, Japan), according to manufacturer's
protocol. Samples were run in duplicate reactions in 96-well
plates. Median threshold cycle values were used to calculate fold
changes (FCs) between the samples of the two groups. FC values were
normalized to GAPDH expression, using the relative standard curve
method. qPCR was performed using an Applied Biosystems 7500
Real-Time PCR System (Thermo Fisher Scientific, Inc.), under the
following thermocycling conditions: 30 sec at 90°C and 20 min at
61°C for reverse transcription according to the manufacturer's
protocol, followed by 45 cycles of 98°C for 1 sec, 67°C for 15 sec
and 74°C for 35 sec. The primer sequences for RT-qPCR are presented
in Table II, and the production
of these primers was outsourced to Sigma-Aldrich; Merck KGaA
(Darmstadt, Germany).
| Table II.Primer sequences used for reverse
transcription-quantitative polymerase chain reaction. |
Table II.
Primer sequences used for reverse
transcription-quantitative polymerase chain reaction.
| Gene | GenBank accession
no. | Type | Primer sequence
(5′→3′) |
|---|
| Ahsg | NM_011994 | Sense |
CATAAAGCCAGCAGCAACACT |
|
|
| Anti-sense |
AGAGCACCTTTCAGAGTCGT |
| F2 | NM_010168 | Sense |
CTTACCAGCCAAGACCCT |
|
|
| Anti-sense |
AGTTTTCCACGAGTTTCACC |
| Gapdh | NM_008084 | Sense |
CCTTCCGTGTTCCTACCCCCAAT |
|
|
| Anti-sense |
TTGATGTCATCATACTTGGCAGGTTTCTC |
| Igf1 | NM_010512 | Sense |
ATTTCCAGACTTTGTACTTCAGAAGCGATG |
|
|
| Anti-sense |
TCACAGAGGCAGATCTTAAATAATTGAGT |
| Plg | NM_008877 | Sense |
TCGCTGGATGGCTACATAAGCACA |
|
|
| Anti-sense |
GCCAAACAGTCCGAGACACC |
| S100a9 | NM_007631 | Sense |
GCAGCATAACCACCATCATCGAC |
|
|
| Anti-sense |
CTGTGCTTCCACCATTTGTCTGA |
| Ttr | NM_013697 | Sense |
CCTGCTCAGCCCATACTCCT |
|
|
| Anti-sense |
CTTTGGCAAGATCCTGGTCCTC |
Western blotting
For western blotting, mouse brains were minced in
Lysis buffer [1% Nonidet P-40, 20 mM Tris-HCl (pH 8.0), 150 mM
NaCl, 10% glycerol] containing a protease inhibitor cocktail
(Complete™; Roche Diagnostics, Tokyo, Japan). They were then
homogenized on ice using a sonicator (Sonifier II; Branson; Emerson
Ultrasonics, CT, USA), and each lysate was centrifuged at 4°C in
13,000 × g for 3 min and the supernatant was collected. The protein
concentration in each specimen was determined with a Bradford
protein assay kit (Bio-Rad Laboratories, Inc., Hercules, CA, USA),
according to the manufacturer's protocol. Samples were denatured in
Laemmli's sample buffer (cat. no. #09499-14; Nacalai Tesque, Inc.)
for 5 min at 95°C, electrophoresed in a 12.5% sodium dodecyl
sulfate polyacrylamide gel, and transferred onto a polyvinylidene
difluoride membrane (Hybond-P; Amersham; GE Healthcare Life
Sciences, Chalfont, UK). Membranes were blocked for 1 h at room
temperature with 1% bovine serum albumin in phosphate-buffered
saline (PBS) containing 0.1% Triton X-100 (T-PBS), then incubated
with primary antibodies at 4°C overnight. The membranes were probed
with polyclonal rabbit anti-insulin-like growth factor 1 (IGF1;
dilution 1:100; cat. no. #NBP1-45641; Novus Biologicals, LLC,
Littleton, CO, USA), polyclonal rabbit anti-transthyretin (TTR;
dilution 1:200; cat. no. sc-13098; Santa Cruz Biotechnology, Inc.,
Dallas, TX, USA), polyclonal rabbit anti-S100 calcium-binding
protein A9 (S100A9; dilution 1:1,000; cat. no. #NB110-89726; Novus
Biologicals, LLC), polyclonal rabbit anti-α2-HS-glycoprotein (AHSG;
dilution 1:250; cat. no. #bs-2922R; BIOSS, Beijing, China),
monoclonal rabbit anti-β-actin (ACTB; dilution 1:1,000; cat. no.
#5125S; Cell Signaling Technology, Inc., Danvers, MA, USA) and
monoclonal rabbit anti-GAPDH (dilution 1:1,000; cat. no. #3683S;
Cell Signaling Technology, Inc.) antibodies. Membranes were then
incubated for 3 h at room temperature with horseradish
peroxidase-conjugated donkey anti-rabbit immunoglobulin G secondary
antibody (dilution 1:2,000; cat. no. #NA9340V; GE Healthcare Life
Sciences). Washing with T-PBS was performed following each
treatment. Antibody reactions were captured using the photo-image
analyzer, LAS-4010 (Fujifilm Corporation, Tokyo, Japan). The
density of specific protein bands was measured twice using ImageJ
software version 1.6 (National Institutes of Health, Bethesda, MD,
USA). AHSG and S100A9 expression was normalized to GAPDH, whereas
IGF1 and TTR expression was normalized to ACTB. The mean of the
measured bands in controls was set to one. The present study also
assessed HL-60 whole cell lysate (cat. no. #NB800-PC3, Novus
Biologicals, LLC) and mature liver lysate, isolated from the same
mice, as positive controls of S100A9 and AHSG, respectively.
Statistical analysis
All results are expressed as the mean ± standard
deviation. Sigmaplot™ (version 11.0; Systat Software, Inc., San
Jose, CA, USA) was used for all statistical analyses. Differences
between the two groups were analyzed by Student's t-test or the
Mann-Whitney U-test. P<0.05 was considered to indicate a
statistically significant difference. All analyses were performed
>2 times to confirm the results.
Results
Isolation and classification of
cortex-specific genes in CMS mice
The microarray results have been published
previously (18). A total of 494
genes whose expression was >2X or <1/2 that of the C group
were extracted from the CMS group. The IPA results from the
microarray data using the first settings are shown in Table III. In this analysis, 5 genes
were identified, coagulation factor II (F2), Igf1,
plasminogen (Plg), Ttr and serine (or cysteine)
peptidase inhibitor, clade A, member 3 (Serpina3). In
addition, Igf1, Plg, Serpina3 and Ttr
were affected by Hnf4α (Fig.
1A).
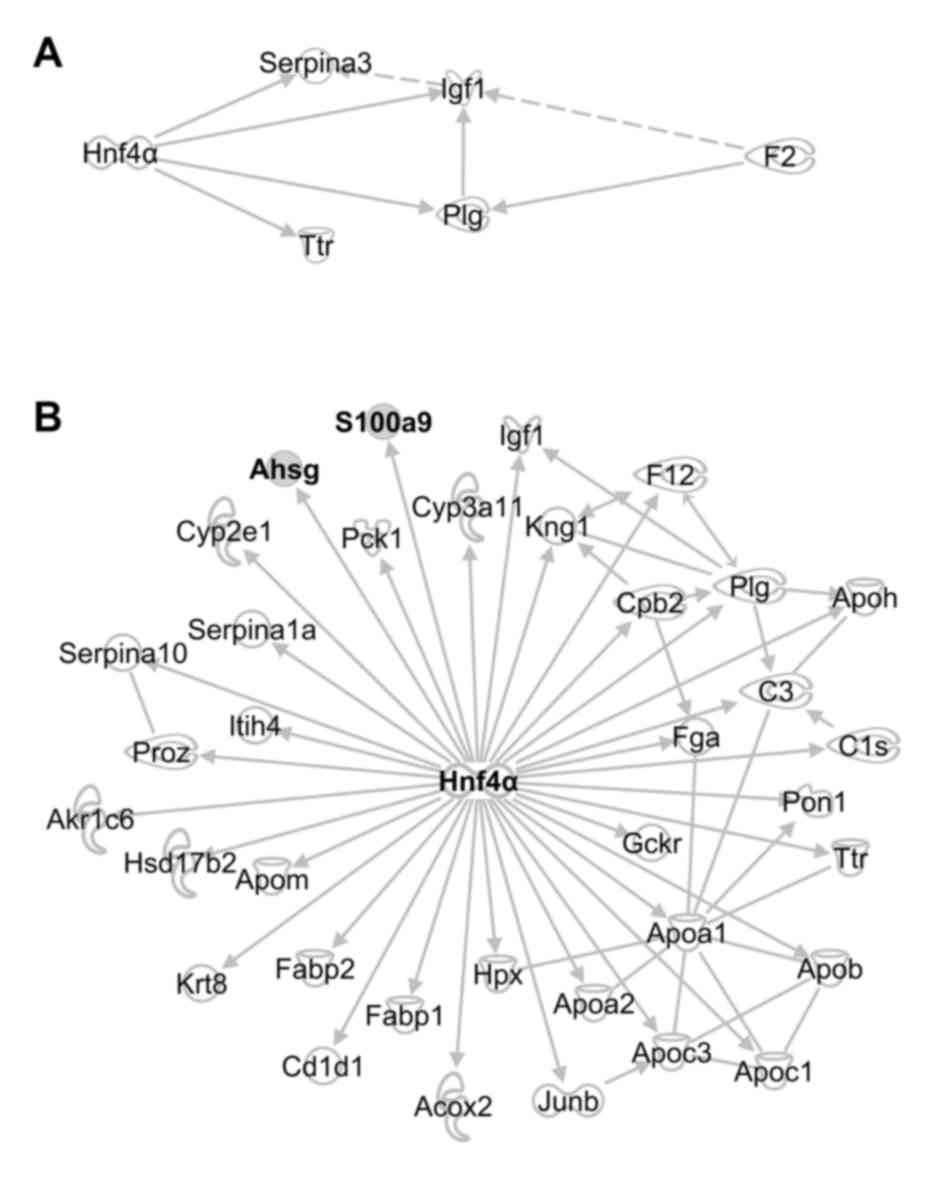 | Figure 1.Upregulation of Hnf4α in the
depressive state affects a number of genes associated with
physiological homeostasis. (A) Interactions between Hnf4α
and 5 genes in the PFC (F2, Igf1, Plg,
Ttr and Serpina3) extracted from IPA results. (B)
Hnf4α regulates a number of genes that were also up- or
downregulated in the depressive state. Among these genes, the
present study focused on S100a9 and Ahsg (in bold),
as they can be measured in patients' serum. Hnf4α,
hepatocyte nuclear factor 4α; PFC, prefrontal cortex; F2,
coagulation factor II; Igf1, insulin-like growth factor 1;
Plg, plasminogen; Ttr, transthyretin;
Serpina3, serine (or cysteine) peptidase inhibitor, clade A,
member 3; IPA, Ingenuity Pathway Analysis; S100a9, S100
calcium-binding protein A9; Ahsg, α2-HS-glycoprotein. |
| Table III.Disease or function annotation of the
prefrontal cortex. |
Table III.
Disease or function annotation of the
prefrontal cortex.
| Disease or function
annotation | P-value | Molecules | Numbers |
|---|
| Height of barrel
cortex | 7.93E-03 | Igf1 | 1 |
| Uptake of
D-glucose | 7.93E-03 | Igf1 | 1 |
| Volume of barrel
cortex | 7.93E-03 | Igf1 | 1 |
| Cell death | 1.22E-02 | F2, Igf1, Plg,
Serpina3, Ttr | 5 |
| Area of barrel
cortex | 1.58E-02 | Igf1 | 1 |
| First-onset
paranoid schizophrenia | 1.58E-02 | Ttr | 1 |
| Proliferation of
endothelial cells | 2.36E-02 | Igf1 | 1 |
| Density of blood
vessel | 3.90E-02 | Igf1 | 1 |
| Synaptic
transmission of cortical neurons | 3.90E-02 | Igf1 | 1 |
| Cell death of
cerebral cortex cells | 4.35E-02 | F2;
hippocampal neurons, Igf1 and Serpina3; cortical
neurons | 3 |
Investigation of novel genes with a
connection between depression and physiological homeostasis
To investigate novel molecules that are associated
with physiological homeostasis, are able to be detected in serum
and are regulated directly by Hnf4α, a number of molecules
from all of the extracted genes were chosen automatically (Fig. 1B). In the present study, the main
focus was the analysis of S100a9 and Ahsg as they
were directly affected by only Hnf4a (thus excluding
multiple regulation) and may be detected in serum with simple
probes in microarray analysis.
IPA analysis of 494 genes indicated that
S100a9 and Ahsg may affect the development of a
number of physical diseases. S100a9 affects arteriosclerosis
associated with vascular diseases or ischemia of the brain and
rheumatic diseases (Table IV).
Ahsg is associated with lipid concentration, rheumatic
diseases and glucose tolerance (Table
V).
| Table IV.Disease or function annotation of
S100 calcium-binding protein A9. |
Table IV.
Disease or function annotation of
S100 calcium-binding protein A9.
| Disease or function
annotation | P-value |
|---|
| Accumulation of
macrophages | 3.44E-04 |
| Accumulation of
phagocytes | 1.07E-04 |
| Activation of
antigen presenting cells | 2.29E-04 |
| Activation of
leukocytes | 2.62E-05 |
| Activation of
macrophages | 5.68E-04 |
| Activation of
phagocytes | 7.81E-05 |
| Adhesion of
neutrophils | 3.44E-04 |
| Adhesion of
phagocytes | 6.25E-04 |
| Binding of
neutrophils | 1.63E-05 |
| Binding of
phagocytes | 2.41E-05 |
| Immune response of
cells | 1.04E-04 |
| Inflammation of
organ | 8.64E-08 |
| Inflammatory
response | 5.10E-08 |
| Ischemia of
brain | 9.69E-05 |
| Phagocytosis of
blood cells | 7.18E-04 |
| Phagocytosis of
cells | 3.68E-04 |
| Rheumatic
disease | 5.06E-06 |
| Rheumatoid
arthritis | 7.08E-04 |
| Systemic autoimmune
syndrome | 9.69E-05 |
| Table V.Disease or function annotation of
α2-HS-glycoprotein. |
Table V.
Disease or function annotation of
α2-HS-glycoprotein.
| Disease or function
annotation | P-value |
|---|
|
Arteriosclerosis | 4.35E-12 |
| Arthritis | 3.42E-05 |
| Arthropathy | 1.95E-05 |
| Concentration of
lipid | 5.73E-25 |
| Concentration of
triacylglycerol | 2.06E-17 |
| Immune response of
cells | 1.04E-04 |
| Inflammatory
response | 5.10E-08 |
| Insulin
resistance | 3.96E-09 |
| Phagocytosis | 2.80E-04 |
| Phagocytosis of
cells | 3.68E-04 |
| Rheumatic
disease | 5.06E-06 |
| Rheumatoid
arthritis | 7.08E-04 |
| Systemic autoimmune
syndrome | 9.69E-05 |
| Vascular
disease | 2.93E-12 |
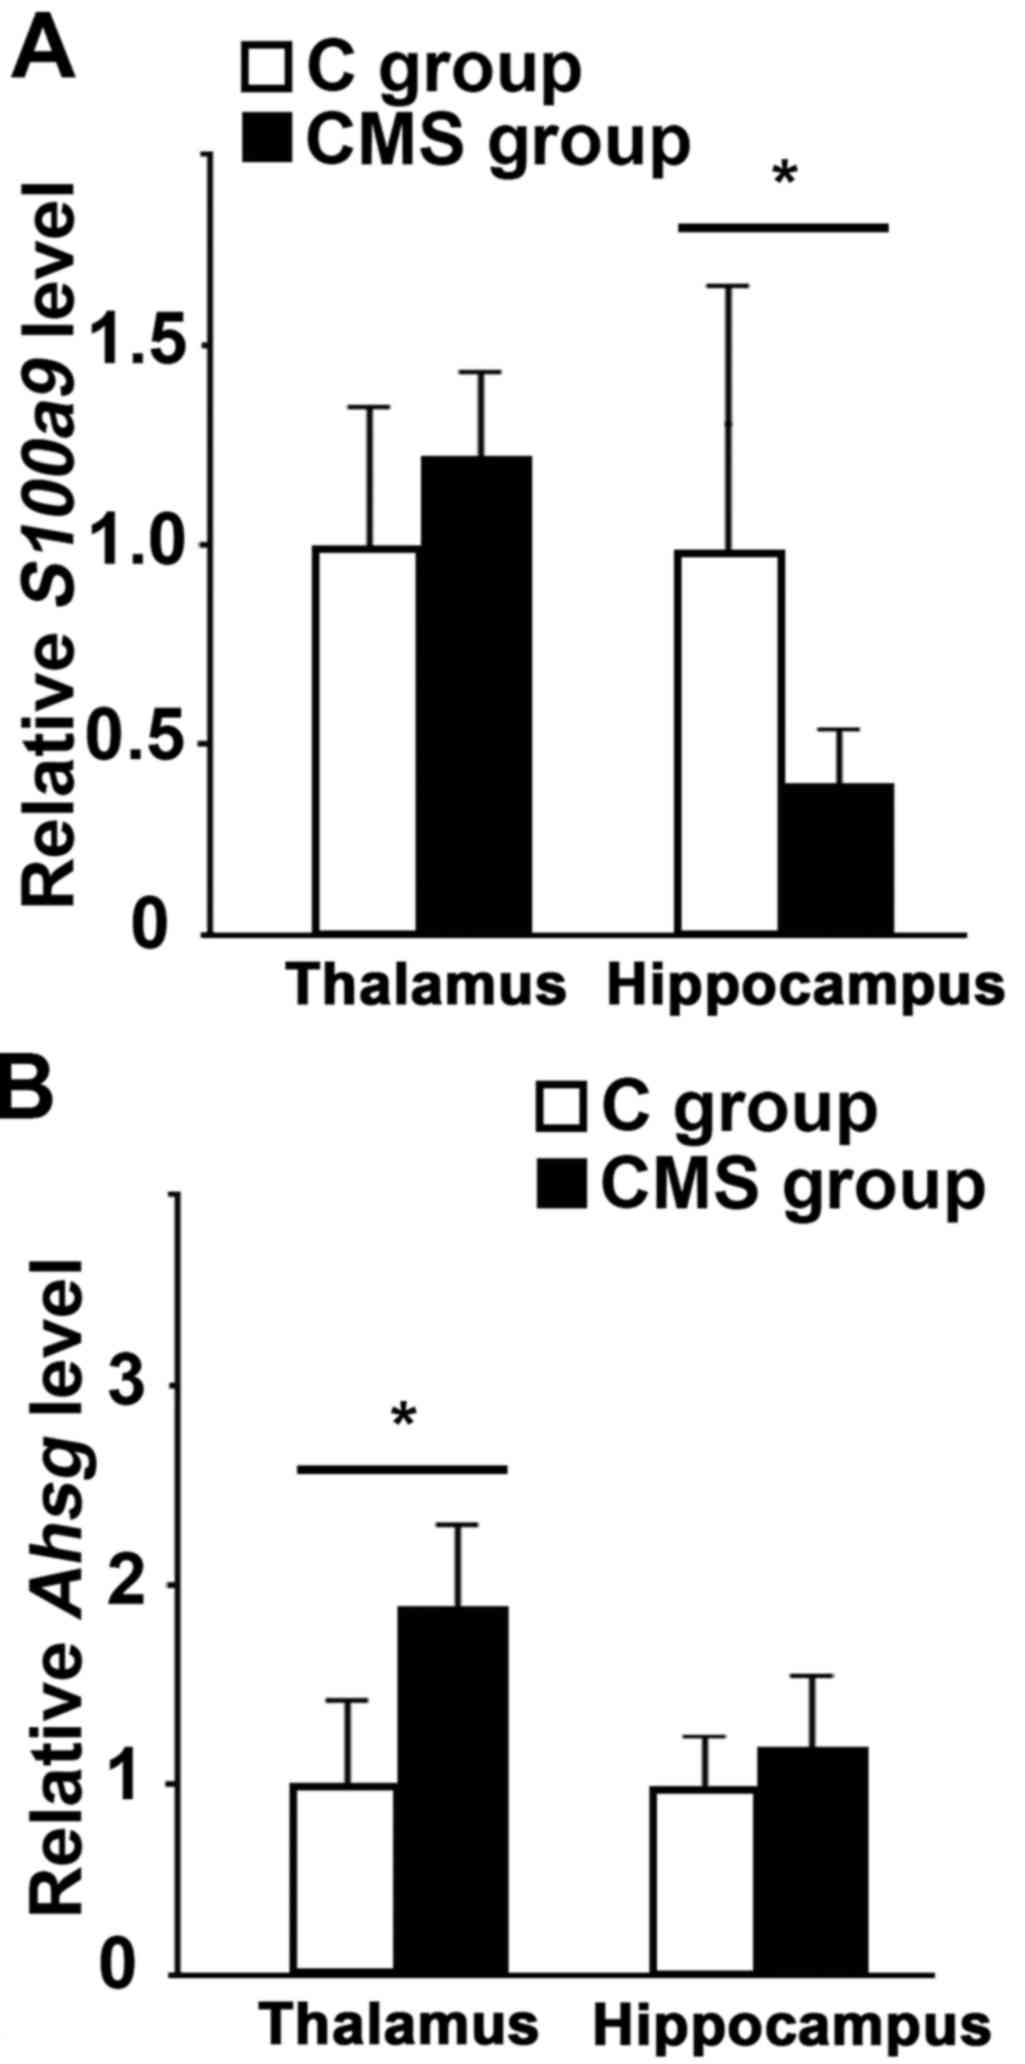
RT-qPCR
Previously, Spearman's rank collection test
identified a significant correlation between the microarray and
RT-qPCR data for S100a9 and Ahsg in the PFC (18). Additional comparisons for
F2, Igf1, Plg and Ttr in the PFC
between groups are shown in Table
VI. S100a9 expression was significantly decreased in the
hippocampus, although not in the thalamus (Fig. 2A). By contrast, Ahsg
expression was significantly increased in the thalamus, although
not in the hippocampus (Fig.
2B).
| Table VI.Comparison of gene expression levels
as determined by microarray and reverse transcription-quantitative
polymerase chain reaction experiments. |
Table VI.
Comparison of gene expression levels
as determined by microarray and reverse transcription-quantitative
polymerase chain reaction experiments.
| GenBank accession
no. | Gene symbol | FC (RT-qPCR) | FC
(microarray) |
|---|
| NM_010168 | F2 | 3.613 |
7.650 |
| NM_010512 | Igf1 | 1.482 |
3.568 |
| NM_008877 | Plg | 5.407 |
8.441 |
| NM_013697 | Ttr | 8.338 | 10.494 |
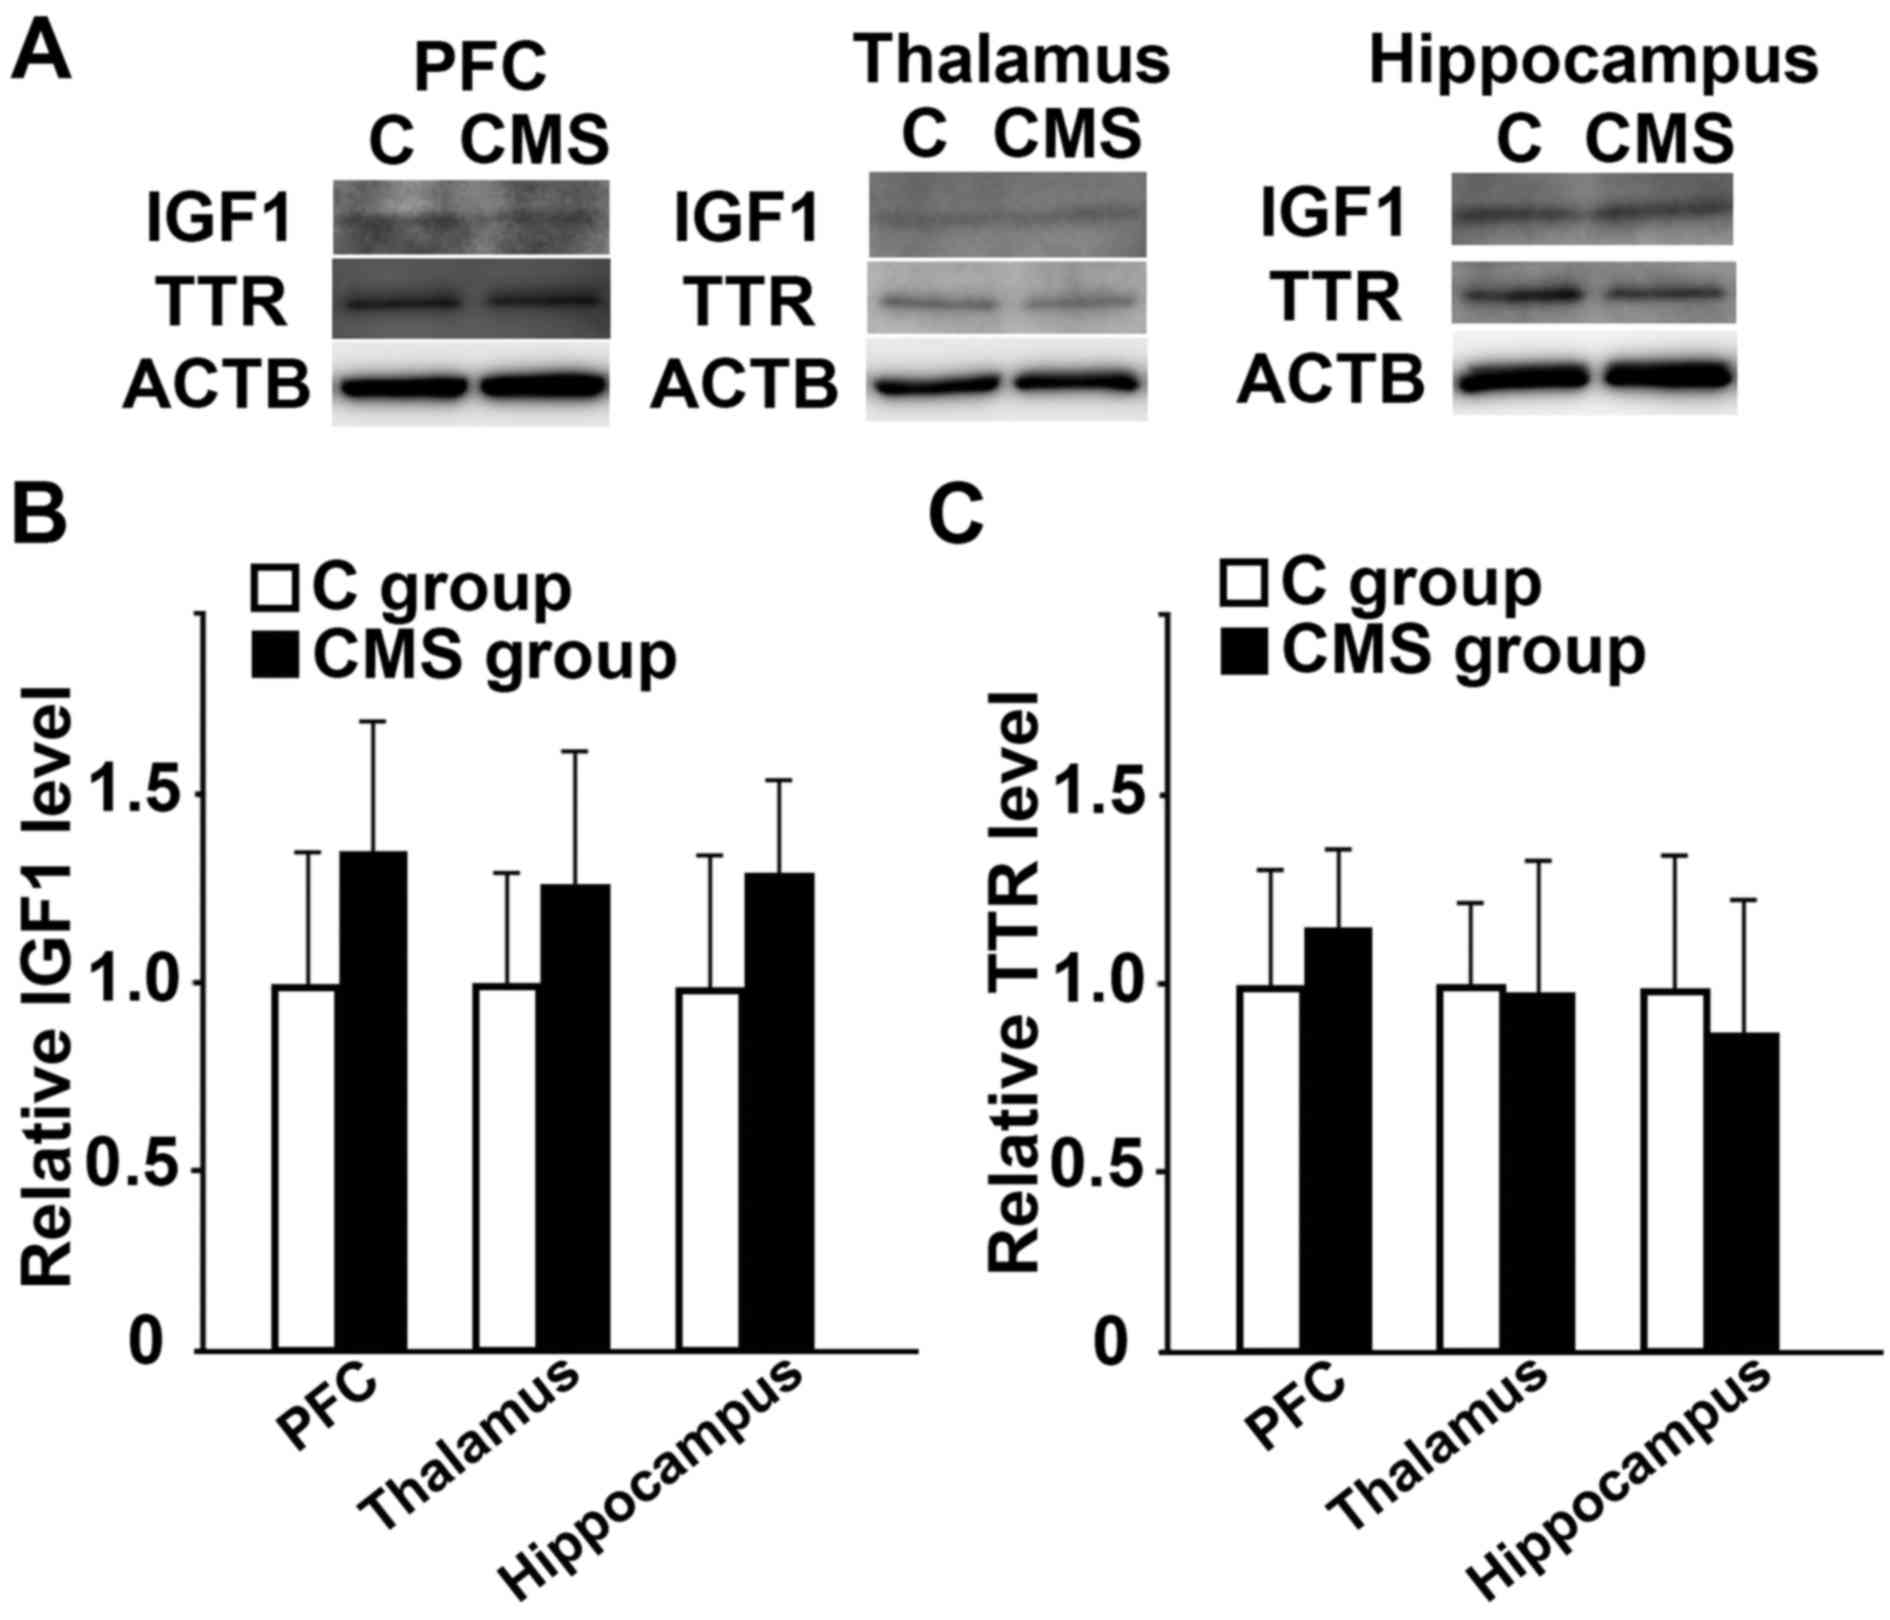
Western blotting
When the protein levels of IGF1 and TTR were
measured in the PFC, thalamus and hippocampus, no differences were
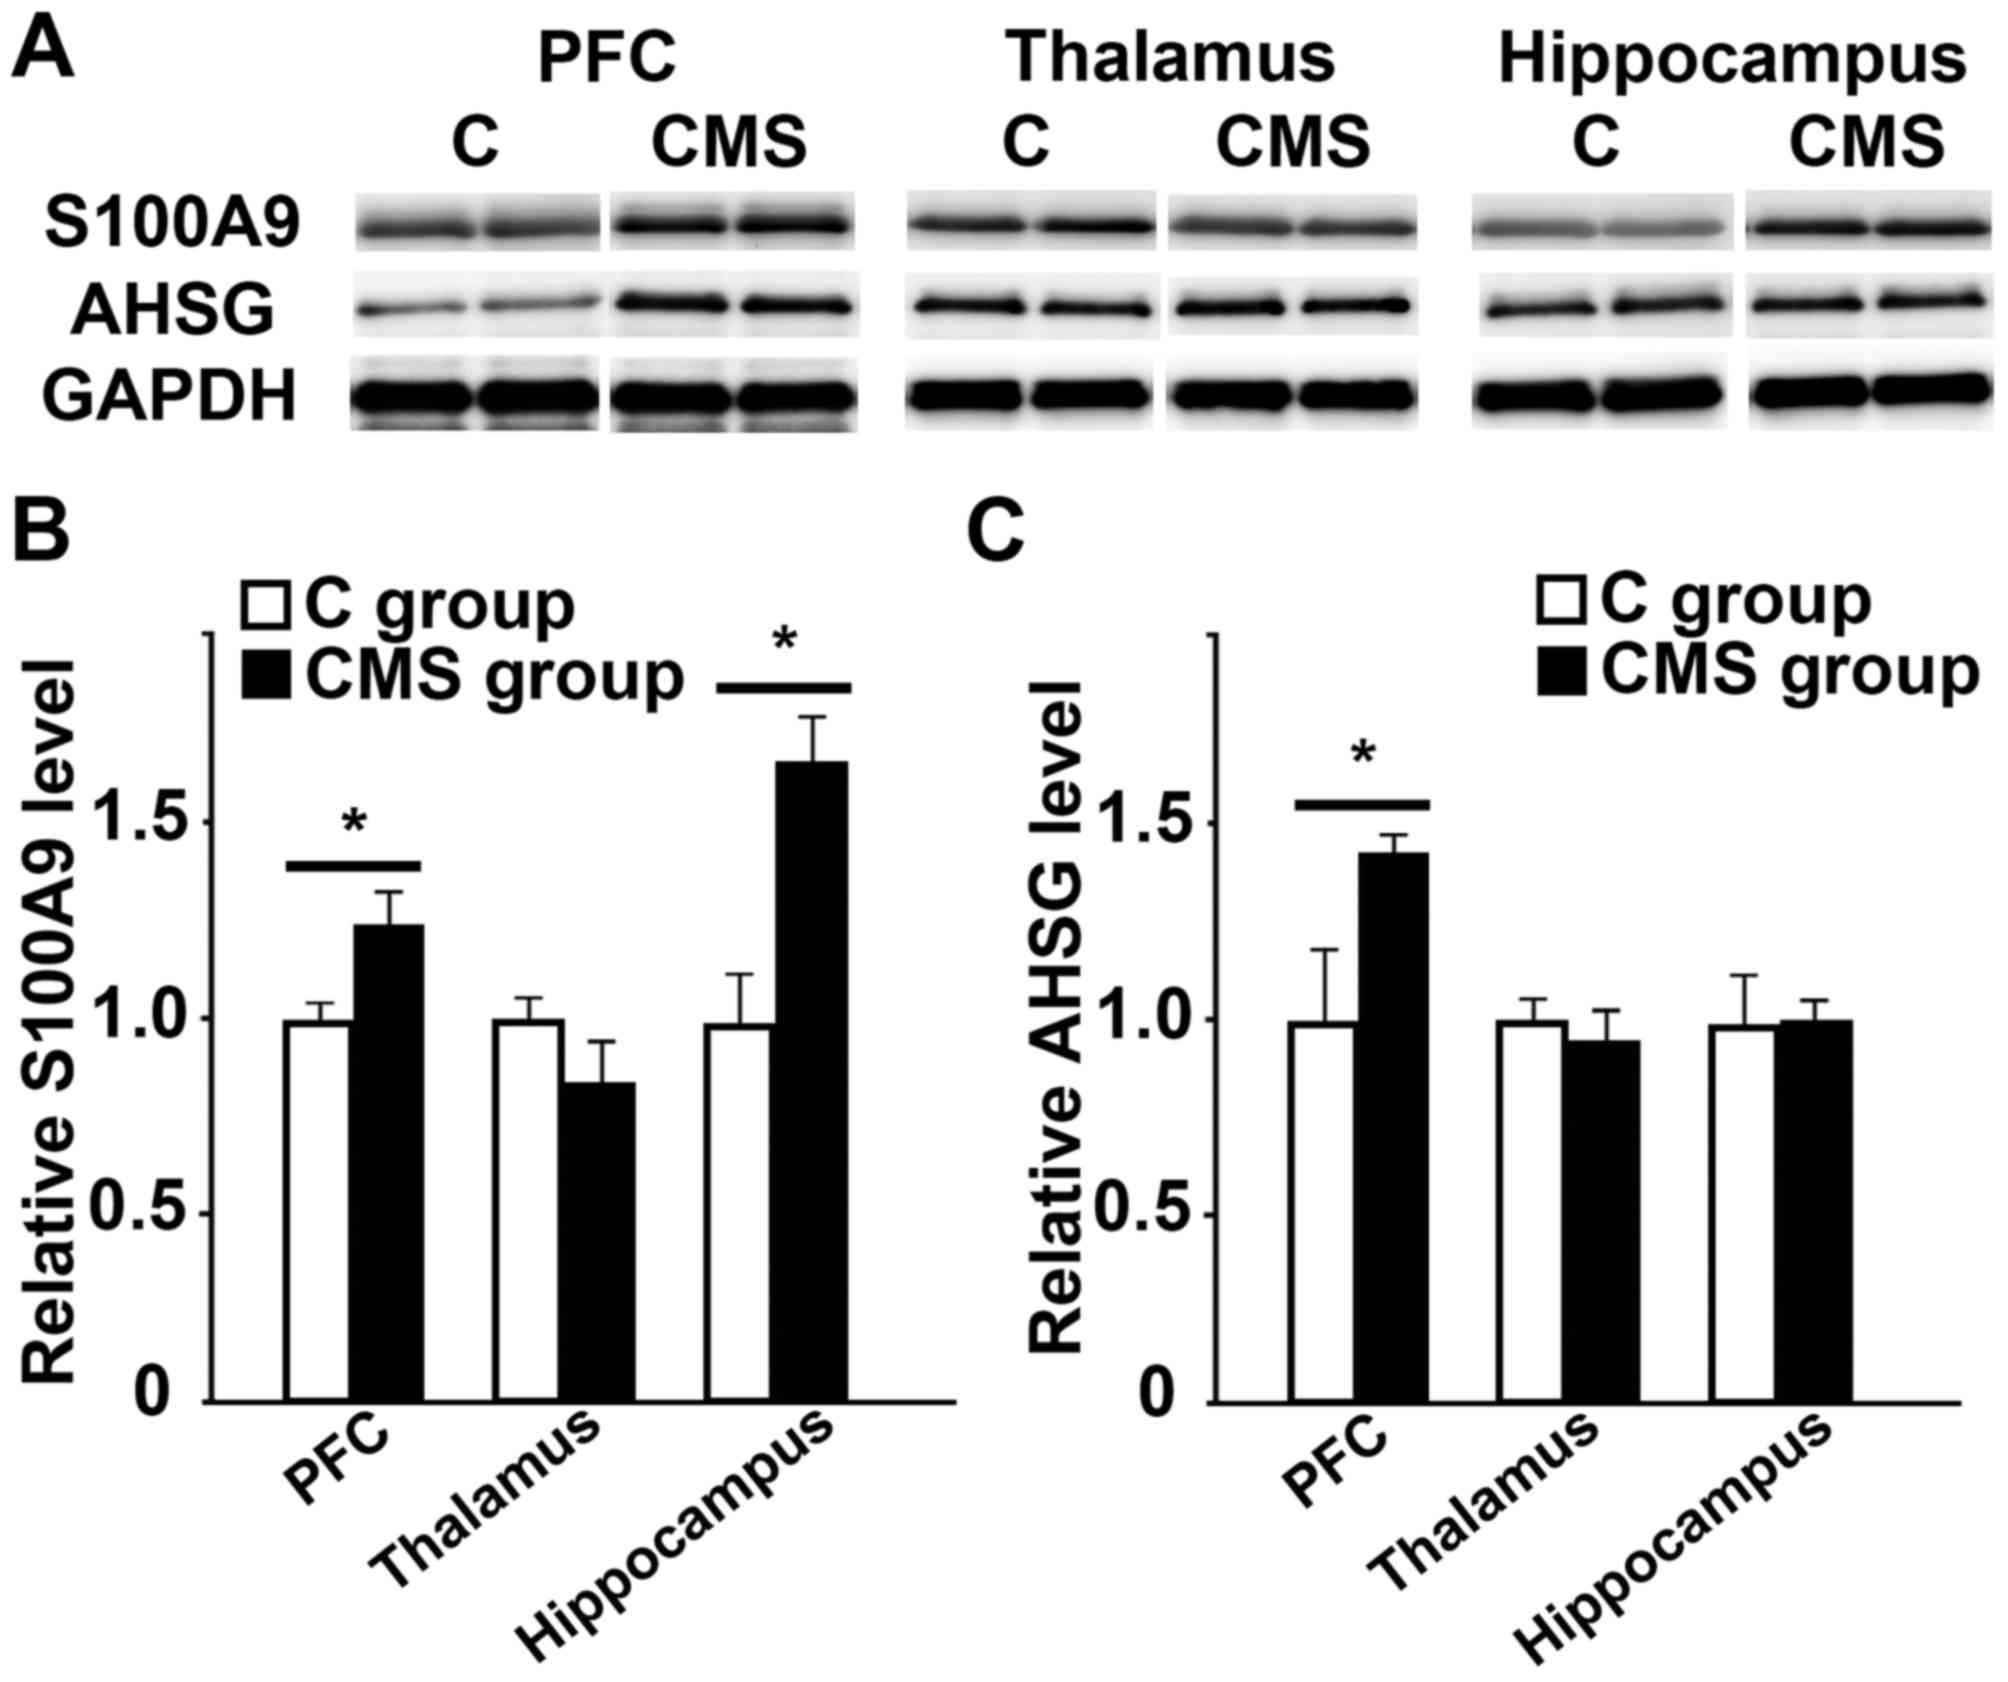
observed between the C and CMS groups (Fig. 3A-C). The augmented expression of
S100A9 and AHSG in the PFC, thalamus and hippocampus of CMS mice
was further examined. In accordance with the microarray and RT-qPCR
results, quantitative analysis of the representative blots
indicated enhanced synthesis of these two proteins in the PFC of
the CMS mice. S100A9 expression in the PFC of the CMS group was
higher compared with that in the C group (Fig. 4A and B). In contrast with the mRNA
levels in the hippocampus, S100A9 levels were significantly higher
in the hippocampus of CMS mice when compared with those of the C
group; however, there was no difference in S100A9 levels in the
thalamus (Fig. 4A and B). Similar
to the microarray and RT-qPCR results, ASHG levels in the PFC of
the CMS group were significantly increased when compared with those
in the C group (Fig. 4A and C). By
contrast, no difference was observed in the thalamus or hippocampus
(Fig. 4A and C).
Discussion
The present study revealed the following clinical
and pathophysiological features of MDD: i) F2 and
Plg, which are strongly regulated by Hnf4α, and
Serpina3 may be induced in the depressive state PFC through
Hnf4α; and ii) S100A9 and AHSG are potential biomarkers for
the development of physical disease in patients with MDD.
A total of 5 genes, F2, Igf1,
Plg, Serpina3 and Ttr, were extracted from the
IPA analyses according to the molecular mechanisms of MDD in the
PFC. As shown in Table III, 2
out of 10 annotations, ‘cell death of cerebral cortex cells’ and
‘cell death’, were associated with cell death processes such as
apoptosis (20–25). F2, Plg and
Serpina3 may increase ‘cell death’, and F2 and
Serpina3 may also be associated with ‘apoptosis of neurons’
(23–25). F2 and Plg were
categorized as ‘coagulation’, whose dysfunction may be closely
associated with MDD (18,26,27).
In addition, postmortem studies of depressed patients have revealed
morphometric changes, such as smaller sized cell bodies in PFC
regions (28). Ttr mRNA in
the PFC was higher in CMS with analgesia models, which is
consistent with the finding that serum levels of TTR in patients
with depression were higher compared with those of healthy people
(29,30). In addition, Igf1,
Plg, Serpina3 and Ttr were affected by
Hnf4α (Fig. 1A) (31–35).
These results indicated that Igf1, Plg,
Serpina3, and Ttr, which are strongly regulated by
Hnf4α, and F2 may affect the molecular mechanism of
MDD development in the PFC.
S100a9 in the hippocampus is affected by
exposure to chronic or repeated social stress, which may promote
the migration of leukocytes to the brain (36,37).
In addition to regulating inflammation, S100a9 also
regulates responses to fibrosis, arteriosclerosis and infarction
(38–43). S100A9 levels in the CMS group were
higher compared with those in the C group, which was consistent
with the mRNA levels in the PFC. In the hippocampus, S100A9 levels
in the CMS group were higher compared with those in the C group,
which was inconsistent with the mRNA levels. According to the Allen
Brain Atlas (http://mouse.brain-map.org/), S100a9 is
expressed at low levels in the hippocampal formation and thalamus
of a normal mouse (http://mouse.brain-map.org/gene/show/19965) (44). S100A9, which is regulated by
Hnf4α was upregulated in the PFC and hippocampus (18,32).
Thus, S100a9/S100A9 may be upregulated in the depressive
state through Hnf4α/HNF4A. This suggests that
S100a9/S100A9 may have a role in chronic social stress and
also in the development of physical diseases, such as inflammation
or ischemia of the brain.
Clinical research has revealed a significant
association between Ahsg and cognitive dysfunctions that are
frequently observed in patients with MDD (45). Ahsg was categorized in
immune disorders, and also in physical functions of glucose and
lipid homeostasis (46,47). Our previous results indicated that
the CMS model had hypertriglycemia, and that there may be a
significant association between MDD and metabolic disorders
(18). The present study revealed
that Ahsg levels in the PFC and thalamus of the CMS group
were higher compared with those of the C group (Fig. 2B). According to the Allen Brain
Atlas (http://mouse.brain-map.org/),
Ahsg is expressed at relatively low levels in a normal mouse
cortex and thalamus (http://mouse.brain-map.org/gene/show/11412) (44). In addition, there were significant
group differences in the level of AHSG in the PFC, similar to those
of HNF4A (18). Thus, AHSG may
affect physiological homeostasis and lead to physical diseases,
such as metabolic disorders, under MDD conditions.
In a meta-analysis of clinical studies, levels of
interleukin (IL)-6 and tumor necrosis factor (TNF)-α were
significantly higher in patients with MDD when compared with those
in normal controls (13). This
finding supports a potentially close association between MDD and
the inflammatory response. In our previous study, levels of
inflammatory cytokines, such as IL-5 and TNF-α, were higher in the
CMS group when compared with those in the C group (18). These results were consistent with
previous findings from clinical and animal studies, and support the
occurrence of inflammation during the course of MDD (13,48).
In addition, a clinical study revealed that serum S100A9 levels
were greater in patients with an autoimmune disorder or rheumatoid
arthritis when compared with healthy controls (41). From the IPA results, S100a9,
Tnfα and Il12 may regulate each other (49–51),
which further supports the close association between MDD and the
inflammatory response. As serum AHSG levels are associated with the
probability of metabolic syndrome and insulin resistance (52,53),
these two molecules may increase the risk of developing physical
diseases in patients with MDD.
Regarding the limitations of the present study,
S100A9 and AHSG were measured in only three brain regions in an
animal model. To more thoroughly examine our hypotheses and to
verify clinical relevance, particularly in association with
physiological functions, metabolism should be analyzed in
peripheral organs. In addition, measurement of the S100A9 and AHSG
serum levels in this model would clarify the interactions between
depression and other diseases; however, this was not possible in
the present study due to a lack of serum. Therefore, further
studies are required to evaluate these roles and the potential
associations between other molecules associated with MDD and
physiological homeostasis, including lipid metabolism or immune
reactions. Finally, Serpina3 was not measured by RT-qPCR, as
different subtypes were detected multiple times on the microarray
(GSE49867 on the Gene Expression Omnibus web page; https://www.ncbi.nlm.nih.gov/geo/query/acc.cgi?acc=GSE49867).
In conclusion, the present study demonstrated that a
number of molecules directly regulated by Hnf4α in the PFC
may be closely associated with the development of MDD. S100A9 and
AHSG were clearly expressed in the brain and may link depression
with physiological homeostasis. Though there were a number of
limitations in the present study, the results may help to clarify
the mechanism mediating the interactions between MDD and
physiological homeostasis in humans.
Acknowledgements
The authors would like to thank Mr Nobutaka Okamura
(Department of Neuropsychiatry, Hyōgo College of Medicine, Hyōgo,
Japan), Mrs. Naomi Gamachi (Laboratory of Tumor Immunology and Cell
Therapy, Hyōgo College of Medicine, Hyōgo, Japan) and Ms. Emi
Yamaguchi (Laboratory of Tumor Immunology and Cell Therapy, Hyōgo
College of Medicine, Hyōgo, Japan) for their technical support; Mr
Nobutaka Okamura for his assistance in the care of animals and
collection of samples, Mrs. Naomi Gamachi for skilled western
blotting, and Ms. Emi Yamaguchi for RNA purification and clerical
support. In addition, the authors are grateful to the staff in the
Research Facilities for Common Use, Hyōgo College of Medicine
(Hyōgo, Japan), for allowing the use of their resources for RT-qPCR
and western blotting. Finally, the authors thank the editing staff
of Edanz Group Japan (Fukuoka, Japan) for their editorial support
and proofreading.
Glossary
Abbreviations
Abbreviations:
|
ACTB
|
β-actin
|
|
Ahsg/AHSG
|
α2-HS-glycoprotein
|
|
Bdnf
|
brain-derived neurotrophic factor
|
|
CMS
|
chronic mild stress
|
|
F2
|
coagulation factor II
|
|
Hnf4α/HNF4A
|
hepatocyte nuclear factor 4α
|
|
Igf1/IGF1
|
insulin-like growth factor 1
|
|
Il/IL
|
interleukin
|
|
IPA
|
Ingenuity Pathway Analysis
|
|
MDD
|
major depressive disorder
|
|
PFC
|
prefrontal cortex
|
|
Plg
|
plasminogen
|
|
RT-qPCR
|
quantitative reverse transcription
polymerase chain reaction
|
|
S100a9/S100A9
|
S100 calcium-binding protein A9
|
|
Serpina3
|
serine (or cysteine) peptidase
inhibitor, clade A, member 3
|
|
Tnfa/TNFA
|
tumor necrosis factor α
|
|
Ttr/TTR
|
transthyretin
|
References
|
1
|
Health Statistics Office, Vital, Health
and Social Statistics Division, . Patient Survey. Japan: Ministry
of Health, Labour and Welfare; 2011, http://www.mhlw.go.jp/english/database/db-hss/ps.html
|
|
2
|
Ministry of Health, Labour and Welfare.
Health, Labour and Welfare Report, . Ministry of Health, Labour and
Welfare. Japan: 2010, http://www.mhlw.go.jp/english/wp/wp-hw5/index.html
|
|
3
|
Slattery DA, Hudson AL and Nutt DJ:
Invited review: The evolution of antidepressant mechanisms. Fundam
Clin Pharmacol. 18:1–21. 2004. View Article : Google Scholar : PubMed/NCBI
|
|
4
|
Young EA and Korszun A: The
hypothalamic-pituitary-gonadal axis in mood disorders. Endocrinol
Metab Clin North Am. 31:63–78. 2002. View Article : Google Scholar : PubMed/NCBI
|
|
5
|
Paizanis E, Hamon M and Lanfumey L:
Hippocampal neurogenesis, depressive disorders, and antidepressant
therapy. Neural Plast. 2007:737542007. View Article : Google Scholar : PubMed/NCBI
|
|
6
|
Diener C, Kuehner C, Brusniak W, Ubl B,
Wessa M and Flor H: A meta-analysis of neurofunctional imaging
studies of emotion and cognition in major depression. Neuroimage.
61:677–685. 2012. View Article : Google Scholar : PubMed/NCBI
|
|
7
|
Sawyer K, Corsentino E, Sachs-Ericsson N
and Steffens DC: Depression, hippocampal volume changes, and
cognitive decline in a clinical sample of older depressed
outpatients and non-depressed controls. Aging Ment Health.
16:753–762. 2012. View Article : Google Scholar : PubMed/NCBI
|
|
8
|
Schiepers OJ, Wichers MC and Maes M:
Cytokines and major depression. Prog Neuropsychopharmacol Biol
Psychiatry. 29:201–217. 2005. View Article : Google Scholar : PubMed/NCBI
|
|
9
|
Slavich GM and Irwin MR: From stress to
inflammation and major depressive disorder: A social signal
transduction theory of depression. Psychol Bull. 140:774–815. 2014.
View Article : Google Scholar : PubMed/NCBI
|
|
10
|
Oxenkrug GF: Tryptophan kynurenine
metabolism as a common mediator of genetic and environmental
impacts in major depressive disorder: The serotonin hypothesis
revisited 40 years later. Isr J Psychiatry Relat Sci. 47:56–63.
2010.PubMed/NCBI
|
|
11
|
Hage MP and Azar ST: The link between
thyroid function and depression. J Thyroid Res. 2012:5906482012.
View Article : Google Scholar : PubMed/NCBI
|
|
12
|
Ross DA and Cetas JS: Steroid psychosis: A
review for neurosurgeons. J Neurooncol. 109:439–447. 2012.
View Article : Google Scholar : PubMed/NCBI
|
|
13
|
Dowlati Y, Herrmann N, Swardfager W, Liu
H, Sham L, Reim EK and Lanctôt KL: A meta-analysis of cytokines in
major depression. Biol Psychiatry. 67:446–457. 2010. View Article : Google Scholar : PubMed/NCBI
|
|
14
|
Karege F, Perret G, Bondolfi G, Schwald M,
Bertschy G and Aubry JM: Decreased serum brain-derived neurotrophic
factor levels in major depressed patients. Psychiatry Res.
109:143–148. 2002. View Article : Google Scholar : PubMed/NCBI
|
|
15
|
Shimizu E, Hashimoto K, Okamura N, Koike
K, Komatsu N, Kumakiri C, Nakazato M, Watanabe H, Shinoda N, Okada
S and Iyo M: Alterations of serum levels of brain-derived
neurotrophic factor (BDNF) in depressed patients with or without
antidepressants. Biol Psychiatry. 54:70–75. 2003. View Article : Google Scholar : PubMed/NCBI
|
|
16
|
Pedersen BK: Special feature for the
Olympics: Effects of exercise on the immune system: Exercise and
cytokines. Immunol Cell Biol. 78:532–535. 2000. View Article : Google Scholar : PubMed/NCBI
|
|
17
|
Chung S, Son GH and Kim K: Circadian
rhythm of adrenal glucocorticoid: Its regulation and clinical
implications. Biochim Biophys Acta. 1812:581–591. 2011. View Article : Google Scholar : PubMed/NCBI
|
|
18
|
Yamanishi K, Doe N, Sumida M, Watanabe Y,
Yoshida M, Yamamoto H, Xu Y, Li W, Yamanishi H, Okamura H and
Matsunaga H: Hepatocyte nuclear factor 4 alpha is a key factor
related to depression and physiological homeostasis in the mouse
brain. PLoS One. 10:e01190212015. View Article : Google Scholar : PubMed/NCBI
|
|
19
|
Yamanishi K, Maeda S, Kuwahara-Otani S,
Watanabe Y, Yoshida M, Ikubo K, Okuzaki D, El-Darawish Y, Li W,
Nakasho K, et al: Interleukin-18-deficient mice develop
dyslipidemia resulting in nonalcoholic fatty liver disease and
steatohepatitis. Transl Res. 173:101–114.e7. 2016. View Article : Google Scholar : PubMed/NCBI
|
|
20
|
Stein TD, Anders NJ, DeCarli C, Chan SL,
Mattson MP and Johnson JA: Neutralization of transthyretin reverses
the neuroprotective effects of secreted amyloid precursor protein
(APP) in APPSW mice resulting in tau phosphorylation and loss of
hippocampal neurons: Support for the amyloid hypothesis. J
Neurosci. 24:7707–7717. 2004. View Article : Google Scholar : PubMed/NCBI
|
|
21
|
Yadav A, Kalita A, Dhillon S and Banerjee
K: JAK/STAT3 pathway is involved in survival of neurons in response
to insulin-like growth factor and negatively regulated by
suppressor of cytokine signaling-3. J Biol Chem. 280:31830–31840.
2005. View Article : Google Scholar : PubMed/NCBI
|
|
22
|
Zheng WH, Kar S and Quirion R:
Insulin-like growth factor-1-induced phosphorylation of
transcription factor FKHRL1 is mediated by phosphatidylinositol
3-kinase/Akt kinase and role of this pathway in insulin-like growth
factor-1-induced survival of cultured hippocampal neurons. Mol
Pharmacol. 62:225–233. 2002. View Article : Google Scholar : PubMed/NCBI
|
|
23
|
Padmanabhan J, Levy M, Dickson DW and
Potter H: Alpha1-antichymotrypsin, an inflammatory protein
overexpressed in Alzheimer's disease brain, induces tau
phosphorylation in neurons. Brain. 129:3020–3034. 2006. View Article : Google Scholar : PubMed/NCBI
|
|
24
|
Tsirka SE, Rogove AD, Bugge TH, Degen JL
and Strickland S: An extracellular proteolytic cascade promotes
neuronal degeneration in the mouse hippocampus. J Neurosci.
17:543–552. 1997.PubMed/NCBI
|
|
25
|
Donovan FM, Pike CJ, Cotman CW and
Cunningham DD: Thrombin induces apoptosis in cultured neurons and
astrocytes via a pathway requiring tyrosine kinase and RhoA
activities. J Neurosci. 17:5316–5326. 1997.PubMed/NCBI
|
|
26
|
Geiser F, Conrad R, Imbierowicz K, Meier
C, Liedtke R, Klingmüller D, Oldenburg J and Harbrecht U:
Coagulation activation and fibrinolysis impairment are reduced in
patients with anxiety and depression when medicated with
serotonergic antidepressants. Psychiatry Clin Neurosci. 65:518–525.
2011. View Article : Google Scholar : PubMed/NCBI
|
|
27
|
Schroeder V, Borner U, Gutknecht S, Schmid
JP, Saner H and Kohler HP: Relation of depression to various
markers of coagulation and fibrinolysis in patients with and
without coronary artery disease. Eur J Cardiovasc Prev Rehabil.
14:782–787. 2007. View Article : Google Scholar : PubMed/NCBI
|
|
28
|
Kang HJ, Voleti B, Hajszan T, Rajkowska G,
Stockmeier CA, Licznerski P, Lepack A, Majik MS, Jeong LS, Banasr
M, et al: Decreased expression of synapse-related genes and loss of
synapses in major depressive disorder. Nat Med. 18:1413–1417. 2012.
View Article : Google Scholar : PubMed/NCBI
|
|
29
|
Frye MA, Nassan M, Jenkins GD, Kung S,
Veldic M, Palmer BA, Feeder SE, Tye SJ, Choi DS and Biernacka JM:
Feasibility of investigating differential proteomic expression in
depression: Implications for biomarker development in mood
disorders. Transl Psychiatry. 5:e6892015. View Article : Google Scholar : PubMed/NCBI
|
|
30
|
Lisowski P, Wieczorek M, Goscik J,
Juszczak GR, Stankiewicz AM, Zwierzchowski L and Swiergiel AH:
Effects of chronic stress on prefrontal cortex transcriptome in
mice displaying different genetic backgrounds. J Mol Neurosci.
50:33–57. 2013. View Article : Google Scholar : PubMed/NCBI
|
|
31
|
Kang X, Song Z, McClain CJ, Kang YJ and
Zhou Z: Zinc supplementation enhances hepatic regeneration by
preserving hepatocyte nuclear factor-4alpha in mice subjected to
long-term ethanol administration. Am J Pathol. 172:916–925. 2008.
View Article : Google Scholar : PubMed/NCBI
|
|
32
|
Odom DT, Zizlsperger N, Gordon DB, Bell
GW, Rinaldi NJ, Murray HL, Volkert TL, Schreiber J, Rolfe PA,
Gifford DK, et al: Control of pancreas and liver gene expression by
HNF transcription factors. Science. 303:1378–1381. 2004. View Article : Google Scholar : PubMed/NCBI
|
|
33
|
Naiki T, Nagaki M, Shidoji Y, Kojima H,
Imose M, Kato T, Ohishi N, Yagi K and Moriwaki H: Analysis of gene
expression profile induced by hepatocyte nuclear factor 4alpha in
hepatoma cells using an oligonucleotide microarray. J Biol Chem.
277:14011–14019. 2002. View Article : Google Scholar : PubMed/NCBI
|
|
34
|
Späth GF and Weiss MC: Hepatocyte nuclear
factor 4 expression overcomes repression of the hepatic phenotype
in dedifferentiated hepatoma cells. Mol Cell Biol. 17:1913–1922.
1997. View Article : Google Scholar : PubMed/NCBI
|
|
35
|
Costa RH, Van Dyke TA, Yan C, Kuo F and
Darnell JE Jr: Similarities in transthyretin gene expression and
differences in transcription factors: Liver and yolk sac compared
to choroid plexus. Proc Natl Acad Sci USA. 87:6589–6593. 1990.
View Article : Google Scholar : PubMed/NCBI
|
|
36
|
Stankiewicz AM, Goscik J, Majewska A,
Swiergiel AH and Juszczak GR: The effect of acute and chronic
social stress on the hippocampal transcriptome in mice. PLoS One.
10:e01421952015. View Article : Google Scholar : PubMed/NCBI
|
|
37
|
Wohleb ES, Powell ND, Godbout JP and
Sheridan JF: Stress-induced recruitment of bone marrow-derived
monocytes to the brain promotes anxiety-like behavior. J Neurosci.
33:13820–13833. 2013. View Article : Google Scholar : PubMed/NCBI
|
|
38
|
Li C, Li S, Jia C, Yang L, Song Z and Wang
Y: Low concentration of S100A8/9 promotes angiogenesis-related
activity of vascular endothelial cells: Bridges among inflammation,
angiogenesis, and tumorigenesis? Mediators Inflamm.
2012:2485742012. View Article : Google Scholar : PubMed/NCBI
|
|
39
|
Croce K, Gao H, Wang Y, Mooroka T, Sakuma
M, Shi C, Sukhova GK, Packard RR, Hogg N, Libby P and Simon DI:
Myeloid-related protein-8/14 is critical for the biological
response to vascular injury. Circulation. 120:427–436. 2009.
View Article : Google Scholar : PubMed/NCBI
|
|
40
|
de Seny D, Fillet M, Ribbens C, Marée R,
Meuwis MA, Lutteri L, Chapelle JP, Wehenkel L, Louis E, Merville MP
and Malaise M: Monomeric calgranulins measured by SELDI-TOF mass
spectrometry and calprotectin measured by ELISA as biomarkers in
arthritis. Clin Chem. 54:1066–1075. 2008. View Article : Google Scholar : PubMed/NCBI
|
|
41
|
Sinz A, Bantscheff M, Mikkat S, Ringel B,
Drynda S, Kekow J, Thiesen HJ and Glocker MO: Mass spectrometric
proteome analyses of synovial fluids and plasmas from patients
suffering from rheumatoid arthritis and comparison to reactive
arthritis or osteoarthritis. Electrophoresis. 23:3445–3456. 2002.
View Article : Google Scholar : PubMed/NCBI
|
|
42
|
Trendelenburg G: Molecular regulation of
cell fate in cerebral ischemia: Role of the inflammasome and
connected pathways. J Cereb Blood Flow Metab. 34:1857–1867. 2014.
View Article : Google Scholar : PubMed/NCBI
|
|
43
|
Nagareddy PR, Murphy AJ, Stirzaker RA, Hu
Y, Yu S, Miller RG, Ramkhelawon B, Distel E, Westerterp M, Huang
LS, et al: Hyperglycemia promotes myelopoiesis and impairs the
resolution of atherosclerosis. Cell Metab. 17:695–708. 2013.
View Article : Google Scholar : PubMed/NCBI
|
|
44
|
Lein ES, Hawrylycz MJ, Ao N, Ayres M,
Bensinger A, Bernard A, Boe AF, Boguski MS, Brockway KS, Byrnes EJ,
et al: Genome-wide atlas of gene expression in the adult mouse
brain. Nature. 445:168–176. 2007. View Article : Google Scholar : PubMed/NCBI
|
|
45
|
Laughlin GA, McEvoy LK, Barrett-Connor E,
Daniels LB and Ix JH: Fetuin-A, a new vascular biomarker of
cognitive decline in older adults. Clin Endocrinol (Oxf).
81:134–140. 2014. View Article : Google Scholar : PubMed/NCBI
|
|
46
|
Biswas S, Sharma S, Saroha A, Bhakuni DS,
Malhotra R, Zahur M, Oellerich M, Das HR and Asif AR:
Identification of novel autoantigen in the synovial fluid of
rheumatoid arthritis patients using an immunoproteomics approach.
PLoS One. 8:e562462013. View Article : Google Scholar : PubMed/NCBI
|
|
47
|
Mathews ST, Singh GP, Ranalletta M,
Cintron VJ, Qiang X, Goustin AS, Jen KL, Charron MJ, Jahnen-Dechent
W and Grunberger G: Improved insulin sensitivity and resistance to
weight gain in mice null for the Ahsg gene. Diabetes. 51:2450–2458.
2002. View Article : Google Scholar : PubMed/NCBI
|
|
48
|
You Z, Luo C, Zhang W, Chen Y, He J, Zhao
Q, Zuo R and Wu Y: Pro- and anti-inflammatory cytokines expression
in rat's brain and spleen exposed to chronic mild stress:
Involvement in depression. Behav Brain Res. 225:135–141. 2011.
View Article : Google Scholar : PubMed/NCBI
|
|
49
|
Lee SY, Jung YO, Kim DJ, Kang CM, Moon YM,
Heo YJ, Oh HJ, Park SJ, Yang SH, Kwok SK, et al: IL-12p40 homodimer
ameliorates experimental autoimmune arthritis. J Immunol.
195:3001–3010. 2015. View Article : Google Scholar : PubMed/NCBI
|
|
50
|
Nakajima K, Kanda T, Takaishi M, Shiga T,
Miyoshi K, Nakajima H, Kamijima R, Tarutani M, Benson JM, Elloso
MM, et al: Distinct roles of IL-23 and IL-17 in the development of
psoriasis-like lesions in a mouse model. J Immunol. 186:4481–4489.
2011. View Article : Google Scholar : PubMed/NCBI
|
|
51
|
Sunahori K, Yamamura M, Yamana J, Takasugi
K, Kawashima M, Yamamoto H, Chazin WJ, Nakatani Y, Yui S and Makino
H: The S100A8/A9 heterodimer amplifies proinflammatory cytokine
production by macrophages via activation of nuclear factor kappa B
and p38 mitogen-activated protein kinase in rheumatoid arthritis.
Arthritis Res Ther. 8:R692006. View
Article : Google Scholar : PubMed/NCBI
|
|
52
|
Xu Y, Xu M, Bi Y, Song A, Huang Y, Liu Y,
Wu Y, Chen Y, Wang W, Li X and Ning G: Serum fetuin-A is correlated
with metabolic syndrome in middle-aged and elderly Chinese.
Atherosclerosis. 216:180–186. 2011. View Article : Google Scholar : PubMed/NCBI
|
|
53
|
Ishibashi A, Ikeda Y, Ohguro T, Kumon Y,
Yamanaka S, Takata H, Inoue M, Suehiro T and Terada Y: Serum
fetuin-A is an independent marker of insulin resistance in Japanese
men. J Atheroscler Thromb. 17:925–933. 2010. View Article : Google Scholar : PubMed/NCBI
|