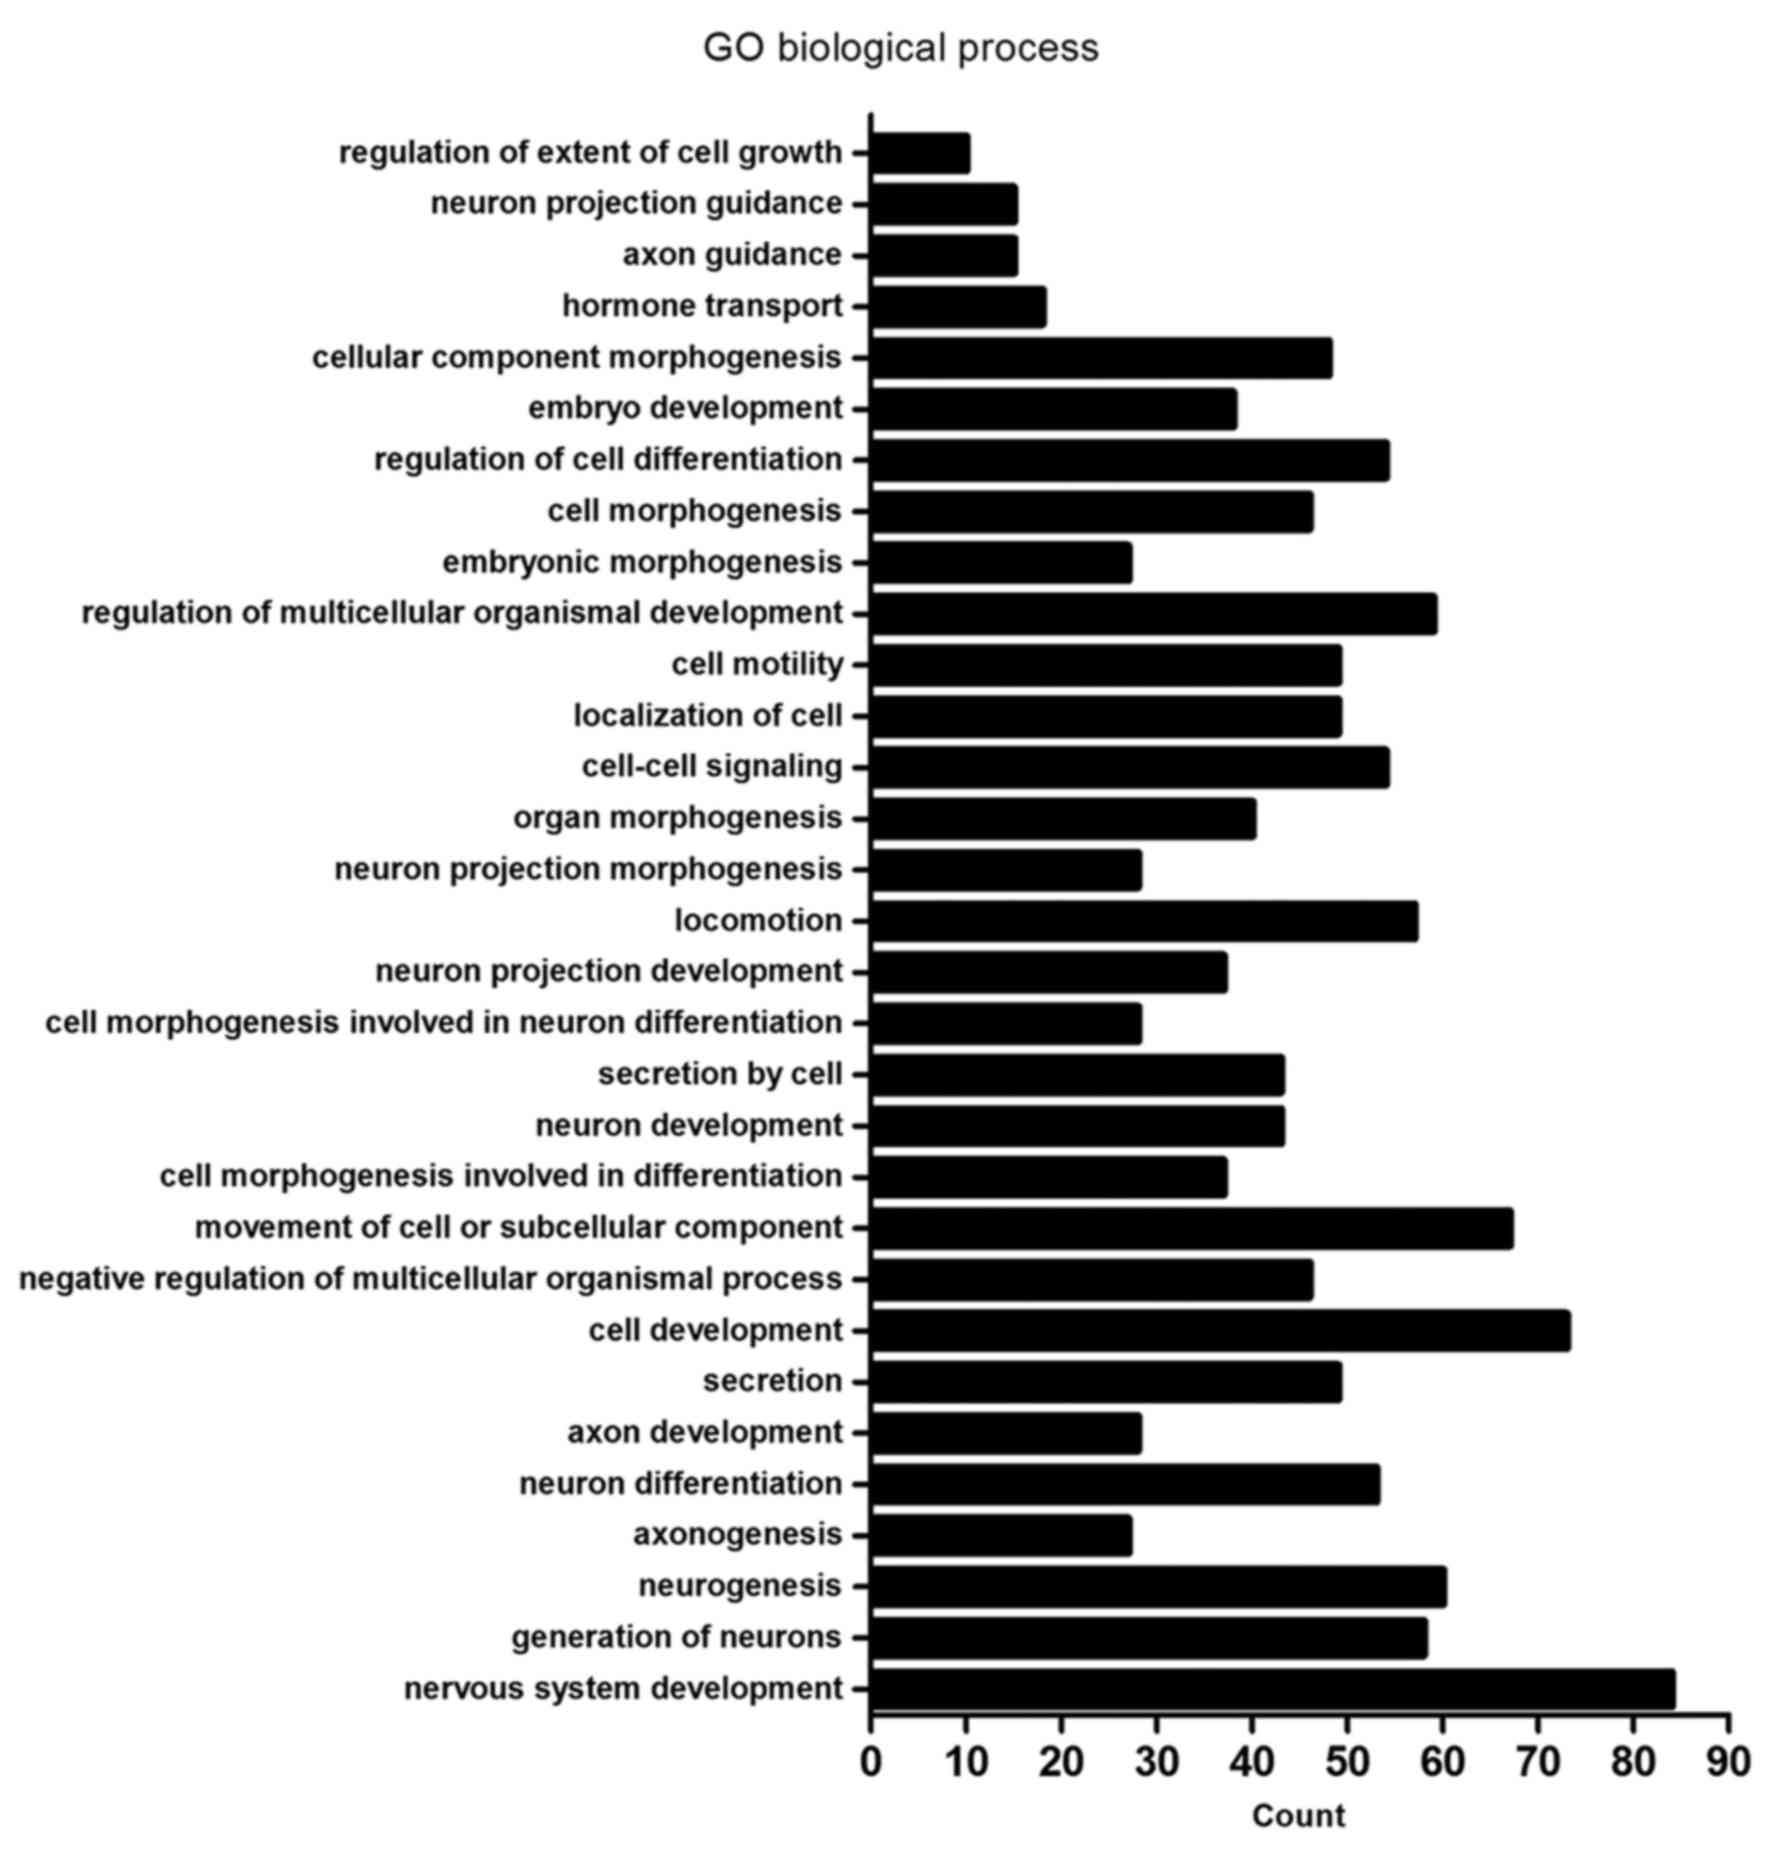
Open Access

Identification of genes and pathways associated with MDR in MCF-7/MDR breast cancer cells by RNA-seq analysis

  • Authors:
    • Minlan Yang
    • Hairi Li
    • Yanru Li
    • Yang Ruan
    • Chengshi Quan
  • View Affiliations

  • Published online on: March 7, 2018     https://doi.org/10.3892/mmr.2018.8704
  • Pages: 6211-6226
  • Copyright: © Yang et al. This is an open access article distributed under the terms of Creative Commons Attribution License.

Metrics: Total Views: 0 (Spandidos Publications: | PMC Statistics: )
Total PDF Downloads: 0 (Spandidos Publications: | PMC Statistics: )


Abstract

Multidrug resistance (MDR) is a major problem in the treatment of breast cancer. In the present study, next-generation sequencing technology was employed to identify differentially expressed genes in MCF‑7/MDR cells and MCF‑7 cells, and aimed to investigate the underlying molecular mechanisms of MDR in breast cancer. Differentially expressed genes between MCF‑7/MDR and MCF‑7 cells were selected using software; a total of 2085 genes were screened as differentially expressed in MCF‑7/MDR cells. Furthermore, gene ontology (GO) and Kyoto Encyclopedia of Genes and Genomes (KEGG) pathway enrichment analyses were performed using the DAVID database. Finally, a protein‑protein interaction network was constructed and the hub genes in the network were analyzed using the STRING database. GO annotation demonstrated that the differentially expressed genes were enriched in various biological processes, including ‘regulation of cell differentiation’, ‘cell development’, ‘neuron development’, ‘movement of cell or subcellular component’ and ‘cell morphogenesis involved in neuron differentiation’. Cellular component analysis by GO revealed that differentially expressed genes were enriched in ‘plasma membrane region’ and ‘extracellular matrix’ terms. Furthermore, KEGG analysis demonstrated that the target genes were enriched in various pathways, including ‘cell adhesion molecules (CAMs)’, ‘calcium signaling pathway’, ‘tight junction’, ‘Wnt signaling pathway’ and ‘pathways in cancer’ terms. A protein‑protein interaction network demonstrated that certain hub genes, including cyclin D1, nitric oxide synthase 3 (NOS3), NOTCH3, brain‑derived neurotrophic factor (BDNF), paired box 6, neuropeptide Y, phospholipase C β (PLCB) 4, PLCB2 and actin α cardiac muscle 1, may be associated with MDR in breast cancer. Subsequently, RT‑qPCR confirmed that the expression of these 9 hub genes was higher in MCF‑7/MDR cells compared with MCF‑7 cells, consistent with the RNA‑sequencing analysis. Additionally, a Cell Counting Kit‑8 assay demonstrated that specific inhibitors of NOS3 and BDNF/neurotrophic receptor tyrosine kinase, type 2 signaling reduced the IC50 of MCF‑7/MDR cells in response to various anticancer drugs, including adriamycin, cisplatin and 5‑fluorouracil. The results of the present study provide novel insights into the mechanism underlying MDR in MCF‑7 cells and may identify novel targets for the treatment of breast cancer.

Introduction

Globally, breast cancer is the most commonly occurring type of cancer in women. Currently, despite substantial advances in treatment, multidrug resistance (MDR) remains a major clinical obstacle to effective treatment and results in a poor prognosis for these patients. MDR is a phenomenon that occurs when cancer cells exposed to anticancer drugs develop cross-resistance to a range of structurally and functionally dissimilar agents.

Previous studies have demonstrated that numerous mechanisms are involved in the regulation of MDR. The most recognized genes associated with MDR are the ATP-binding cassette (ABC) transporter family. ABC transporters are members of a large protein family that are involved in the import or export of an extensive spectrum of substrates, and increasing evidence has confirmed the role of ABC proteins, such as ABCB1, ABCC1 and ABCG2, in an MDR breast cancer cell phenotype (13). Altered drug metabolism is also a major mechanism that contributes to MDR. Glutathione S-transferases (GSTs) consist of a family of phase II metabolic isozymes that facilitate the addition of reduced glutathione to xenobiotic substrates for detoxification, and overexpression of GSTs has been implicated in breast cancer MDR (4). In addition, defects in apoptotic machinery are reported to lead to abnormal chemoresistance, abnormal expression of the Bcl-2 family has been implicated in breast cancer drug resistance and various anticancer drugs, such as imatinib, gefitinib, and bortezomib, are regarded as Bcl-2-like 11-targeting therapeutic agents (5,6). Furthermore, caspase-3, a member of the caspase family, is activated by various chemotherapeutic agents, including doxorubicin and etoposide (7,8), and has an important role in apoptotic pathways through its cleavage of cellular proteins. In addition, tumor suppressor p53 and Raf-1 proto-oncogene have also been reported to influence the response of breast cancer to doxorubicin treatment (9,10). Homeostasis disruption also influences chemoresistance in breast cancer (11), and interleukin-6, estrogen and nomegestrol acetate are reported to affect MDR in breast cancer (1214).

miRNAs are a novel class of small, noncoding RNAs that regulate the expression of various target genes through RNA silencing and post-transcriptional gene regulation to regulate the activity of cells. Certain miRNAs have been reported to be associated with drug resistance in breast cancer; for example, miR-326 affected the chemoresistance of breast cancer through modulation of multidrug resistance-associated protein 1 (15), miR-221/222 inhibited tamoxifen resistance by targeting p27 (16), miR-125b suppressed Bcl-2 antagonist killer 1 expression and inhibited resistance in response to paclitaxel (17), and miR-34a was associated with docetaxel resistance in breast cancer (18). Increasing evidence has indicated that miRNAs have a key regulatory role in MDR through modulation of various mechanisms, thereby providing insights for the development of more effective individualized therapies for breast cancer treatment.

Numerous signaling pathways are also considered to be determinants of MDR in breast cancer, including phosphatidylinositol-3-kinase/Akt/mechanistic target of rapamycin kinase, Janus kinase/signal transducer and activator of transcription, AMP-activated protein kinase and epithelial-mesenchymal transition (EMT) (1923). Although numerous genes and signaling pathways are reported to be associated with MDR in cancer, the exact mechanism of MDR remains unclear. RNA-sequencing (RNA-seq) is a recently developed method for transcriptome profiling that employs next-generation sequencing technologies and measures transcript levels with increased precision compared with other approaches (24). Recently, RNA-seq has been employed extensively to investigate mechanisms of drug resistance in cancer; differentially expressed genes screened by RNA-seq provide novel insight into the complex mechanisms of resistance to anticancer drugs (25,26).

To investigate the mechanism of MDR in breast cancer cells in vitro, drug resistant cell lines have been isolated by exposing cancer cell lines to increasing concentrations of various chemotherapeutic agents. MCF-7, a human breast carcinoma cell line that has been employed in studies longer than any other breast cancer cell model system, has been widely employed in the investigation of apoptosis, MDR and a malignant phenotype of breast cancer. MCF-7/MDR breast cancer cells have been reported to exhibit resistance to several chemotherapeutic agents for cancer, including doxorubicin, paclitaxel, salvianolic acid A, cisplatin, etoposide and melphalan (2729). In the current study, RNA-seq was performed to analyze the differential expression of genes between MCF-7 and MCF-7/MDR human breast cancer cells to determine the underlying molecular mechanisms of chemoresistance in breast cancer.

Materials and methods

Cell culture and reagents

The MCF-7 human breast cancer cell line was obtained from the Cell Bank of Type Culture Collection of the Chinese Academy of Sciences (Shanghai, China). The multidrug-resistant human breast cancer cell MCF-7/MDR was purchased from the Cell Bank of Xiangya Medical College, Central South University (Changsha, China). Cells were cultured in Dulbecco's modified Eagle's medium (DMEM; Gibco; Thermo Fisher Scientific, Inc., Waltham, MA, USA) supplemented with 10% (v/v) fetal bovine serum (FBS; Thermo Fisher Scientific, Inc.), 100 U/ml penicillin (Gibco; Thermo Fisher Scientific, Inc.), 100 U/ml streptomycin (Gibco; Thermo Fisher Scientific, Inc.) and 10 mmol/l HEPES at 37°C in a humidified atmosphere containing 5% CO2. Adriamycin (ADM), 5-fluorouracil (5-FU), cisplatin (DDP) and L-N5-(1-Iminoethyl)-ornithine hydrochloride (LNIO) were purchased from Sigma-Aldrich (Merck KGaA, Darmstadt, Germany). ANA-12 was purchased from MedChemExpress (Monmouth Junction, NJ, USA).

RNA-seq

Total RNA was isolated from MCF-7 and MCF-7/MDR cells using TRIzol reagent (Invitrogen; Thermo Fisher Scientific, Inc.), according to the manufacturer's protocol. First-strand reverse transcription (RT) primer: biotin, 5′-CAAGCAGAAGACGGCATACGAGTVN-3′ was conducted using a SuperScript III First-Strand Synthesis system (Thermo Fisher Scientific, Inc.) (30) was used to synthesize the first-strand cDNA according to the manufacturer's protocols, followed by purification of cDNA with a NucleoSpin gel and polymerase chain reaction (PCR) Clean-up kit (Macherey-Nagel GmbH & Co. KG, Düren, Germany) to remove free RT primer. Dynabeads® MyOne Streptavidin C1 (cat. no. 650.01; Thermo Fisher Scientific, Inc.) were used for further purification. The second-strand cDNA was synthesized using dNTP mix and Taq DNA polymerase with ThermoPol reaction Buffer (cat. no. M0237L; New England BioLabs, Inc., Ipswich, MA, USA) following the program: 25°C for 60 min, 68°C for 30 sec, and 75°C for 5 min. Subsequently, the second-strand cDNA was amplified by PCR using the following program: 10 min at 94°C for initial denaturation, 35 cycles of 30 sec at 94°C for denaturation, 30 sec at 58°C for annealing, and 30 sec at 72°C for elongation. Following purification, the pooled libraries were loaded in a lane of an 8-lane flow cell and sequenced with the HumanHT-12 v4 Expression BeadChip arrays (Illumina, Inc., Sand Diego, CA, USA) on a HiSeq 2500 Illumina sequencer (Illumina, Inc.). RNA-Seq libraries were generated and 12 libraries were pooled for multiplex (30,31).

Sequencing data analysis

The initial sequence reads were generated by the Illumina Genome Analyzer (Illumina, Inc.). The expression values were calculated using RSEM (32) for each gene (Ensembl, Homo.sapiens.GRCh38.87.gtf) in individual samples. A total of 1 million reads were randomly selected for quality control with Bowtie 2 (33) mapping to Genome Reference Consortium Human Build 38/hg38 (34). Differential expression was analyzed between different subgroups using Bioconductor edgeR (version 3.12.0) (35). A false discovery rate of 0.05 was applied to the resulting P-values to correct for multiple hypothesis testing. T-tests were employed to screen out differentially expressed genes between MCF-7/MDR and MCF-7 cells, with a threshold of P<0.05 and fold change >2.

Gene ontology (GO) and Kyoto Encyclopedia of Genes and Genomes (KEGG) pathway mapping analysis

The Database for Annotation, Visualization and Integrated Discovery (DAVID) database (36) was used to analyze the differentially expressed genes between MCF-7/MDR and MCF-7 cells. The potential targets of differentially expressed genes were analyzed by the GO program and enriched pathways were analyzed by the KEGG program. The GO analysis included biological process and cellular component terms, and P<0.01 was regarded as statistically significant. In the KEGG pathway enrichment analysis, enriched pathways were identified according to P<0.05.

RT-quantitative PCR (RT-qPCR)

Total RNA was isolated from 5×10⁶ cells using TRIzol reagent, according to the manufacturer's protocol. Total RNA concentration and purity were analyzed in duplicate samples using a NanoDrop 2000 spectrophotometer (Thermo Fisher Scientific, Inc.). cDNA was synthesized from the RNA using the TransScriptR Reverse Transcriptase kit (Beijing TransGen Biotech Co., Ltd., Beijing, China). The reaction program constituted: 65°C for 5 sec, 2 min on ice, 25°C for 5 min, 42°C for 30 min, and 85°C for 5 sec. qPCR assays were performed to evaluate gene expression profiles using an ABI PRISM 7300 Sequence Detection system. qPCR was performed with the TransStart® Top Green qPCR SuperMix kit with SYBR® Green I from Beijing Transgen Biotech Co., Ltd. with specified primers. The reaction program consisted of 95°C for 3 min followed by 40 cycles of 95°C for 30 sec, 55°C for 20 sec and 72°C for 15 sec. GAPDH served as an internal control and the relative mRNA levels were calculated by the 2−ΔΔCq method (37). Primers were designed and synthesized by Sangon Biotech Co., Ltd., (Shanghai, China), as listed in Table I.

Table I.

Primers for reverse transcription-quantitative polymerase chain reaction.

Table I.

Primers for reverse transcription-quantitative polymerase chain reaction.

Primer sequence (5′-3′)

GeneForwardReverse
BDNF CCAAGGCAGGTTCAAGAGG TCCAGCAGAAAGAGAAGAGGA
GAPDH ACCCACTCCTCCACCTTTG CTCTTGTGCTCTTGCTGGG
PLCB2 AAGGTGAAGGCCTATCTGAGCCAA CTTGGCAAACTTCCCAAAGCGAGT
PLCB4 GCACAGCACACAAAGGAATGGTCA CGCATTTCCTTGCTTTCCCTGTCA
ACTC1 GCCCTGGATTTTGAGAATGA ATGCCAGCAGATTCCATACC
NOS3 GTGGCTGGTACATGAGCACT GTGGTCCACGATGGTGACTT
CCND1 GCTGCGAAGTGGAAACCATC CCTCCTTCTGCACACATTTGAA
NPY TGCTAGGTAACAAGCGACTG CTGCATGCATTGGTAGGATG
NOTCH3 TCTCAGACTGGTCCGAATCCAC CCAAGATCTAAGAACTGACGAGCG
PAX6 CGAGACTGGCTCCATCAGAC CACTCCCGCTTATACTGGGC
TrkB TGGTGCATTCCATTCACTGT CGTGGTACTCCGTGTGATTG

[i] BDNF, brained-derived neurotrophic factor; PLCB2, phospholipase C β2; PLCB4, phospholipase C β4; ACTC1, actin alpha cardiac muscle 1; NOS3, nitric oxide synthase 3; CCND1, cyclin D1; NPY, neuropeptide Y; PAX6, paired box 6; TrkB, neurotrophic receptor tyrosine kinase, type 2.

Western blot analysis

A total of 2×10⁵ MCF-7/MDR cells/well were plated in 6-well culture plates to determine the optimal concentration of LNIO in subsequent experiments, cells were treated with 0, 5, 10, 20, 40 and 80 µM LNIO for 48 h at 37°C and western blotting was performed. Western blotting was also performed to analyze the difference between the protein expression of NOS3 in MCF-7 and MCF-7/MDR cells. Total protein was extracted from MCF-7 and MCF-7/MDR cells with 200 µl radioimmunoprecipitation assay lysis buffer (Beyotime Institute of Biotechnology, Haimen, China) containing 1 mM phenylmethylsulfonyl fluoride (Sigma-Aldrich; Merck KGaA), followed by centrifugation at 13,000 × g for 20 min at 4°C. Denatured protein (50 µg) was quantified via a Bicinchoninic Acid protein assay kit (Beyotime Institute of Biotechnology) was loaded onto 12% SDS polyacrylamide gels. Following electrophoresis, the proteins on the gel were transferred onto nitrocellulose membranes (EMD Millipore, Billerica, MA, USA). The membranes were blocked with 5% non-fat milk at 37°C for 1 h and incubated overnight at 4°C with the following primary antibodies: Monoclonal mouse β-actin antibody (1:1,000; cat. no. sc-130300; Santa Cruz Biotechnology, Inc., Dallas, TX, USA) and polyclonal rabbit NOS3 antibody (1:500; cat. no. wl01789; Wanleibo Co., Ltd., Shanghai, China). The membranes were subsequently incubated with anti-mouse IgG (1:2,000; cat. no. 7076; Cell Signaling Technology, Inc., Danvers, MA, USA) and anti-rabbit IgG (1:2,000; cat. no. 7074; Cell Signaling Technology, Inc.) horseradish peroxidase-conjugated secondary antibodies at room temperature for 1 h. Finally, the immunoreactive bands of NOS3 and GAPDH were visualized using a BeyoECL Star kit (Beyotime Institute of Biotechnology). Semi-quantitative analysis was conducted using Quantity-One software version 4.1 (Bio-Rad Laboratories, Inc., Hercules, CA, USA) to measure densitometric values for each band.

In vitro drug sensitivity assay

In vitro drug cytotoxicity was measured by a Cell Counting Kit-8 (CCK-8; Dojindo Molecular Technologies, Inc., Kumamoto, Japan) assay. MCF-7/MDR cells were seeded into 96-well plates (3,000 cells/well) and treated for 48 h at 37°C in 100 µl DMEM medium containing 10% FBS and various concentrationsof ADM, DDP and 5-FU (ADM: 0, 5, 10, 20, 40 and 80 µM; DDP and 5-FU: 0, 0.5, 1, 2, 4 and 8 µg/ml) with or without pretreatment with 10 µM LNIO or 25 µM ANA-12 for 24 h at 37°C. The cells incubated without drugs were set at 100% survival and were used to calculate the concentration of each cytostatic drug that was lethal to 50% of the cells (IC50). CCK-8 reagent was subsequently added and the cells were incubated at 37°C for 1 h. The optical density (OD) of each well at 450 nm was recorded on a Varioskan Flash microplate reader (Thermo Fisher Scientific, Inc.). The cell viability (% of control) was expressed as the percentage of (ODtest-ODblank)/(ODcontrol-ODblank).

Statistical analysis

All experiments were performed in triplicate and data are presented as the mean ± standard deviation. Statistical analysis was performed with SPSS 19.0 software (SPSS, Inc., Chicago, IL, USA). Statistical significance was determined by a Student's t-test and one-way analysis of variance, followed by a Dunnett's test. P<0.05 was considered to indicate a statistically significant difference.

Results

Identification of differentially expressed genes between MCF-7 and MCF-7/MDR cells

edgeR was used to analyze the gene expression profiles and identify the differentially expressed genes between MCF-7/MDR and MCF-7 cells with the described criteria (38). A total of 56,233 genes were detected and 2,085 genes exhibited differential expression in MCF-7 compared with MCF-7/MDR cells. A fold change >2 and P<0.05 were required for differences to be considered as statistically significant. A total of 100 top differentially expressed genes, including 50 upregulated genes and 50 downregulated genes between MCF-7/MDR cells and MCF-7 cells were observed (Fig. 1).

GO term enrichment analysis

Using the DAVID database, functional analysis of the differentially expressed genes was performed. In the GO analysis, biological process and cellular component terms were included. GO analysis of biological processes demonstrated that differentially expressed genes were enriched in ‘neurogenesis’ (60 genes), ‘neuron differentiation’ (53 genes) and ‘nervous system development’ (84 genes) biological process terms, with others enriched in ‘locomotion’ (57 genes), ‘cell motility’ (49 genes), ‘localization of cell’ (49 genes) and ‘movement of cell or subcellular component’ (67 genes). In addition, differentially expressed genes were also enriched in ‘cell-cell signaling’ (54 genes) and ‘regulation of extent of cell growth’ (10 genes) biological process terms, among others (Fig. 2 and Table II). Furthermore, GO analysis of cellular components demonstrated that the differentially expressed genes were primarily associated with ‘plasma membrane region’ (42 genes), ‘proteinaceous extracellular matrix’ (22 genes), ‘extracellular matrix’ (27 genes), ‘synapse’ (35 genes), ‘synapse part’ (30 genes) and ‘apical plasma membrane’ (18 genes; Fig. 3 and Table III).

Table II.

GO biological process analysis of differentially expressed genes.

Table II.

GO biological process analysis of differentially expressed genes.

TermCountGenesFDR
GO:0007399~nervous system development84DLC1, CTHRC1, HMX2, TUBB2B, MYO7A, USH1G, UCHL1, JAG2, PAX6, ANKRD1, FGF12, RTN1, ARHGAP4, PCDH1, GSTM3, BDNF, SPINT2, PAX8, SEMA3E, SNPH, SEMA3D, POU4F1, NRG1, INA, KIF17, CLMN, EFNB1, EFNB2, DLL3, SIX3, GPER1, HMGA2, PCLO, HOXD9, EPB41L3, PRKCQ, ADM, SIX1, FOXG1, MYRF, NRGN, EXT1, GAP43, NEURL1, DPF3, FGFR1, WNT5B, NDN, TH, BEX1, MYEF2, OXTR, CLDN11, FKBP1B, MDK, ITM2C, CDH4, EPHB1, ITM2A, ALCAM, BCL11A, GBX2, APBA2, NKX2.1, NEFH, ADRA2C, FN1, FZD8, TRNP1, PTPRZ1, GABRA5, NTNG1, AXL, NTN1, NKX6.1, NOTCH3, SALL2, HOXB2, NPY, PLK2, H2AFY2, GFRA1, SCN8A, APBB10.0000335
GO:0048699~generation of neurons58CTHRC1, TUBB2B, MYO7A, USH1G, UCHL1, JAG2, PAX6, ANKRD1, RTN1, ARHGAP4, BDNF, SNPH, SEMA3E, SEMA3D, POU4F1, NRG1, CLMN, EFNB1, EFNB2, SIX3, DLL3, GPER1, HMGA2, HOXD9, EPB41L3, PRKCQ, ADM, SIX1, EXT1, GAP43, NEURL1, FGFR1, WNT5B, NDN, TH, MYEF2, FKBP1B, ITM2C, CDH4, EPHB1, ALCAM, BCL11A, GBX2, NKX2-1, NEFH, ADRA2C, FN1, FZD8, PTPRZ1, GABRA5, AXL, NTNG1, NTN1, NKX6-1, NOTCH3, NPY, PLK2, APBB10.0004872
GO:0022008~neurogenesis60CTHRC1, TUBB2B, MYO7A, USH1G, UCHL1, JAG2, PAX6, ANKRD1, RTN1, ARHGAP4, BDNF, SNPH, SEMA3E, SEMA3D, POU4F1, NRG1, CLMN, KIF17, EFNB1, EFNB2, DLL3, SIX3, GPER1, HMGA2, HOXD9, EPB41L3, PRKCQ, ADM, SIX1, MYRF, EXT1, GAP43, NEURL1, FGFR1, WNT5B, NDN, TH, MYEF2, FKBP1B, ITM2C, CDH4, EPHB1, ALCAM, BCL11A, GBX2, NKX2-1, NEFH, ADRA2C, FN1, FZD8, PTPRZ1, GABRA5, AXL, NTNG1, NTN1, NKX6-1, NOTCH3, NPY, PLK2, APBB10.0007804
GO:0007409~axonogenesis27NDN, UCHL1, PAX6, CDH4, EPHB1, ARHGAP4, ALCAM, BDNF, BCL11A, SEMA3E, GBX2, SEMA3D, NEFH, NKX2-1, POU4F1, NRG1, FN1, PTPRZ1, EFNB1, EFNB2, NTNG1, NTN1, NKX6-1, PRKCQ, EXT1, APBB1, GAP430.0011163
GO:0030182~neuron differentiation53CTHRC1, MYO7A, USH1G, UCHL1, PAX6, JAG2, ANKRD1, RTN1, ARHGAP4, BDNF, SNPH, SEMA3E, SEMA3D, POU4F1, NRG1, CLMN, EFNB1, EFNB2, SIX3, HOXD9, PRKCQ, EPB41L3, ADM, SIX1, EXT1, GAP43, NEURL1, FGFR1, WNT5B, NDN, TH, MYEF2, ITM2C, CDH4, FKBP1B, EPHB1, ALCAM, BCL11A, GBX2, NKX2-1, NEFH, ADRA2C, FN1, FZD8, PTPRZ1, GABRA5, NTNG1, NTN1, NKX6-1, NOTCH3, NPY, PLK2, APBB10.0013166
GO:0061564~axon development28NDN, UCHL1, PAX6, FKBP1B, CDH4, EPHB1, ARHGAP4, ALCAM, BDNF, BCL11A, SEMA3E, GBX2, SEMA3D, NEFH, NKX2-1, POU4F1, NRG1, FN1, PTPRZ1, EFNB1, EFNB2, NTNG1, NTN1, NKX6-1, PRKCQ, EXT1, APBB1, GAP430.0013888
GO:0046903~secretion development49TACR2, ANKRD1, KISS1, PAX8, SNPH, CHRNA7, NOS2, NRG1, PTPRN2, ACTN1, SERPING1, GPER1, CD40, PCDH7, HMGA2, PTPRN, PCLO, INHBB, CCND1, ADM, STXBP6, RAB15, NEURL1, XDH, FGFR1, IL1R2, RAB3B, NKD2, WASH1, HLA-DRB1, LMF1, OXTR, FKBP1B, AHSG, C1QTNF5, HLA-DRB5, ADRA2C, OLFM2, FN1, LPL, AXL, IGF2, FOXP3, NKX6-1, ABCB4, FBLN5, APBB1, SYTL1, SLC17A90.0016024
GO:0048468~cell development73CTHRC1, MAEA, MYO7A, USH1G, UCHL1, PAX6, ANKRD1, YBX2, ARHGAP4, GSTM3, BDNF, FRMD6, SPINT2, PAX8, SEMA3E, SEMA3D, POU4F1, NRG1, RAMP2, CLMN, EFNB1, EFNB2, DLL3, SIX3, SIP A1L3, ACTN1, GPER1, HMGA2, FLNC, HOXD9, INHBB, EPB41L3, PRKCQ, REC8, ADM, SIX1, EPB41L5, MYRF, RYR1, EXT1, LRRK1, GAP43, NEURL1, FGFR1, WNT5B, NDN, TH, FHL2, FKBP1B, ITM2C, CDH4, EPHB1, ALCAM, BCL11A, GBX2, NKX3.2, NKX2.1, NEFH, ADRA2C, FN1, ACTC1, PTPRZ1, GABRA5, NTNG1, AXL, NTN1, NKX6.1, NOTCH3, NPY, PLK2, KLF2, APBB1, RFLNB0.0021369
GO:0051241~negative regulation of multicellular organismal process46XDH, IL1R2, FGFR1, HLA-DRB1, TACR2, PAX6, OXTR, FKBP1B, ITM2C, AHSG, ARHGAP4, BCL11A, PAX8, SEMA3E, NKX3-2, SEMA3D, HLA-DRB5, NKX2-1, CHRNA7, NOS3, ADRA2C, ADAMTS12, NRG1, ARHGDIB, FN1, F12, DLL3, AXL, SIX3, UBE2L6, SERPING1, FOXP3, HMGA2, NTN1, NKX6-1, NOTCH3, INHBB, ADRB2, TNNT1, PLK2, ADM, SIX1, SERPINB2, KLF2, TMEM176B, RFLNB0.0026439
GO:0006928~movement of cell or subcellular component67DLC1, CTHRC1, TUBB2B, MLPH, TNNC1, MYO7A, UCHL1, JAG2, PAX6, FGF12, AMOTL1, MMP1, ARHGAP4, BDNF, FRMD6, SPINT2, SEMA3E, SEMA3D, NOS3, CHRNA7, POU4F1, NRG1, ARC, KIF17, PDPN, EFNB1, ARHGEF5, EFNB2, SIX3, ACTN1, GPER1, SIRPA, PRKCQ, TNNT1, SIX1, EPB41L5, EXT1, CTSH, GAP43, NEURL1, FGFR1, WNT5B, APC2, WASH1, NDN, ABI3, PLVAP, MDK, CDH4, EPHB1, ALCAM, IFT46, GBX2, NKX2-1, NEFH, ADAMTS12, FN1, ARHGDIB, ACTC1, FLT4, AXL, NTN1, NKX6-1, LAMA1, NPY, PTP4A3, HOXB90.0056175
GO:0000904~cell morphogenesis involved in differentiation37NDN, MYO7A, UCHL1, PAX6, CDH4, EPHB1, ARHGAP4, ALCAM, BDNF, FRMD6, SPINT2, BCL11A, PAX8, SEMA3E, GBX2, SEMA3D, NKX2-1, NEFH, POU4F1, NRG1, FN1, PTPRZ1, EFNB1, EFNB2, NTNG1, AXL, SIPA1L3, ACTN1, HMGA2, NTN1, NKX6-1, PRKCQ, EPB41L5, EXT1, APBB1, GAP43, RFLNB0.0059248
GO:0048666~neuron development43FGFR1, CTHRC1, NDN, MYO7A, USH1G, UCHL1, TH, PAX6, ANKRD1, FKBP1B, ITM2C, CDH4, EPHB1, ARHGAP4, ALCAM, BDNF, BCL11A, SEMA3E, GBX2, SEMA3D, NKX2-1, NEFH, POU4F1, NRG1, FN1, PTPRZ1, CLMN, EFNB1, GABRA5, EFNB2, NTNG1, NTN1, NKX6-1, HOXD9, EPB41L3, PRKCQ, NPY, PLK2, ADM, EXT1, APBB1, GAP43, NEURL10.0093174
GO:0032940~secretion by cell43IL1R2, FGFR1, RAB3B, NKD2, HLA-DRB1, WASH1, TACR2, LMF1, OXTR, ANKRD1, FKBP1B, AHSG, KISS1, C1QTNF5, PAX8, SNPH, HLA-DRB5, CHRNA7, ADRA2C, NOS2, OLFM2, FN1, LPL, PTPRN2, AXL, ACTN1, SERPING1, IGF2, PCDH7, CD40, GPER1, PTPRN, FOXP3, HMGA2, PCLO, NKX6-1, INHBB, ADM, STXBP6, RAB15, SYTL1, APBB1, SLC17A90.0094679
GO:0048667~cell morphogenesis involved in neuron differentiation28NDN, MYO7A, UCHL1, PAX6, CDH4, EPHB1, ARHGAP4, ALCAM, BDNF, BCL11A, SEMA3E, GBX2, SEMA3D, NEFH, NKX2-1, POU4F1, NRG1, FN1, PTPRZ1, EFNB1, EFNB2, NTNG1, NTN1, NKX6-1, PRKCQ, EXT1, APBB1, GAP430.0107608
GO:0031175~neuron projection development37FGFR1, NDN, UCHL1, PAX6, ANKRD1, FKBP1B, ITM2C, CDH4, EPHB1, ARHGAP4, ALCAM, BDNF, BCL11A, SEMA3E, GBX2, SEMA3D, NEFH, NKX2-1, POU4F1, NRG1, FN1, PTPRZ1, CLMN, EFNB1, EFNB2, NTNG1, NTN1, NKX6-1, EPB41L3, PRKCQ, NPY, PLK2, ADM, EXT1, APBB1, GAP43, NEURL10.0355076
GO:0040011~locomotion57DLC1, CTHRC1, TUBB2B, JAG2, PAX6, AMOTL1, MMP1, ARHGAP4, BDNF, SPINT2, CCR10, SEMA3E, SEMA3D, CHRNA7, POU4F1, NOS3, NRG1, FOSL1, ARC, PDPN, EFNB1, ARHGEF5, EFNB2, SIX3, GPER1, SIRPA, PRKCQ, SIX1, EPB41L5, EXT1, CTSH, GAP43, NEURL1, FGFR1, WNT5B, WASH1, NDN, APC2, ABI3, PLVAP, MDK, CDH4, EPHB1, ALCAM, DOCK2, GBX2, NKX2-1, ADAMTS12, ARHGDIB, FN1, FLT4, AXL, NTN1, NKX6-1, LAMA1, PTP4A3, HOXB90.0414058
GO:0048812~neuron projection morphogenesis28NDN, UCHL1, PAX6, CDH4, EPHB1, ARHGAP4, ALCAM, BDNF, BCL11A, SEMA3E, GBX2, SEMA3D, NEFH, NKX2-1, POU4F1, NRG1, FN1, PTPRZ1, EFNB1, EFNB2, NTNG1, NTN1, NKX6-1, EPB41L3, PRKCQ, EXT1, APBB1, GAP430.0077004
GO:0009887~organ morphogenesis40DLC1, FGFR1, FGD1, CTHRC1, HMX2, TNNC1, USH1G, MYO7A, TH, JAG2, PAX6, FHL2, ANKRD1, EPHB1, GPC3, PAX8, GBX2, NKX3-2, NKX2-1, POU4F1, NRG1, ACTC1, EFNB2, SIX3, TLE1, HMGA2, NTN1, ZNF22, NKX6-1, HOXD9, HOXB4, HOXD8, HOXB2, ADM, SIX1, RYR1, MFAP2, CTSH, TMEM176B, RFLNB0.0264522
GO:0007267~cell-cell signaling54CTHRC1, TACR2, FGF12, SYNGR1, AMOTL1, KISS1, RSPO4, BDNF, PCDH1, GPC3, PAX8, SNPH, CHRNA7, NOS2, PLCB2, ARC, PTPRN2, EFNB1, EFNB2, SIX3, TLE1, GPER1, HMGA2, PTPRN, PCLO, INHBB, CCND1, ADRB2, ADM, NRGN, LRRK1, NEURL1, FGFR1, RAB3B, NKD2, WNT5B, HLA-DRB1, APC2, TH, OXTR, FKBP1B, AMPH, APBA2, HLA-DRB5, ADRA2C, NOVA1, FZD8, GABRA5, NKX6-1, DKK3, NPY, PLK2, HOXB9, SYTL10.0264522
GO:0051674~localization of cell49DLC1, CTHRC1, TUBB2B, PAX6, JAG2, AMOTL1, MMP1, ARHGAP4, SPINT2, SEMA3E, SEMA3D, CHRNA7, POU4F1, NOS3, NRG1, ARC, PDPN, EFNB1, EFNB2, ARHGEF5, SIX3, GPER1, SIRPA, PRKCQ, EPB41L5, SIX1, CTSH, NEURL1, FGFR1, WNT5B, WASH1, NDN, APC2, ABI3, PLVAP, MDK, EPHB1, GBX2, NKX2-1, ADAMTS12, ARHGDIB, FN1, FLT4, AXL, NTN1, NKX6-1, LAMA1, PTP4A3, HOXB90.0294439
GO:0048870~cell motility49DLC1, CTHRC1, TUBB2B, PAX6, JAG2, AMOTL1, MMP1, ARHGAP4, SPINT2, SEMA3E, SEMA3D, CHRNA7, POU4F1, NOS3, NRG1, ARC, PDPN, EFNB1, EFNB2, ARHGEF5, SIX3, GPER1, SIRPA, PRKCQ, EPB41L5, SIX1, CTSH, NEURL1, FGFR1, WNT5B, WASH1, NDN, APC2, ABI3, PLVAP, MDK, EPHB1, GBX2, NKX2-1, ADAMTS12, ARHGDIB, FN1, FLT4, AXL, NTN1, NKX6-1, LAMA1, PTP4A3, HOXB90.0294439
GO:2000026~regulation of multicellular organismal development59CTHRC1, PAX6, ANKRD1, ARHGAP4, BDNF, GPC3, PAX8, SEMA3E, SEMA3D, POU4F1, CHRNA7, NOS3, NRG1, RAMP2, EFNB2, DLL3, SIX3, GPER1, CD40, HMGA2, CCND1, ADRB2, ADM, SIX1, EPB41L5, MYRF, CTSH, NEURL1, XDH, FGFR1, OXTR, FKBP1B, ITM2C, CDH4, EPHB1, AHSG, FAM213A, BCL11A, NKX3-2, NKX2-1, ADRA2C, ADAMTS12, FN1, ARHGDIB, TESC, PTPRZ1, IL1RL2, AXL, FOXP3, NTN1, NKX6-1, NOTCH3, LAMA1, PLK2, RASSF2, H2AFY2, APBB1, TMEM176B, RFLNB0.0335908
GO:0048598~embryonic morphogenesis27DLC1, FGFR1, CTHRC1, HMX2, USH1G, MYO7A, TH, PAX6, JAG2, GPC3, SPINT2, PAX8, GBX2, NKX3-2, FN1, SIX3, HMGA2, NTN1, DUSP5, HOXD9, HOXB4, HOXB2, ADM, SIX1, EPB41L5, MFAP2, EXT10.0349494
GO:0000902~cell morphogenesis46DLC1, FGD1, NDN, MYO7A, UCHL1, PAX6, CDH4, EPHB1, ALCAM, ARHGAP4, BDNF, FRMD6, IFT46, SPINT2, BCL11A, PAX8, SEMA3E, GBX2, SEMA3D, NKX2-1, NEFH, POU4F1, NRG1, FN1, CDC42EP5, COCH, PTPRZ1, PDPN, EFNB1, EFNB2, NTNG1, AXL, SIPA1L3, ACTN1, HMGA2, NTN1, NKX6-1, EPB41L3, PRKCQ, EPB41L5, KLF2, EXT1, APBB1, GAP43, RFLNB, NEURL10.0371107
GO:0045595~regulation of cell differentiation54CTHRC1, PAX6, DLK2, ANKRD1, ARHGAP4, BDNF, PAX8, SEMA3E, SEMA3D, POU4F1, NRG1, RAMP2, PRAME, EFNB2, SIX3, DLL3, GPER1, HMGA2, CCND1, ADM, SIX1, EPB41L5, NEURL1, XDH, FGFR1, WNT5B, APC2, FKBP1B, ITM2C, CDH4, FAM213A, BCL11A, NKX3-2, NKX2-1, ADRA2C, ADAMTS12, OLFM2, FN1, LPL, TESC, PTPRZ1, IL1RL2, AXL, FOXP3, NTN1, NKX6-1, NOTCH3, HOXB4, PLK2, RASSF2, H2AFY2, APBB1, RFLNB, TMEM176B0.0381061
GO:0009790~embryo development38DLC1, FGFR1, CTHRC1, HMX2, USH1G, MYO7A, TH, JAG2, PAX6, GPC3, SPINT2, PAX8, GBX2, NKX3-2, APBA2, NOS3, ETNK2, NRG1, FOSL1, FN1, EFNB1, DLL3, SIX3, HMGA2, NTN1, HOXD9, DUSP5, HOXB4, SALL2, HOXD8, HOXB2, ADM, SIX1, EPB41L5, MFAP2, HOXB9, KLF2, EXT10.0373992
GO:0032989~cellular component morphogenesis48DLC1, FGD1, NDN, MYO7A, UCHL1, PAX6, ANKRD1, CDH4, EPHB1, ALCAM, ARHGAP4, BDNF, FRMD6, IFT46, SPINT2, BCL11A, PAX8, SEMA3E, GBX2, SEMA3D, NKX2-1, NEFH, POU4F1, NRG1, FN1, CDC42EP5, COCH, ACTC1, PTPRZ1, PDPN, EFNB1, EFNB2, NTNG1, AXL, SIPA1L3, ACTN1, HMGA2, NTN1, NKX6-1, EPB41L3, PRKCQ, EPB41L5, KLF2, EXT1, APBB1, RFLNB, GAP43, NEURL10.0375119
GO:0009914~hormone transport18FGFR1, HLA-DRB1, TACR2, PTPRN2, GPER1, HMGA2, PTPRN, PCLO, FKBP1B, NKX6-1, INHBB, KISS1, SLC16A2, ADM, PAX8, HLA-DRB5, ADRA2C, NOS20.0415878
GO:0007411~axon guidance15EFNB1, EFNB2, PAX6, CDH4, NTN1, EPHB1, ALCAM, PRKCQ, BDNF, SEMA3E, GBX2, SEMA3D, NKX2-1, EXT1, GAP430.0410559
GO:0097485~neuron projection guidance15EFNB1, EFNB2, PAX6, CDH4, NTN1, EPHB1, ALCAM, PRKCQ, BDNF, SEMA3E, GBX2, SEMA3D, NKX2-1, EXT1, GAP430.0414269
GO:0061387~regulation of extent of cell growth10ARHGAP4, BDNF, BCL11A, SEMA3E, SEMA3D, NRG1, NTN1, CDH4, NKX6-1, FN10.0486247

[i] GO, gene ontology; FDR, false discovery rate.

Table III.

Gene Ontology cellular component analysis of differentially expressed genes.

Table III.

Gene Ontology cellular component analysis of differentially expressed genes.

TermCountGenesFDR
GO:0098590~plasma membrane region42DLC1, NKD2, APC2, CLDN6, MYO7A, OXTR, PLVAP, AMOTL1, AMN, GPR143, KISS1, C1QTNF5, SH2D5, SNPH, CHRNA7, NOS3, IQSEC3, SLC39A4, NRG1, FOSL1, OLFM2, GABRP, FN1, KCNMA1, GABRG3, TESC, ARC, KIF17, PDPN, GABRA5, SIPA1L3, ABCB1, AJAP1, GPER1, ABCB4, EPB41L3, ADRB2, EPB41L5, CLDN1, APBB1, GAP43, NEURL10.0117429
GO:0005578~proteinaceous extracellular matrix22COCH, CTHRC1, WNT5B, PTPRZ1, EFEMP2, CCDC80, EMILIN2, NTN1, MMP1, LAMA1, ADAMTS6, COL9A2, CILP2, GPC3, MMP23B, FBLN5, PI3, MFAP2, ADAMTS12, TFPI2, MFAP5, FN10.0147915
GO:0045202~synapse35RAB3B, MYO7A, TH, SYNGR1, AMPH, PLCB4, SH2D5, SNPH, NEFH, APBA2, CHRNA7, SV2A, IQSEC3, NRG1, FOSL1, OLFM2, SAMD4A, GABRP, NMNAT2, GABRG3, ARC, PTPRN2, EFNB1, GABRA5, ATP1A3, GPER1, PTPRN, PCLO, EPB41L3, NRGN, APBB1, SYTL1, ADD2, GAP43, NEURL10.0119474
GO:0044456~synapse part30RAB3B, TH, SYNGR1, AMPH, PLCB4, SH2D5, SNPH, APBA2, NEFH, CHRNA7, SV2A, IQSEC3, FOSL1, OLFM2, GABRP, ARC, GABRG3, PTPRN2, GABRA5, ATP1A3, GPER1, PTPRN, PCLO, EPB41L3, NRGN, APBB1, SYTL1, GAP43, ADD2, NEURL10.0119478
GO:0031012~extracellular matrix27CTHRC1, AEBP1, WNT5B, MMP1, AHSG, COL9A2, CILP2, GPC3, SBSN, ADAMTS12, TFPI2, FN1, COCH, LPL, PTPRZ1, EFEMP2, CCDC80, EMILIN2, NTN1, SOD3, LAMA1, ADAMTS6, MMP23B, FBLN5, PI3, MFAP2, MFAP50.0139638
GO:0016324~apical plasma membrane18KCNMA1, MYO7A, OXTR, SIPA1L3, ABCB1, AJAP1, GPR143, AMN, AMOTL1, ABCB4, KISS1, C1QTNF5, ADRB2, CLDN1, CHRNA7, NRG1, SLC39A4, FN10.0254454
KEGG pathway enrichment analysis

The enrichment of dysfunctional signaling pathways was screened by the KEGG pathway analysis, and the results demonstrated that the pathways that differentially expressed genes were enriched in included ‘pathways in cancer’ (16 genes), ‘calcium signaling pathway’ (12 genes), ‘cell adhesion molecules (CAMs)’ (11 genes), ‘tight junction’ (9 genes), ‘amoebiasis’ (9 genes), ‘Wnt signaling pathway’ (8 genes), ‘retrograde endocannabinoid signaling’ (7 genes), ‘type I diabetes mellitus’ (5 genes), ‘intestinal immune network for IgA production’ (5 genes), ‘asthma’ (4 genes), ‘viral myocarditis’ (5 genes), ‘allograft rejection’ (4 genes; Fig. 4 and Table IV).

Table IV.

Kyoto Encyclopedia of Genes and Genomes pathway enrichment analysis of differentially expressed genes.

Table IV.

Kyoto Encyclopedia of Genes and Genomes pathway enrichment analysis of differentially expressed genes.

TermCountP-valueGenesFDR
hsa04514: Cell adhesion molecules (CAMs)110.0010925ALCAM, HLA-DQB1, HLA-DRB1, CLDN6, ICAM2, CLDN1, NTNG1, HLA-DRB5, CLDN11, CD40, CDH40.0131104
hsa04020: Calcium signaling pathway120.0010925PTGER1, GNA15, ADRB2, PLCB4, TACR2, TNNC1, RYR1, OXTR, CHRNA7, NOS3, NOS2, PLCB20.0113229
hsa05146: Amoebiasis90.0010925IL1R2, LAMA1, GNA15, PLCB4, SERPINB2, ACTN1, NOS2, PLCB2, FN10.0088997
hsa04530: Tight junction90.0104316EPB41L3, PRKCQ, RAB3B, CLDN6, CLDN1, ACTN1, CLDN11, AMOTL1, PPP2R2C0.0312949
hsa04940: Type I diabetes mellitus50.0131689HLA-DQB1, HLA-DRB1, PTPRN2, HLA-DRB5, PTPRN0.0316055
hsa04672: Intestinal immune network for IgA production50.0192920HLA-DQB1, HLA-DRB1, CCR10, HLA-DRB5, CD400.0385841
hsa04723: Retrograde endocannabinoid signaling70.0192920GABRG3, GNGT2, PLCB4, GABRA5, GNG4, PLCB2, GABRP0.0402837
hsa05200: Pathways in cancer160.0192920LAMA1, FZD8, FGFR1, PTGER1, CCND1, GNGT2, PLCB4, WNT5B, APC2, PAX8, FGF12, NOS2, GNG4, PLCB2, MMP1, FN10.0384532
hsa05310: Asthma40.0274460HLA-DQB1, HLA-DRB1, HLA-DRB5, CD400.0365947
hsa04310: Wnt signaling pathway80.0321127FZD8, CCND1, WNT5B, NKD2, PLCB4, APC2, PLCB2, FOSL10.0385353
hsa05416: Viral myocarditis50.0321127HLA-DQB1, CCND1, HLA-DRB1, HLA-DRB5, CD400.0394291
hsa05330: Allograft rejection40.0321127HLA-DQB1, HLA-DRB1, HLA-DRB5, CD400.0470282
Protein-protein interaction network

STRING, a database that comprises established and predicted protein interactions, was employed in the present study to predict protein interactions among the differentially expressed genes. A total of 9 hub nodes were screened based on their association with other proteins. These hub genes included cyclin D1 (CCND1), nitric oxide synthase 3 (NOS3), NOTCH3, brain-derived neurotrophic factor (BDNF), paired box 6 (PAX6), neuropeptide Y (NPY), phospholipase C β (PLCB) 4, PLCB2 and actin α cardiac muscle 1 (ACTC1) (Table V). Among these genes, CCND1 exhibited the highest node degree of 22. A protein-protein interaction network was constructed as presented in Fig. 5. RT-qPCR was subsequently performed to verify the expression of these 9 genes in MCF-7 and MCF-7/MDR cells; the expression of all genes was higher in MCF-7/MDR cells compared with MCF-7 cells (Fig. 6), which was consistent with the RNA-seq data.

Table V.

Key hub genes in the protein-protein interaction network.

Table V.

Key hub genes in the protein-protein interaction network.

GeneDegree
CCND122
NOS319
NOTCH317
BDNF15
PAX614
NPY13
PLCB411
PLCB211
ACTC110

[i] CCND1, cyclin D1; NOS3, nitric oxide synthase 3; BDNF, brain-derived neurotrophic factor; PAX6, paired box 6; NPY, neuropeptide Y; PLCB, phospholipase C β; ACTC1, actin α cardiac muscle 1.

Inhibition of NOS3 and BDNF decreases chemoresistance properties of MCF-7/MDR cells

To verify the accuracy and practicality of RNA-seq in investigating the mechanism involved in breast cancer chemoresistance, specific inhibitors of NOS3 and BDNF were employed. As the expression of NOS3 was higher at mRNA and protein levels in MCF-7/MDR cells compared with MCF-7 cells (Figs. 6 and 7A), different concentrations of LNIO, which is a specific inhibitor of NOS3, was added to determine the optimal inhibitory concentration for subsequent drug sensitivity assays. The results of western blotting demonstrated that LNIO decreased the expression of NOS3 even at a low concentration (5 µM) and 10 µM was selected as the optimal concentration (Fig. 7B). LNIO (10 µM) was added to MCF-7/MDR cells prior to treatment with anticancer drugs and a CCK-8 assay was performed to measure cell viability. IC50 values were subsequently calculated in response to different anticancer drugs. The results demonstrated that 10 µM LNIO decreased the IC50 of ADM, DDP and 5-FU in MCF-7/MDR cells, as demonstrated in Table VI. Furthermore, 25 µM ANA-12, a specific inhibitor of BDNF/neurotrophic receptor tyrosine kinase, type 2 signaling, decreased the mRNA expression of BDNF and TrkB (Fig. 8), and decreased the IC50 of ADM and 5-FU in MCF-7/MDR cells (Table VII).

Table VI.

Inhibition of nitric oxide synthase 3 decreased the IC50 of MCF-7/MDR cells in response to various anticancer drugs.

Table VI.

Inhibition of nitric oxide synthase 3 decreased the IC50 of MCF-7/MDR cells in response to various anticancer drugs.

IC50 value

Anticancer drugMCF-7/MDRMCF-7/MDR+LNIOP-value
ADM, µM 44.24±10.37 26.86±2.050.0160001
DDP, µg/ml 4.63±1.45 4.01±1.620.0276806
5-FU, µg/ml 5.335±1.23 4.14±1.810.0443251

[i] MDR, multidrug resistance; LNIO, L-N5-(1-Iminoethyl)-ornithine hydrochloride; ADM, adriamycin; DDP, cisplatin; 5-FU, 5-fluorouracil.

Table VII.

Inhibition of brain-derived neurotrophic factor decreased the IC50 of MCF-7/MDR cells in response to various anticancer drugs.

Table VII.

Inhibition of brain-derived neurotrophic factor decreased the IC50 of MCF-7/MDR cells in response to various anticancer drugs.

IC50 value

Anticancer drugMCF-7/MDR MCF-7/MDR+ANA-12P-value
ADM, µM 43.98±1.52 16.80±2.070.0000521
DDP, µg/ml 6.49±0.17 6.78±0.190.1182792
5-FU, µg/ml 7.06±0.41 4.74±0.670.0007725

[i] MDR, multidrug resistance; ADM, adriamycin; DDP, cisplatin; 5-FU, 5-fluorouracil.

Discussion

MDR is a major obstacle in the treatment of breast cancer. While the mechanism of MDR is complex, it is particularly difficult to identify the key genes and signaling pathways involved in regulating MDR. Large-scale investigation of gene expression levels is required in order to screen and identify the important factors involved in this phenomenon. As RNA-seq is considered to be a promising technology for measuring mRNA expression and may be used to identify differentially expressed genes in a manner that is superior to certain existing array-based approaches (39), the present study applied RNA-seq technology to investigate the mechanisms involved in MDR in human breast cancer cells. While a total of 2085 differentially expressed genes were screened out, GO analysis was performed to analyze the differentially expressed genes in terms of their enrichment in biological process and cellular component terms. GO analysis revealed that MDR in breast cancer MCF-7 cells was associated with ‘neuron differentiation’ and ‘development of nervous system’ biological process terms, which was consistent with the results of a previous study that demonstrated the involvement of the central nervous system in patients with advanced breast cancer receiving effective drugs (40), though the mechanism involved remains unclear. In addition, MDR was also associated with ‘cell motility’, ‘locomotion’ and ‘movement of cell or subcellular component’ biological process terms. In various cancer types, such as lung, atypical teratoid and ovarian cancers, cell motility has been reported to be closely correlated with drug resistance (41,42). In the GO analysis of cellular component terms, ‘plasma membrane region’ and ‘extracellular matrix’ were among the terms that differentially expressed genes were demonstrated to be enriched in; previously, cell surface markers CD9 and CD44 were reported to be associated with chemoresistance (43,44) and, in small cell lung cancer, it was also reported that extracellular matrix (ECM) is an important regulator of drug resistance (45).

KEGG analysis was performed in the present study to determine the enrichment of signaling pathways associated with MDR in MCF-7 cells. The results revealed that 12 different pathways may be involved. A number of these identified pathways were consistent with previous reports, for example, CAM signaling was previously reported to mediate chemoresistance in renal cell carcinoma and pancreatic adenocarcinoma (46), the calcium signaling pathway has been reported to affect MDR in cancer chemotherapy (47) and the Wnt signaling has been implicated in the regulation of chemoresistance via various mechanisms, including long non-coding RNA (48) and the canonical Wnt/β-catenin signaling pathway (49). Furthermore, activation of Wnt signaling was important in the response to certain anticancer drugs, particularly 5-fluorouracil and platinum (50,51).

The results of GO biological process analysis of differentially expressed genes also demonstrated that cell mobility may be a key regulator of MDR, and mobility is the basis of tumor cell metastasis. Matrix metalloproteinases (MMPs), a family of enzymes that degrade ECM components, also mediated MDR in various cancers, including MMP-2, MMP-7 and MMP-9 enzymes (5254). Claudins (CLDNs), which are an important component of tight junctions, have also been reported to be factors involved in MDR (5558), as 3 of 27 CLDN family members were observed to be differentially expressed in MCF-7/MDR cells, including CLDN-1, CLDN-6 and CLDN-11. In our previous study, the results demonstrated that CLDN-6 had an important role in breast cancer (59), verifying that tight junctions, which was a term screened in the KEGG enrichment analysis of the present study, may be involved in the MDR of breast cancer.

Through protein-protein interaction network construction, a series of hub genes were demonstrated to be associated with MDR. In total, 9 hub genes were identified in the present study, including CCND1, NOS3, NOTCH3, BDNF, PAX6, NPY, PLCB4, PLCB2 and ACTC1. These genes were previously reported to be associated with drug resistance in various cancers. For example, CCND1, which has an established role in the cell cycle, was also reported to be associated with chemoresistance in various cancers, including testicular germ cell tumors and cell lymphoma (60). NOS3, also termed endothelial NOS, contributed to DDP resistance through various signaling pathways in human ovarian cancer cells (61). NOTCH3 has an important role in calcium signaling and its overexpression enhanced chemoresistance in response to carboplatin, gemcitabine and paclitaxel via the Notch signaling pathway (6264). Furthermore, a recent study demonstrated that NOTCH3 may be regarded as a predictor of distant relapse-free survival in estrogen receptor-positive breast cancers and its expression was associated with clinical chemoresistance in patients with breast cancer (65). BDNF was the gene with the largest difference in expression between MCF-7 and MCF-7/MDR cells when verified by RT-qPCR, and BDNF/TrkB signaling has been reported to be responsible for chemoresistance in neuroblastoma cells and head and neck squamous cell carcinoma (66,67). Additionally, PAX6 was reported to mediate the temozolomide sensitivity of glioblastoma stem cells (68), NPY signaling was activated in chemotherapy-treated neuroblastoma tumors, which indicated that NPY may be associated with chemoresistance in neuroblastoma (69), and Taxotere® (docetaxel) treatment influenced the expression of ACTC1 in breast cancer (70). Numerous genes involved in biological process, cellular component and signal transduction pathways may be involved in regulating MDR. As 9 genes were screened in the protein-protein interaction network, taking NOS3 as an example, NOS3 was demonstrated to be associated with ‘negative regulation of multicellular organismal process’, ‘movement of cell or subcellular component’, ‘locomotion’, ‘localization of cell’, ‘cell motility’, ‘regulation of multicellular organismal development’ and ‘embryo development’ terms in the GO biological process analysis. NOS3 has also been demonstrated to be involved in embryo development (71). In addition, other factors such as EMT, an important process, have also been associated with embryo development (72); it has been verified that EMT promoted chemoresistance in various cancers (73). In the GO cellular component analysis of the present study, NOS3 belonged to the ‘plasma membrane region’ term. Water-soluble drugs, including DDP, nucleoside analogues and antifolates, are only able to traverse the plasma membrane via membrane transporters or through hydrophilic channels within the membrane (74). Therefore, the plasma membrane region has an essential role in chemoresistance. In the KEGG pathway enrichment analysis of the present study, NOS3 was associated with the ‘calcium signaling pathway’ term, and it has been reported that the regulation of RhoA/calcium signaling may regulate chemoresistance in head and neck squamous cell carcinoma (75). Furthermore, the current study confirmed that LNIO, a specific inhibitor of NOS3, significantly decreased the resistance of MCF-7/MDR cells to various anticancer drugs, including ADM, 5-FU and DDP, which supported a role for NOS3 in chemoresistance. Additionally, a specific inhibitor of BDNF/TrkB signaling, ANA-12, was also employed to verify the role of BDNF in breast cancer chemoresistance; ANA-12 significantly decreased resistance to ADM and 5-FU, but not DDP, in MCF-7/MDR cells. Thus, we hypothesized that those hub genes of NOS3 and BDNF, may contribute to drug resistance through regulating biological processes and signaling pathways in breast cancer cells.

In conclusion, the results of the current study provide a comprehensive analysis of differentially expressed genes in MCF-7/MDR cells and the associated signaling pathways, which may be involved in the development of chemoresistance in breast cancer. As the hub genes screened, including NOS3 and BDNF, may provide insights into the mechanism of drug resistance, genome-wide mRNA profiling may be useful in identifying novel targets for the treatment of breast cancer that exhibits MDR.

Acknowledgements

The authors would like to thank the Key Laboratory of Natural Resources of Changbai Mountain & Functional Molecules, Ministry of Education, Yanbian University (Yanji, China).

Funding

The present study was supported by grants from the National Natural Science Foundation of China (grant no. 81172499) and the Science and Technology Development Plan of the Office of Science and Technology Project in Jilin Province (grant no. 20140414036GH).

Availability of data and materials

The datasets used and/or analyzed during the current study are available from the corresponding author on reasonable request.

Authors' contributions

CQ and MY conceived and designed the experiments. HL conducted RNA sequencing and analysis. HL and MY performed the experiments. MY produced the manuscript. YL and YR conducted data analysis.

Ethics approval and consent to participate

Not applicable.

Consent for publication

Not applicable.

Competing interests

The authors declare that they have no competing interests.

References

1 

Leonessa F and Clarke R: ATP binding cassette transporters and drug resistance in breast cancer. Endocr Relat Cancer. 10:43–73. 2003. View Article : Google Scholar : PubMed/NCBI

2 

Doyle LA, Yang W, Abruzzo LV, Krogmann T, Gao Y, Rishi AK and Ross DD: A multidrug resistance transporter from human MCF-7 breast cancer cells. Proc Natl Acad Sci USA. 95:pp. 15665–15670. 1998; View Article : Google Scholar : PubMed/NCBI

3 

Mechetner E, Kyshtoobayeva A, Zonis S, Kim H, Stroup R, Garcia R, Parker RJ and Fruehauf JP: Levels of multidrug resistance (MDR1) P-glycoprotein expression by human breast cancer correlate with in vitro resistance to taxol and doxorubicin. Clin Cancer Res. 4:389–398. 1998.PubMed/NCBI

4 

Batist G, Tulpule A, Sinha BK, Katki AG, Myers CE and Cowan KH: Overexpression of a novel anionic glutathione transferase in multidrug-resistant human breast cancer cells. J Biol Chem. 261:15544–15549. 1986.PubMed/NCBI

5 

Lima RT, Martins LM, Guimarães JE, Sambade C and Vasconcelos MH: Specific downregulation of bcl-2 and xIAP by RNAi enhances the effects of chemotherapeutic agents in MCF-7 human breast cancer cells. Cancer Gene Ther. 11:309–316. 2004. View Article : Google Scholar : PubMed/NCBI

6 

Wagener C, Bargou RC, Daniel PT, Bommert K, Mapara MY, Royer HD and Dörken B: Induction of the death-promoting gene bax-alpha sensitizes cultured breast-cancer cells to drug-induced apoptosis. Int J Cancer. 67:138–141. 1996. View Article : Google Scholar : PubMed/NCBI

7 

Devarajan E, Sahin AA, Chen JS, Krishnamurthy RR, Aggarwal N, Brun AM, Sapino A, Zhang F, Sharma D, Yang XH, et al: Down-regulation of caspase 3 in breast cancer: A possible mechanism for chemoresistance. Oncogene. 21:8843–8851. 2002. View Article : Google Scholar : PubMed/NCBI

8 

Yang XH, Sladek TL, Liu X, Butler BR, Froelich CJ and Thor AD: Reconstitution of caspase 3 sensitizes MCF-7 breast cancer cells to doxorubicin- and etoposide-induced apoptosis. Cancer Res. 61:348–354. 2001.PubMed/NCBI

9 

Geisler S, Lønning PE, Aas T, Johnsen H, Fluge O, Haugen DF, Lillehaug JR, Akslen LA and Børresen-Dale AL: Influence of TP53 gene alterations and c-erbB-2 expression on the response to treatment with doxorubicin in locally advanced breast cancer. Cancer Res. 61:2505–2512. 2001.PubMed/NCBI

10 

Davis JM, Navolanic PM, Weinstein-Oppenheimer CR, Steelman LS, Hu W, Konopleva M, Blagosklonny MV and McCubrey JA: Raf-1 and Bcl-2 induce distinct and common pathways that contribute to breast cancer drug resistance. Clin Cancer Res. 9:1161–1170. 2003.PubMed/NCBI

11 

Yu DD, Wu Y, Zhang XH, Lv MM, Chen WX, Chen X, Yang SJ, Shen H, Zhong SL, Tang JH and Zhao JH: Exosomes from adriamycin-resistant breast cancer cells transmit drug resistance partly by delivering miR-222. Tumour Biol. 37:3227–3235. 2016. View Article : Google Scholar : PubMed/NCBI

12 

Conze D, Weiss L, Regen PS, Bhushan A, Weaver D, Johnson P and Rincón M: Autocrine production of interleukin 6 causes multidrug resistance in breast cancer cells. Cancer Res. 61:8851–8858. 2001.PubMed/NCBI

13 

Teixeira C, Reed JC and Pratt MA: Estrogen promotes chemotherapeutic drug resistance by a mechanism involving Bcl-2 proto-oncogene expression in human breast cancer cells. Cancer Res. 55:3902–3907. 1995.PubMed/NCBI

14 

Li J, Xu LZ, He KL, Guo WJ, Zheng YH, Xia P and Chen Y: Reversal effects of nomegestrol acetate on multidrug resistance in adriamycin-resistant MCF7 breast cancer cell line. Breast Cancer Res. 3:253–263. 2001. View Article : Google Scholar : PubMed/NCBI

15 

Liang Z, Wu H, Xia J, Li Y, Zhang Y, Huang K, Wagar N, Yoon Y, Cho HT, Scala S and Shim H: Involvement of miR-326 in chemotherapy resistance of breast cancer through modulating expression of multidrug resistance-associated protein 1. Biochem Pharmacol. 79:817–824. 2010. View Article : Google Scholar : PubMed/NCBI

16 

Miller TE, Ghoshal K, Ramaswamy B, Roy S, Datta J, Shapiro CL, Jacob S and Majumder S: MicroRNA-221/222 confers tamoxifen resistance in breast cancer by targeting p27Kip1. J Biol Chem. 283:29897–29903. 2008. View Article : Google Scholar : PubMed/NCBI

17 

Zhou M, Liu Z, Zhao Y, Ding Y, Liu H, Xi Y, Xiong W, Li G, Lu J, Fodstad O, et al: MicroRNA-125b confers the resistance of breast cancer cells to paclitaxel through suppression of pro-apoptotic Bcl-2 antagonist killer 1 (Bak1) expression. J Biol Chem. 285:21496–21507. 2010. View Article : Google Scholar : PubMed/NCBI

18 

Kastl L, Brown I and Schofield AC: miRNA-34a is associated with docetaxel resistance in human breast cancer cells. Breast Cancer Res Treat. 131:445–454. 2012. View Article : Google Scholar : PubMed/NCBI

19 

Knuefermann C, Lu Y, Liu B, Jin W, Liang K, Wu L, Schmidt M, Mills GB, Mendelsohn J and Fan Z: HER2/PI-3K/Akt activation leads to a multidrug resistance in human breast adenocarcinoma cells. Oncogene. 22:3205–3212. 2003. View Article : Google Scholar : PubMed/NCBI

20 

deGraffenried LA, Friedrichs WE, Russell DH, Donzis EJ, Middleton AK, Silva JM, Roth RA and Hidalgo M: Inhibition of mTOR activity restores tamoxifen response in breast cancer cells with aberrant Akt activity. Clin Cancer Res. 10:8059–8067. 2004. View Article : Google Scholar : PubMed/NCBI

21 

Gritsko T, Williams A, Turkson J, Kaneko S, Bowman T, Huang M, Nam S, Eweis I, Diaz N, Sullivan D, et al: Persistent activation of stat3 signaling induces survivin gene expression and confers resistance to apoptosis in human breast cancer cells. Clin Cancer Res. 12:11–19. 2006. View Article : Google Scholar : PubMed/NCBI

22 

Qu C, Zhang W, Zheng G, Zhang Z, Yin J and He Z: Metformin reverses multidrug resistance and epithelial-mesenchymal transition (EMT) via activating AMP-activated protein kinase (AMPK) in human breast cancer cells. Mol Cell Biochem. 386:63–71. 2014. View Article : Google Scholar : PubMed/NCBI

23 

Mallini P, Lennard T, Kirby J and Meeson A: Epithelial-to-mesenchymal transition: What is the impact on breast cancer stem cells and drug resistance. Cancer Treat Rev. 40:341–348. 2014. View Article : Google Scholar : PubMed/NCBI

24 

Wang Z, Gerstein M and Snyder M: RNA-Seq: A revolutionary tool for transcriptomics. Nat Rev Genet. 10:57–63. 2009. View Article : Google Scholar : PubMed/NCBI

25 

Wacker SA, Houghtaling BR, Elemento O and Kapoor TM: Using transcriptome sequencing to identify mechanisms of drug action and resistance. Nat Chem Biol. 8:235–237. 2012. View Article : Google Scholar : PubMed/NCBI

26 

Yang HJ, Kim N, Seong KM, Youn H and Youn B: Investigation of radiation-induced transcriptome profile of radioresistant non-small cell lung cancer A549 cells using RNA-seq. PLoS One. 8:e593192013. View Article : Google Scholar : PubMed/NCBI

27 

Kim KY, Kim SH, Yu SN, Park SK, Choi HD, Yu HS, Ji JH, Seo YK and Ahn SC: Salinomycin enhances doxorubicin-induced cytotoxicity in multidrug resistant MCF-7/MDR human breast cancer cells via decreased efflux of doxorubicin. Mol Med Rep. 12:1898–1904. 2015. View Article : Google Scholar : PubMed/NCBI

28 

Assanhou AG, Li W, Zhang L, Xue L, Kong L, Sun H, Mo R and Zhang C: Reversal of multidrug resistance by co-delivery of paclitaxel and lonidamine using a TPGS and hyaluronic acid dual-functionalized liposome for cancer treatment. Biomaterials. 73:284–295. 2015. View Article : Google Scholar : PubMed/NCBI

29 

Denoyer D, Perek N, Le Jeune N, Frère D and Dubois F: The multidrug resistance of in vitro tumor cell lines derived from human breast carcinoma MCF-7 does not influence pentavalent technetium-99m-dimercaptosuccinic acid uptake. Cancer Biother Radiopharm. 18:791–801. 2003. View Article : Google Scholar : PubMed/NCBI

30 

Zhou Y, Li HR, Huang J, Jin G and Fu XD: Multiplex analysis of polyA-linked sequences (MAPS): An RNA-seq strategy to profile poly(A+) RNA. Methods Mol Biol. 1125:169–178. 2014. View Article : Google Scholar : PubMed/NCBI

31 

Fox-Walsh K, Davis-Turak J, Zhou Y, Li H and Fu XD: A multiplex RNA-seq strategy to profile poly(A+) RNA: Application to analysis of transcription response and 3′ end formation. Genomics. 98:266–271. 2011. View Article : Google Scholar : PubMed/NCBI

32 

Li B and Dewey CN: RSEM: Accurate transcript quantification from RNA-Seq data with or without a reference genome. BMC Bioinformatics. 12:3232011. View Article : Google Scholar : PubMed/NCBI

33 

Langmead B and Salzberg SL: Fast gapped-read alignment with Bowtie 2. Nat Methods. 9:357–359. 2012. View Article : Google Scholar : PubMed/NCBI

34 

Kent WJ, Sugnet CW, Furey TS, Roskin KM, Pringle TH, Zahler AM and Haussler D: The human genome browser at UCSC. Genome Res. 12:996–1006. 2002. View Article : Google Scholar : PubMed/NCBI

35 

Robinson MD, McCarthy DJ and Smyth GK: edgeR: A bioconductor package for differential expression analysis of digital gene expression data. Bioinformatics. 26:139–140. 2010. View Article : Google Scholar : PubMed/NCBI

36 

Dennis G Jr, Sherman BT, Hosack DA, Yang J, Gao W, Lane HC and Lempicki R: DAVID: Database for annotation, visualization and integrated discovery. Genome Biol. 4:P32003. View Article : Google Scholar : PubMed/NCBI

37 

Livak KJ and Schmittgen TD: Analysis of relative gene expression data using real-time quantitative PCR and the 2(-Delta Delta C(T)) method. Methods. 25:402–408. 2001. View Article : Google Scholar : PubMed/NCBI

38 

Leek JT, Monsen E, Dabney AR and Storey JD: EDGE: Extraction and analysis of differential gene expression. Bioinformatics. 22:507–508. 2006. View Article : Google Scholar : PubMed/NCBI

39 

Marioni JC, Mason CE, Mane SM, Stephens M and Gilad Y: RNA-seq: An assessment of technical reproducibility and comparison with gene expression arrays. Genome Res. 18:1509–1517. 2008. View Article : Google Scholar : PubMed/NCBI

40 

Crivellari D, Pagani O, Veronesi A, Lombardi D, Nolè F, Thürlimann B, Hess D, Borner M, Bauer J, Martinelli G, et al: High incidence of central nervous system involvement in patients with metastatic or locally advanced breast cancer treated with epirubicin and docetaxel. Ann Oncol. 12:353–356. 2001. View Article : Google Scholar : PubMed/NCBI

41 

Buttery RC, Rintoul RC and Sethi T: Small cell lung cancer: The importance of the extracellular matrix. Int J Biochem Cell Biol. 36:1154–1160. 2004. View Article : Google Scholar : PubMed/NCBI

42 

Liu WH, Chen MT, Wang ML, Lee YY, Chiou GY, Chien CS, Huang PI, Chen YW, Huang MC, Chiou SH, et al: Cisplatin-selected resistance is associated with increased motility and stem-like properties via activation of STAT3/Snail axis in atypical teratoid/rhabdoid tumor cells. Oncotarget. 6:1750–1768. 2015.PubMed/NCBI

43 

Kohmo S, Kijima T, Otani Y, Mori M, Minami T, Takahashi R, Nagatomo I, Takeda Y, Kida H, Goya S, et al: Cell surface tetraspanin CD9 mediates chemoresistance in small cell lung cancer. Cancer Res. 70:8025–8035. 2010. View Article : Google Scholar : PubMed/NCBI

44 

Toole BP and Slomiany MG: Hyaluronan, CD44 and Emmprin: Partners in cancer cell chemoresistance. Drug Resist Updat. 11:110–121. 2008. View Article : Google Scholar : PubMed/NCBI

45 

Hodkinson PS, Mackinnon AC and Sethi T: Extracellular matrix regulation of drug resistance in small-cell lung cancer. Int J Radiat Biol. 83:733–741. 2007. View Article : Google Scholar : PubMed/NCBI

46 

Doberstein K, Wieland A, Lee SB, Blaheta RA, Wedel S, Moch H, Schraml P, Pfeilschifter J, Kristiansen G and Gutwein P: L1-CAM expression in ccRCC correlates with shorter patients survival times and confers chemoresistance in renal cell carcinoma cells. Carcinogenesis. 32:262–270. 2011. View Article : Google Scholar : PubMed/NCBI

47 

Simpson WG: The calcium channel blocker verapamil and cancer chemotherapy. Cell Calcium. 6:449–467. 1985. View Article : Google Scholar : PubMed/NCBI

48 

Fan Y, Shen B, Tan M, Mu X, Qin Y, Zhang F and Liu Y: Long non-coding RNA UCA1 increases chemoresistance of bladder cancer cells by regulating Wnt signaling. FEBS J. 281:1750–1758. 2014. View Article : Google Scholar : PubMed/NCBI

49 

Mohammed MK, Shao C, Wang J, Wei Q, Wang X, Collier Z, Tang S, Liu H, Zhang F, Huang J, et al: Wnt/β-catenin signaling plays an ever-expanding role in stem cell self-renewal, tumorigenesis and cancer chemoresistance. Genes Dis. 3:11–40. 2016. View Article : Google Scholar : PubMed/NCBI

50 

Deng YH, Pu XX, Huang MJ, Xiao J, Zhou JM, Lin TY and Lin EH: 5-Fluorouracil upregulates the activity of Wnt signaling pathway in CD133-positive colon cancer stem-like cells. Chin J Cancer. 29:810–815. 2010. View Article : Google Scholar : PubMed/NCBI

51 

Su HY, Lai HC, Lin YW, Liu CY, Chen CK, Chou YC, Lin SP, Lin WC, Lee HY and Yu MH: Epigenetic silencing of SFRP5 is related to malignant phenotype and chemoresistance of ovarian cancer through Wnt signaling pathway. Int J Cancer. 127:555–567. 2010. View Article : Google Scholar : PubMed/NCBI

52 

Song JH, Kim SH, Cho D, Lee IK, Kim HJ and Kim TS: Enhanced invasiveness of drug-resistant acute myeloid leukemia cells through increased expression of matrix metalloproteinase-2. Int J Cancer. 125:1074–1081. 2009. View Article : Google Scholar : PubMed/NCBI

53 

Almendro V, Ametller E, Garcia-Recio S, Collazo O, Casas I, Augé JM, Maurel J and Gascón P: The role of MMP7 and its cross-talk with the FAS/FASL system during the acquisition of chemoresistance to oxaliplatin. PLoS One. 4:e47282009. View Article : Google Scholar : PubMed/NCBI

54 

Fukuyama R, Ng KP, Cicek M, Kelleher C, Niculaita R, Casey G and Sizemore N: Role of IKK and oscillatory NFkappaB kinetics in MMP-9 gene expression and chemoresistance to 5-fluorouracil in RKO colorectal cancer cells. Mol Carcinog. 46:402–413. 2007. View Article : Google Scholar : PubMed/NCBI

55 

Zhou B, Blanchard A, Wang N, Ma X, Han J, Schroedter I, Leygue E and Myal Y: Claudin 1 promotes migration and increases sensitivity to tamoxifen and anticancer drugs in luminal-like human breast cancer cells MCF7. Cancer Invest. 33:429–439. 2015. View Article : Google Scholar : PubMed/NCBI

56 

Kwon MJ: Emerging roles of claudins in human cancer. Int J Mol Sci. 14:18148–18180. 2013. View Article : Google Scholar : PubMed/NCBI

57 

Yoshida H, Sumi T, Zhi X, Yasui T, Honda K and Ishiko O: Claudin-4: A potential therapeutic target in chemotherapy-resistant ovarian cancer. Anticancer Res. 31:1271–1277. 2011.PubMed/NCBI

58 

Hoggard J, Fan J, Lu Z, Lu Q, Sutton L and Chen YH: Claudin-7 increases chemosensitivity to cisplatin through the upregulation of caspase pathway in human NCI-H522 lung cancer cells. Cancer Sci. 104:611–618. 2013. View Article : Google Scholar : PubMed/NCBI

59 

Yang M, Li Y, Shen X, Ruan Y, Lu Y, Jin X, Song P, Guo Y, Zhang X, Qu H, et al: CLDN6 promotes chemoresistance through GSTP1 in human breast cancer. J Exp Clin Cancer Res. 36:1572017. View Article : Google Scholar : PubMed/NCBI

60 

Noel EE, Yeste-Velasco M, Mao X, Perry J, Kudahetti SC, Li NF, Sharp S, Chaplin T, Xue L, McIntyre A, et al: The association of CCND1 overexpression and cisplatin resistance in testicular germ cell tumors and other cancers. Am J Pathol. 176:2607–2615. 2010. View Article : Google Scholar : PubMed/NCBI

61 

Leung EL, Fraser M, Fiscus RR and Tsang BK: Cisplatin alters nitric oxide synthase levels in human ovarian cancer cells: Involvement in p53 regulation and cisplatin resistance. Br J Cancer. 98:1803–1809. 2008. View Article : Google Scholar : PubMed/NCBI

62 

Gupta N, Xu Z, El-Sehemy A, Steed H and Fu Y: Notch3 induces epithelial-mesenchymal transition and attenuates carboplatin-induced apoptosis in ovarian cancer cells. Gynecol Oncol. 130:200–206. 2013. View Article : Google Scholar : PubMed/NCBI

63 

Yao J and Qian C: Inhibition of Notch3 enhances sensitivity to gemcitabine in pancreatic cancer through an inactivation of PI3K/Akt-dependent pathway. Med Oncol. 27:1017–1022. 2010. View Article : Google Scholar : PubMed/NCBI

64 

Kang H, Jeong JY, Song JY, Kim TH, Kim G, Huh JH, Kwon AY, Jung SG and An HJ: Notch3-specific inhibition using siRNA knockdown or GSI sensitizes paclitaxel-resistant ovarian cancer cells. Mol Carcinog. 55:1196–1209. 2016. View Article : Google Scholar : PubMed/NCBI

65 

Gu X, Lu C, He D, Lu Y, Jin J, Liu D and Ma X: Notch3 negatively regulates chemoresistance in breast cancers. Tumour Biol. Oct 14–2016.(Epub ahead of print). View Article : Google Scholar :

66 

Middlemas DS, Kihl BK and Moody NM: Brain derived neurotrophic factor protects human neuroblastoma cells from DNA damaging agents. J Neurooncol. 45:27–36. 1999. View Article : Google Scholar : PubMed/NCBI

67 

Lee J, Jiffar T and Kupferman ME: A novel role for BDNF-TrkB in the regulation of chemotherapy resistance in head and neck squamous cell carcinoma. PLoS One. 7:e302462012. View Article : Google Scholar : PubMed/NCBI

68 

Huang BS, Luo QZ, Han Y, Huang D, Tang QP and Wu LX: MiR-223/PAX6 axis regulates glioblastoma stem cell proliferation and the chemo resistance to TMZ via regulating PI3K/Akt pathway. J Cell Biochem. 118:3452–3461. 2017. View Article : Google Scholar : PubMed/NCBI

69 

Elifio-Esposito S, Mahajan A, Fonseca AS, Galli S, Noronha L, Poncio LC, Figueiredo BC, Kitlinska JB and Cavalli LR: Increase in protein expression and copy number drives the activation of NPY/Y5R pro-survival loop in chemotherapy-treated neuroblastoma. Cancer Res. 77:58222017. View Article : Google Scholar

70 

Li Y, Rong G and Kang H: Taxotere-induced elevated expression of IL8 in carcinoma-associated fibroblasts of breast invasive ductal cancer. Oncol Lett. 13:1856–1860. 2017. View Article : Google Scholar : PubMed/NCBI

71 

Kraemer B, Crittenden S, Gallegos M, Moulder G, Barstead R, Kimble J and Wickens M: NANOS-3 and FBF proteins physically interact to control the sperm-oocyte switch in Caenorhabditis elegans. Curr Biol. 9:1009–1018. 1999. View Article : Google Scholar : PubMed/NCBI

72 

Fischer KR, Durrans A, Lee S, Sheng J, Li F, Wong ST, Choi H, El Rayes T, Ryu S, Troeger J, et al: Epithelial-to-mesenchymal transition is not required for lung metastasis but contributes to chemoresistance. Nature. 527:472–476. 2015. View Article : Google Scholar : PubMed/NCBI

73 

Singh A and Settleman J: EMT, cancer stem cells and drug resistance: An emerging axis of evil in the war on cancer. Oncogene. 29:4741–4751. 2010. View Article : Google Scholar : PubMed/NCBI

74 

Goldstein JL and Brown MS: Regulation of the mevalonate pathway. Nature. 343:425–430. 1990. View Article : Google Scholar : PubMed/NCBI

75 

Wang SJ and Bourguignon LY: Role of hyaluronan-mediated CD44 signaling in head and neck squamous cell carcinoma progression and chemoresistance. Am J Pathol. 178:956–963. 2011. View Article : Google Scholar : PubMed/NCBI

Related Articles

Journal Cover

May-2018
Volume 17 Issue 5

Print ISSN: 1791-2997
Online ISSN:1791-3004

Sign up for eToc alerts

Recommend to Library

Copy and paste a formatted citation
x
Spandidos Publications style
Yang M, Li H, Li Y, Ruan Y and Quan C: Identification of genes and pathways associated with MDR in MCF-7/MDR breast cancer cells by RNA-seq analysis. Mol Med Rep 17: 6211-6226, 2018
APA
Yang, M., Li, H., Li, Y., Ruan, Y., & Quan, C. (2018). Identification of genes and pathways associated with MDR in MCF-7/MDR breast cancer cells by RNA-seq analysis. Molecular Medicine Reports, 17, 6211-6226. https://doi.org/10.3892/mmr.2018.8704
MLA
Yang, M., Li, H., Li, Y., Ruan, Y., Quan, C."Identification of genes and pathways associated with MDR in MCF-7/MDR breast cancer cells by RNA-seq analysis". Molecular Medicine Reports 17.5 (2018): 6211-6226.
Chicago
Yang, M., Li, H., Li, Y., Ruan, Y., Quan, C."Identification of genes and pathways associated with MDR in MCF-7/MDR breast cancer cells by RNA-seq analysis". Molecular Medicine Reports 17, no. 5 (2018): 6211-6226. https://doi.org/10.3892/mmr.2018.8704