Introduction
Positron emission tomography/computed tomography
(PET/CT) using 18F-2-fluorodeoxyglugose
(18F-FDG) is a widely used and accurate imaging method
for the staging of various cancers (1–3). The
semiquantitative measurement of the maximum or mean
18F-FDG-uptake, which is assessed using
18F-FDG-PET/CT, is usually obtained according to maximum
standardized uptake value (SUVmax) or mean SUV
(SUVmean) (1,4–14). A high
SUVmax in a primary tumor is associated with a shorter
overall survival (OS) time in hypopharyngeal squamous cell
carcinoma (HPSCC) and other cancers (1,4–11). Recently, it has become possible to
quantitatively calculate volume-based 18F-FDG-uptake
parameters, including metabolic tumor volume (MTV), total lesion
glycolysis (TLG) and peak SUV (SUVpeak), following the
development of software programs (4–7,12–16).
Previous studies have suggested that MTV and/or TLG can predict the
2- to 4-year OS rates in several cancers (4–7,12,13,15,16).
Roh et al (16) reported that
in HPSCC patients who underwent radical radiotherapy, MTV and TLG
are significantly associated with OS time, although volume-based
18F-FDG-uptake parameters have not thus far been
investigated in any HPSCC patients who underwent radical treatment,
including surgery and radiotherapy. Moreover, the association
between 18F-FDG-uptake parameters and
clinicopathological parameters in HPSCC has not been fully
investigated.
Tumor thickness, depth of invasion and pathological
tumor volume are pathologically considered to be quantitative
values and prognostic parameters in various cancers, including
HPSCC (2,8,17–19). In previous studies, tumor thickness
has been defined as the distance from the surface to the deepest
portion of invasion, while depth of invasion has been defined as
the distance from a theoretically reconstructed normal mucosal line
to the deepest portion of invasion (8,17).
Pathological tumor volume is calculated by three-dimensional
measurements (14,18).
Distant metastasis (DM) is clinically associated
with a poor prognosis in a number of cancer types (5,6,20–24). The
incidence rate of DM following initial treatment in HPSCC ranges
from 10–30%, and DM generally occurs within 3 years (22,23).
Furthermore, the majority of patients with DM of HPSCC succumb
within 1 year of diagnosis, and DM directly affects the 3-year OS
rate in HPSCC (20,22,23).
Recently, higher TLG was reported to be associated with a shorter
DM-free survival (DMFS) time in oral SCC (OSCC) and oropharyngeal
SCC (OPSCC) (5,6). However, to the best of our knowledge,
the association between TLG and DMFS in HPSCC has not been
previously assessed.
In the present study, the possible correlation
between 18F-FDG-uptake parameters and OS was
investigated in patients with HPSCC, and the possible association
between DMFS and 18F-FDG-uptake parameters was assessed.
Furthermore, the correlations between 18F-FDG-uptake
parameters and clinicopathological parameters was also investigated
in HPSCC.
Patients and methods
Patients
Between June 2008 and December 2011, 54 patients,
who were newly diagnosed with HPSCC by pathological examination
Aichi Cancer Center Hospital (Nagoya, Japan), underwent
pretreatment 18F-FDG-PET/CT. Prior to treatment, 1
patient with DM was excluded. Therefore, 53 patients who received
radical treatment were enrolled in this study, which was approved
by the Institutional Review Board at Aichi Cancer Center Hospital.
All patients provided informed consent for all treatments and
examinations. Clinical staging was decided by routine physical
examination, nasopharyngoscopy, chest radiography, enhanced
cervical computed tomography (CT) or magnetic response imaging, and
18F-FDG-PET/CT. 18F-FDG-PET/CT was not used
for the classification of either T or N stage, and
tumor-node-metastasis was classified based on the International
Union Against Cancer (sixth edition) (25).
Treatment
In accordance with our previous study and another
study (9,12), the 53 patients were grouped by primary
tumor treatment modality as follows: Curative surgery plus
radiation therapy (RT) with or without chemotherapy (surgery group;
n=19) and radical RT plus chemotherapy (RT group; n=34). The
selection of primary treatment modality, but not
18F-FDG-PET/CT, depended on whether patients wished for
larynx preservation. In total, 34 patients in the RT group were
treated with radical RT at a total dose of 60–70 Gy, with 1.8–2 Gy
per fraction; all other RT procedures were used as previously
described (26). In the RT group, 8
patients underwent neck dissection, while 2 patients were treated
with RT alone due to a poor general condition. Following completion
of treatment, an effort was made to identify those with early
locoregional recurrence (LR) at an outpatient clinic, and salvage
therapy was performed. The clinical characteristics of all patients
are shown in Table I.
 | Table I.Clinical characteristics of the
patients (n=53). |
Table I.
Clinical characteristics of the
patients (n=53).
| Characteristic | Value |
|---|
| Age, years |
|
| Mean ±
standard deviation | 64.7±10.2 |
| Gender, n |
|
|
Male | 48 |
|
Female | 5 |
| Clinical T
classification, n |
|
| T1 | 8 |
| T2 | 21 |
| T3 | 14 |
| T4 | 10 |
| Clinical N
classification, n |
|
| N0 | 18 |
| N1 | 5 |
| N2 | 26 |
| N3 | 4 |
| Clinical stage,
n |
|
| I | 5 |
| II | 8 |
|
III | 7 |
| IV | 33 |
| Differentiation,
n |
|
| GX | 23 |
| G1 | 6 |
| G2 | 19 |
| G3 | 5 |
| Tumor site, n |
|
| PA | 7 |
| PS | 39 |
| PW | 7 |
| Treatment group,
n |
|
|
Surgery | 19 |
| RT | 34 |
Pathological parameters
Pathological measurements could be taken of 6
primary tumors that underwent surgery without preoperative
chemotherapy, and 1 tumor that was not detected on
18F-FDG-PET/CT (T1 HPSCC) was excluded. Therefore, a
total of 5 lesions were measured using sections stained with
hematoxylin and eosin. Tumor thickness and depth of invasion were
measured by a pathologist using a microscope (LV-100ND; Nikon,
Tokyo, Japan) with an accuracy of 0.1 mm, according to our previous
study (8). Based on the study by
Murphy et al (14), the
pathological tumor volume was calculated using the following
formula: Pathological tumor volume = π/6 × (xpath ×
ypath × zpath), where xpath,
ypath and zpat are the three orthogonal
diameters obtained from the tumor specimen resected from the
primary tumor site.
18F-FDG-PET/CT
All patients were scanned using a FDG-PET/CT machine
(Biograph TruePoint PET/CT/40 with TrueV; Siemens Healthcare
Medical Solutions Inc., Malvern, PA, USA). The interval between
18F-FDG-PET/CT and the start of therapy was 18.6±10.3
days [mean ± standard deviation (SD)], and the blood glucose level
at the time of injection of 18F-FDG was 104.9±15.5 mg/dl
(mean ± SD). Patients fasted for 6 h prior to an intravenous
infusion of 185–370 MBq 18F-FDG, depending on
bodyweight, and images were acquired 90 min after intravenous
administration of the tracer. Low-dose CT images were used for
attenuation correction of the PET data. The CT dose for RANDO
Phantom (Alderson Research Laboratories Inc., Long Island, NY, USA)
was 4.3 mSv. PET images were reconstructed using a Gaussian filter
of 4.0 mm full width at half maximum value. All image
reconstructions were performed with the ordered subset expectation
maximization algorithm, incorporating a CT-based transmission map.
All other PET/CT procedures were published previously (3).
18F-FDG-uptake
parameter
A focus was considered to be positive if its
activity was significantly above that of the expected background,
and the boundaries were automatically drawn to include the primary
tumor within the hypopharynx by a click on each axial, coronal and
sagittal 18F-FDG-PET/CT image. The 3-dimensional images
were created in SUV mode for semiquantitative evaluation on a
workstation (Advantage Workstation 4.6 software program PET VCAR;
GE Healthcare, Chalfont, UK). The level of
18F-FDG-uptake was automatically calculated as the SUV
according to the following formula: SUV = tissue concentration
(Bq/g) / [injection dose (Bq) / body weight (g)]. Applying the
findings of our previous study (9),
the SUVmax of the primary hypopharyngeal tumor was
automatically obtained from a volumetric region of interest
designated as a site of abnormal accumulation on several consequent
3-dimensional images. SUVpeak was determined according
to the average SUV within a 1 cm3 spherical volume of
interest (VOI) that included the maximum pixel. In accordance with
the study by Abd El-Hafez et al (5), with a minor modification, the MTV and
SUVmean of the VOIs were calculated by adopting a fixed
threshold fraction of the SUVmax in the primary tumor.
The threshold was 45% of the SUVmax based on Phantom
analyses. TLG was calculated according to the following formula:
TLG = SUVmean × MTV. A representative
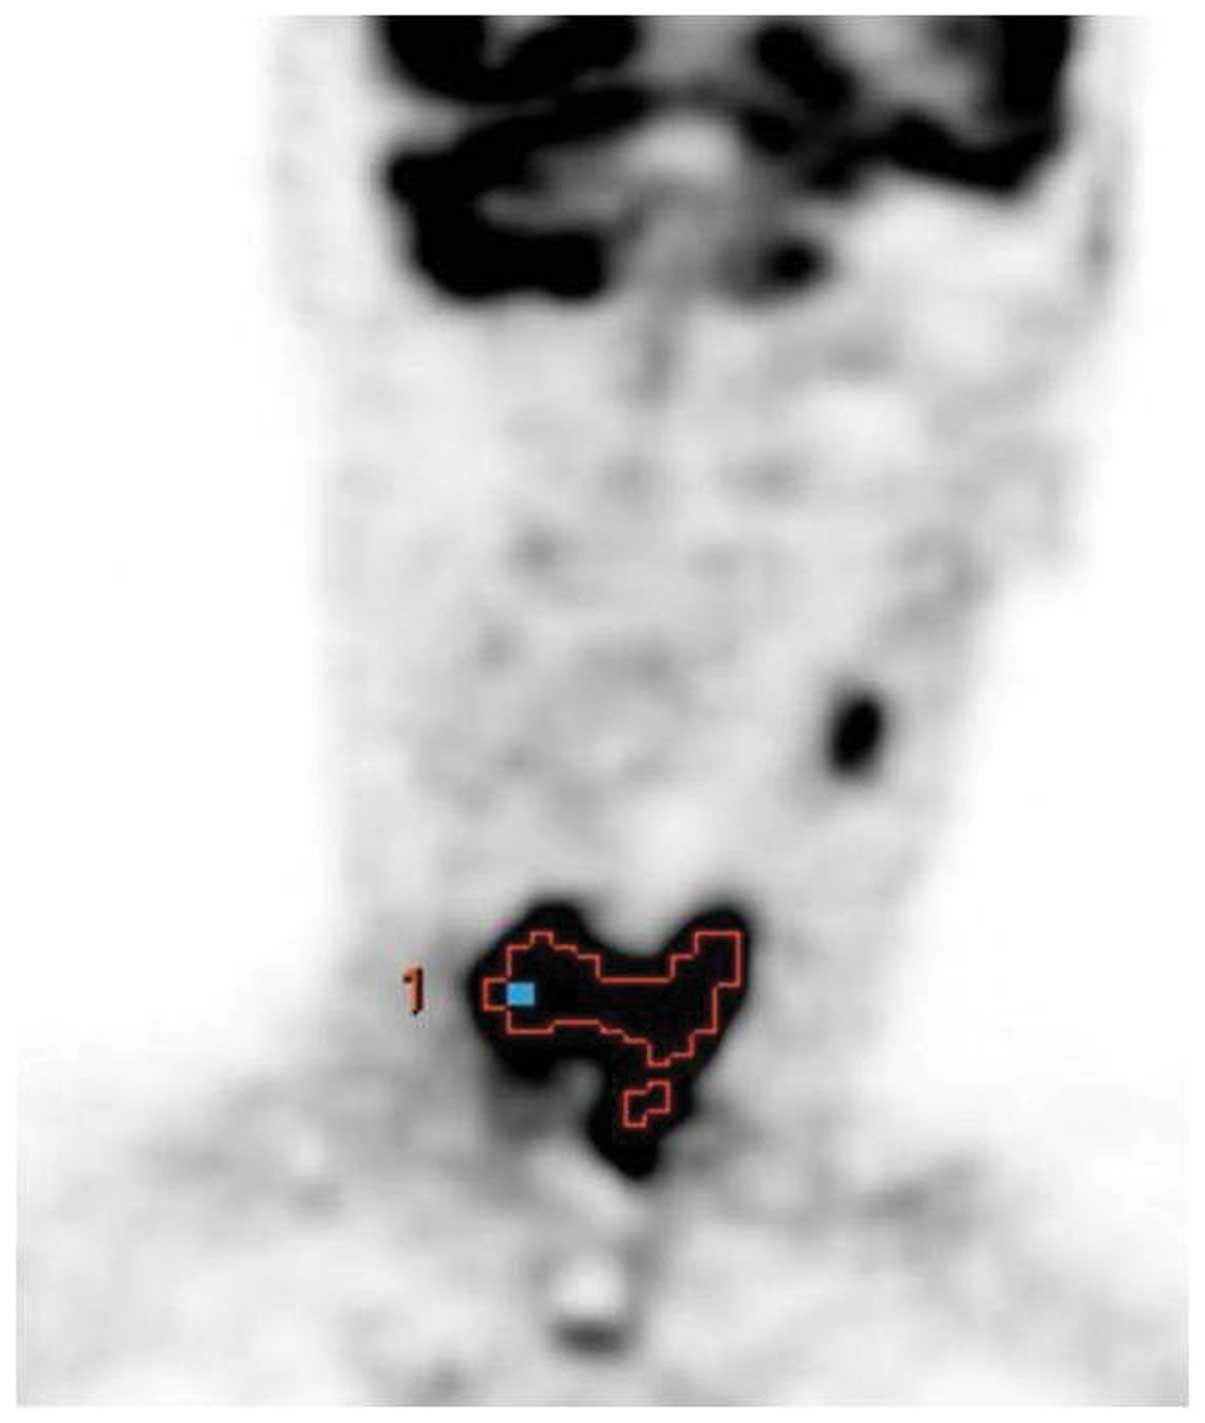
18F-FDG-PET/CT image is presented as an example in
Fig. 1.
Statistical analysis
Statistical analysis was performed using the JMP
program (version 9; SAS, Cary, NC, USA). Differences in clinical T
classification between two groups, which were detectable or
undetectable on 18F-FDG PET/CT, were assessed using
Fisher's exact test.
Among the 50 patients with a primary tumor detected
on 18F-FDG-PET/CT, correlations between
18F-FDG-uptake parameters were analyzed using simple
regression analysis, and the associations between clinical
parameters (age, gender, T and N classification, clinical stage,
tumor site and treatment group) and 18F-FDG-uptake
parameters (SUVmax, SUVpeak, MTV and TLG)
were analyzed using Spearman's rank correlation and the
Mann-Whitney U-test. Among 5 patients, associations between
18F-FDG-uptake parameters and pathological parameters
(tumor thickness, depth of invasion and pathological tumor volume)
were estimated by simple regression analysis.
In all cases, the survival time was defined as the
period from 18F-FDG-PET/CT to the target event or last
contact. The target events included mortality for OS, LR for
LR-free survival (LRFS) and DM for DMFS. Applying a previously
described method (8,9), the Kaplan-Meier technique was used to
estimate OS, LRFS and DMFS curves, and various
18F-FDG-uptake cutoff values were tested using log-rank
test in OS analysis. All patients could be divided into two groups
based on SUVmax (SUVmax ≥28.5;
SUVmax <28.5), SUVpeak (SUVpeak
≥19; SUVpeak <19), MTV (MTV ≥12; MTV <12) and TLG
(TLG ≥42; TLG <42). In the multivariate analysis, a Cox
proportional hazards model was used. The small number events in the
dataset limited the number of parameters that could be analyzed in
the multivariate model. In accordance with the study by Lim et
al (6), the T classification is a
strong prognostic parameter and may provide a degree of the same
information as the 18F-FDG-uptake parameters of the
primary tumor. Moreover, our previous study and other studies have
reported that clinical T4 category is significantly associated with
high-risk DM compared with clinical T1-3 category (20,21). In
the multivariate analysis with adjustment for clinical T category
(clinical T1-3/clinical T4) and treatment group (surgery/RT), the
present study analyzed whether any of the 18F-FDG-uptake
parameters were correlated with OS or DMFS. P<0.05 was
considered to indicate a statistically significant difference.
Results
18F-FDG-uptake of the
primary tumor
The sensitivity of detection of the hypopharyngeal
site on 18F-FDG PET/CT was 94.3% (50/53). All
false-negative cases, which were undetectable by 18F-FDG
PET/CT, were T1 HPSCC. Tumors with T2-T4 classification were
detected more frequently than those with T1 classification
(P<0.01).
18F-FDG-uptake and clinical
parameters
Among the 50 patients with a primary tumor detected
on 18F-FDG PET/CT, the SUVmax,
SUVpeak, MTV and TLG values (mean ± SD) of the primary
tumor were 22.3±10.5 g/ml, 14.5±7.0 g/ml, 5.1±5.5 cm3
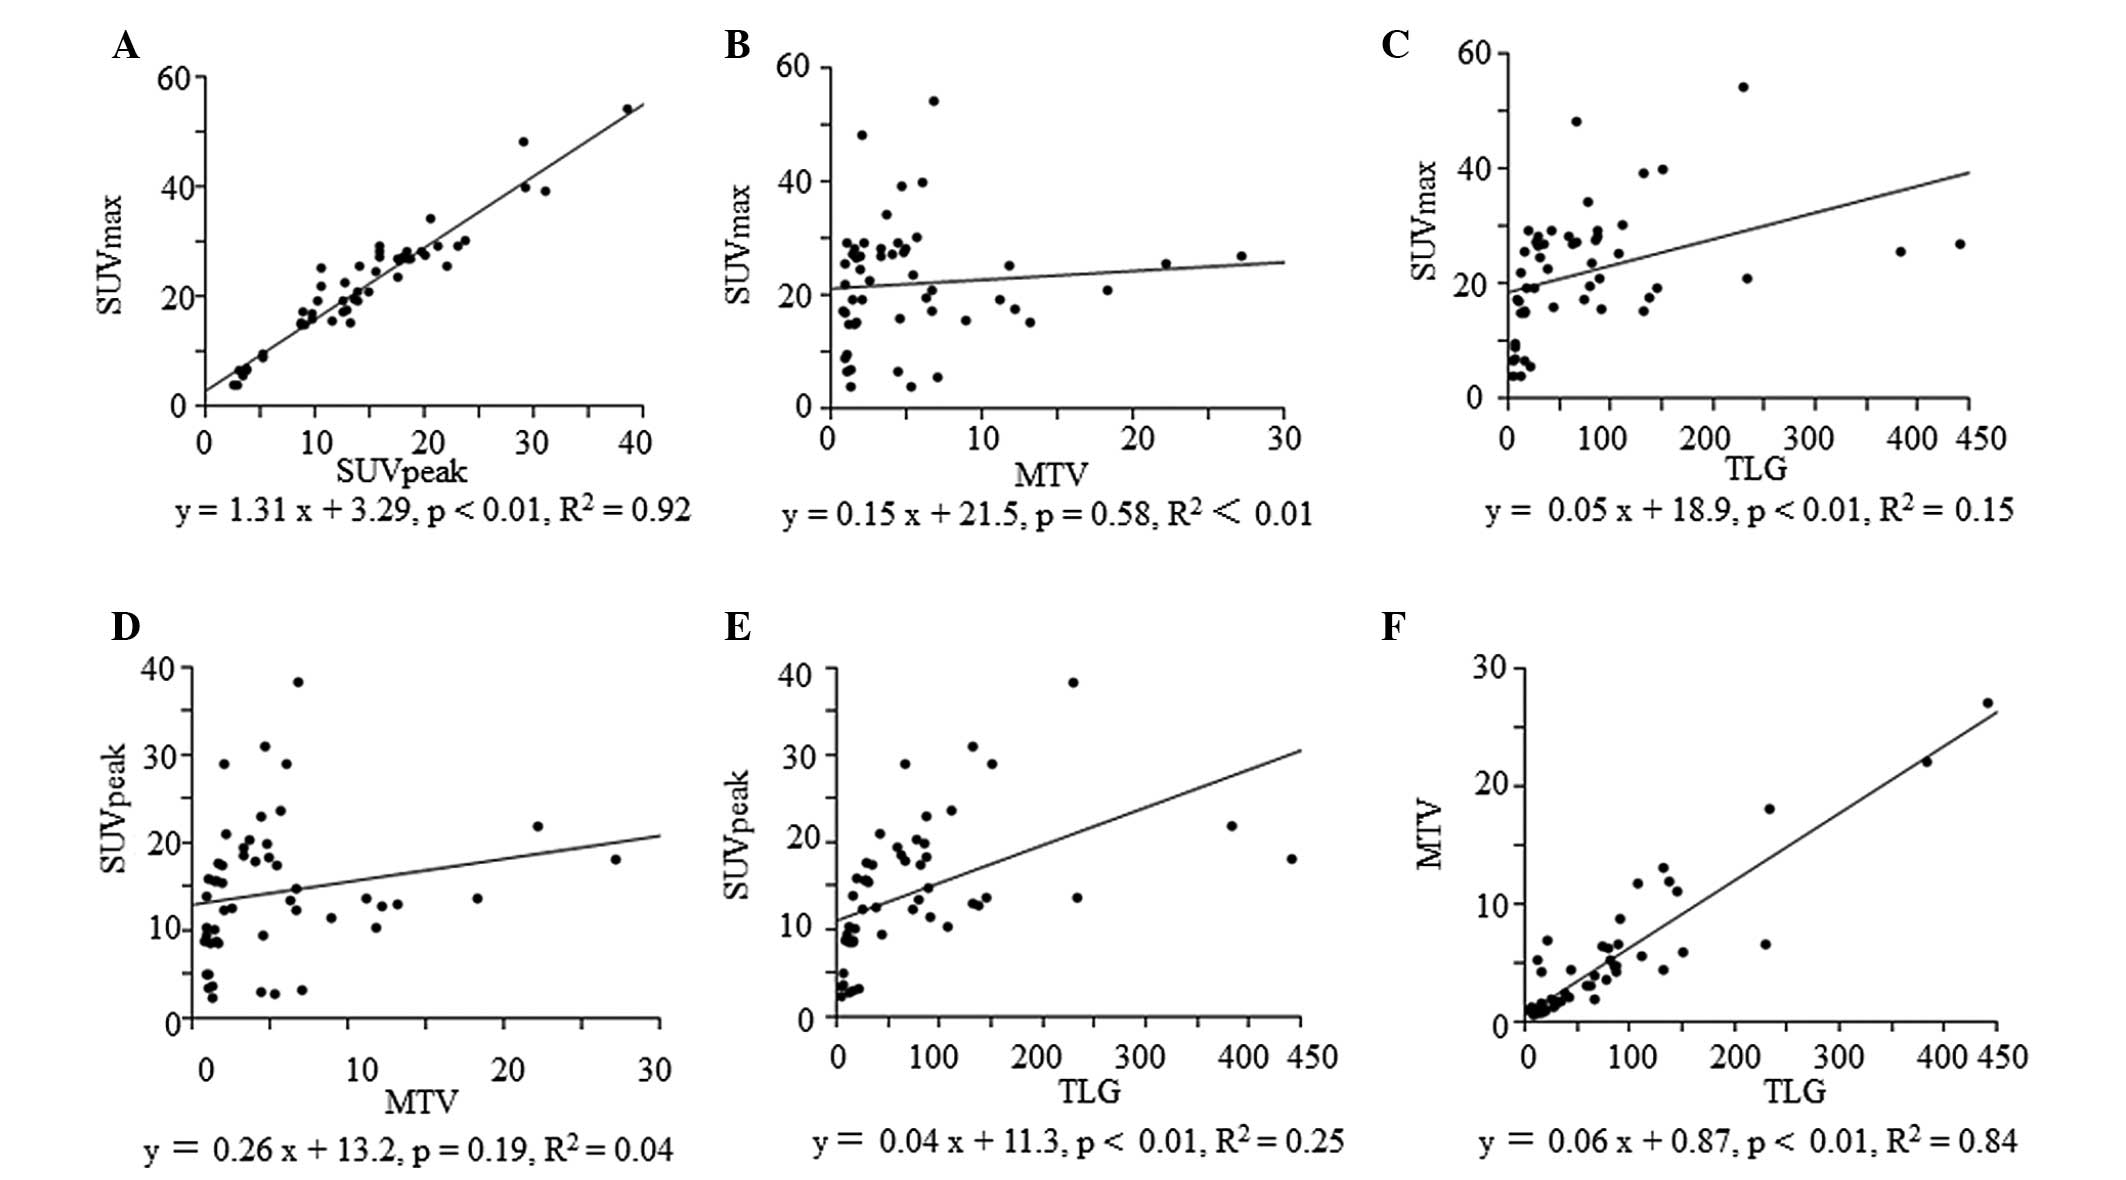
and 73.7±88.8 g, respectively. SUVmax was significantly
correlated with SUVpeak (P<0.01), while TLG was
correlated with SUVmax (P<0.01), SUVpeak
(P<0.01) and MTV (P<0.01), as shown in Fig. 2. The associations between the clinical
parameters and the 18F-FDG-uptake parameters are shown
in Table II. Clinical T
classification was significantly correlated with all
18F-FDG-uptake parameters (P<0.01), while clinical
stage was correlated with SUVmax (P<0.05),
SUVpeak (P<0.02) and TLG (P<0.02). The surgery
group exhibited significantly greater MTV (P<0.01) and TLG
(P<0.02) values.
| Table II.Associations between clinical
parameters and 18F-2-fluorodeoxyglugose-uptake
parameters. |
Table II.
Associations between clinical
parameters and 18F-2-fluorodeoxyglugose-uptake
parameters.
|
|
| Mean ± SD |
|---|
|
|
|
|
|---|
| Parameter | Number |
SUVmax |
SUVpeak | MTV | TLG |
|---|
| Age |
|
| ≥66
years | 25 |
22.1±10.9 | 14.8±8.3 |
5.8±6.2 | 86.1±99.0 |
| <66
years | 25 |
22.4±10.3 | 14.3±7.2 |
4.4±4.9 | 61.2±77.4 |
|
P-valuea |
|
0.43 |
0.72 |
0.32 |
0.32 |
| Gender |
|
|
Male | 45 |
22.7±10.0 | 14.7±7.3 |
5.1±5.8 | 75.9±92.1 |
|
Female | 5 |
18.5±15.2 | 12.8±12.0 |
4.7±2.0 | 53.2±53.0 |
|
P-valuea |
|
0.43 |
0.41 |
0.35 |
0.76 |
| Clinical T
classification |
|
| T1 | 5 | 12.4±9.7 | 6.8±5.7 |
1.8±1.5 | 11.8±9.4 |
| T2 | 21 |
20.0±11.0 | 11.9±7.4 |
2.2±1.7 | 26.5±28.1 |
| T3 | 14 | 28.5±9.6 | 20.0±6.8 |
5.8±2.8 | 101.1±48.5 |
| T4 | 10 | 23.3±5.5 | 16.3±4.6 | 11.8±8.4 | 165.4±141.2 |
|
P-valueb |
| <0.01 | <0.01 | <0.01 | <0.01 |
| Clinical N
classification |
|
| N0 | 16 |
18.7±12.8 | 11.8±9.1 |
4.9±6.3 |
67.6±114.0 |
| N1 | 5 | 25.7±9.2 | 18.2±8.6 |
7.2±8.6 | 126.9±149.9 |
| N2 | 25 | 23.4±9.4 | 15.5±6.8 |
4.4±4.6 | 64.4±59.0 |
| N3 | 4 | 24.8±7.6 | 15.0±4.9 |
7.4±3.6 | 89.2±13.0 |
|
P-valueb |
|
0.13 |
0.11 |
0.70 |
0.13 |
| Clinical stage |
|
| I | 3 |
13.6±11.8 | 7.5±7.2 |
2.3±1.8 | 15.8±10.6 |
| II | 8 | 13.1±7.0 | 7.6±4.0 |
2.7±2.2 | 17.2±10.3 |
|
III | 7 |
30.4±13.1 | 20.5±10.4 |
4.2±2.1 | 90.7±72.2 |
| IV | 32 | 23.6±8.7 | 15.6±6.3 |
6.1±6.6 | 89.5±99.8 |
|
P-valueb |
| <0.05 | <0.02 |
0.22 | <0.02 |
| Tumor site |
|
| PS | 38 |
23.0±10.1 | 15.0±7.3 |
4.9±6.0 | 75.2±98.1 |
|
Non-PS | 12 |
20.0±12.0 | 13.2±9.2 |
5.7±3.6 | 69.0±52.5 |
|
P-valuea |
| 0.30 |
0.28 |
0.06 |
0.47 |
| Treatment
group |
|
|
Surgery | 17 |
20.7±11.9 | 14.1±8.8 |
9.4±7.5 | 129.1±128.1 |
| RT | 33 | 23.1±9.8 | 14.8±7.2 |
2.8±1.9 | 45.1±37.5 |
|
P-valuea |
|
0.28 |
0.77 | <0.01 | <0.02 |
18F-FDG-uptake and
pathological parameters
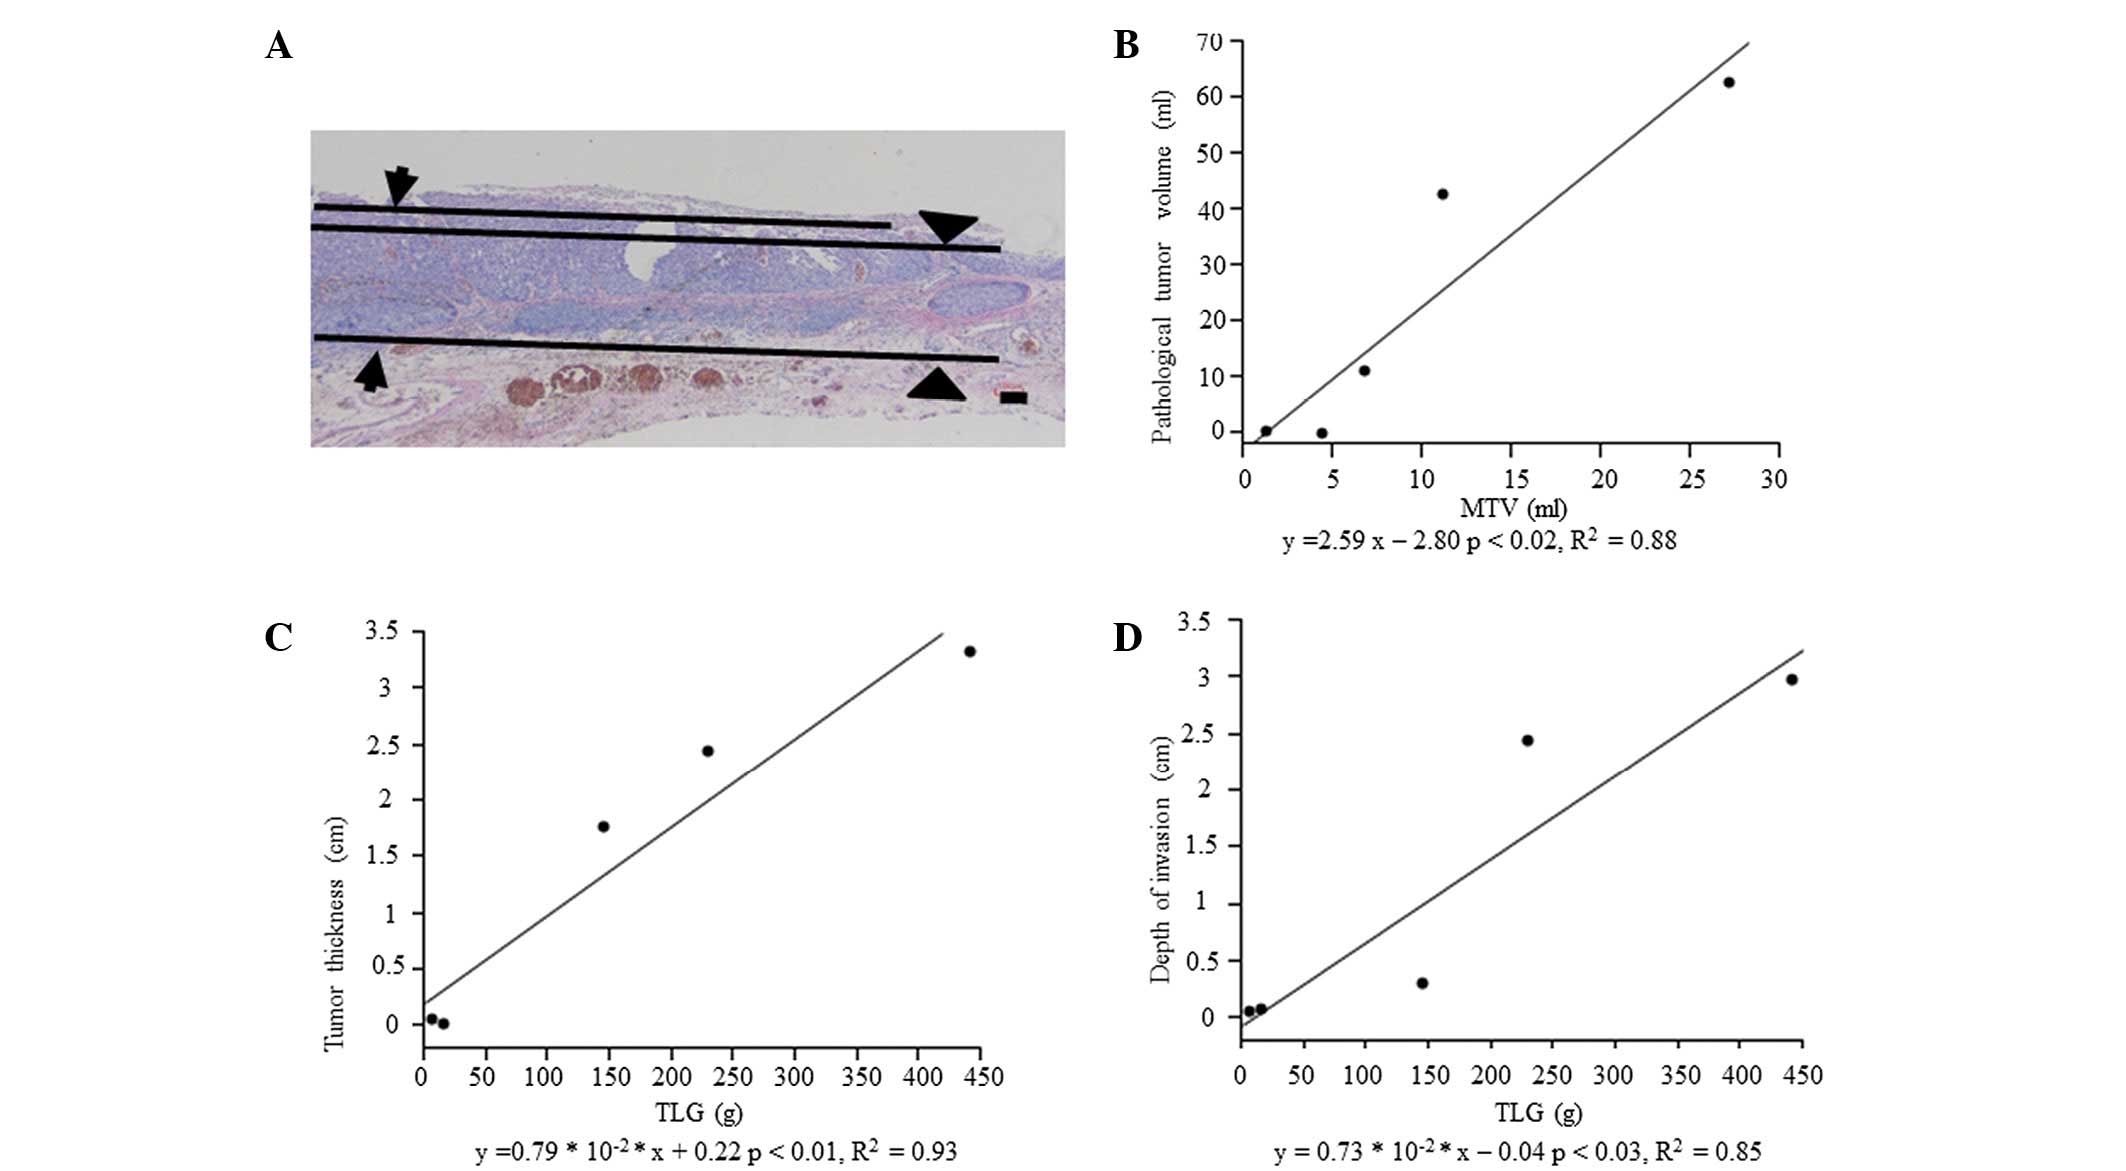
TLG was significantly correlated with tumor
thickness (P<0.01) and depth of invasion (P<0.03), and MTV
was correlated with pathological tumor volume (P<0.02), as shown
in Fig. 3.
Clinical course
At the end of the study, the mean ± SD follow-up
periods among all patients, the 39 patients who remained alive
(73.6%) and the 14 patients who had succumbed (26.4%) was
33.5±13.8, 37.7±12.7 and 21.6±8.8 months, respectively. A total of
13 patients (24.5%) succumbed to HPSCC. In total, 16 (30.2%)
exhibited LR. Of these 16 patients, 11 underwent radical surgery.
Overall, 12 patients (22.6%) exhibited DM (lung, n=9; mediastinum,
n=1; lung and mediastinum, n=1; and hip, n=1), and the mean ± SD
period between 18F-FDG-PET/CT and DM was 12.0±4.9
months. Among all the patients, the 3-year OS, LRFS and DMFS rates
were 72.7, 71.5 and 76.4%, respectively. In total, 15 patients
(28.3%), who were diagnosed with second primary cancer received
radical treatment.
Univariate survival analysis
Applying the method described previously (8,9), various
18F-FDG uptake parameter cutoff values were tested using
the log-rank test in OS analysis. The cutoff values with the lowest
P-values were used in these analyses: SUVmax=28.5,
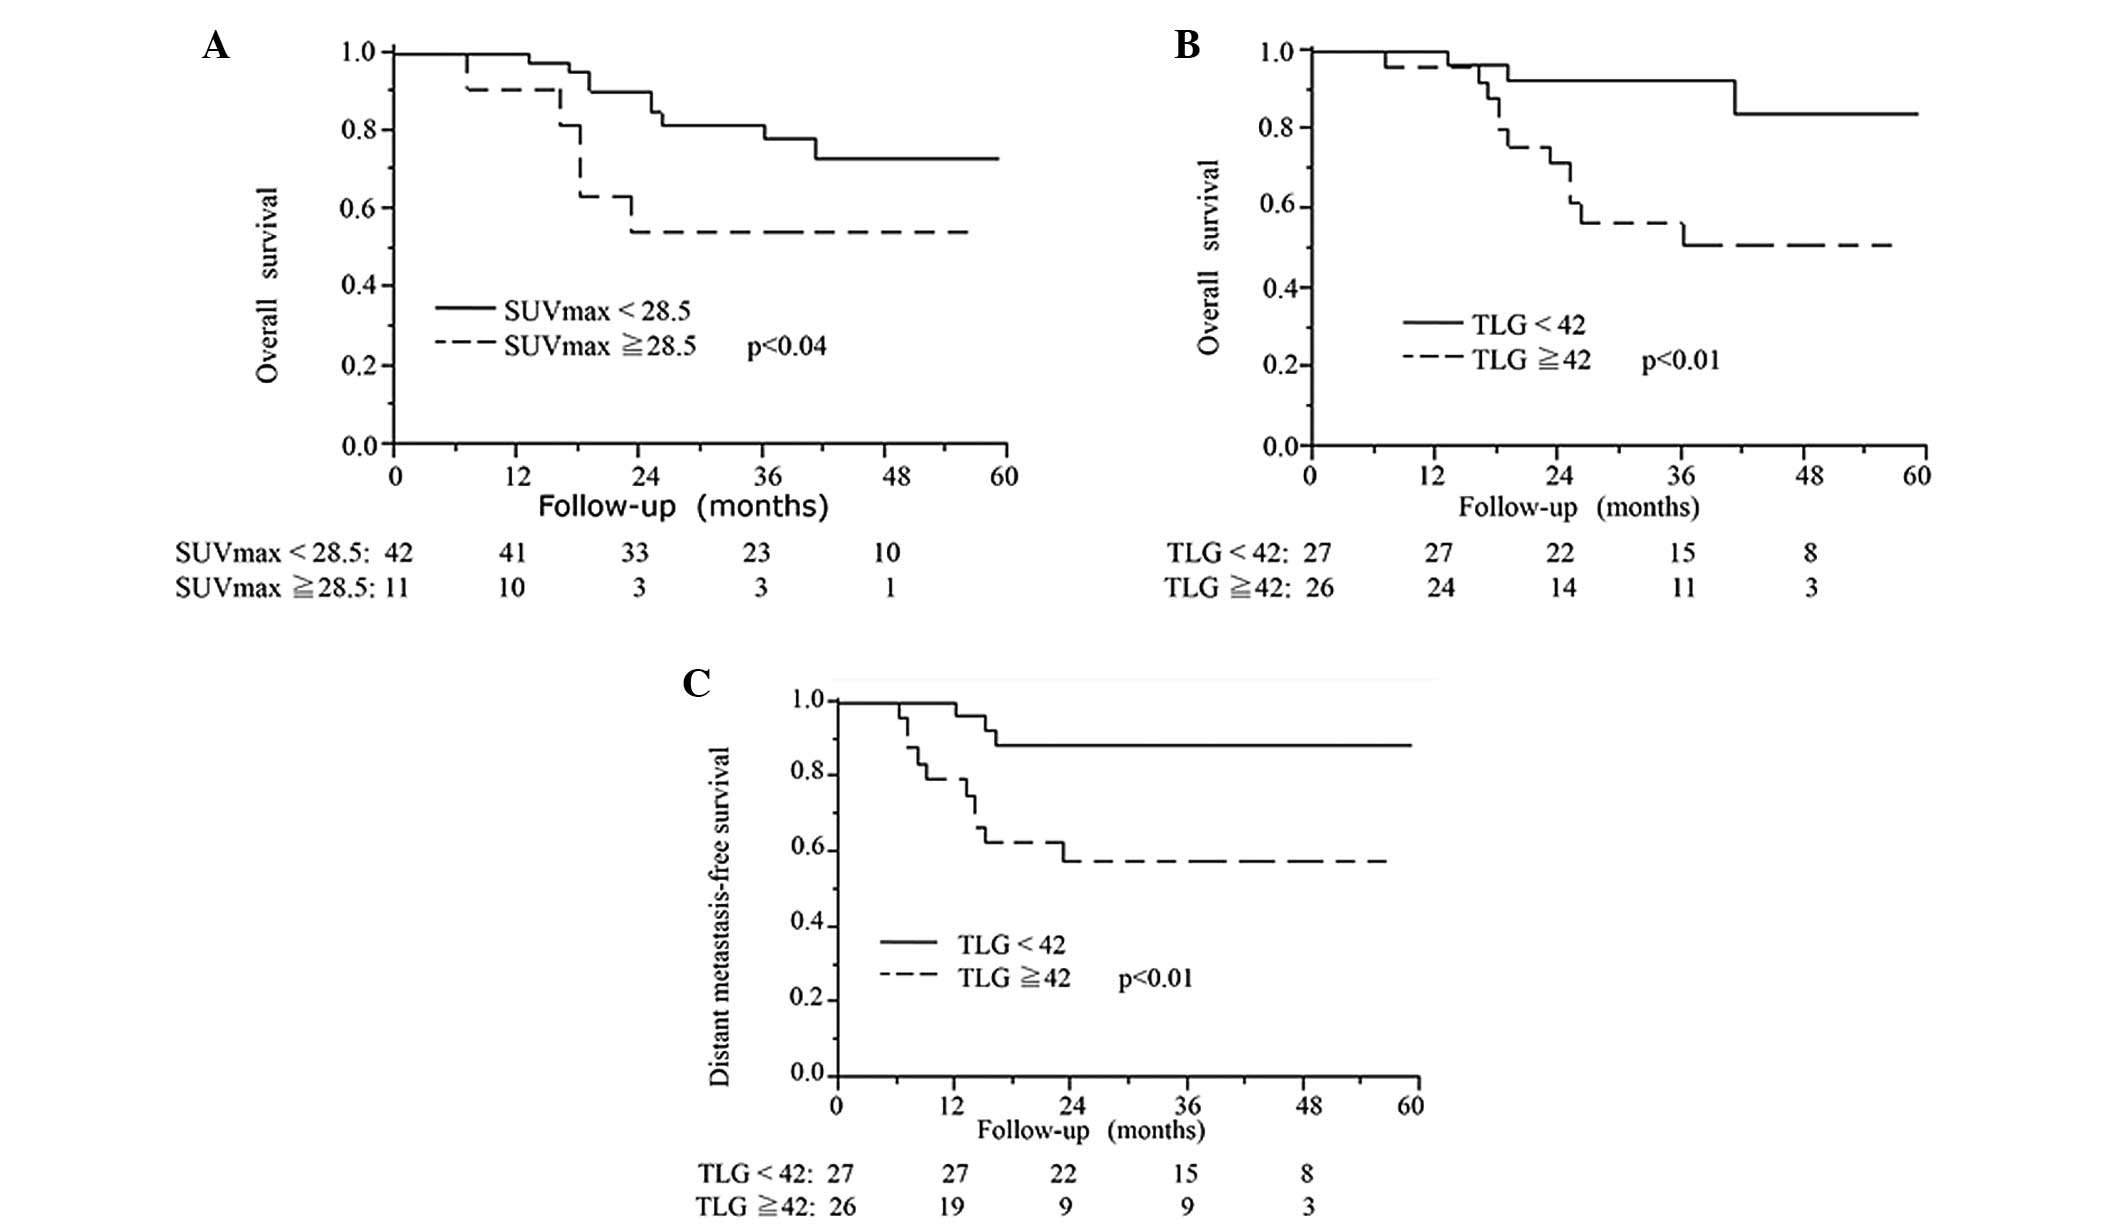
SUVpeak=19, MTV=12 and TLG=42. It was found that
SUVmax ≥28.5 (P<0.04), SUVpeak ≥19
(P<0.05), MTV ≥12 (P<0.03) and TLG ≥42 (P<0.01) could
significantly differentiate the shorter survival group. Univariate
analyses of OS, LRFS and DMFS are shown in Table III. MTV ≥12 (P<0.03) and TLG ≥42
(P<0.01) were significantly correlated with poorer DMFS.
| Table III.Univariate survival
analysisa. |
Table III.
Univariate survival
analysisa.
| Parameter | Number | 3-year OS, % | P-value | 3-year LRFS, % | P-value | 3-year DMFS, % | P-value |
|---|
|
SUVmax |
|
|
<28.5 | 42 | 78.3 | <0.04 | 69.9 | 0.48 | 78.0 | 0.52 |
|
≥28.5 | 11 | 54.6 |
| 80.0 |
| 70.7 |
|
|
SUVpeak |
|
|
<19.0 | 42 | 77.9 | <0.05 | 69.6 | 0.44 | 77.9 | 0.54 |
|
≥19.0 | 11 | 54.6 |
| 80.0 |
| 70.7 |
|
| MTV |
|
|
<12.0 | 48 | 85.1 | <0.03 | 70.1 | 0.76 | 80.4 | <0.03 |
|
≥12.0 | 5 | 60.0 |
| 80.0 |
| 40.0 |
|
| TLG |
|
|
<42.0 | 27 | 92.6 | <0.01 | 73.0 | 0.72 | 92.6 | <0.01 |
|
≥42.0 | 26 | 51.3 |
| 70.1 |
| 58.0 |
|
Multivariate survival analysis
Upon multivariate analysis with adjustment for
clinical T category (clinical T1-3/clinical T4) and treatment group
(surgery/RT), the patients with SUVmax ≥28.5 exhibited
significantly poorer OS (P<0.03), and TLG ≥42 was significantly
correlated with shorter OS (P<0.03) and DMFS (P<0.01) times.
Multivariate analysis of OS and DMFS are shown in Table IV. Kaplan-Meier curves for OS
(SUVmax ≥28.5 and SUVmax <28.5), and OS
and DMFS (TLG ≥42 and TLG <42) are shown in Fig. 4. In the multiple survival analysis
with adjustment for clinical T category (clinical T1-3/T4) and
treatment group (surgery/RT), FDG-uptake parameters were not
significantly assocaited with LRFS (SUVmax ≥28.5: Hazard
ratio (HR), 1.88, 95% confidence interval (CI), 0.51–12.1, P=0.38;
SUVpeak ≥19: HR, 1.92, 95% CI, 0.53–12.3, P=0.35;
MTV≥12: HR, 1.27, 95% CI, 0.14–27.4, P=0.84; TLG≥12: HR, 1.14, 95%
CI, 0.37–3.33, P=0.81).
| Table IV.Multivariate analysisa of OS and DMFS. |
Table IV.
Multivariate analysisa of OS and DMFS.
|
| OS | DMFS |
|---|
|
|
|
|
|---|
| Parameter | HR | 95% CI | P-value | HR | 95% CI | P-value |
|---|
| Model
1-SUVmax |
|
|
SUVmax
(≥28.5/<28.5) | 3.94 | 1.13–12.71 | <0.04 | 2.00 | 0.42–7.35 | 0.34 |
| T
category (T4/T1-3) | 5.10 | 1.20–20.52 | <0.03 | 2.40 | 0.55–9.91 | 0.24 |
|
Treatment group
(surgery/RT) | 0.62 | 0.14–2.43 | 0.50 | 1.50 | 0.37–5.72 | 0.56 |
| Model
2-SUVpeak |
|
|
SUVpeak
(≥19/<19) | 2.73 | 0.83–8.00 | 0.09 | 1.49 | 0.33–5.04 | 0.57 |
| T
category (T4/T1-3) | 4.18 | 0.97–16.40 | 0.09 | 2.19 | 0.49–9.00 | 0.29 |
|
Treatment group
(surgery/RT) | 0.52 | 0.12–2.02 | 0.35 | 1.38 | 0.34–5.20 | 0.64 |
| Model 3-MTV |
|
| MTV
(≥12/<12) | 3.29 | 0.48–29.91 | 0.22 | 2.68 | 0.36–27.14 | 0.34 |
| T
category (T4/T1-3) | 3.04 | 0.51–12.86 | 0.20 | 1.38 | 0.15–7.71 | 0.75 |
|
Treatment group
(surgery/RT) | 0.37 | 0.05–1.60 | 0.20 | 1.15 | 0.23–4.58 | 0.85 |
| Model 4-TLG |
|
| TLG
(≥42/<42) | 4.00 | 1.11–18.74 | <0.04 | 6.61 | 1.59–44.67 | <0.01 |
| T
category (T4/T1-3) | 2.16 | 0.51–8.54 | 0.28 | 1.04 | 0.23–4.46 | 0.64 |
|
Treatment group
(surgery/RT) | 0.59 | 0.15–2.14 | 0.43 | 1.57 | 0.39–5.84 | 0.51 |
Discussion
18F-FDG-PET/CT is an important imaging
procedure for the staging of numerous cancers, although its full
potential has yet to be established (1–4,8,9).
SUVmax is a single-voxel representation of the maximum
18F-FDG uptake (4). A
number of studies have investigated the close correlation between
SUVmax and OS (1,4–11). In our
previous studies, high SUVmax was associated with a
shorter OS time and a greater tumor thickness in OSCC, and with a
poorer OS in HPSCC (8,9). Although several studies have reported no
significant association between SUVmax and OS (12,13), two
recent meta-analyses and a review of HNSCC have demonstrated that
that an increased SUVmax indicates poorer OS (8,10,11). The present results demonstrating a
significant association between SUVmax ≥28.5 and a
poorer OS is in agreement with these previous studies (1,4–11).
SUVpeak is a hybrid SUV measurement that
includes the local average SUV value in a group of voxels
surrounding the voxel with the highest activity (4). A higher SUVpeak was shown to
be associated with a shorter OS in non-small lung cancer (15). To the best of our knowledge, the
present study found, for the first time, that a higher
SUVpeak is significantly correlated with a shorter OS
time in HPSCC.
MTV functions as a volumetric and metabolic
biomarker, and can be used to estimate the tumor volume based on
the distribution of metabolic activity (4). Murphy et al (14) reported that MTV in 23 OSCC patients
was associated with pathological tumor volumes, and Burri et
al (19) reported that MTV in
OSCC was associated with pathological tumor volume according to
linear regression analysis. The present result demonstrating a
significant association between MTV and pathological tumor volume
is in agreement with these studies (14,19).
Furthermore, previous studies have demonstrated that a high MTV of
the primary tumor is significantly associated with a shorter OS
time in HPSCC patients who underwent radical radiotherapy, as well
as in other cancer types, and the present result demonstrating a
significant correlation between MTV ≥12 and a shorter OS time is in
agreement with these studies (4–7,12,13,16).
TLG, which incorporates MTV and SUVmean,
theoretically represents the total activity of all metabolically
active cancer cells (4). In HPSCC
patients who underwent radical radiotherapy, as well as in other
cancer types, a high TLG value has been demonstrated to be
significantly associated with a shorter OS time, and the present
result demonstrating a significant association between TLG ≥42 and
a shorter OS time is in agreement with these studies (4–7,12,13,16).
It has been demonstrated that high TLG of the
primary tumor is associated with a shorter DMFS time and a higher
incidence of DM (13). TLG has been
shown to predict DMFS in 19 patients with head and neck cancer
(13), and high TLG has also been
associated with a shorter OS time and a higher incidence of DM in
OSCC (5). Additionally, TLG has been
shown to be associated with OS and DMFS in OPSCC (6). However, no associations have been
reported between TLG and DMFS in HPSCC patients to date.
In a previous study of 595 HPSCC patients, the
median time from the last treatment to DM was 11.5 months, and 95%
of the DM occurred prior to 36 months (23). Moreover, in a recent review of HPSCC,
the number of patients who developed DM was stated to range between
10 and 30%, and the median survival time was typically <1 year
(22). These studies show that the
development of DM in HPSCC directly affects the 3-year OS rate
(22–24). We hypothesized that
18F-FDG-uptake parameters are associated with DMFS, as
the presence of DM affects 3-year OS rates. In the present study,
TLG was associated with the 3-year OS and DMFS rates. Based on the
present results and those of other studies, it is likely that
pretreatment 18F-FDG-PET/CT provides non-invasive and
effective information for identifying the patients at high-risk of
DM (5,6,13).
A limitation of the present study is the relatively
small number of subjects, and in the future, an analysis of larger
numbers of patients will be required.
In conclusion, to the best of our knowledge, the
present study demonstrated for the first time that high TLG was
significantly correlated with shorter OS and DMFS times in HPSCC
patients who underwent radical treatment, including surgery and
radiotherapy. Pretreatment 18F-FDG-PET/CT is thus likely
to provide valuable prognostic parameters for identifying groups of
HPSCC patients with shorter OS and DMFS times.
Acknowledgements
The authors are grateful to the technical staff for
the PET/CT operation. The present study was supported by the Japan
Society for the Promotion of Science Grants-in-Aid for Science
Research (grant nos. 2479821 and 16K11253).
References
|
1
|
Kato H, Kuwano H, Nakajima M, Miyazaki T,
Yoshikawa M, Ojima H, Tsukada K, Oriuchi N, Inoue T and Endo K:
Comparison between positron emission tomography and computed
tomography in the use of the assessment of esophageal carcinoma.
Cancer. 94:921–928. 2002. View Article : Google Scholar : PubMed/NCBI
|
|
2
|
Daisne JF, Duprez T, Weynand B, Lonneux M,
Hamoir M, Reychler H and Grégoire V: Tumor volume in
pharyngolaryngeal squamous cell carcinoma: Comparison at CT, MR
imaging and FDG PET and validation with surgical specimen.
Radiology. 223:93–100. 2004. View Article : Google Scholar
|
|
3
|
Ozawa Y, Hara M, Shibamoto Y, Tamaki T,
Nishio M and Omi K: Utility of high-definition FDG-PET image
reconstruction for lung cancer staging. Acta Radiol. 54:916–920.
2013. View Article : Google Scholar : PubMed/NCBI
|
|
4
|
Paidpally V, Chirindel A, Lam S, Agrawal
N, Quon H and Subramaniam RM: FDG-PET/CT imaging biomarkers in head
and neck squamous cell carcinoma. Imaging Med. 4:633–647. 2012.
View Article : Google Scholar : PubMed/NCBI
|
|
5
|
El-Hafez Abd YG, Moustafa HM, Khalil HF,
Liao CT and Yen TC: Total lesion glycolysis: A possible new
prognostic parameter in oral cavity squamous cell carcinoma. Oral
Oncol. 49:261–268. 2013. View Article : Google Scholar : PubMed/NCBI
|
|
6
|
Lim R, Eaton A, Lee NY, Setton J, Ohri N,
Rao S, Wong R, Fury M and Schöder H: 18F-FDG PET/CT metabolic tumor
volume and total lesion glycolysis predict outcome in oropharyngeal
squamous cell carcinoma. J Nucl Med. 53:1506–1513. 2012. View Article : Google Scholar : PubMed/NCBI
|
|
7
|
Moon SH, Choi JY, Lee HJ, Son YI, Baek CH,
Ahn YC, Park K, Lee KH and Kim BT: Prognostic value of 18F-FDG
PET/CT in patients with squamous cell carcinoma of the tonsil:
Comparisons of volume-based metabolic parameters. Head Neck.
35:15–22. 2013. View Article : Google Scholar : PubMed/NCBI
|
|
8
|
Suzuki H, Fukuyama R, Hasegawa Y, Tamaki
T, Nishio M, Nakashima T and Tatematsu M: Tumor thickness, depth of
invasion and Bcl-2 expression are correlated with FDG-uptake in
oral squamous cell carcinomas. Oral Oncol. 45:891–897. 2009.
View Article : Google Scholar : PubMed/NCBI
|
|
9
|
Suzuki H, Kato K, Fujimoto Y, Itoh Y,
Hiramatsu M, Maruo T, Naganawa S, Hasegawa Y and Nakashima T:
18F-FDG-PET/CT predicts survival in hypopharyngeal squamous cell
carcinoma. Ann Nucl Med. 27:297–302. 2013. View Article : Google Scholar : PubMed/NCBI
|
|
10
|
Xie P, Li M, Zhao H, Sun X, Fu Z and Yu J:
18F-FDG PET or PET/CT to evaluate prognosis for head and neck
cancer: A meta-analysis. J Cancer Res Clin Oncol. 137:1085–1093.
2011. View Article : Google Scholar : PubMed/NCBI
|
|
11
|
Zhang B, Li X and Lu X: Standardized
uptake value is of prognostic value for outcome in head and neck
squamous cell carcinoma. Acta Otolaryngol. 130:756–762. 2010.
View Article : Google Scholar : PubMed/NCBI
|
|
12
|
Park GC, Kim JS, Roh JL, Choi SH, Nam SY
and Kim SY: Prognostic value of metabolic tumor volume measured by
18F-FDG-PET/CT in advanced -stage squamous cell carcinoma of larynx
and hypopharynx. Ann Oncol. 24:208–214. 2013. View Article : Google Scholar : PubMed/NCBI
|
|
13
|
Picchio M, Kirienko M, Mapelli P, Dell'Oca
I, Villa E, Gallivanone F, Gianolli L, Messa C and Castiglioni I:
Predictive value of pre-therapy (18)F-FDG-PET/CT for the outcome of
(18)F-FDG-PET-guided radiotherapy in patients with head and neck
cancer. Eur J Nucl Med Mol Imaging. 41:21–31. 2014. View Article : Google Scholar : PubMed/NCBI
|
|
14
|
Murphy JD, Chisholm KM, Daly ME, Wiegner
EA, Truong D, Iagaru A, Maxim PG, Loo BW Jr, Graves EE, Kaplan MJ,
et al: Correlation between metabolic tumor volume and pathologic
tumor volume in squamous cell carcinoma of the oral cavity.
Radiother Oncol. 101:356–361. 2011. View Article : Google Scholar : PubMed/NCBI
|
|
15
|
Machtay M, Duan F, Siegel BA, Snyder BS,
Gorelick JJ, Reddin JS, Munden R, Johnson DW, Wilf LH, DeNittis A,
et al: Prediction of survival by [18F] fluorodeoxyglucose positron
emission tomography in patients with locally advanced
non-small-cell lung cancer undergoing definitive chemoradiation
therapy: Results of the ACRIN 6668/RTOG 0235 trial. J Clin Oncol.
31:3823–3830. 2013. View Article : Google Scholar : PubMed/NCBI
|
|
16
|
Roh JL, Kim JS, Kang BC, Cho KJ, Lee SW,
Kim SB, Choi SH, Nam SY and Kim SY: Clinical significance of
pretreatment metabolic tumor volume and total lesion glycolysis in
hypopharyngeal squamous cell carcinomas. J Surg Oncol. 110:869–875.
2014. View Article : Google Scholar : PubMed/NCBI
|
|
17
|
Pentenero M, Gandolfo S and Carrozzo M:
Importance of tumor thickness and depth of invasion in nodal
involvement and prognosis of oral squamous cell carcinoma: A review
of the literature. Head Neck. 27:1080–1091. 2005. View Article : Google Scholar : PubMed/NCBI
|
|
18
|
Tomifuji M, Imanishi Y, Araki K, Yamashita
T, Yamamoto S, Kameyama A and Shiotani A: Tumor depth as a
predictor of lymph node metastasis of supraglottic and
hypopharyngeal cancers. Ann Surg Oncol. 18:490–496. 2011.
View Article : Google Scholar : PubMed/NCBI
|
|
19
|
Burri RJ, Rangaswamy B, Kostakoglu L, Hoch
B, Genden EM, Som PM and Kao J: Correlation of positron emission
tomography standard uptake value and pathologic specimen size in
cancer of the head and neck. Int J Radiat Oncol Biol Phys.
71:682–688. 2008. View Article : Google Scholar : PubMed/NCBI
|
|
20
|
Spector JG, Sessions DG, Haughey BH, Chao
KS, Simpson J, El Mofty S and Perez CA: Delayed regional
metastases, distant metastases and second primary malignancies in
squamous cell carcinomas of the larynx and hypopharynx.
Laryngoscope. 111:1079–1087. 2001. View Article : Google Scholar : PubMed/NCBI
|
|
21
|
Shintani S, Matsuura H, Hasegawa Y,
Nakayama B and Hasegawa H: Regional lymph node involvement affects
the incidence of distant metastasis in tongue squamous cell
carcinomas. Anticancer Res. 15:1573–1576. 1995.PubMed/NCBI
|
|
22
|
Takes RP, Strojan P, Silver CE, Bradley
PJ, Haigentz M Jr, Wolf GT, Shaha AR, Hartl DM, Olofsson J,
Langendijk JA, et al: Current trends in initial management of
hypopharyngeal cancer: The declining use of open surgery. Head
Neck. 34:270–281. 2012. View Article : Google Scholar : PubMed/NCBI
|
|
23
|
Hall SF, Groome PA, Irish J and O'Sullivan
B: The natural history of patients with squamous cell carcinoma of
the hypopharynx. Laryngoscope. 118:1362–1371. 2008. View Article : Google Scholar : PubMed/NCBI
|
|
24
|
Hauswald H, Simon C, Hecht S, Debus J and
Lindel K: Long-term outcome and patterns of failure in patients
with advanced head and neck cancer. Radiat Oncol. 6:702011.
View Article : Google Scholar : PubMed/NCBI
|
|
25
|
Sobins LH and Wittekind C: TNM
Classification of Malignant Tumours (6th). Wiley and Sons. New
York, NY: 2002.
|
|
26
|
Nakahara R, Kodaira T, Furutani K,
Tachibana H, Tomita N, Inokuchi H, Mizoguchi N, Goto Y, Ito Y and
Naganawa S: Treatment outcomes of definitive chemoradiotherapy for
patients with hypopharyngeal cancer. J Radiat Res. 53:906–915.
2012. View Article : Google Scholar : PubMed/NCBI
|