Introduction
The main obstacle to successful chemotherapy is
multidrug resistance, which involves the development of resistance
to multiple chemotherapeutic agents with different structures and
mechanisms of action following exposure to a single
chemotherapeutic agent or even upon initial exposure (1). Tumor chemotherapy resistance is a
complex multifactor-mediated process, and the numerous mechanisms
involved include abnormal expression of ATP-dependent transporters
on the cell membrane, enhancement of cell detoxification and
dysregulation of apoptosis-associated mechanisms (2,3). A
thorough understanding of the mechanisms of tumor resistance may
provide a tool for overcoming the aforementioned, and based on a
growing body of research into the genetic diversity among
chemotherapy-resistant cell lines and clinical resistance, tumor
chemosensitivity appears to be controlled by complex molecular
networks.
Network approaches have been employed to study the
development of various diseases, such as cancer and metabolic
disease, bridging the gap from individual genes to the occurrence
and development of a disease by examining the associations between
differentially expressed genes (DEGs) (4,5). In the
present study, bioinformatics analysis was used to reveal common
properties of DEGs between chemoresistant and chemosensitive tumors
across multiple cancers. A total of five co-expressed genes were
identified and their biological functions examined. In addition,
weighted gene co-expression network analysis (WGCNA) was applied
and 14 modules were identified in estrogen receptor-negative breast
cancer (EBC), 8 in ovarian cancer (OVC), 6 in rectal cancer (RC),
and 1 in gastric cancer (GC), and the differences in these modules
among these tumors were examined. Therefore, the present study
proposes a systematic context for identifying candidate genes that
may be useful in the study of chemoresistance. Furthermore, the
construction of a co-expression network of weighted genes is an
effective approach for associating differences in gene expression
with insights into key functional chemosensitivity mechanisms.
Materials and methods
Microarray data and differential
expression analysis
To investigate the genes involved in
chemoresistance, Gene Expression Omnibus (GEO) database was
searched comprehensively, and microarray data from human EBC, OVC,
RC and GC were collected from four published studies (6–9). All raw
data from these studies consist of RNA sequencing (RNA-Seq)
datasets for the study of tumor chemotherapeutic resistance and are
available in Gene Expression Omnibus (GEO), including 120 samples
in GSE16446 (6), 58 samples in
GSE30161 (7), 80 samples in GSE45404
(8) and 44 samples in GSE14209
(9) (ncbi.nlm.nih.gov/geo/). EBC, OVC and RC samples were
analyzed using Affymetrix HG-U133_Plus_2 microarrays (ncbi.nlm.nih.gov/geo/query/acc.cgi?acc=GPL570);
GC samples were analyzed using Affymetrix HG-U133A_2 microarrays
(ncbi.nlm.nih.gov/geo/query/acc.cgi?acc=GPL571).
Samples where the chemotherapy effects were not clearly stated were
removed.
The GSE16446, GSE30161, GSE45404 and GSE14209
datasets were screened using the GEO2R tool (ncbi.nlm.nih.gov/geo/geo2r/) to identify DEGs between
chemoresistant and chemosensitive tumors (6–9).
P<0.05 was used to define a gene as a DEG.
Functional enrichment analysis
Database for Annotation, Visualization and
Integrated Discovery (DAVID) v6.8 (david-d.ncifcrf.gov/) was used to analyze functional
enrichment among DEGs (10,11). Four representative terms from the top
10 most significant Gene Ontology (GO) biological process (BP)
terms were analyzed for each cancer. In addition, only those Kyoto
Encyclopedia of Genes and Genomes (KEGG) pathways with P≤0.05 and
≥10 enriched genes were considered significant.
WGCNA
For each dataset, chemoresistant samples and DEGs
were firstly checked with many missing values and the samples were
subsequently clustered to identify obvious outliers. Following the
removal of such samples, Pearson correlation coefficients were
calculated for all pairwise comparisons of DEGs. A similarity
(correlation) matrix was obtained using a power function
(connection strength=|correlation|β), and a WGCNA was
constructed with power values of 12 in EBC, 8 in OVC, 8 in RC and 5
in GC. Modules were obtained from four types of tumors using a
dynamic tree-cutting algorithm (12), and genes that were not assigned to
modules were assigned the color gray. Due to the large amount of
genetic analysis, additional steps were performed for each module,
and WGCNA was employed to construct protein-protein interaction
(PPI) networks based on the signed Pearson (12). Detailed R software code (https://labs.genetics.ucla.edu/horvath/htdocs/CoexpressionNetwork/Rpackages/WGCNA/)
and tutorials were used for generating co-expression networks for
weighted genes (12).
Statistical analysis and
visualization
Statistical analysis was performed using R-3.3.1
(https://www.r-project.org). The majority
of visualizations were generated using R, except for KEGG network
visualization, for which the (version 3.3.0; cytoscape.org/) and ClueGO tools (version 2.5.0) were
used (13,14). For visualization of KEGG networks,
the top five (top four for GC) were selected for each cancer to
analyze pivotal links between KEGG pathways.
Results
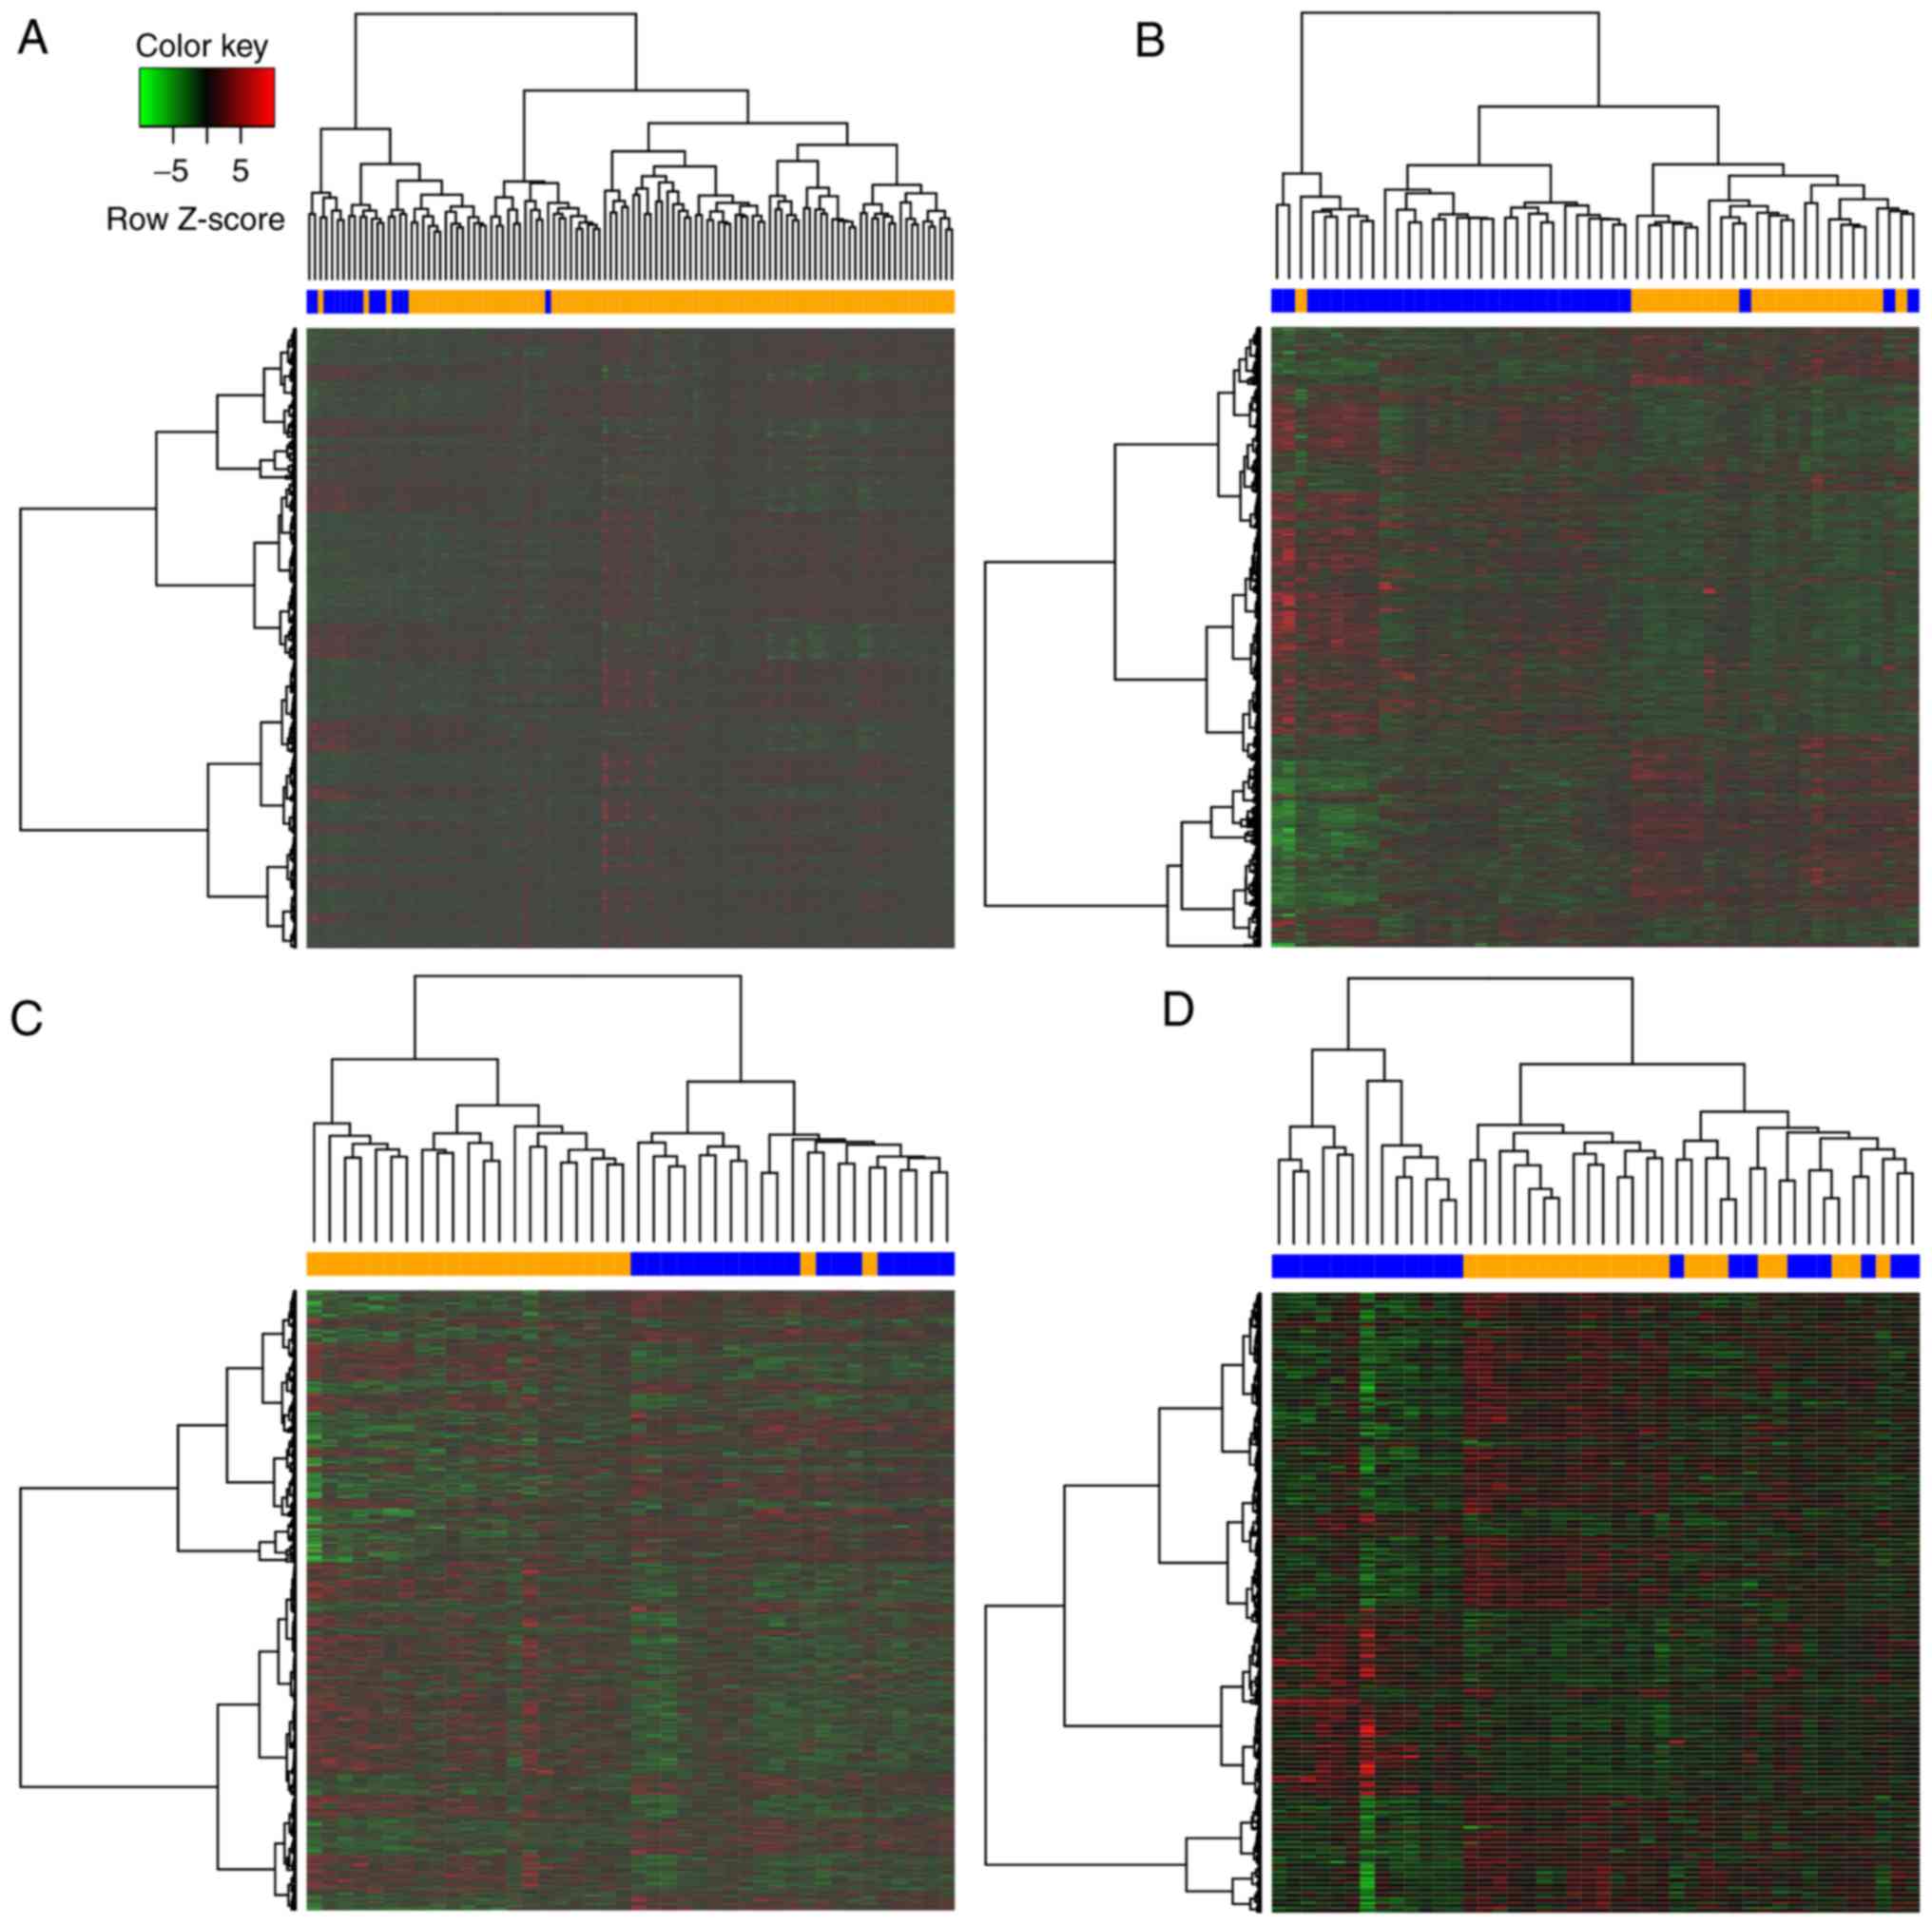
DEGs
DEGs between chemoresistant and -sensitive samples
were analyzed based on the criterion of P<0.05 and a total of
6,015, 2,074, 2,141 and 954 DEGs were identified in EBC, OVC, RC
and GC, respectively. Hierarchical cluster analysis was also
performed to obtain an overview of the profile for DEGs in each
cancer (Fig. 1). All heat maps
revealed separation if DEGs between chemoresistant and
chemosensitive samples.
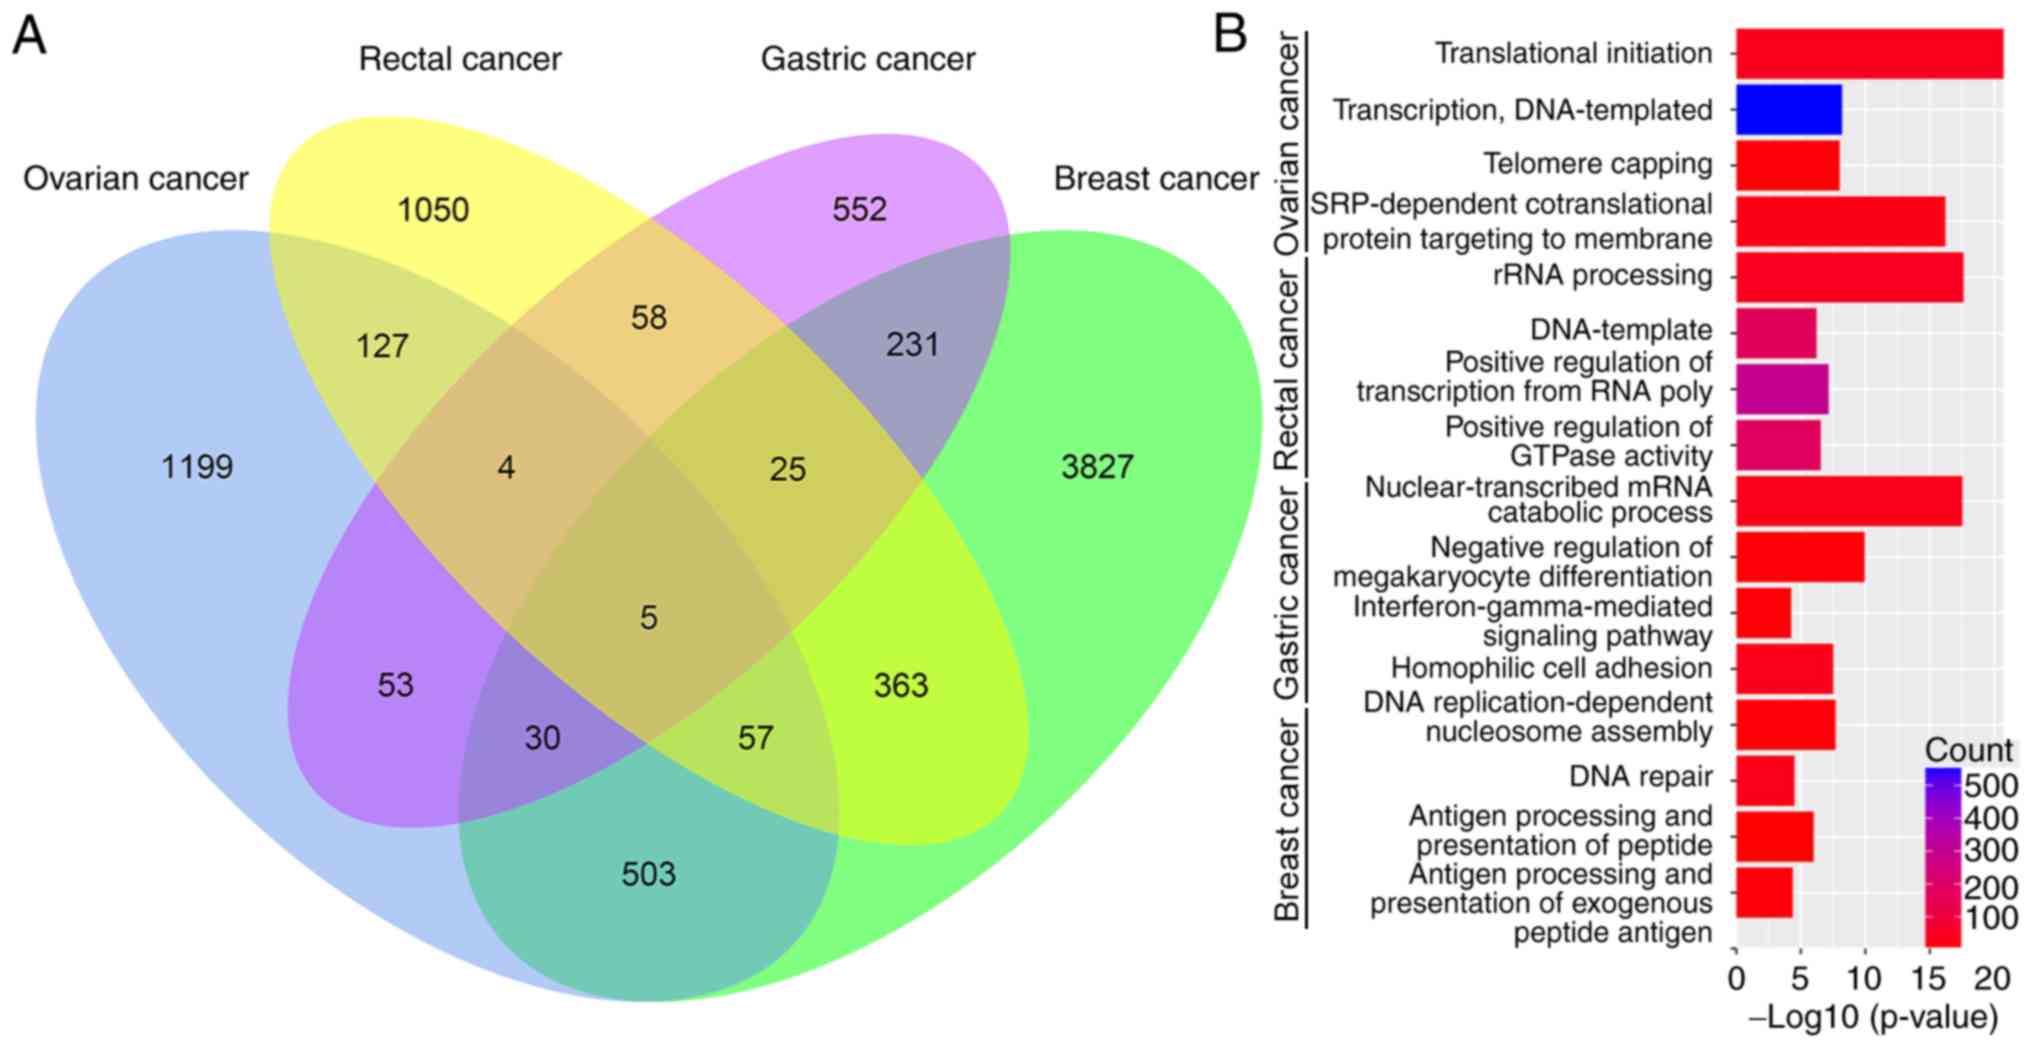
Among all DEGs, 1,335 genes were differentially
expressed between any two of the cancer types. Only 121 DEGs were
altered in more than two types of cancer (Fig. 2A). Among these 121 DEGs, the
following five were dysregulated in all four cancer types examined
(Fig. 2A):
Calcium-calmodulin-dependent protein kinase kinase 2 (CaMKK2),
erythropoietin receptor (EPOR), mitochondrial poly(A) RNA
polymerase (MTPAP), α-parvin (PARVA) and zinc finger and BTB
domain-containing protein 44 (ZBTB44).
Functional enrichment analysis
To reveal the biological significance of DEGs in
regulating cancer chemoresistance at the unitary level, DAVID v6.7
was used to perform biofunctional enrichment analysis for each
tumor type, including GO BP terms, GO cellular component terms, GO
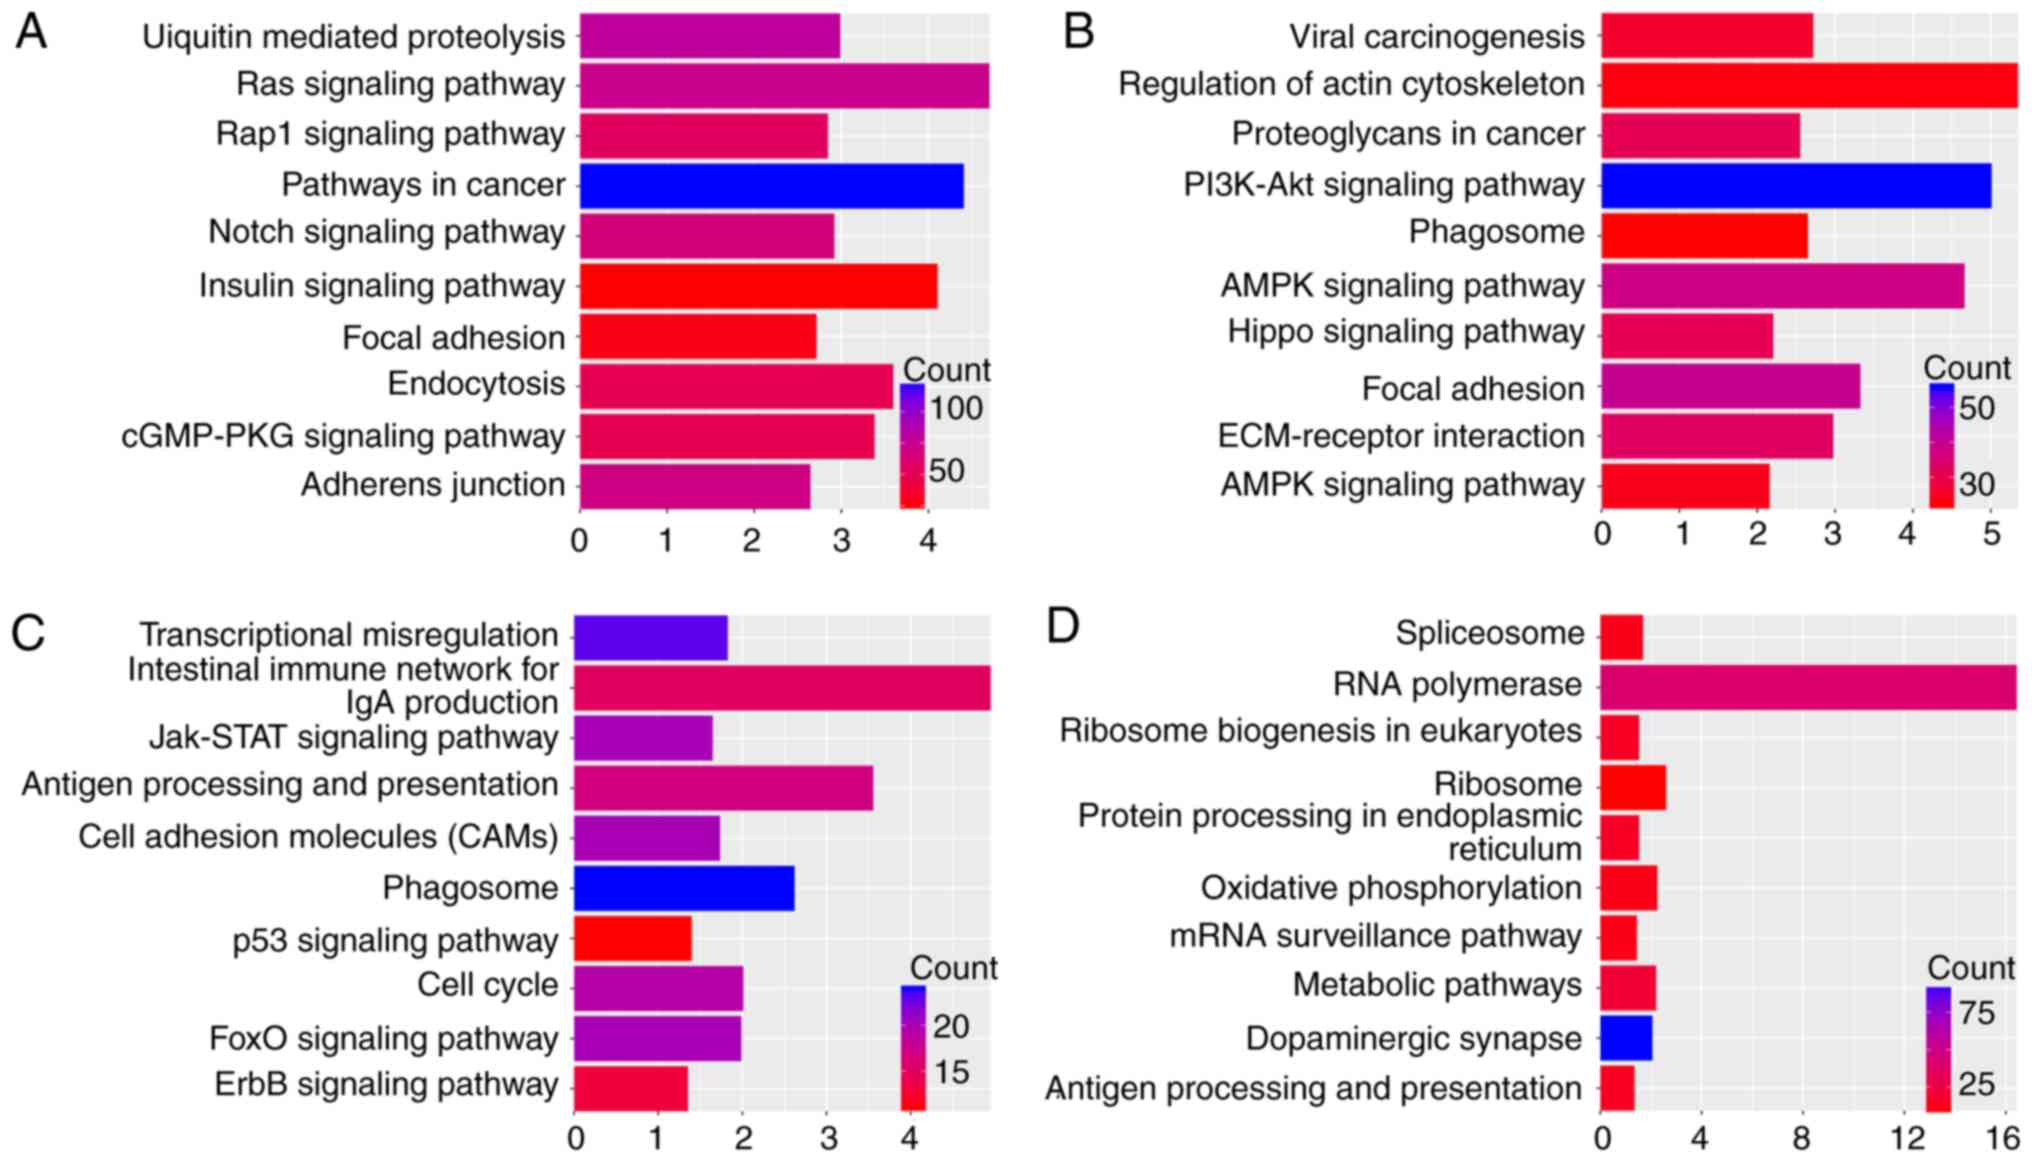
molecular functions terms and KEGG pathways. Fig. 2B displays four representative BP
terms for each tumor type. Fig. 3
lists the top 10 KEGG pathways with P≤0.05 and enriched gene counts
≥10 for each tumor type.
The DEGs were divided into two sections according to
major biological processes. On the one hand, as observed in
Fig. 2B, the DEGs in the four tumors
were significantly enriched in processes associated with DNA
replication, transcription and regulation of these pathways. On the
other hand, a number of chemoresistance-associated genes were
enriched in pathways involved in immune activity and stimulation,
including pathways associated with antigen processing and
presentation via MHC class II and negative regulation of
megakaryocyte differentiation. Based on the cellular component and
molecular function terms that DEGs' were enriched in (data not
shown), the main functional sites and specific effects of the DEGs
appear to be involved in the regulation of tumor chemotherapy
resistance.
DAVID-based enrichment analysis identified KEGG
pathways for the DEGs among the four types of tumors (Fig. 3), including some carcinogenic
signaling pathways, including the Notch, RAP1 GTPase-activating
protein 1, mitogen-activated protein kinase (MAPK) and PI3K-AKT
pathways. Despite that associations between these pathways and
chemoresistance have already been established (15–17), the
approach of the present analysis systematically identified the
biological functions of DEGs involved. In addition, within defined
KEGG pathways, immune response-associated pathways were indicated
to be associated with chemoresistance in tumors via processes,
including antigen processing and presentation. In particular,
different mechanisms of chemoresistance were identified in the
individual tumor types. For instance, cell adhesion, including
extracellular matrix (ECM)-receptor interactions and focal
adhesions, was indicated to be associated with the regulation of
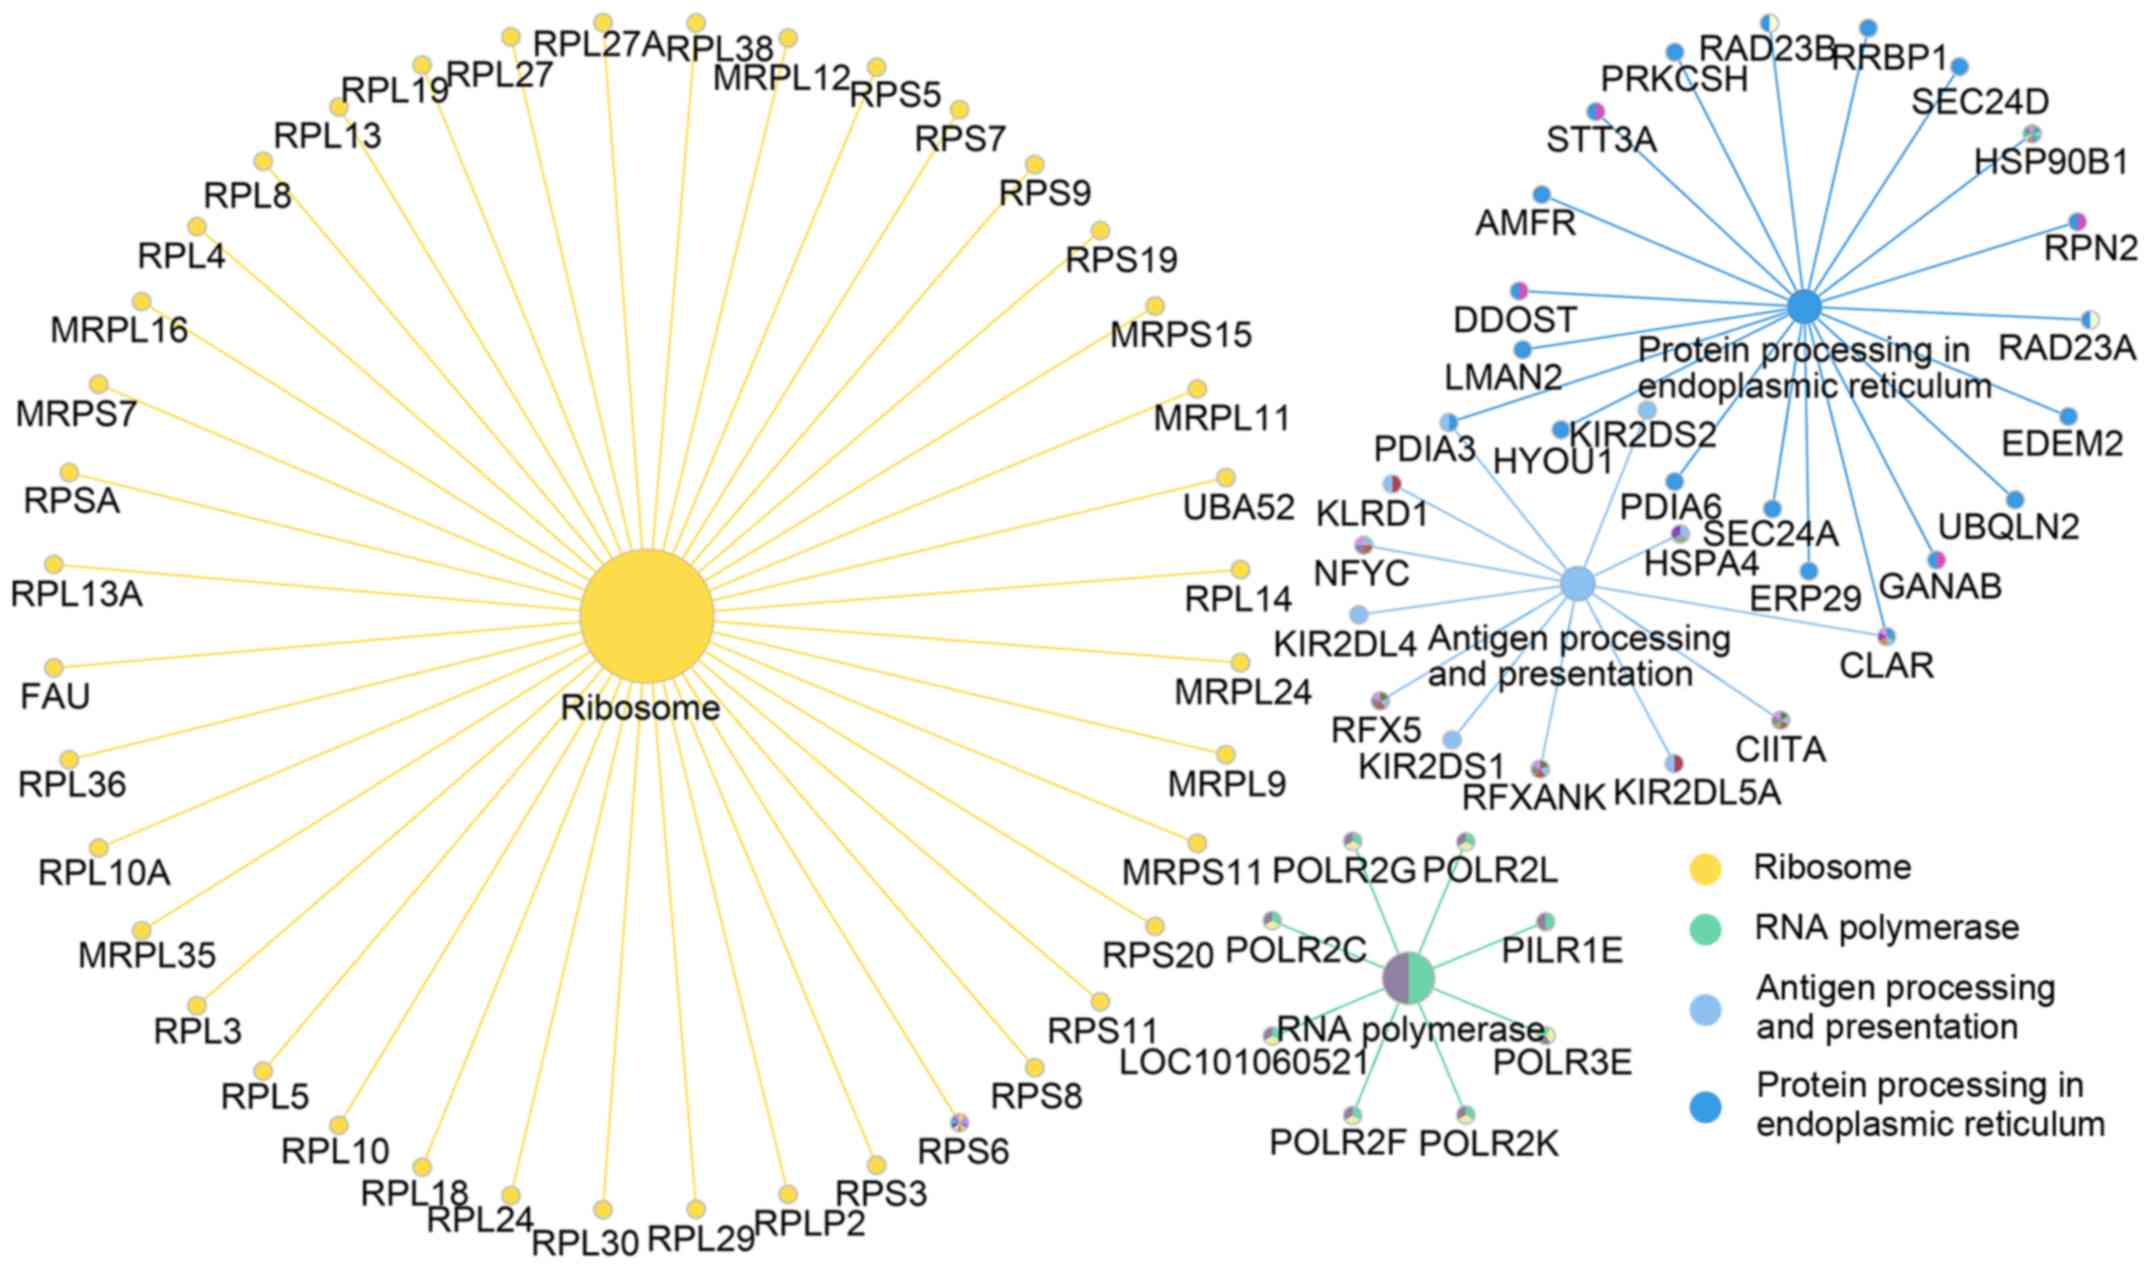
drug resistance in OVC. To further visualize these associations
between the DEGs in KEGG pathways, a KEGG signaling pathway map was
generated, which revealed that a number of genes constitute pivotal
links between KEGG pathways (Fig.
4). In addition, it was indicated that nodes involved in the
formation of tumor chemoresistance are simultaneously involved in
multiple KEGG pathways (Table
I).
 | Table I.Key genes involved in multiple KEGG
pathways in four types of cancer. |
Table I.
Key genes involved in multiple KEGG
pathways in four types of cancer.
| Tumor type | Key genes |
|---|
| Estrogen
receptor-negative breast cancer | AKT2, AKT3,
MAPK3, PIK3CD, CBLB, PIK3R2, BRAF, MAP2K2, DVL3, CTBP1, EP300,
DVL2, CREBBP, MDM2, PML2, VHL, XIAP, ELOB, DIAS2 BIRC2,SOCS3,
SOCS1, ARAF, PRKACA SOS1, CALM3, CALM2, PRKCZ, INSR INS, RAPGEF1,
CALM1, CALM6, PGF FGF7, FGF18, VEGFB, RAC1, ADCY1 EGFR, CTNNB1,
ADCY8, HGF, FGF10, LPAR5, ITGB1, FGFR2, RASGRP2, GNAS, RALGDS,
FGFR1, RALB, VEGFA, FGF12, ADCY2, LPAR3, ITGA2B, LPAR2, RASSF5 |
| Ovarian cancer | CDC42, AKT2,
SOS2, PIK3CB, COL6A3, LAMC1, COL1A1, COL6A1, FN1, LAMB1, ITGA3,
THBS2, ITGB4, COL4A1, LAMA4, ITGB1, ITGB5, ITGA1, ITGB6, ITGA1,
ITGB6, ITGB8, ITGA2B, COL9A2, JUN, TNXB, FGF14, FGF12, RASGRF1,
GNG12, FGF23, FGF18, FGF7, YWHAZ, CREB3L1, MDM2, YWHAB, ACTN1, SYK,
PGF, HGF, MET |
| Rectal cancer | HLA-DQA1,
HLA-DPA1, HLA-DRB5, HLA-DRB4, HLA-DQA2, HLA-DPB1, HLA-DRA,
HLA-DRB3, HLA-DRB1, CCND2, ATM, CDKN1A, CDK2, CALR, TAP2 |
| Gastric cancer | PDIA3, CALR |
Gene co-expression networks
Identifying genes with highly correlated expression
levels may help elucidate shared biological processes or common
regulatory mechanisms that could be targeted (18,19).
Therefore, DEGs between chemoresistant and chemosensitive tumors
were investigated by applying WGCNA to microarray datasets for four
types of tumors. To ensure high-quality data, strict quality
control procedures were implemented to eliminate non-specific and
mis-targeted probes on the microarray and to remove outlier samples
from the dataset prior to generating expression values (data not
shown). To facilitate the identification of gene modules (groups of
highly co-expressed genes), a WGCN based on pairwise Pearson
correlations was constructed for DEGs for these four types of
cancer. The WGCNA was intended to identify modules with highly
topologically overlapping co-expressed genes, and a pairwise
approach was applied to describe the similarity of two co-expressed
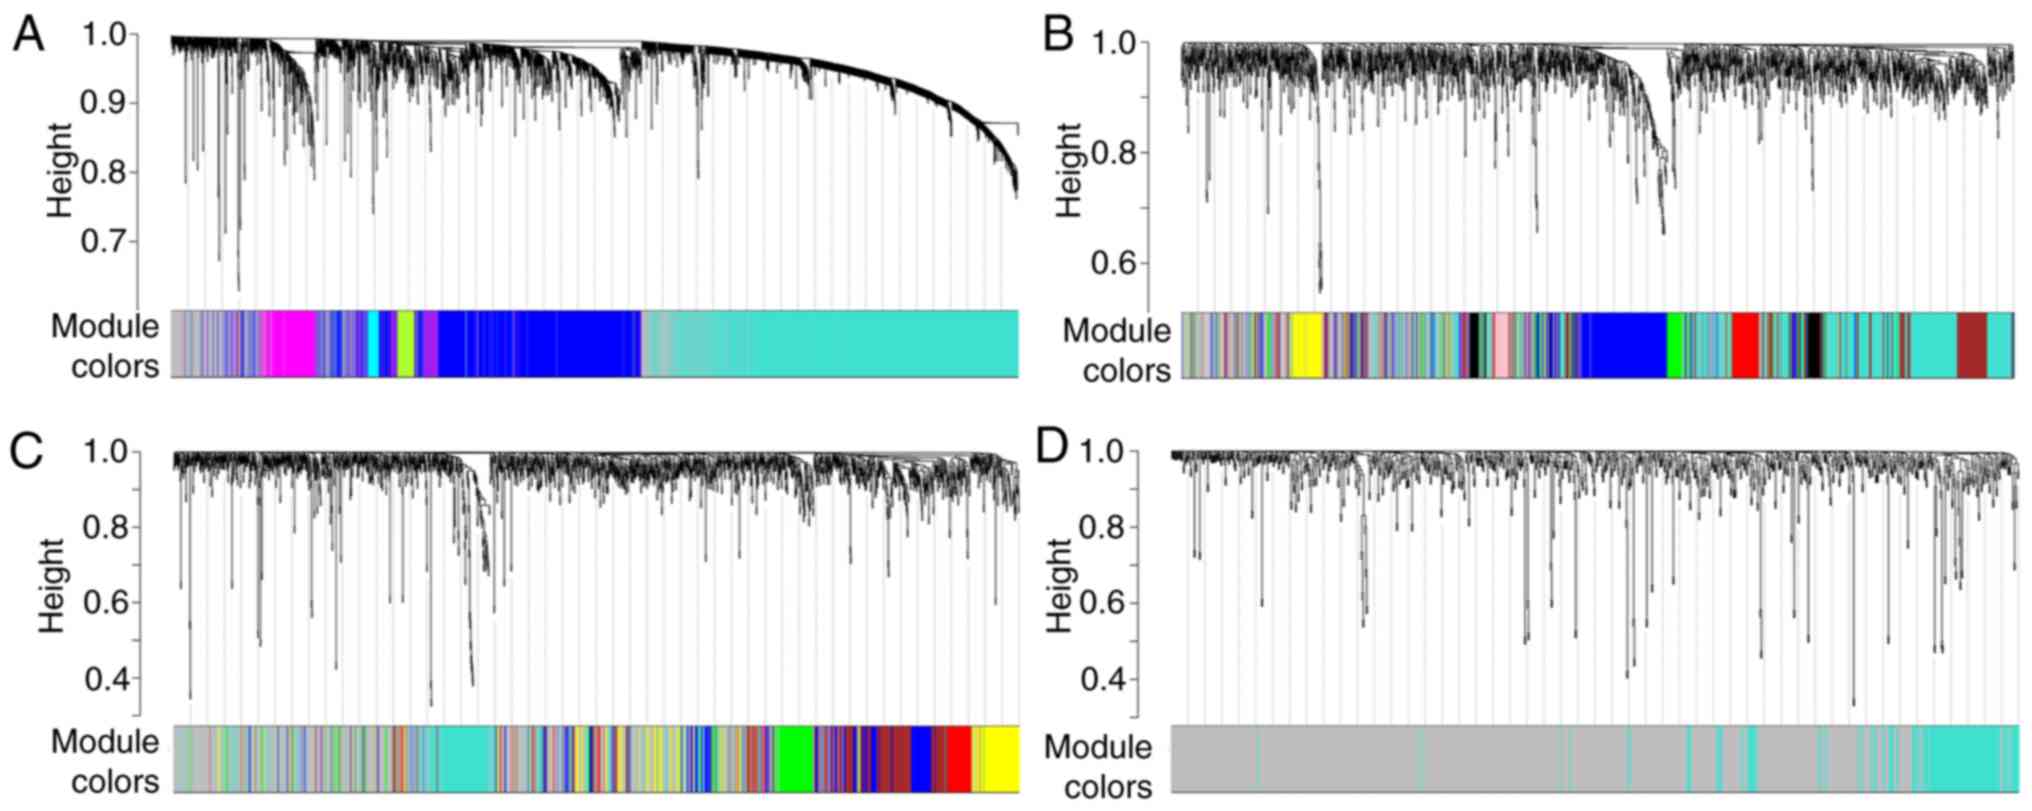
genes with all other genes in the network. The highest number of
modules for gene co-expression was for EBC samples, with 14 genes;
in contrast, the lowest number of modules was obtained for GC
samples, with only one. Eight and six gene co-expression modules
were generated for OVC and RC samples, respectively (Fig. 5). Each model across the four types of
tumors included ≥30 genes.
Highly relevant hub genes are thought to serve an
important role in the biological behavior of tissues, and central
hub genes in a network are more likely to be key drivers of
aberrant behavior compared with peripheral genes (12,20).
Therefore, the hub genes were identified for each module of the
four tumor types and the top 30 nodes for that module were
subsequently selected with the highest degree as the central gene.
To visualize these results, a list of the network diagrams of these
hub genes was compiled for each of the modules (data not shown).
The centrality of the ‘hub’ genes obtained indicates that they may
serve roles that are more crucial in the generation of
chemoresistance compared with other genes in that module. The gene
with the highest degree from each module is listed in Table II. Among them, the hub gene type I
collagen α1 (COL1A1) is involved in the PI3K-AKT signaling pathway,
focal adhesions and ECM-receptor interactions. The hub gene
fibroblast growth factor 14 (FGF14) is associated with both the
PI3K-AKT signaling pathway and the MAPK signaling pathway. The hub
gene major histocompatibility complex, class II, DR β1 (HLA-DRB1)
is associated with the phagosome, antigen processing and
presentation and the intestinal immune network for IgA production.
In addition, MTPAP was differentially expressed among the four
tumors and was also the hub gene in one of the models.
| Table II.The gene with the highest degree from
each module of four cancer types. |
Table II.
The gene with the highest degree from
each module of four cancer types.
| Tumor type | Genes with the
highest degree |
|---|
| Estrogen
receptor-negative | ZMYM2, DCAF15,
ZNF160, ERBB2, PARD3, ACAN, VANT, BAG6, PIK3C2A, |
| breast cancer | CNTROB, GTF3C2,
ARPC5L, PDE2A, FASTK |
| Ovarian cancer | PAK7, COL1A1,
SEMA3A, NEAT1, FGF14, MALAT1, MYH14, WSB1 |
| Rectal cancer | RPAP3, MTPAP,
HLA-DRB1, EIF5, RPS16, FBXO7 |
| Gastric cancer | RPL3 |
Discussion
Although an increasing number of studies have
revealed the important roles served by certain genes and signaling
pathways in the development of tumor chemoresistance (21–24), the
roles of a number of potential chemoresistance-associated genes
have not yet been uncovered. The purpose of the current study was
to mine the RNA-Seq data from patients with chemoresistant tumors
in GEO using WGCNA to identify potential genes associated with
chemoresistance. DEGs were screened for four types of
chemoresistant tumors using the GEO2R tool and functional
enrichment analysis was used to examine the biological importance
of the DEGs identified. Furthermore, a gene network was constructed
using WGCNA to identify hub genes.
The majority of the DEGs identified in this study,
to the best of our knowledge, have not been previously reported to
be associated with chemotherapy-resistant cancers. During
differential expression analysis, it was indicated that only five
genes were differentially expressed in all four types of tumors,
indicating varying mechanisms of chemoresistance among tumor types.
When consulting previous studies, it was indicated that all five of
these oncogenes have been reported to be involved in tumorigenesis.
In prostate cancer, the CaMKK2-AMP-activated protein kinase axis
controls glucose metabolism, tumor cell growth and migration
(25). A number of studies have also
reported that CaMKK2 is located at the top of the key molecular
node that shapes the cancer ecosystem, highlighting that it is a
potential candidate for therapeutic cancer intervention (25,26).
Studies of EPOR signaling cascades in tumor cells have revealed
that numerous patients with cancer are anemic, with persistent and
worsening effects (27). MTPAP
governs 3′ nucleotide addition to microRNAs (miRNAs) in a
miRNA-specific manner and can influence miRNA stability and
efficiency for target repression (28). PARVA localizes to focal adhesions and
serves critical roles in a number of cellular functions, including
regulation of cytoskeletal activity in connection with the ECM,
with involvement by paxillin and integrin-linked kinase (29). The transcriptional regulator ZBTB44
interacts with Smad pathway proteins, including Smad-specific E3
ubiquitin ligase 2, mediating resistance to MAPK pathway inhibitors
(30). However, these five DEGs have
only been studied in individual cancer types; therefore, no
experimental evidence or clinical data, to the best of our
knowledge, exist to support their associations with cancer
chemoresistance. The expression levels of individual genes differed
across the four types of tumor, again confirming that the same gene
may induce chemoresistance through differential mechanisms in
different tumors. A limitation of the present study however is that
these five DEGs were not further validated in cells or tissues.
According to functional enrichment analysis,
multiple processes associated with gene expression and regulation
and classical tumor signaling pathways were enriched, including
many carcinogenic signals (31).
These findings indicate that aberrant growth signals regulate the
cell cycle and cell growth (32,33), and
also promote chemotherapy resistance. Research on these DEGs has
partially demonstrated that transcription factor forkhead box 3 and
hepatocyte growth factor are highly expressed in tumors and are
closely associated with chemosensitivity, indicating that they may
serve as indicators of prognosis and chemotherapy efficacy
(34,35). Despite a number of studies having
reported that genomic stability has an important function in the
development of tumor resistance (36–38), the
function of the majority of chemoresistance-associated genes has
yet to be revealed. The analysis in the present suggests that
during the formation of tumor chemotherapy tolerance, DEGs have an
important role in the most fundamental functions, including gene
expression and regulation, providing further support of previous
findings (34,35). In addition, BP and KEGG pathway
analyses of DEGs confirmed the important link between tumor immune
function and chemoresistance. Previous studies have reported only
individual mechanisms, for instance, macrophage-derived cathepsin
regulation of tumor progression and direct regulation of tumor cell
chemoresistance (39,40). In addition, expression of CXC
chemokine receptor 4 may contribute to tumor cell immune escape,
potentially affecting tumor chemosensitivity (34). Based on the aforementioned results of
previous studies, targeting the activity and pathways associated
with DEGs via conventional chemotherapy is clinically important,
since this approach may facilitate the combination with other
immunotherapies to achieve maximum antitumor efficacy during
clinical treatment.
Predictive networks have the potential to identify
hundreds of genes that drive disease and can serve as points for
therapeutic intervention (41). Our
results offer a number of such gene targets. In KEGG analysis, it
was indicated that multiple genes serve important roles in
divergent signaling pathways, indicating that deregulation of these
genes affects multiple tumor signatures, which may help in
establishing the therapeutic potential of the target genes in these
pathways in clinical settings. Furthermore, multiple PPI networks
were constructed for different tumors using WGCNA and hub genes
were screened via large-scale molecular analysis. The combined KEGG
analysis and PPI network revealed that COL1A1, FGF14 and HLA-DRB1
are simultaneously involved in multiple signaling pathways and
likely serve key roles in the development of chemoresistance.
Furthermore, the current results suggest that a number of genes and
signaling pathways have not yet been fully investigated and that
their potential association with chemoresistance requires further
validation. Further targeting of these genes in disease may,
ultimately, involve targeting the entire network, as opposed to
current therapeutic strategies that focus on one or two genes
only.
In conclusion, the present study comprehensively
examined the chemoresistance-associated genes and investigated the
functions of these genes across multiple cancers based on RNA-Seq
data. Despite that the biological significance of unreported DEGs
in the development of tolerance to tumor chemotherapy warrants
further evaluation, the findings of the present study propose a
simple and effective strategy to identify genes involved in
chemoresistance and to predict their potential functional roles,
which may be useful for guiding subsequent experimental and
therapeutic designs.
Acknowledgements
Not applicable.
Funding
This work was supported by the National Natural
Science Foundation of China (grant no. 81572411).
Availability of data and materials
The datasets used during the present study are
available from Gene Expression Omnibus (GSE16446, GSE30161,
GSE45404 and GSE14209 at ncbi.nlm.nih.gov/geo/). The datasets used and/or
analyzed during the current study are available from the
corresponding author on reasonable request.
Authors' contributions
JG and WS conceived and designed the study. JY also
participated in the design of the study and further conducted the
data analysis. LT and ZY also participated in the data analysis. KT
and GW checked the data, proposed suggestions for improvement and
edited the manuscript. All authors read and approved the final
manuscript.
Ethics approval and consent to
participate
Not applicable.
Patient consent for publication
Not applicable.
Competing interests
The authors declare that they have no competing
interests.
References
|
1
|
Zhang D and Fan D: New insights into the
mechanisms of gastric cancer multidrug resistance and future
perspectives. Future Oncol. 6:527–537. 2010. View Article : Google Scholar : PubMed/NCBI
|
|
2
|
Kathawala RJ, Gupta P, Ashby CR Jr and
Chen ZS: The modulation of ABC transporter-mediated multidrug
resistance in cancer: A review of the past decade. Drug Resist
Updat. 18:1–17. 2015. View Article : Google Scholar : PubMed/NCBI
|
|
3
|
Holohan C, Van Schaeybroeck S, Longley DB
and Johnston PG: Cancer drug resistance: An evolving paradigm. Nat
Rev Cancer. 13:714–726. 2013. View
Article : Google Scholar : PubMed/NCBI
|
|
4
|
Yook SH, Oltvai ZN and Barabási AL:
Functional and topological characterization of protein interaction
networks. Proteomics. 4:928–942. 2004. View Article : Google Scholar : PubMed/NCBI
|
|
5
|
Barabási AL and Oltvai ZN: Network
biology: Understanding the cell's functional organization. Nat Rev
Genet. 5:101–113. 2004. View
Article : Google Scholar : PubMed/NCBI
|
|
6
|
Desmedt C, Di Leo A, de Azambuja E,
Larsimont D, Haibe-Kains B, Selleslags J, Delaloge S, Duhem C,
Kains JP, Carly B, et al: Multifactorial approach to predicting
resistance to anthracyclines. J Clin Oncol. 29:1578–1586. 2011.
View Article : Google Scholar : PubMed/NCBI
|
|
7
|
Ferriss JS, Kim Y, Duska L, Birrer M,
Levine DA, Moskaluk C, Theodorescu D and Lee JK: Multi-gene
expression predictors of single drug responses to adjuvant
chemotherapy in ovarian carcinoma: Predicting platinum resistance.
PLoS One. 7:e305502012. View Article : Google Scholar : PubMed/NCBI
|
|
8
|
Agostini M, Zangrando A, Pastrello C,
D'Angelo E, Romano G, Giovannoni R, Giordan M, Maretto I, Bedin C,
Zanon C, et al: A functional biological network centered on XRCC3:
A new possible marker of chemoradiotherapy resistance in rectal
cancer patients. Cancer Biol Ther. 16:1160–1171. 2015. View Article : Google Scholar : PubMed/NCBI
|
|
9
|
Kim HK, Choi IJ, Kim CG, Kim HS, Oshima A,
Michalowski A and Green JE: A gene expression signature of acquired
chemoresistance to cisplatin and fluorouracil combination
chemotherapy in gastric cancer patients. PLoS One. 6:e166942011.
View Article : Google Scholar : PubMed/NCBI
|
|
10
|
Huang da W, Sherman BT and Lempicki RA:
Bioinformatics enrichment tools: Paths toward the comprehensive
functional analysis of large gene lists. Nucleic Acids Res.
37:1–13. 2009. View Article : Google Scholar : PubMed/NCBI
|
|
11
|
Huang da W, Sherman BT and Lempicki RA:
Systematic and integrative analysis of large gene lists using DAVID
bioinformatics resources. Nat Protoc. 4:44–57. 2009. View Article : Google Scholar : PubMed/NCBI
|
|
12
|
Langfelder P and Horvath S: WGCNA: An R
package for weighted correlation network analysis. BMC
Bioinformatics. 9:5592008. View Article : Google Scholar : PubMed/NCBI
|
|
13
|
Bindea G, Mlecnik B, Hackl H, Charoentong
P, Tosolini M, Kirilovsky A, Fridman WH, Pagès F, Trajanoski Z and
Galon J: ClueGO: A Cytoscape plug-in to decipher functionally
grouped gene ontology and pathway annotation networks.
Bioinformatics. 25:1091–1093. 2009. View Article : Google Scholar : PubMed/NCBI
|
|
14
|
Bindea G, Galon J and Mlecnik B: CluePedia
Cytoscape plugin: Pathway insights using integrated experimental
and in silico data. Bioinformatics. 29:661–663. 2013. View Article : Google Scholar : PubMed/NCBI
|
|
15
|
Du X, Zhao YP, Zhang TP, Zhou L, Chen G,
Wang TX, You L and Shu H: Alteration of the intrinsic apoptosis
pathway is involved in Notch-induced chemoresistance to gemcitabine
in pancreatic cancer. Arch Med Res. 45:15–20. 2014. View Article : Google Scholar : PubMed/NCBI
|
|
16
|
Grossi V, Peserico A, Tezil T and Simone
C: p38α MAPK pathway: A key factor in colorectal cancer therapy and
chemoresistance. World J Gastroenterol. 20:9744–9758. 2014.
View Article : Google Scholar : PubMed/NCBI
|
|
17
|
Yuan J, Yin Z, Tao K, Wang G and Gao J:
Function of insulin-like growth factor 1 receptor in cancer
resistance to chemotherapy. Oncol Lett. 15:41–47. 2018.PubMed/NCBI
|
|
18
|
Bystrykh L, Weersing E, Dontje B, Sutton
S, Pletcher MT, Wiltshire T, Su AI, Vellenga E, Wang J, Manly KF,
et al: Uncovering regulatory pathways that affect hematopoietic
stem cell function using ‘genetical genomics’. Nat Genet.
37:225–232. 2005. View
Article : Google Scholar : PubMed/NCBI
|
|
19
|
Schadt EE, Lamb J, Yang X, Zhu J, Edwards
S, Guhathakurta D, Sieberts SK, Monks S, Reitman M, Zhang C, et al:
An integrative genomics approach to infer causal associations
between gene expression and disease. Nat Genet. 37:710–717. 2005.
View Article : Google Scholar : PubMed/NCBI
|
|
20
|
Yang Y, Han L, Yuan Y, Li J, Hei N and
Liang H: Gene co-expression network analysis reveals common
system-level properties of prognostic genes across cancer types.
Nat Commun. 5:32312014. View Article : Google Scholar : PubMed/NCBI
|
|
21
|
Marin JJ, Briz O, Monte MJ, Blazquez AG
and Macias RI: Genetic variants in genes involved in mechanisms of
chemoresistance to anticancer drugs. Curr Cancer Drug Targets.
12:402–438. 2012. View Article : Google Scholar : PubMed/NCBI
|
|
22
|
Delitto D, Vertes-George E, Hughes SJ,
Behrns KE and Trevino JG: c-Met signaling in the development of
tumorigenesis and chemoresistance: Potential applications in
pancreatic cancer. World J Gastroenterol. 20:8458–8470. 2014.
View Article : Google Scholar : PubMed/NCBI
|
|
23
|
Yuan X, Wu H, Xu H, Xiong H, Chu Q, Yu S,
Wu GS and Wu K: Notch signaling: An emerging therapeutic target for
cancer treatment. Cancer Lett. 369:20–27. 2015. View Article : Google Scholar : PubMed/NCBI
|
|
24
|
Sui X, Kong N, Ye L, Han W, Zhou J, Zhang
Q, He C and Pan H: p38 and JNK MAPK pathways control the balance of
apoptosis and autophagy in response to chemotherapeutic agents.
Cancer Lett. 344:174–179. 2014. View Article : Google Scholar : PubMed/NCBI
|
|
25
|
Racioppi L: CaMKK2: A novel target for
shaping the androgen-regulated tumor ecosystem. Trends Mol Med.
19:83–88. 2013. View Article : Google Scholar : PubMed/NCBI
|
|
26
|
Lin F, Marcelo KL, Rajapakshe K, Coarfa C,
Dean A, Wilganowski N, Robinson H, Sevick E, Bissig KD, Goldie LC,
et al: The camKK2/camKIV relay is an essential regulator of hepatic
cancer. Hepatology. 62:505–520. 2015. View Article : Google Scholar : PubMed/NCBI
|
|
27
|
Buemi M, Caccamo C, Nostro L, Cavallaro E,
Floccari F and Grasso G: Brain and cancer: The protective role of
erythropoietin. Med Res Rev. 25:245–259. 2005. View Article : Google Scholar : PubMed/NCBI
|
|
28
|
Wyman SK, Knouf EC, Parkin RK, Fritz BR,
Lin DW, Dennis LM, Krouse MA, Webster PJ and Tewari M:
Post-transcriptional generation of miRNA variants by multiple
nucleotidyl transferases contributes to miRNA transcriptome
complexity. Genome Res. 21:1450–1461. 2011. View Article : Google Scholar : PubMed/NCBI
|
|
29
|
Sepulveda JL and Wu C: The parvins. Cell
Mol Life Sci. 63:25–35. 2006. View Article : Google Scholar : PubMed/NCBI
|
|
30
|
Garrisi VM, Strippoli S, De Summa S, Pinto
R, Perrone A, Guida G, Azzariti A, Guida M and Tommasi S: Proteomic
profile and in silico analysis in metastatic melanoma with and
without BRAF mutation. PLoS One. 9:e1120252014. View Article : Google Scholar : PubMed/NCBI
|
|
31
|
Sun D, Liu Y, Zhang XS and Wu LY: CEA:
Combination-based gene set functional enrichment analysis. Sci Rep.
8:130852018. View Article : Google Scholar : PubMed/NCBI
|
|
32
|
Lemmon MA and Schlessinger J: Cell
signaling by receptor tyrosine kinases. Cell. 141:1117–1134. 2010.
View Article : Google Scholar : PubMed/NCBI
|
|
33
|
Witsch E, Sela M and Yarden Y: Roles for
growth factors in cancer progression. Physiology (Bethesda).
25:85–101. 2010.PubMed/NCBI
|
|
34
|
Sun J, Feng C, Liao W, Zhang H and Tang S:
Expression of CXC chemokine receptor-4 and forkhead box 3 in
neuroblastoma cells and response to chemotherapy. Oncol Lett.
7:2083–2088. 2014. View Article : Google Scholar : PubMed/NCBI
|
|
35
|
Yang H, Zhang C and Cui S: Expression of
hepatocyte growth factor in breast cancer and its effect on
prognosis and sensitivity to chemotherapy. Mol Med Rep.
11:1037–1042. 2015. View Article : Google Scholar : PubMed/NCBI
|
|
36
|
McGranahan N and Swanton C: Clonal
heterogeneity and tumor evolution: Past, present, and the future.
Cell. 168:613–628. 2017. View Article : Google Scholar : PubMed/NCBI
|
|
37
|
Dungrawala H, Bhat KP, Le Meur R, Chazin
WJ, Ding X, Sharan SK, Wessel SR, Sathe AA, Zhao R and Cortez D:
RADX promotes genome stability and modulates chemosensitivity by
regulating RAD51 at replication forks. Mol Cell. 67:374–386.e5.
2017. View Article : Google Scholar : PubMed/NCBI
|
|
38
|
Juan HC, Lin Y, Chen HR and Fann MJ: Cdk12
is essential for embryonic development and the maintenance of
genomic stability. Cell Death Differ. 23:1038–1048. 2016.
View Article : Google Scholar : PubMed/NCBI
|
|
39
|
Mitchem JB, Brennan DJ, Knolhoff BL, Belt
BA, Zhu Y, Sanford DE, Belaygorod L, Carpenter D, Collins L,
Piwnica-Worms D, et al: Targeting tumor-infiltrating macrophages
decreases tumor-initiating cells, relieves immunosuppression, and
improves chemotherapeutic responses. Cancer Res. 73:1128–1141.
2013. View Article : Google Scholar : PubMed/NCBI
|
|
40
|
Genin M, Clement F, Fattaccioli A, Raes M
and Michiels C: M1 and M2 macrophages derived from THP-1 cells
differentially modulate the response of cancer cells to etoposide.
BMC Cancer. 15:5772015. View Article : Google Scholar : PubMed/NCBI
|
|
41
|
Chen Y, Zhu J, Lum PY, Yang X, Pinto S,
MacNeil DJ, Zhang C, Lamb J, Edwards S, Sieberts SK, et al:
Variations in DNA elucidate molecular networks that cause disease.
Nature. 452:429–435. 2008. View Article : Google Scholar : PubMed/NCBI
|