Introduction
The disease caused by the severe acute respiratory
syndrome coronavirus 2 (SARS-CoV-2) has been designated as
coronavirus disease 2019 (COVID-19) by the World Health
Organization. COVID-19 has spread globally, leading to a pandemic
that has infected over 730 million people and caused over 6.8
million deaths (reported on February 8, 2023) in over 200 countries
(https://covid19.who.int/). COVID-19 is clinically
characterized by fever, fatigue, muscle pain, diarrhea, and
pneumonia and can cause death in severe cases. Leukocytosis,
leukopenia, and lymphopenia are commonly observed in patients with
COVID-19(1). Moreover, the main
feature of COVID-19 is the development of a cytokine release
syndrome, which leads to acute respiratory distress syndrome (ARDS)
and/or multiple-organ failure demonstrating that immunopathology
plays an important role in the progression of disease severity
(2-4).
Exudative, proliferative, and fibrotic phases of ARDS can be
triggered by a variety of clinical circumstances, including
pneumonia, sepsis, and blood transfusion (5). The capillary membrane is ruptured and
leaks during the first week of the exudative phase, resulting in
edema, increased lung permeability, and respiratory insufficiency
(6). The proliferative phase is
defined by fibroblast migration through breaks in the alveolar
membrane, generating a cellular granulation tissue, followed by
epithelial cell withdrawal, transforming the intra-alveolar exudate
into the interstitial tissue (7).
The fibrotic phase, which includes substantial remodeling and
collagenous tissue substitution, as well as scar formation, occurs
during the third or fourth week of respiratory failure. Chest
computed tomography (CT) in patients with COVID-19 is a commonly
used non-invasive method for both diagnosis and management of the
disease. CT is associated with disease severity and comorbidities
in aged patients (8-10).
It is crucial to associate clinical parameters with the formation
of fibrotic lesions observed in CT in the long-term period.
Leukocytes activated within an excessive systemic
inflammatory response syndrome are among the factors contributing
to the pathophysiology of ARDS and inflammatory mediators. They
migrate into the interstitial space of the lungs and increase
endothelial permeability (11).
This is accompanied by a significant influx of alveolar macrophages
and neutrophils, attracted by cytokines secreted by leukocytes,
followed with the destabilization of the surfactant monolayer in
the air spaces, promotion of the alveolar collapse, and impairment
of gas-exchange abnormalities (12).
Pro-inflammatory cytokines including tumor necrosis
factor-α (TNF-α), interleukin (IL)-6, interferon γ-induced protein
10 (IP-10), monocyte chemoattractant protein-1 (MCP-1), and
macrophage inflammatory protein-1α (MIP-1α) and their interactions
across different cell types are other contributors to ARDS
development (6). Some cells may
respond to certain stimuli directly and release a specific
attractant that affects a different cell type. TargeT cells respond
by generating chemokines, sending out feedback signals, or
recruiting a new subset of targeT cells. A cytokine storm develops
as a result of this chain of events. The mechanism of cytokine
release syndrome is complex and involves dysregulation of the
immune cell response; therefore, strategies to control cytokine
release are under investigation. Some prognostic risk factors of
COVID-19 severity have already been explored, such as age,
diabetes, vitamin D deficiency, IL-6 levels, N-terminal pro-B-type
natriuretic peptide (NT-proBNP) levels, and serum amyloid A levels
(13-17).
Circulating microRNAs (miRNAs or miRs) have already
been proposed as diagnostic and prognostic markers in ARDS-related
and immune pathologies. For instance, miR-27 plays an important
role in reducing the inflammatory process in acute lung injury and
M2 macrophage polarization (18).
In addition, miR-192-5p and miR-323a-3p were reported to be
differentially expressed in non-survivors and survivors of
COVID-19(19). Nevertheless, the
role of miRNAs in patients with COVID-19 has not been
comprehensively addressed.
Numerous studies have described the clinical
characteristics of patients with COVID-19, including
epidemiological, clinical, laboratory, radiological, and treatment
data (9,20,21).
Most of these results refer to the differences between severe and
non-severe patients during hospitalization or assessment of
COVID-19 severity. Other reports include test results from only a
single time point collected on admission, exacerbation, or
discharge. However, analysis at only a single time point may
conceal alterations in the parameters of an individual patient when
the patient's condition changes, and it may not demonstrate
diversification with disease aggravation. Recent studies analyzed a
series of large sample cohorts, which included complete data on
patients with COVID-19 in different disease states (1,20,22);
however, there is limited research on dynamic changes in blood cell
parameters and inflammatory factors to characterize disease
progression and their profiling in the long-term perspective. The
immune cells from the peripheral blood of a patient may be used as
markers for COVID-19 and can be analyzed using fast and easily
accessible blood tests (21,23,24).
However, their implementation in clinical practice is limited due
to the uncertainty of the mechanisms leading to changes in blood
cell features and inflammatory components. The underlying fine
changes in inflammatory subpopulations in peripheral blood cells,
as well as changes in cytokine levels in patients with COVID-19,
are ambiguous.
Therefore, in the present study, the dynamic fine
changes in blood parameters, including the total number of blood
cells and individual cell subpopulations, selected miRNAs, and
cytokine levels in the peripheral blood of patients with severe
COVID-19 were investigated over 28 days of the disease. In
addition, quantitative chest CT analysis in conjunction with
clinical laboratory data were used to identify prognostic factors
for disease severity over a period of 48 weeks after onset of
symptoms. Predictors included CT score values, blood assay
parameters, and data on cytokines and miRNA levels at four time
points.
Materials and methods
Participants
Between October and December 2020, a total of 14
confirmed cases of patients with COVID-19 (COVID-19 group) at the
Kyiv City Clinical Hospital No. 4, were included in the present
study. As a control group, 17 age-matched non-COVID-19 volunteer
participants, who had not been hospitalized but had some underlying
comorbidities, as indicated in Table
I, were enrolled. The COVID-19 group included 10 male and 4
female patients between 55 and 64 years old. The volunteer group
consisted of 7 male and 10 female participants aged between 36 and
67 years. The study protocol was designed in accordance with the
Declaration of Helsinki and approved by the Ethics Committee of the
Kyiv City Clinical Hospital No. 4 (protocol no. 280; April 23,
2020). Written informed consent was obtained from all subjects
enrolled in the study. All patients met the moderate severity
criteria according to the interim guidelines from the WHO and the
Novel Coronavirus Pneumonia Diagnosis and Treatment Plan issued by
the National Health Commission of the People's Republic of China
(Provisional 7th Edition) (25).
Patients from the COVID-19 group had any of the following
conditions: Respiratory distress, RR ≥30 times/min; oxygen
saturation (SpO2) ≤93% at rest; and bilateral pneumonia, which was
observed in all enrolled participants. The major treatments for
patients included drug therapy, such as antibiotic
therapy/dexamethasone therapy; patients received low-pressure
oxygen through a face mask while no mechanical ventilation was
applied. Patients with severe COVID-19 with symptoms persisting
after 7-11 days of standard treatment participated in the present
study. Laboratory and clinical data from each patient were acquired
for a period of 28 days, while chest CT data were acquired for 48
weeks; missing data for blood assays were due to hypercoagulation
or insufficient volume.
 | Table IClinical characteristics of patients
with COVID-19 included in the present study. |
Table I
Clinical characteristics of patients
with COVID-19 included in the present study.
| Parameters | Patients with
COVID-19 (n=14) | non-COVID-19
volunteers (n=17) | P-value |
|---|
| Age, years (median,
range) | 62 (55-64) | 62 (36.2-67) | 0.336 |
| Sex | | | 0.200 |
|
Male | 10/14 (71.42%) | 7/17 (41.17%) | |
|
Female | 4/14 (28.57%) | 10/17 (58.82%) | |
| The interval from
illness onset to hospital admission (days) | 11.0
(8.5-12.8) | Not applicable | Not applicable |
| Underlying
diseases, no. (%) | | | |
|
Hypertension | 8/14 (57.14%) | 7/17 (41.17%) | 0.376 |
|
Diabetes | 1/14 (7.14%) | 2/17 (11.76%) | 1.000 |
|
Heart
disease | 6/14 (42.85%) | 2/17 (11.76%) | 0.097 |
| Symptoms, no.
(%) | | Not applicable | Not applicable |
|
Fever | 10/14 (71.42%) | | |
|
Cough | 14/14 (100.0%) | | |
|
Shortness of
breath | 11/14
(78.57.0%) | | |
|
Diarrhea | 1/14 (7.14%) | | |
|
Fatigue | 14/14 (100.0%) | | |
|
Myalgia | 3/14 (21.42%) | | |
| Clinical outcome,
no. (%) | | Not applicable | Not applicable |
|
Recovered
and discharged | 13/14 (92.85%) | | |
|
Death | 1/14 (7.14%) | | |
Respiratory pathogen detection
Laboratory validation of SARS-CoV-2 was performed at
the Kyiv City Clinical Hospital No. 4 using reverse
transcripton-polymerase chain reaction (RT-PCR). Briefly, throat
swab specimens were obtained from the upper respiratory tract of
patients and stored immediately in the viral transport medium.
Following extraction of total RNA, RT-PCR was performed to identify
the virus. Genotyping of the SARS-CoV-2 was not performed, but the
delta strain dominated in the Ukraine at that time period.
Blood collection
Blood samples (12-20 ml) of the 14 patients with
COVID-19 were collected on the day of admission (day 0) and on days
7, 14, and 28 after admission. Briefly, 5 ml was used for routine
blood assays completed using a Swelab Alfa Basic hematology
analyzer (Boule Medical AB) at the Kyiv City Clinical Hospital No.
4. The remaining portions of blood samples were immediately
transported to the Institute of Cell Therapy (Kyiv, Ukraine) where
the plasma and serum were separated, snap-frozen, and stored at
-80˚C for cytokine detection and miRNA analysis. Peripheral blood
mononuclear cells (PBMCs) were isolated by density gradient
centrifugation using Ficoll-Paque PLUS density gradient media (Life
Sciences; Cytiva), frozen in media containing 10% DMSO
(Sigma-Aldrich; Merck KGaA) and 90% fetal bovine serum
(Sigma-Aldrich; Merck KGaA), and stored in liquid nitrogen until
multiparametric fluorescence flow cytometry was performed.
Flow cytometric analysis
Cryopreserved PBMCs were thawed in a water bath at
37˚C, washed with RPMI-1640 (Sigma-Aldrich; Merck KGaA)
supplemented with 2% fetal bovine serum (Sigma-Aldrich; Merck
KGaA), and centrifuged at 350 x g for 5 min at room temperature.
Cell pellets were resuspended in RPMI-1640, filtered through a
40-µm nylon cell strainer (Corning; Corning, Inc.), and aliquoted
at 50 µl into 5 ml polystyrene tubes (up to 3x10⁵ cells
per tube). Cells were incubated with fluorochrome-conjugated
monoclonal antibodies for 30 min at 4˚C protected from light in an
appropriate dilution of 0.5 µg per 106 cells. Following
incubation, any unbound antibodies were washed away with 2 ml of
cell wash buffer (BD Biosciences) by centrifugation at 350 x g for
5 min at 4˚C. Prior to analysis, cells were gently resuspended in
300 µl of cell wash buffer.
Flow cytometric gating strategy
A total of seven panels of mononuclear leukocyte
lineage and phenotypic markers were defined to broadly assess the
immunological cellular profile of cryopreserved PBMCs:
CD45/CD14/CD1c/CD11b/CD11c, CD45/CD14/CD1c/CD303/HLA-DR,
CD45/CD3/CD19/CD16+CD56,
CD3/CD4/CD8/CXCR3/HLA-DR/CD45RO, CD3/CD4/CD8/PD1/CD57/CD45RO,
CD3/CD4/CD8/PD-1/HLA-DR, and CD3/CD4/CD8/CD25/CD127. To avoid
inclusion in the analysis of granulocytes, CD45-positive
mononuclear cells were gated out of all events by side scattering
followed by subsequent singlet gating. The percentage of T cells
(CD45+CD3+), B cells
(CD45+CD19+), NK cells
(CD45+CD16/56+), and monocytes
(CD45+CD14+) were calculated among the
selected mononuclear cells. Subsequent subpopulations of cells were
estimated from the corresponding gated populations described above.
T cells were further subdivided into Treg (CD25+), T
memory (CD45RO+), T effector (CD183+), and
activated T cells (HLA-DR+), as well as senescent
CD57+ or CD279+ cells. Dendritic cells were
further classified based on the differential expression of CD1c,
CD11b, CD11c, and CD303 (Fig. S1,
Fig. S2 and Fig. S3). The final relative content of
each subpopulation was calculated for all CD45-positive mononuclear
cells.
Antibodies used for flow cytometry and the defined
lymphocyte subpopulations are listed in Table SI. To determine viable cells,
7-aminoactinomycin D dye (7-AAD; BD Biosciences) was used.
Unstained control, single stained, and fluorescence
minus one controls were used to adjust the compensation settings of
fluorochromes overlapping for multiparameter analysis. At least
1x10⁵-3x10⁵ cells per sample were recorded
using a BD FACSAria cell sorter (Becton Dickinson; BD Biosciences).
Data were analyzed using the BD FACSDiva 6.1.2 software (Becton
Dickinson; BD Biosciences). The combinations of markers used to
analyze distinct populations of PBMCs are listed in Table SII.
Cytokine measurement
The C-reactive protein (CRP) content in patient sera
was determined using AccuBind (cat. no. 3125-300; Monobind, Inc.)
according to the manufacturer's instructions. The detection limit
was 0.014 µg/ml. For the detection of granulocyte
colony-stimulating factor (G-CSF), IL-2, IL-6, TNF-α, IP-10, MCP-1,
and MIP-1α, enzyme-linked immunosorbent assay (ELISA) was performed
using the Invitrogen kit according to the manufacturer's
instructions. The following ELISA and standard curves (all from
Instant ELISA; Invitrogen; Thermo Fisher Scientific) were employed
for the measurement of each parameter: Human G-CSF (cat. no.
BMS2001INST), IL-2 (cat. no. BMS221INST), IL-6 (cat. no.
BMS213INST), TNF-α (cat. no. KHC3014), IP-10 (cat. no. BMS284INST),
MCP-1 (cat. no. BMS281INST), and MIP-1α (cat. no. KAC2201). The
sensitivity was 11 pg/ml for G-CSF, 2.3 pg/ml for IL-2, 0.92 pg/ml
for IL-6, 0.13 pg/ml for TNF-α, 1 pg/ml for IP-10, 2.31 pg/ml for
MCP-1, and 2 pg/ml for MIP-1α. All absorbance measurements were
carried out using a HumaReader HS plate reader (Human GmBH). Each
sample was performed in duplicate.
miRNA expression
miRNA was extracted from the plasma of 14 patients
with COVID-19 and the 17 age-matched volunteers from the control
group according to the instructions for the NucleoSpin miRNA Kit
(Macherey-Nagel GmbH & Company KG) and stored at -80˚C. The
concentration of isolated miRNA was measured using a NanoDrop 2000
spectrophotometer (Thermo Fisher Scientific, Inc.), and miRNA was
reverse transcribed into cDNA using the miRNA 1st-Strand cDNA
Synthesis Kit (Agilent Technologies) with a universal reverse
primer from the synthesis kit. RT-quantitative (q)PCR was conducted
to detect the miRNA levels using a 5X HOT FIREPolEvaGreen qPCR Mix
Plus kit (no ROX) (Solis BioDyne OÜ) with a CFX96™ Real-Time PCR
Detection System (Bio-Rad Laboratories, Inc.). For each sample, the
RT-qPCR reaction consisting of a 15 min hot start at 95˚C for
polymerase activation, followed by 44 cycles of 15 sec at 95˚C and
20 sec at 60˚C, was performed in triplicate. The ΔΔCq method
(26) was used for miRNA
quantification analysis, with U6 as a reference. The primer
sequences are listed in Table
SIII.
CT evaluation and scoring
Following admission, all patients lying in the
supine position were subjected to high-resolution plain chest CT
scanning using a Philips Brilliance CT 64 slice scanner (Philips
Medical Systems Technologies, Ltd.), applying a slice thickness of
1 mm with 120 kV and 335 mAs. CT images were analyzed at weeks 2,
8, 24 and 48 after enrolment. Processing and grading of CT images
considered radiologic features including ground glass opacity,
reticulation, and honeycombing. The approach applied for the
quantitative determination of the affected lung area was described
by Büttner et al (27) with
some changes. Briefly, the affected lung area was measured in
polygonal regions of interest in one image at three levels (upper
point, above the level of the carina; lower point, below the
highest point of the right diaphragm; and middle point, between the
previous two, right at the midpoint). Each image was parted into
four quadrants with further dividing of each quadrant into 5
sub-quadrants covering 5% of the total image area. The scale
applied for evaluation included 7 values: 0 (no involvement), 1
(≤10% involvement), 2 (11-20% involvement), 3 (21-30% involvement),
4 (31-40% involvement), 5 (41-50% involvement), 6 (>50%
involvement). The total severity score was the sum of the scores of
the five lung lobes.
Statistical analysis
SPSS version 27.0 software (IBM Corp.) was used for
statistical analysis. The variables were presented as medians with
interquartile ranges. The baseline characteristics of the two
groups were compared using the Chi-square test or Fisher's exact
test for categorical variables or the Mann-Whitney U test for
continuous variables. The Wilcoxon signed-rank test was used to
compare the time-dependent events. The Mann-Whitney U test was used
to compare the differences between the groups at each time point.
The Spearman rank test was performed to assess the correlations
between variables. GraphPad Prism software (version 7.0a; GraphPad
Software, Inc.) was used for the data visualization. A P-value of
≤0.05 was considered to indicate a statistically significant
difference.
Results
Basic characteristics of the patients
with COVID-19
A total of 14 patients with severe COVID-19 admitted
to the Kyiv Clinical Hospital No. 4 were enrolled in the present
study after obtaining written informed consent. The detailed
patient characteristics are shown in Table I. The median age of the COVID-19 and
control groups were 62.0 (55-64.0) and 62.0 (36.2-67.0) years,
respectively, and the interval from illness onset to hospital
admission for the COVID-19 group was 11.0 (8.5-12.8) days.
Dynamic profile of hematological
parameters in patients with COVID-19
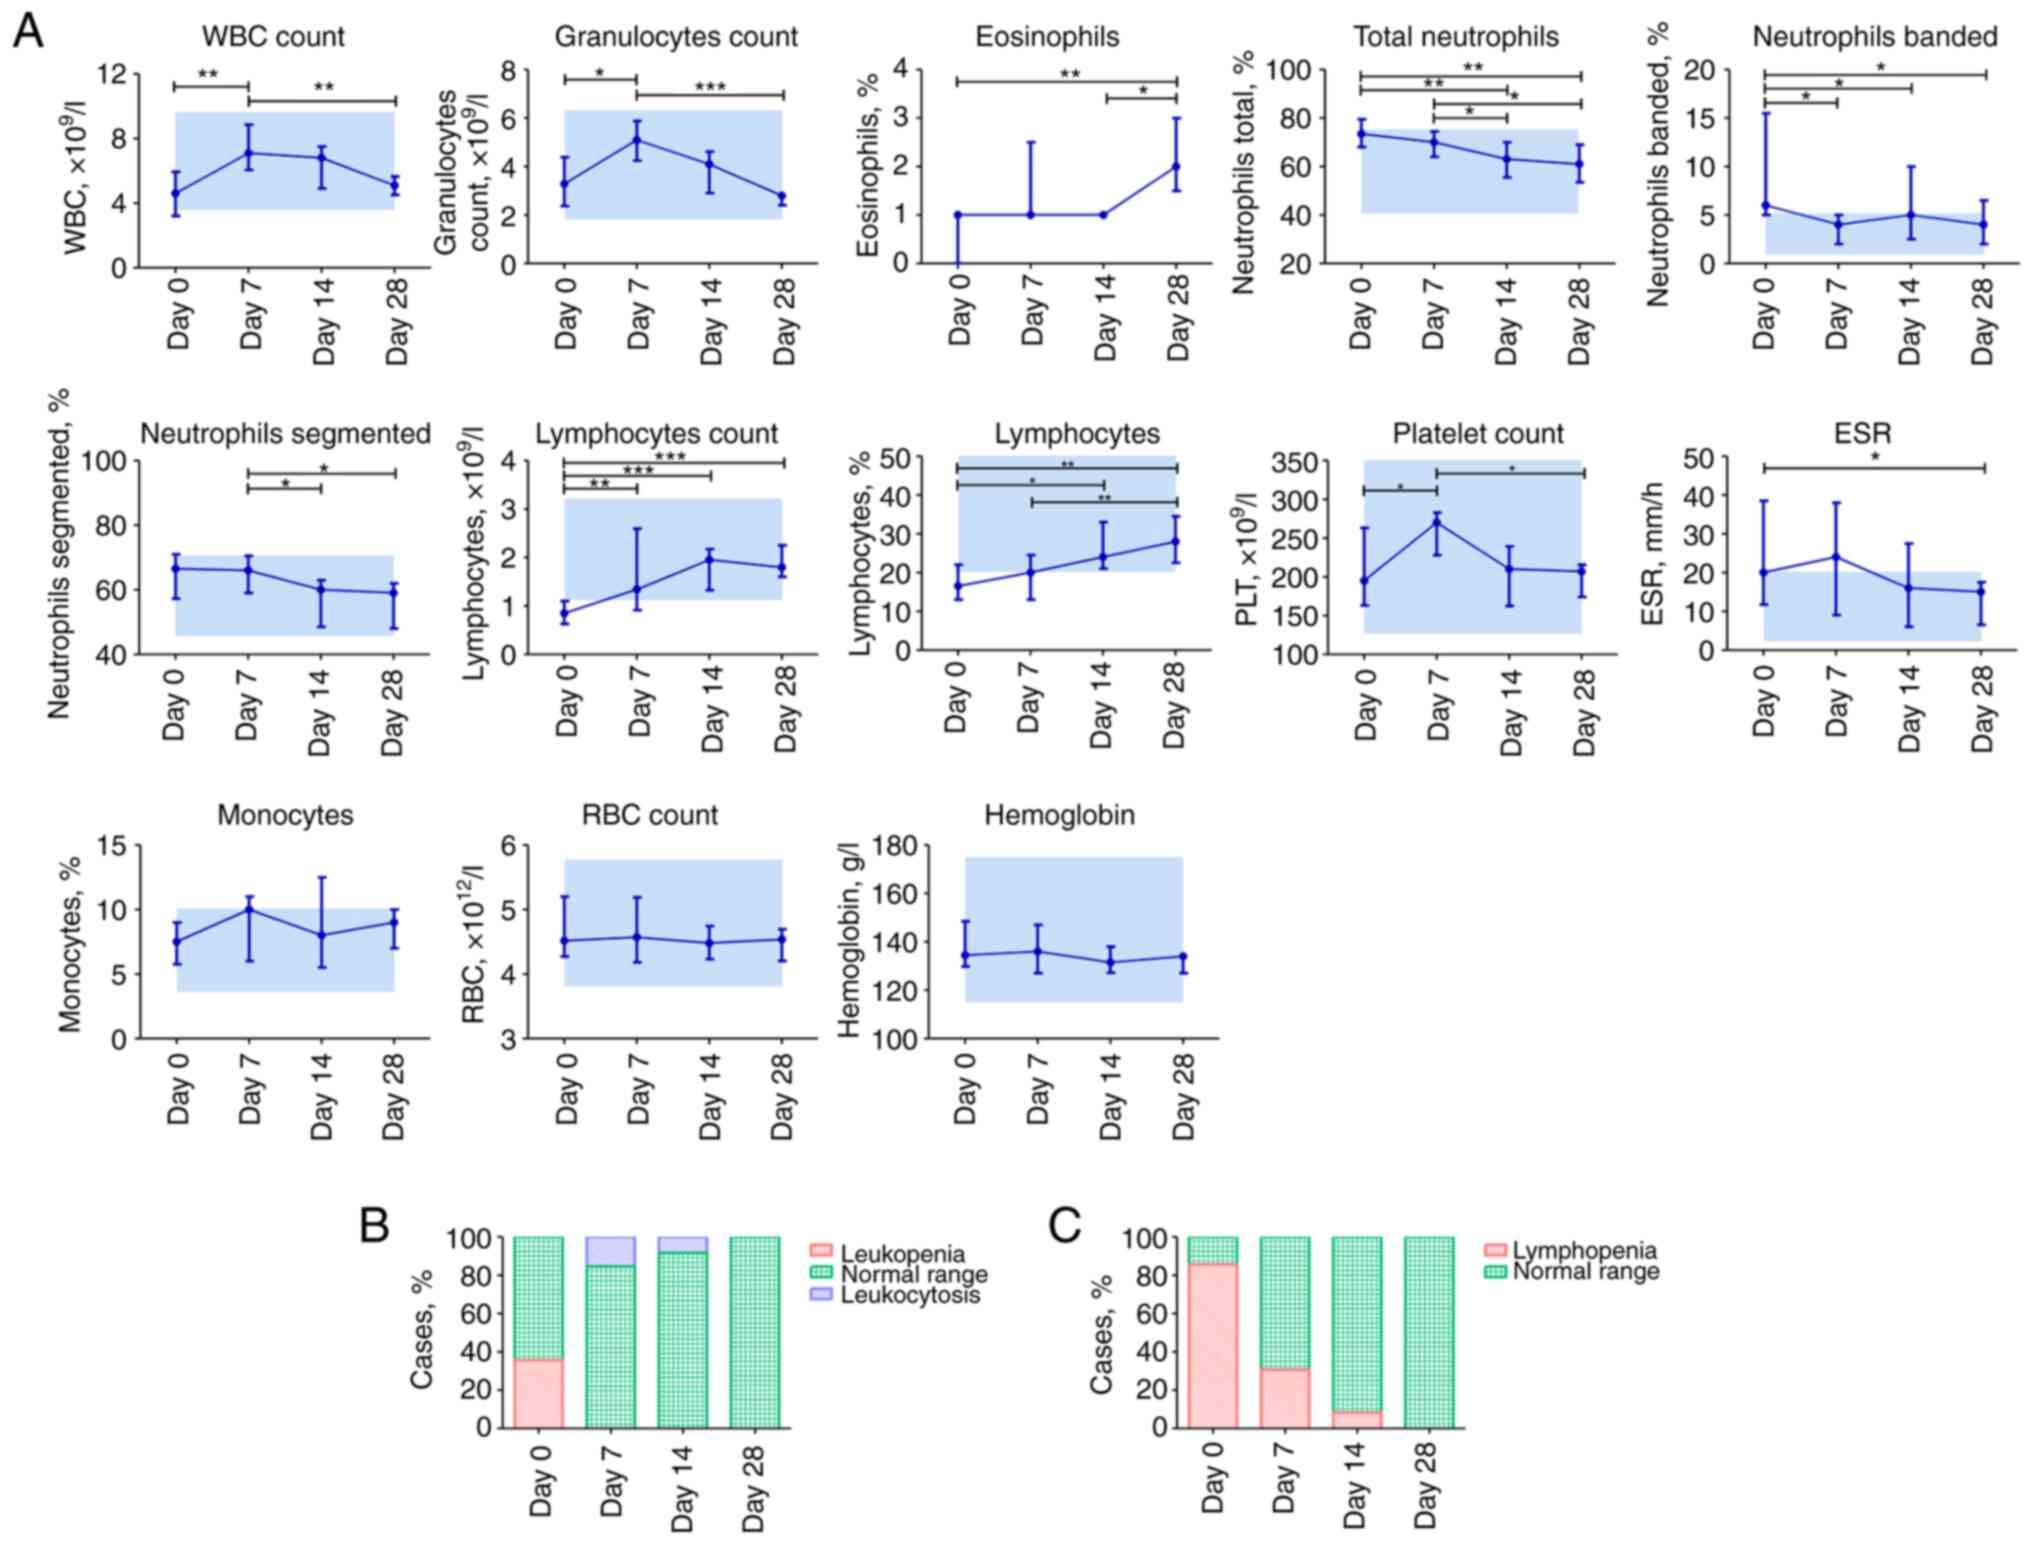
Blood parameter comparisons in patients with
COVID-19 depending on the time of assessment are presented in
Fig. 1A. White blood cell (WBC) and
granulocyte counts increased on day 7 and steadily decreased by day
28, whereas the percentage of neutrophils, including banded and
segmented, decreased gradually from the time of admission on day 0
to 28. However, the percentages and counts of lymphocytes increased
regularly. Compared to day 0, the percentage of eosinophils
increased significantly on day 28 (P≤0.01). Platelet count showed a
sharp increase on day 7; however, all values appeared within the
normal range (125.0-350.0x10⁹/l). A significant decrease
in erythrocyte sedimentation rate (ESR) was observed only on day 28
compared to the initial day (P≤0.05). Other parameters, including
the percentage of monocytes, red blood cell count, and hemoglobin,
were not altered during COVID-19 progression and early
recovery.
On day 0, 5/14 (35.71%) patients with COVID-19 had
leucopenia, whereas 2/13 (15.38%) patients had leukocytosis on day
7. Lymphopenia (≤1.1x10⁹/l) occurred in 12/14 (85.71%)
patients with COVID-19 on day 0 and was not observed on day 28
(Fig. 1B).
Dynamic profile of lymphocyte cell
subpopulations in patients with COVID-19
The frequencies of major lymphocyte subsets in the
peripheral blood of the patients with COVID-19 are shown in
Fig. 2A. The percentage of
CD45+ WBC on day 7 was significantly lower than that in
the control group (P≤0.05) but restored on day 14. The median value
of T cell (CD45+CD3+) content in the COVID-19
group decreased at day 7 and returned to significantly elevated
levels on days 14 and 28 (P≤0.05). The percentage of B cells
(CD19+) peaked on day 7 compared to that on days 14-28
and differed significantly from those of the control group during
the first week of hospitalization. The percentage of natural killer
(NK) cells (CD3-CD16+CD56+)
decreased from the start of observation reaching a nadir on day 7
of hospitalization and then increased constantly but not
significantly through the next two weeks.
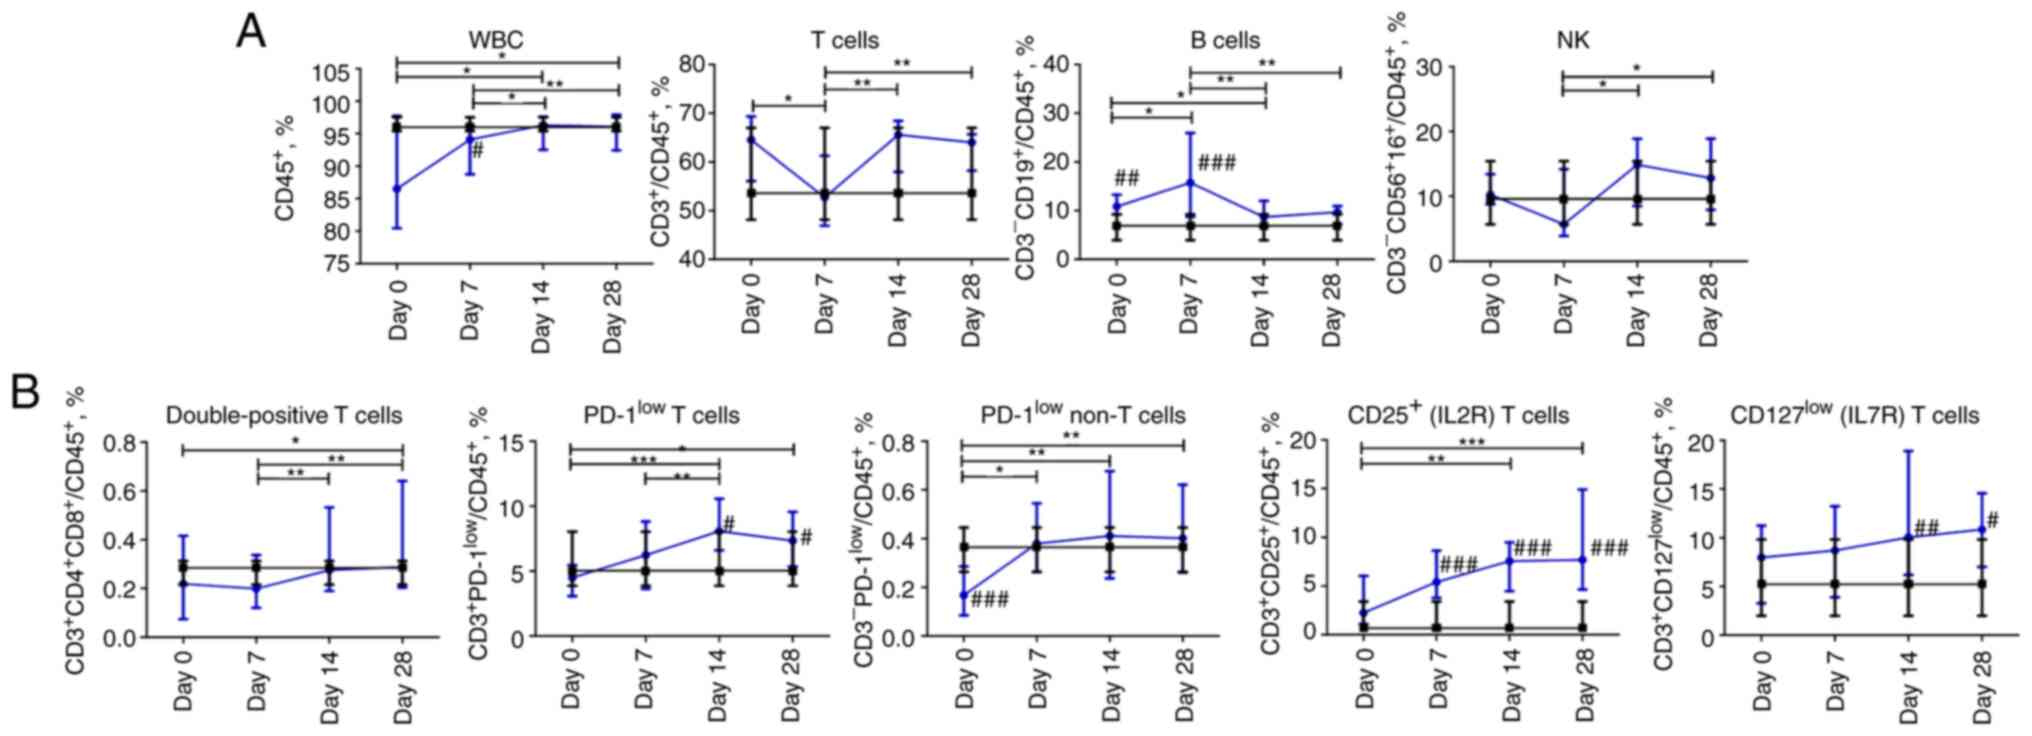 | Figure 2Dynamic changes in lymphocyte subsets
in patients with COVID-19. (A) Frequency of white blood cells, T
cells, B cells, natural killer cells. (B) Frequency of
double-positive CD4+CD8+ T cells,
CD3+PD-1low T cells,
CD3-PD-1low non-T cells, CD25-expressing, and
CD127-expressing T cells. Data are presented as the median and
interquartile range. Wilcoxon signed-rank test was used for
comparison of time-dependent events: *P≤0.05,
**P≤0.01 and ***P≤0.001. Mann-Whitney U test
was used for comparing the values of the control and COVID-19
groups at each time point: #P≤0.05, ##P≤0.01
and ###P≤0.001. The blue line represents the COVID-19
group; and the black line represents the control group. COVID-19,
coronavirus disease 19; WBC, white blood cells; NK, natural
killer. |
The content of double-positive (DP) T cells
CD3+CD4+CD8+ among mononuclear
leukocytes was under-represented on days 0 and 7 and restored to
values of the control group on days 14 and 28. The frequencies of
PD-1-expressing cells in both CD3+ and CD3-
blood cell populations increased during the four weeks of
assessment. A significant increase in CD3+ PD-1
expressing blood cells occurred from 7 to 14 days (P≤0.01), whereas
CD3- PD-1 expressing cells increased during the first
week of hospitalization and then reached a plateau. The percentage
of PD-1low T cells was significantly higher in COVID-19
patients on days 14 and 28 compared to the control group. The
percentage of PD-1low non-T cells was significantly
lower at the beginning of hospitalization compared to the cohort of
non-COVID-19 volunteers. The content of CD25+ T cells
increased during the observation period and was significantly
higher than that in the control group, from day 7 onward. The
percentages of CD127+ T cells demonstrated consistent
slight growth during the observation period, reaching significant
differences compared to those of the control group on days 14 and
28 (Fig. 2B).
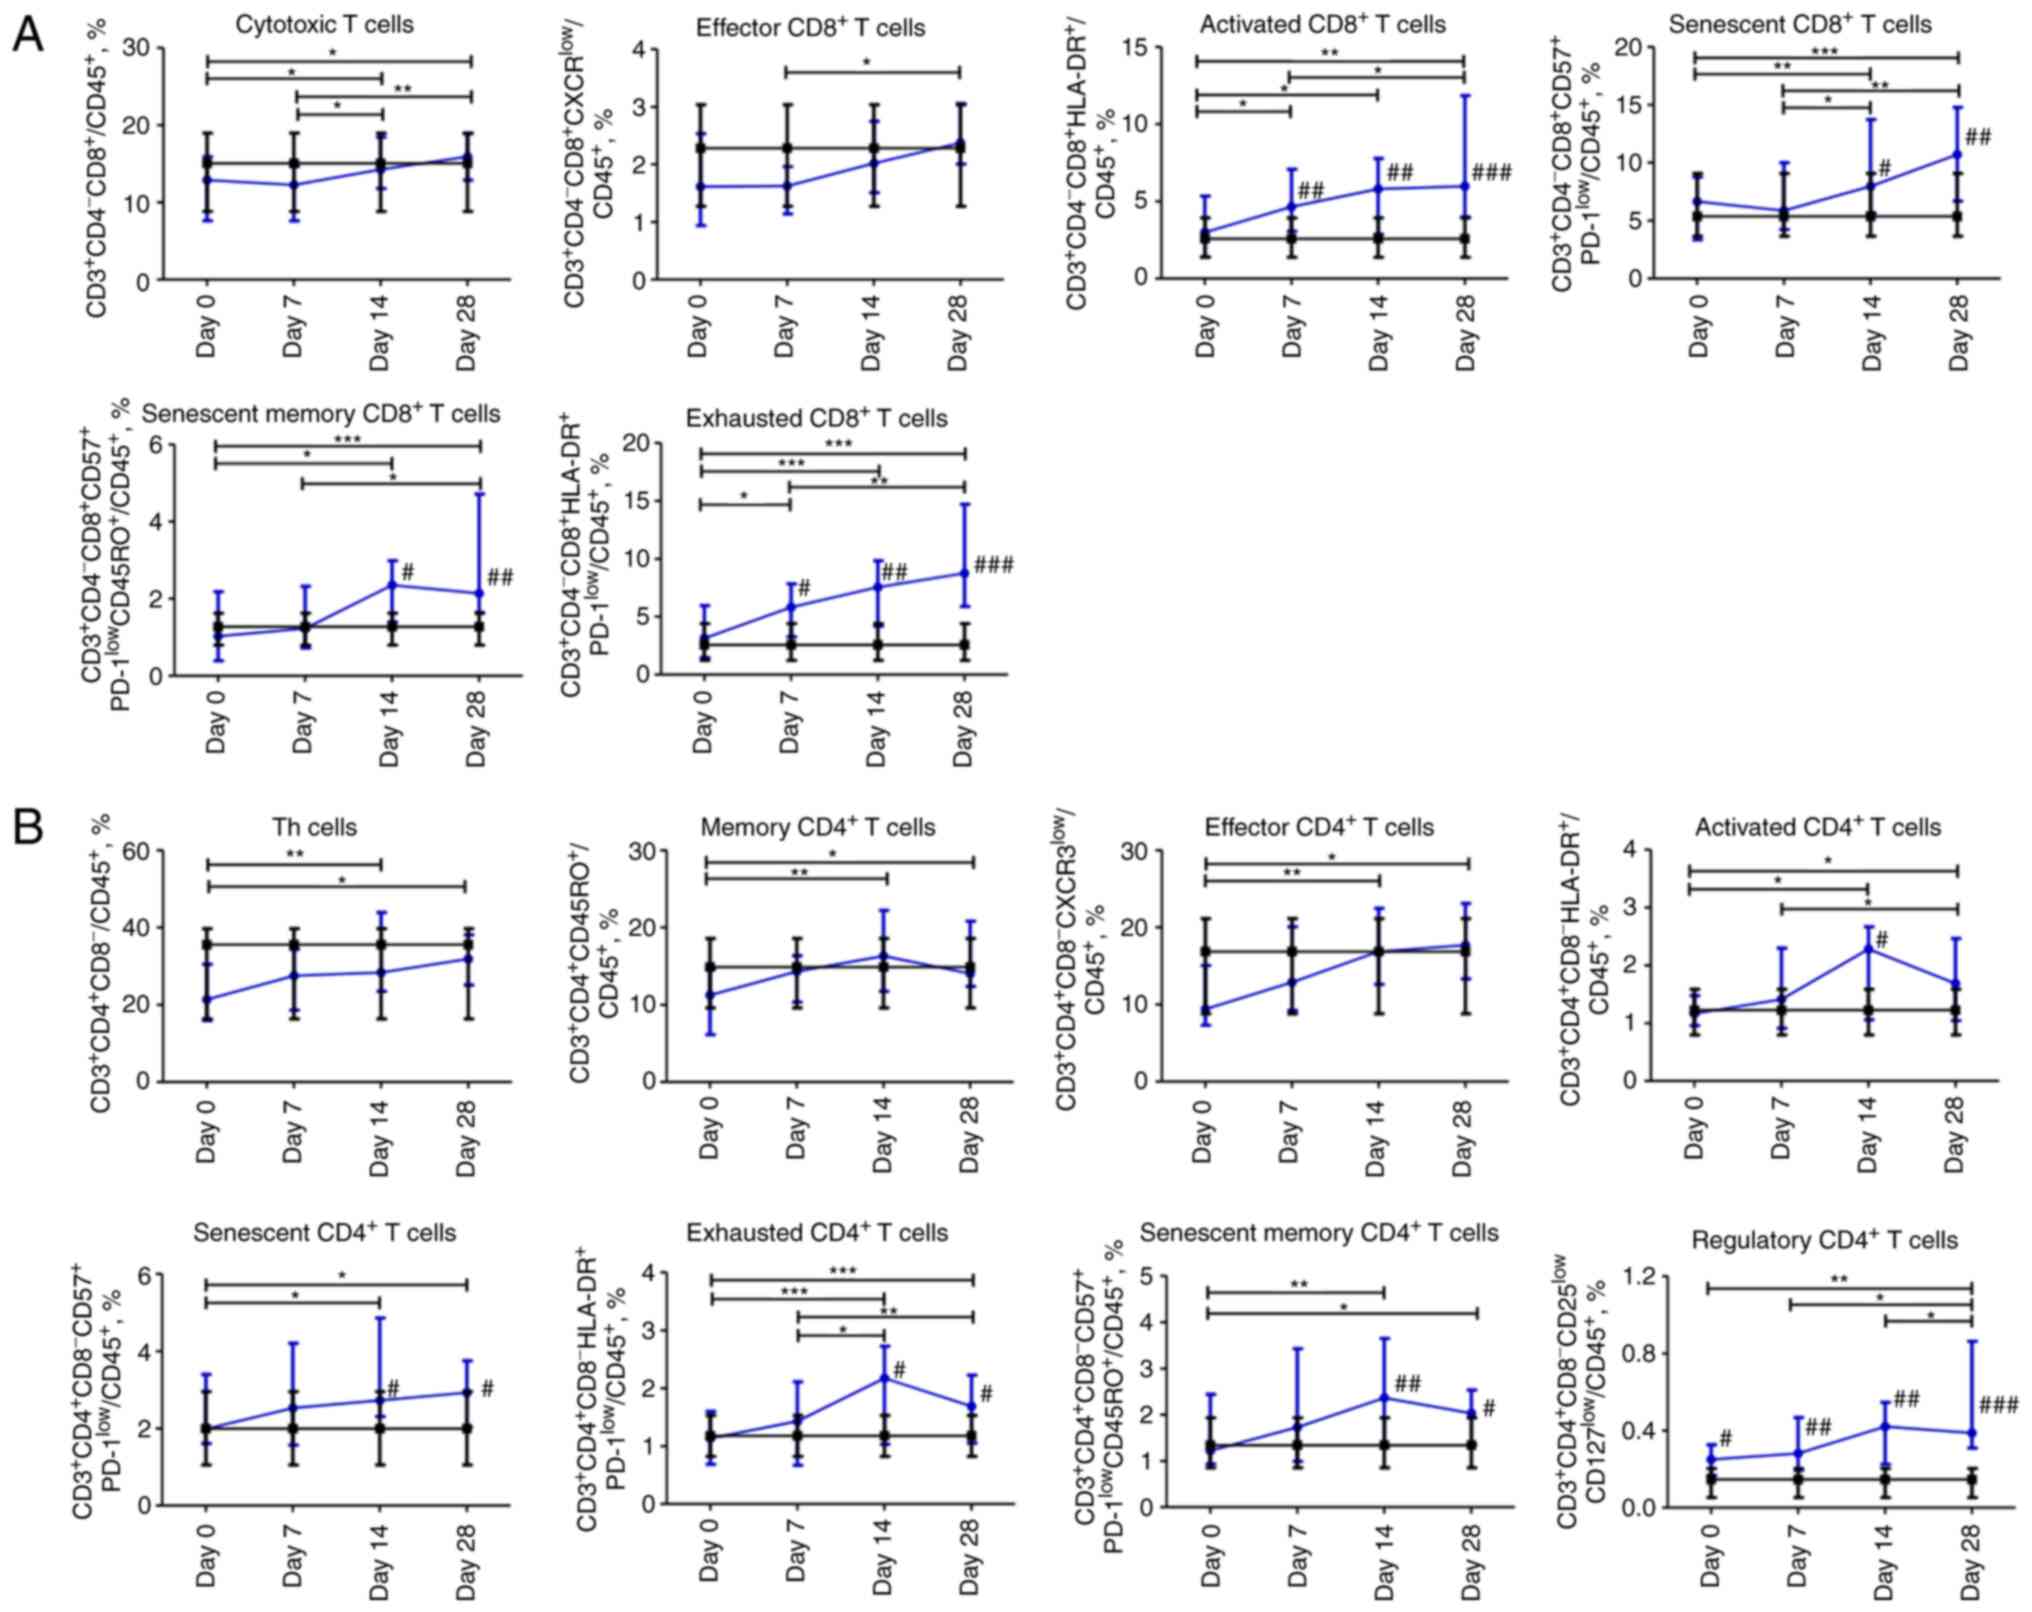
Dynamic profile of changes in
subpopulations of T cells in patients with COVID-19. CD8 T
cells
The content of cytotoxic
CD3+CD4-CD8+ T cells and effector
CD3+CD4-CD8+CXCR3low T
cells steadily increased from day 0 to 28. The content of activated
CD3+CD4-CD8+HLA-DR+ and
exhausted
CD3+CD4-CD8+HLA-DR+PD-1low
T cells increased during the entire observation period and was
significantly higher on days 7, 14, and 28 in comparison with
non-COVID-19 volunteers. The percentage of senescent CD8 T cells
CD3+CD4-CD8+CD57+PD-1low
and their memory subpopulation
CD3+CD4-CD8+CD57+PD-1lowCD45RO+
began to increase on day 7 and reached the maximum value on day 28.
Compared to the control group, the content of senescent
CD8+ T cells and the memory subpopulation of senescent
CD8+ T cells was significantly higher on days 14 and 28
(P≤0.05 and P≤0.01, respectively; Fig.
3A).
CD4 T cells
The percentage of
CD3+CD4+CD8-Th cells increased
significantly from the day 0 to 28. The memory CD4+ T
cells CD3+CD4hiCD45RO+
subpopulation increased steadily throughout the four weeks. The
effector CD4+ T cells
CD3+CD4+CD8-CXCR3low
subpopulation increased over 14 days and did not change during the
fourth week. The abovementioned CD4 T cell subpopulations were
comparable to those of the control group. The population of
activated CD4
CD3+CD4+CD8-HLA-DR+ T
cells increased for 28 days, with a peak value on day 14 acquiring
a significant difference (P≤0.05) compared to the control group.
Exhausted CD4
CD3+CD4+CD8-HLA-DR+PD-1low
and senescent memory
CD3+CD4+CD8-CD57+PD-1lowCD45RO+
T cells shared the same pattern as activated CD4 T cells. The
percentage of senescent CD4 T cells
CD3+CD4+CD8-CD57+PD-1low
increased over 28 days. The senescent, senescent memory, and
exhausted cells in the COVID-19 group were significantly abundant
(P≤0.05) on days 14 and 28. The percentage of CD4 regulatory T
cells
CD3+CD4+CD8-CD25lowCD127low
increased and remained significantly higher on days 0 (P≤0.05), 7
(P≤0.01), 14 (P≤0.01), and 28 (P≤0.001) compared to the control
group (Fig. 3B).
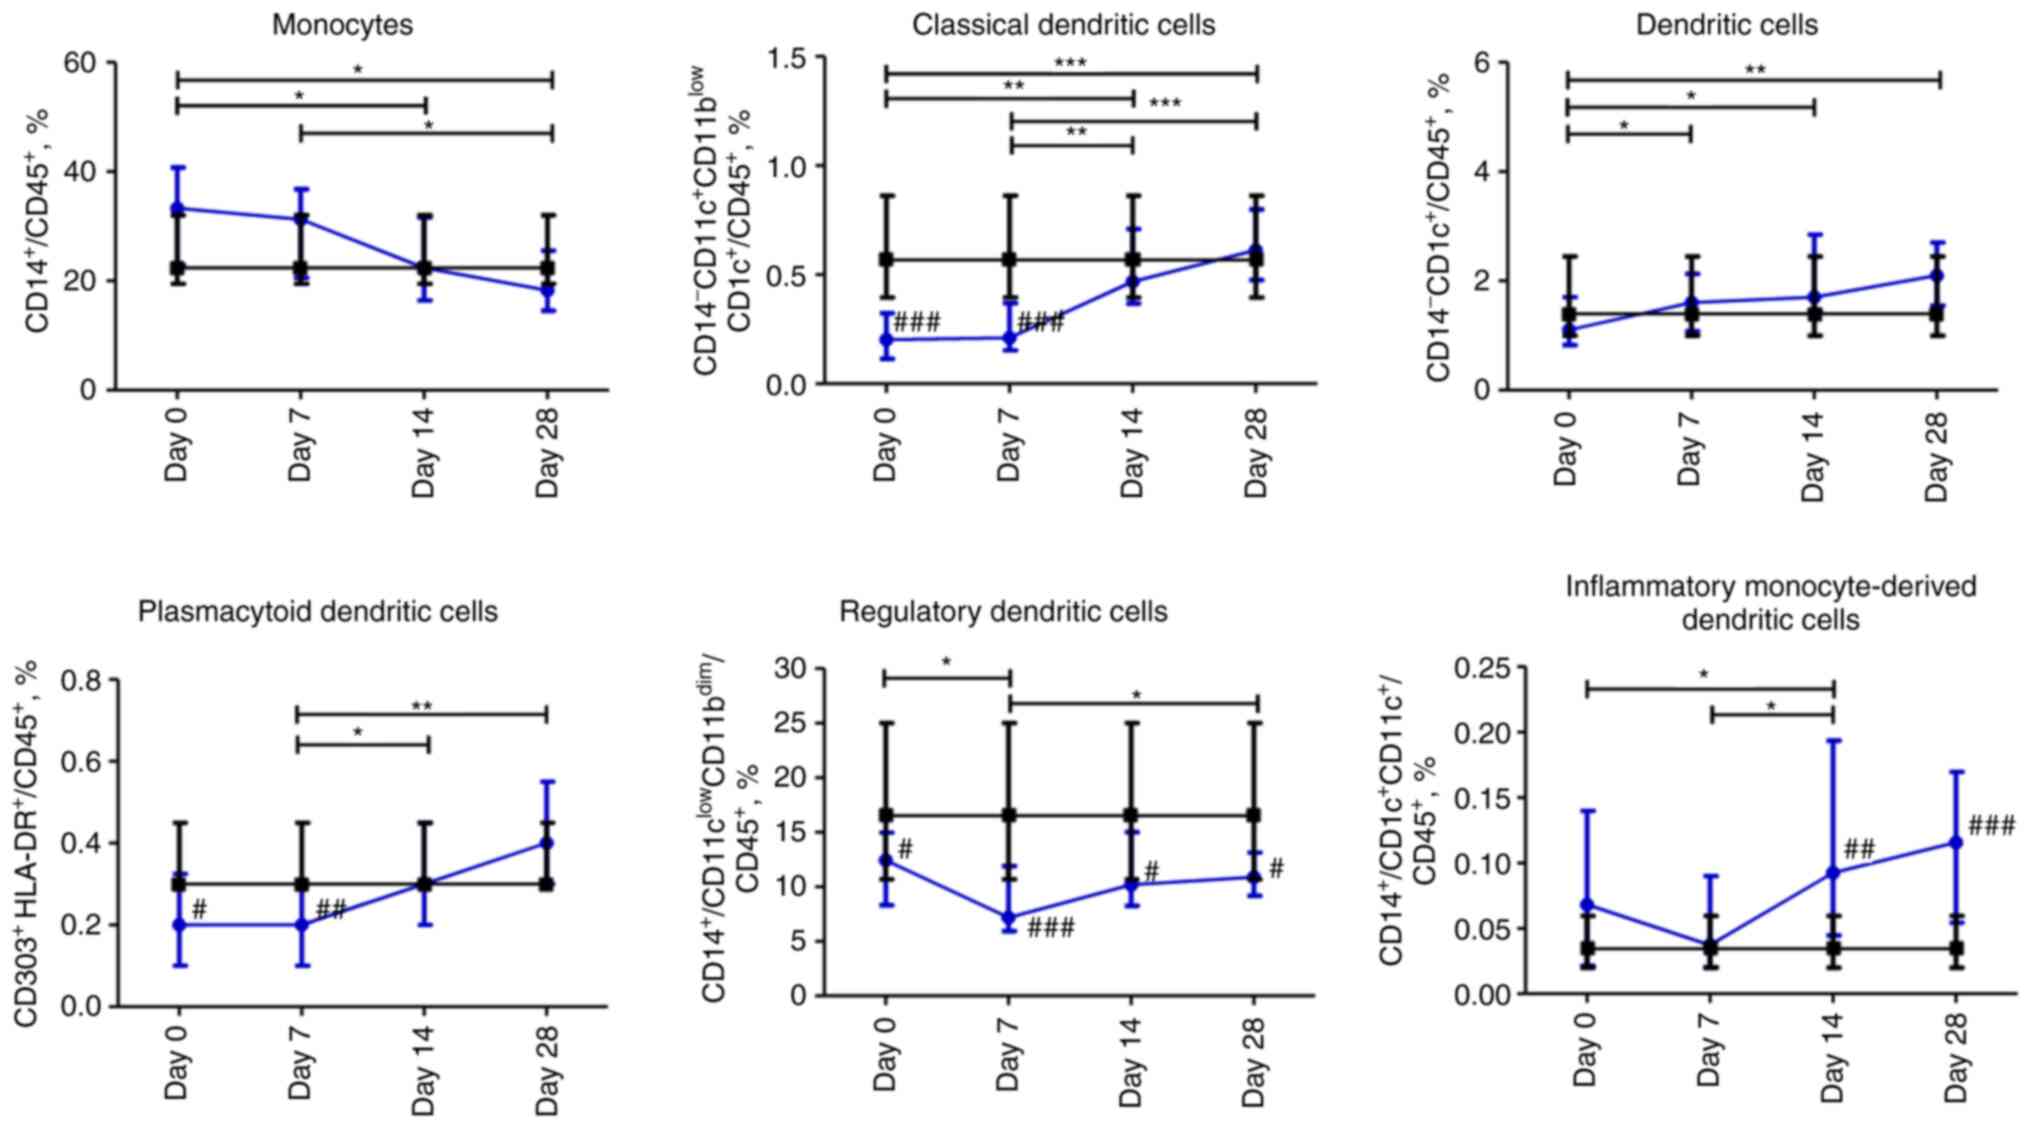
Dynamic profile of changes in
subpopulations of myeloid mononuclear cells in patients with
COVID-19
The percentage of CD45+CD14+
monocytes gradually decreased over 28 days. The content of
CD14-CD11c+CD11blowCD1c+
dendritic cells was significantly lower on day 0 and 7 (P≤0.001)
compared to the control group; however, it normalized on days 14
and 28. The content of CD14-CD1c+ dendritic
cells increased during the observation period and was within the
normal range. The content of plasmacytoid dendritic cells
CD303+HLA-DR+ was significantly lower over
the first 7 days than in the control group, and then, it
significantly increased from day 7 to 28 (P≤0.01). Compared to
non-COVID-19 volunteers, the percentage of regulatory
CD14+CD11bdimCD11clow dendritic
cells was significantly under-represented over four weeks of
assessment with a nadir on day 7. The percentage of inflammatory
monocyte-derived CD14+CD1c+CD11c+
dendritic cells gradually increased from day 7 to 28 and reached a
significant difference at days 14 and 28 (P≤0.01 and P≤0.001,
respectively) compared to the control group (Fig. 4).
Cytokine and miRNA levels in the
plasma of patients with COVID-19
During two weeks of hospitalization, CRP levels in
the plasma of patients with COVID-19 were significantly higher than
in the plasma of volunteers in the control group and decreased from
day 7 to 28 of observation. IP-10 levels in the plasma of patients
with COVID-19 were increased compared to those in the control
group, except for a drop to normal ranges on day 7. TNF-α levels
were significantly higher on days 0, 14, and 28 in the COVID-19
group, with a slight reduction on day 7 compared to the control
group. The concentration of MIP-1α was higher at the beginning of
observation in COVID-19 patients in comparison with the control
group. Furthermore, the levels of MIP-1α, IL-6, and IL-2 were not
altered throughout the observation period in the COVID-19 group
between different time points. However, IL-6 values differed
significantly from the control group on days 0 (P≤0.001), 7
(P≤0.01), and 14 (P≤0.01). The concentration of G-CSF gradually
decreased over the observation period in the COVID-19 group and
MCP-1 levels in the plasma of patients with COVID-19 increased from
day 7 (Fig. 5).
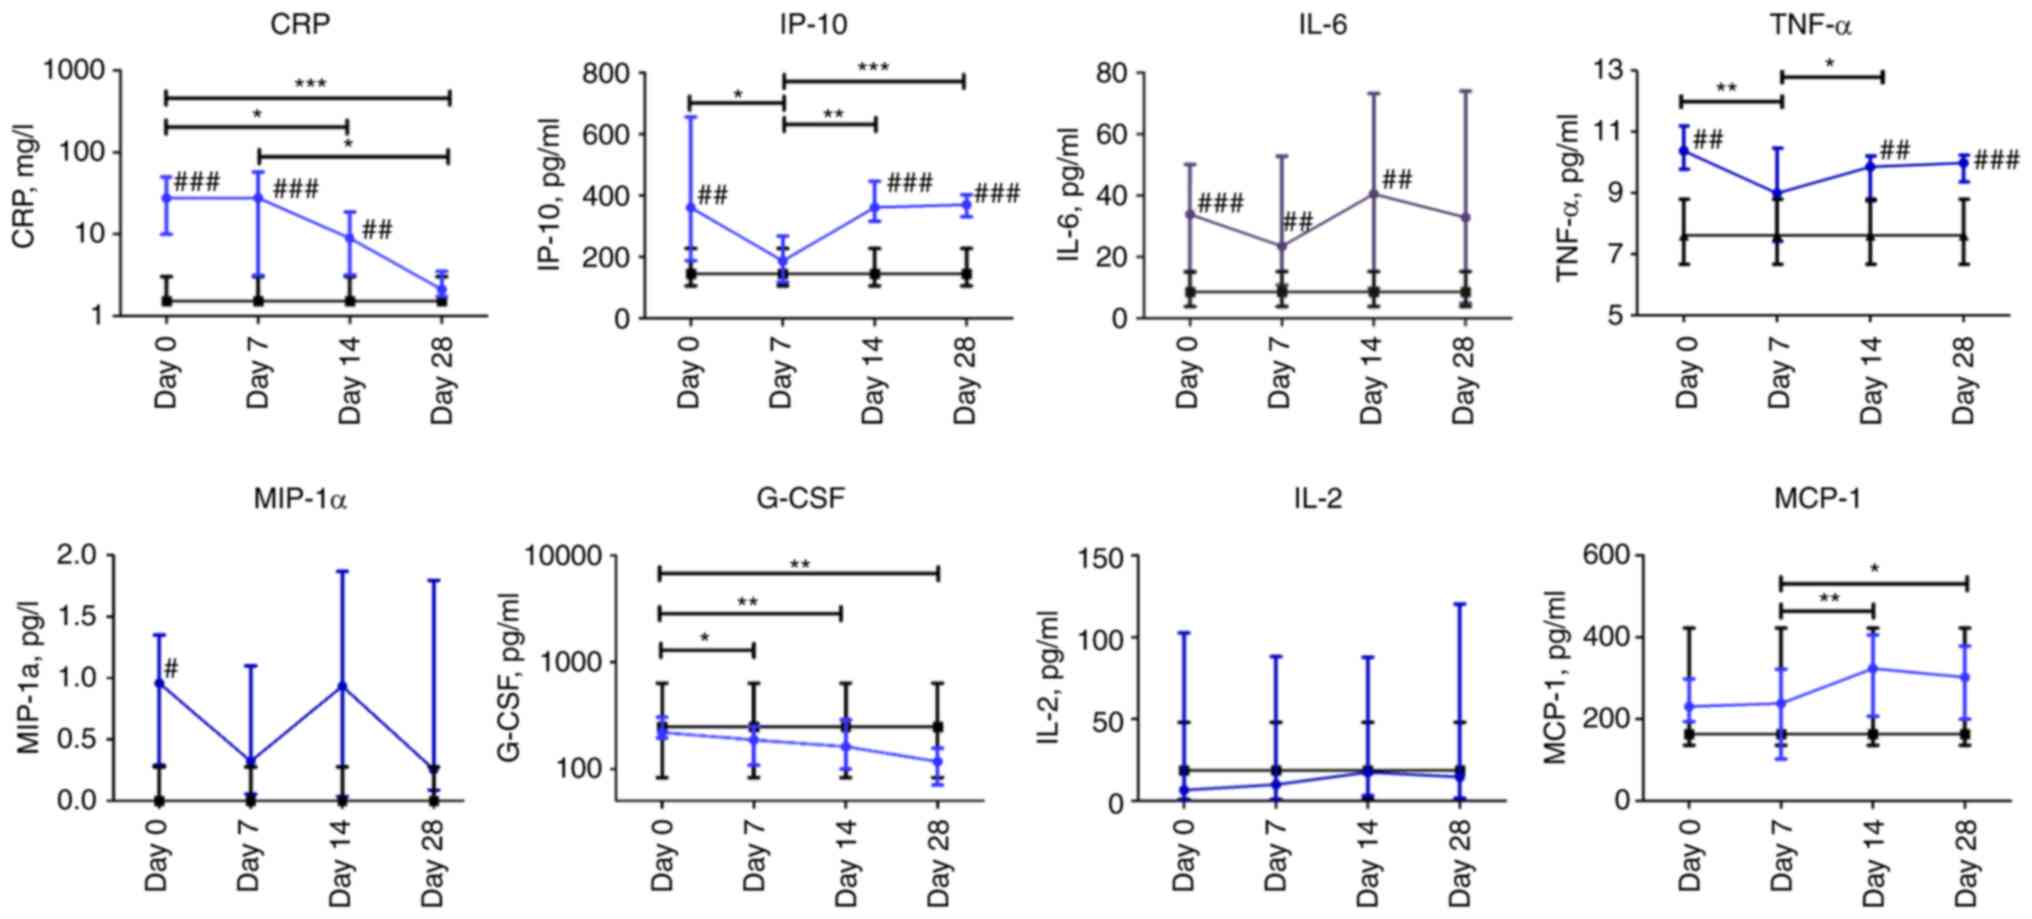 | Figure 5Dynamic changes in cytokine levels in
patients with COVID-19. Data are presented as a median and
interquartile range. Wilcoxon signed-rank test was used for
comparison of time-dependent events: *P≤0.05,
**P≤0.01 and ***P≤0.001. Mann-Whitney U test
for comparing the control and COVID-19 groups at each time point:
#P≤0.05, ##P≤0.01 and ###P≤0.001.
The blue line represents the COVID-19 group; and the black line
represents the control group. COVID-19, coronavirus disease 19;
CRP, C-reactive protein; IP-10, interferon γ-induced protein 10;
IL-6, interleukin 6; TNF-α, tumor necrosis factor-α; MIP-1α,
macrophage inflammatory protein-1α; G-CSF, granulocyte
colony-stimulating factor; IL-2, interleukin 2; MCP-1, monocyte
chemoattractant protein-1. |
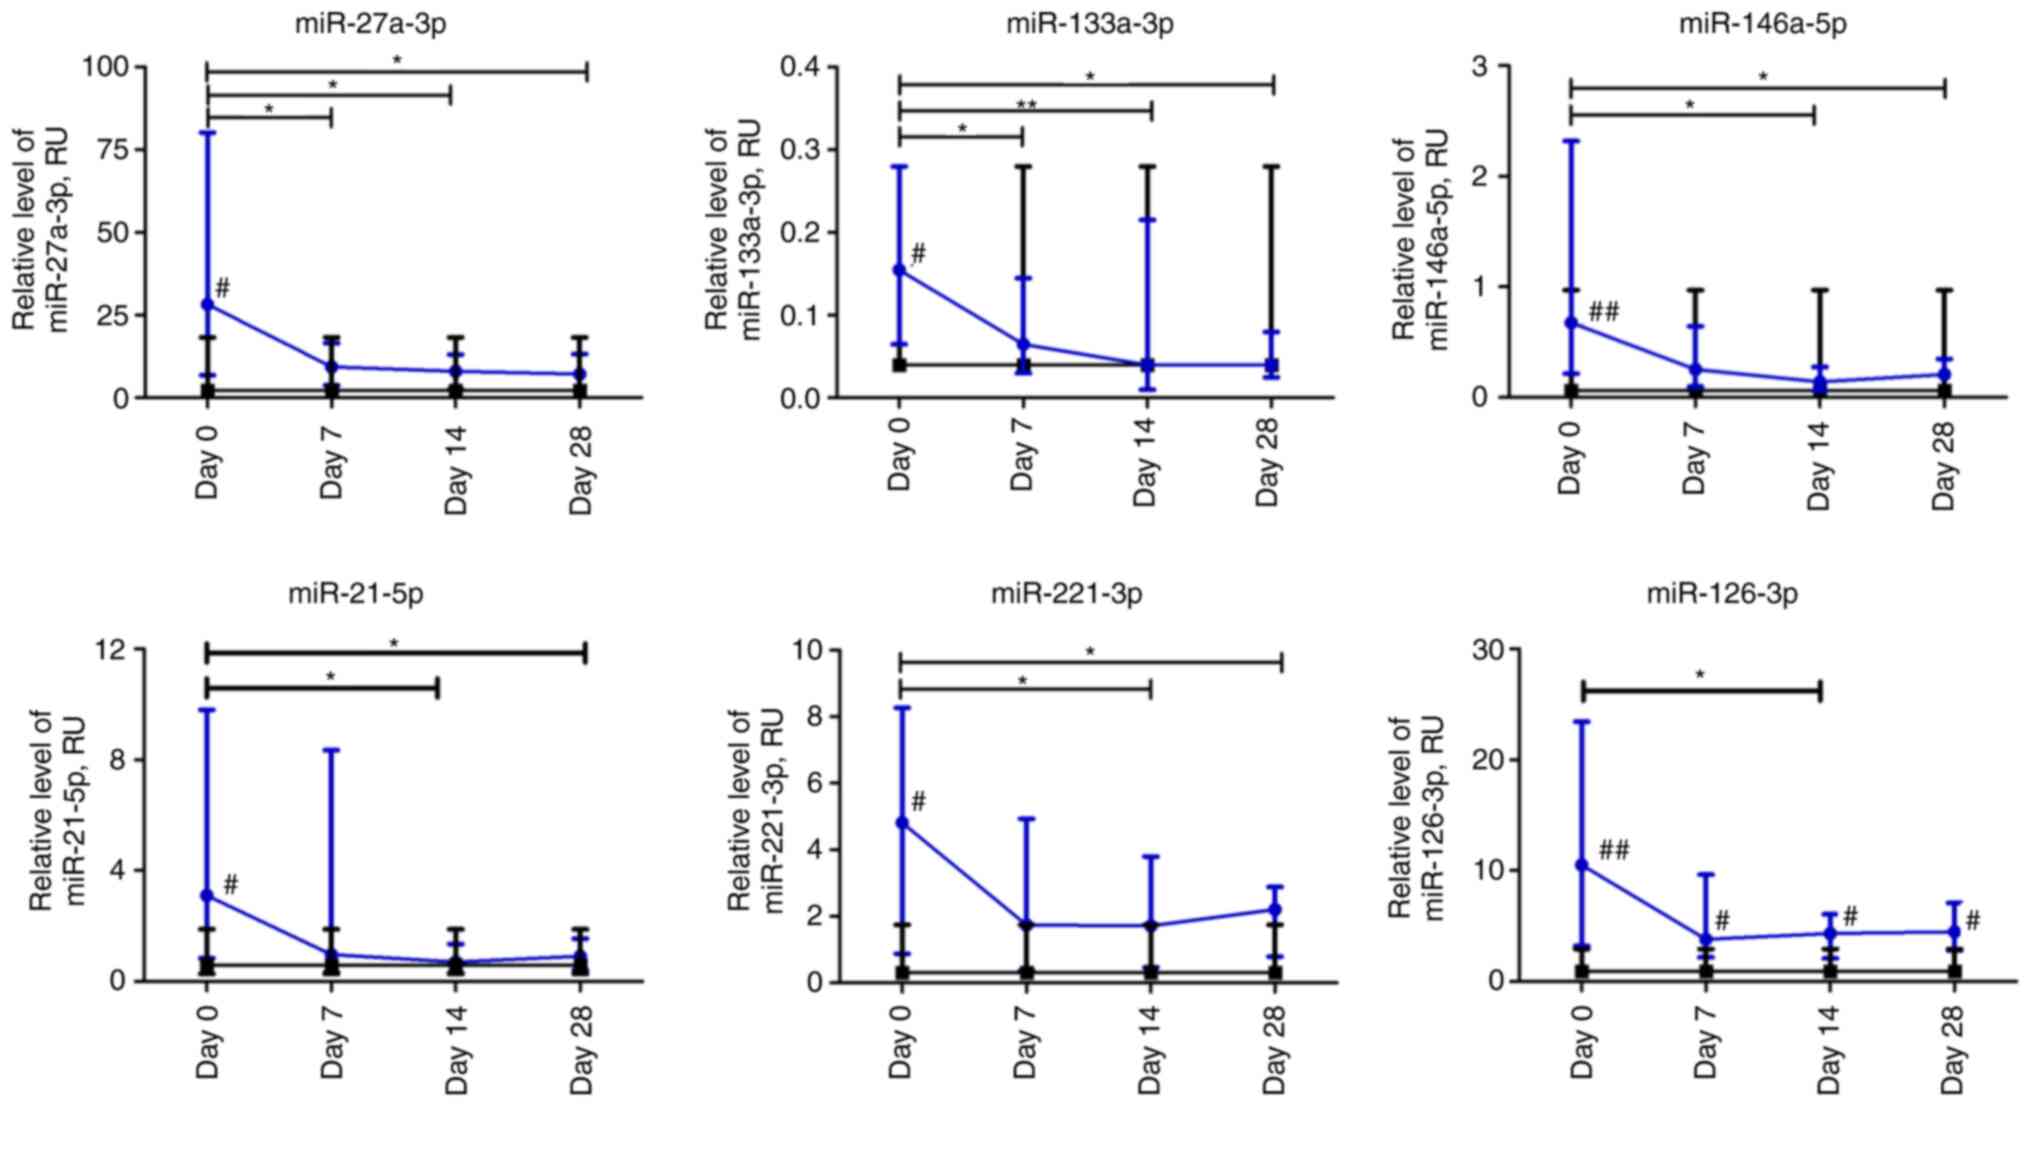
At the beginning of observation, all investigated
miRs had significantly higher expression levels compared to
non-COVID-19 volunteers. The relative expression levels of
miR-27a-3p and miR-133a-3p in patients with COVID-19 decreased
significantly over the first week and remained at a low level up to
day 28 compared to day 0 (P≤0.05 and P≤0.01, respectively). The
relative expression levels of miR-146a-5p, miR-21-5p, and
miR-221-3p in the plasma of patients with COVID-19 were
significantly lower on days 14 and 28 compared to day 0. The
relative level of miRNA expression was altered most markedly on day
14 compared to day 0. For example, the relative expression levels
of miR-21-5p and miR-146a-5p exhibited a 4-fold decrease, whereas
that of miR-221-3p exhibited a 3-fold decrease. The relative
expression level of miR-126-3p in the COVID-19 group significantly
differed at day 14 compared to the day 0 time point. The expression
of all investigated miRNAs markedly differed from the control group
on day 0 (P≤0.05). Moreover, miR-126-3p remained significantly
higher in COVID-19 patients during the four weeks of observation
compared to the control group (Fig.
6).
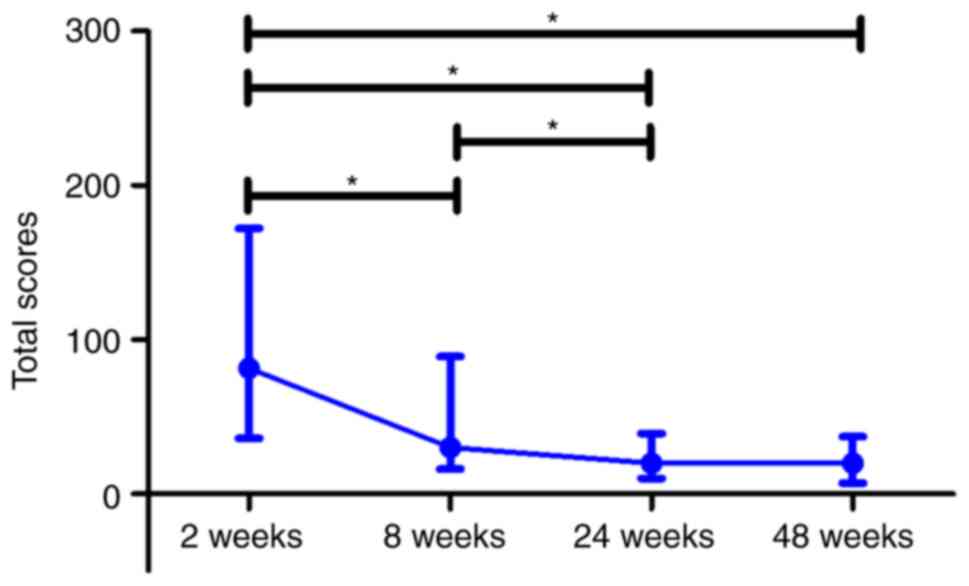
CT of the lungs
The total lung CT score of patients with COVID-19
gradually decreased over all the observation period with
significant differences on weeks 8, 24 and 48 compared to week 2
(P≤0.05). In addition, the CT score differed significantly between
week 8 and 24 (P≤0.05). Concurrently, the median value for the CT
total score did not significantly differ between weeks 24 and 48
after the beginning of hospitalization (Fig. 7).
Correlation between lymphocyte
subsets, cytokines, and miRNA
The most significant data obtained using correlation
analysis are presented in Fig. S4.
CRP levels were positively correlated with ESR (r=0.545, P≤0.0001),
neutrophil percentage (r=0.688, P≤0.0001), and granulocytes
(r=0.467, P≤0.0001) and negatively correlated with eosinophils
(r=-0.428, P≤0.001) and lymphocyte count (r=-0.613, P≤0.0001) and
percentage (r=-0.731, P≤0.0001). A negative correlation was
revealed between CRP and plasmacytoid dendritic cells (r=-0,481,
P≤0.001) and classical dendritic cells (=-0.589, P≤0,0001). A
positive correlation was found between the concentration of G-CSF
and ESR (r=0.424, P≤0.005) and neutrophil percentage (r=0.443,
P≤0.001) and a negative correlation was revealed with lymphocyte
count (r=-0.448, P≤0.001). Additionally, G-CSF was highly
correlated with the expression of miR-27a-3p (r=0.401, P≤0.001),
miR-21-5p (r=0.304, P≤0.01), miR-146a-5p (r=0.321, P≤0.01),
miR-221-3p (r=0.302, P≤0.01), and miR-133a-3p (r=0.351,
P≤0.005).
miR-126-3p expression was positively correlated with
inflammatory monocyte-derived dendritic cells (r=0.314, P≤0.01),
CD3+CD127hi cells (r=0.336, P≤0.005) and
negatively with regulatory dendritic cells (r=-0.334, P≤0.005)
(data not shown). miR-146a-5p negatively correlated with WBC
(r=-0.379, P≤0.005). The plasma level of miR-21-5p was negatively
correlated with dendritic cells (r=-0.358, P≤0.005) and senescent
memory CD8 T cells (r=-0.333, P≤0.005). A positive correlation was
revealed between miR-133a-3p and IL-6 (r=0.316, P≤0.01).
The subset of regulatory dendritic cells was
positively correlated with the content of NK cells (r=0.503,
P≤0.0001) and negatively with B cells (r=-0.487, P≤0.0001). In
addition, plasmacytoid dendritic cells were negatively correlated
with neutrophils (r=-0.405, P≤0.005) and positively with classical
dendritic cells (r=0.460, P≤0.0001).
CD3+CD25+ was strongly correlated with the
content of following CD8 T cells subsets: Activated (r=0.810,
P≤0.0001), senescent (r=0.701, P≤0.0001), senescent memory
(r=0.591, P≤0.0001), and exhausted CD8 T cells (r=0.854, P≤0.0001).
The analysis revealed a negative correlation between
CD14+ myeloid cells and T-cell populations as follows:
DP CD4+CD8+ (r=-0.325, P≤0.001), Th cells
(r=-0.807, P≤0.0001), effector Th cells (r=-0.731, P≤0.0001),
cytotoxic T cells (r=-0.311, P≤0.01), memory Th cells (r=-0.624,
P≤0.0001), PD-1low T cells (r=-0.499, P≤0.0001), and
CD127low T cells (r=-0.470, P≤0.0001).
Correlation between laboratory
parameters and CT
The most significant data on the correlation
analysis with CT scores are presented in Table II. The CT score was negatively
correlated with lymphocyte count and positively with ESR. The CT
parameters of lung injury were negatively correlated with the
content of CD4+ among CD45+ cells. The
percentage of senescent memory CD4+ and CD8+
T cells among CD45+ cells was positively correlated with
CT lesions. CD3+CD57hi and
CD3+CD127hi cells were strongly positively
and negatively correlated, respectively, with the CT scores of the
lung. A positive correlation was revealed between the lung lesion
score and G-CSF, IP-10, and MIP-1α concentration on weeks 2, 8, 24
and 48.
| Table IICorrelation analysis between computed
tomography lesions and certain laboratory parameters. |
Table II
Correlation analysis between computed
tomography lesions and certain laboratory parameters.
| | Weeks after
beginning of hospitalization |
|---|
| Parameters | Spearman's
correlation-coefficient and P-value | 2 | 8 | 24 | 48 |
|---|
| Lymphocyte
count | r | -0.350 | -0.461 | -0.457 | -0.424 |
| | P-value | ≤0.05 | ≤0.005 | ≤0.005 | ≤0.005 |
| CD4 T cells | r | -0.372 | -0.327 | -0.343 | -0.360 |
| | P-value | ≤0.01 | ≤0.05 | ≤0.05 | ≤0.05 |
| Senescent memory
CD4 T cells | r | 0.185 | 0.430 | 0.382 | 0.337 |
| | P-value | ns | ≤0.005 | ≤0.05 | ≤0.05 |
| Senescent memory
CD8 T cells | r | 0.320 | 0.500 | 0.544 | 0.568 |
| | P-value | ≤0.05 | ≤0.001 | ≤0.001 | ≤0.0001 |
|
CD3+CD127hi
cells | r | -0.487 | -0.437 | -0.453 | -0.484 |
| | P-value | ≤0.0001 | ≤0.005 | ≤0.005 | ≤0.001 |
|
CD3+CD57hi
cells | r | 0.334 | 0.457 | 0.469 | 0.408 |
| | P-value | ≤0.05 | ≤0.005 | ≤0.001 | ≤0.01 |
| ESR | r | 0.349 | 0.507 | 0.507 | 0.477 |
| | P-value | ≤0.05 | ≤0.001 | ≤0.001 | ≤0.001 |
| G-CSF | r | 0.308 | 0.492 | 0.434 | 0.397 |
| | P-value | ≤0.05 | ≤0.001 | ≤0.01 | ≤0.01 |
| IP-10 | r | 0.419 | 0.594 | 0.599 | 0.576 |
| | P-value | ≤0.005 | ≤0.0001 | ≤0.0001 | ≤0.0001 |
| MIP-1α | r | 0.340 | 0.411 | 0.414 | 0.478 |
| | P-value | ≤0.05 | ≤0.01 | ≤0.005 | ≤0.001 |
Discussion
In the present study, the dynamic changes in blood
parameters, including alterations in individual cell
subpopulations, selected miRNAs, and cytokine levels in the
peripheral blood of patients with severe COVID-19 over 28 days of
the disease and their association to lung lesions in the long term
were assessed.
It was observed that WBC and granulocyte counts
increased on day 7 and decreased on day 28, whereas the percentage
of neutrophils, including banded and segmented, decreased
gradually. However, an opposite trend in the percentage and count
of lymphocytes was observed, demonstrating a regular increase.
Similar dynamics in increased neutrophils versus decreased
lymphocytes in patients with severe COVID-19 have been previously
reported (28). Another study also
showed that critical patients with COVID-19 pneumonia have an
immune deficiency, which may lead to serious infection and
mortality (23). The reduction in
lymphocytes may be caused by the dysregulation in cytokine
production (29), destruction of
lymphatic organs (30), and
migration of CD8+ circulating lymphocytes to the lungs
(24,31). This data coincides with a negative
correlation between lymphocyte count and lung lesions revealed in
the present study.
The observed decrease in the percentage of T cells
and NK cells among PBMCs on day 7 of hospitalization and concurrent
increase in the percentage of B cells may be associated to
corticosteroid treatment (32,33).
In general, no changes in the B lymphocyte population were detected
in other study groups (34,35).
The findings in the present study showed higher
frequencies of PD-1-positive T cells at different time points in
patients with COVID-19 compared to day 0. PD-1 downregulates the
proliferation and production of cytokines by T cells and controls
the damage to normal tissues during infection (36). Moreover, an increased percentage and
absolute count of PD-1-expressing CD3+CD4+
and CD3+CD8+ T cells have been previously
reported in autoimmune diseases (37). The formation of an inflammatory
control mechanism by the increase in PD-1-positive T and non-T cell
subpopulations as well as regulatory CD4 T cells in patients with
COVID-19 across the whole observation period is suggested.
CD3+CD4+CD8+ DP T
cells are a distinct, minor population of cells that are
particularly detectable in viral infections and have both cytotoxic
and immunosuppressive properties (38,39).
The increase of DP T cells with
CD3+CD4+CD8+ immunophenotype among
mononuclear WBCs in the process of recovery from COVID-19 was
revealed. This may indicate their functional significance in the
fight against persistent infections. However, the absolute counts
of CD3+CD4+CD8+ DP T lymphocytes
progressively decreased in patients with more severe
COVID-19(21).
A consistent increase in the content of
CD25+ and CD127+ T cells over 28 days was
observed. Furthermore, the content of CD127+ T cells was
negatively correlated with lung injuries. Upregulated expression of
CD25+ on T cells from patients with severe COVID-19 has
also been reported (40,41). Moreover, Chen et al (42) revealed that the number and
proportion of CD4+CD25+CD127low
cells increased in both patients with mild and severe COVID-19,
compared to the control group, and remained at higher levels after
recovery. Additionally, CD127-expressing T cells are considered to
be SARS-CoV-2-specific long-lived T cells (43). Signaling by CD127/IL-7 is involved
in numerous key aspects of T-cell survival and proliferation,
therefore, increased CD127 expression levels on T cells could be
involved in overcoming lymphopenia in patients with COVID-19 and
thus lead to a decrease in lung inflammation. Furthermore, it was
shown that an increase in the content of activated effector T cells
with CD4+CD25+CD127high phenotype
has a significant negative correlation with multiple organ failure
(44). In the present study, the
content of CD3+CD25+ T cells was strongly
associated with different populations of activated, senescent, and
exhausted CD8+ T cells. Arguably, CD25-expressing
activated T cells receive IL-2 signaling, which further in a
positive feedback manner promotes their proliferation and
differentiation (45). During the
observation period, an increased content of CD4 T-cell subsets
(memory, effector, activated, senescent, senescent memory, and
exhausted) and CD8 T cells (effector, activated, senescent memory,
and exhausted CD8 Т cells) was noted, suggesting the activation of
an adaptive immune response against the inflammation progression in
the lungs. In addition, abundant content of activated both
CD4+ and CD8+ T cells is a characteristic of
COVID-19 increasingly studied (45,46).
Dysregulation of reactive CD8+ and CD4 T cells has been
described in the early phase of immune response and immune memory
development (47-49).
The data in the present study are consistent with those of a
previous study that reported an association between a high level of
CD57 expression among CD8+ T cells and immune senescence
with either human aging or prolonged chronic infections in patients
with severe COVID-19(50). The
association that was revealed between the proportions of senescent
memory T cells and CD3+CD57hi cells with the
lung lesion indicates that lymphocytes are one of the key players
in the pathogenesis of lungs during COVID-19.
In the present study, a strong correlation was
detected between both activated CD4 and CD8 T cells and the PD-1
expression levels. Similarly, a high correlation was previously
revealed between PD-1-expressing cells and activated
CD38+HLA-DR+ CD4 T cells, but not with
activated CD8 T cells (42).
Notably, activated T cells also increase the expression of the
activation markers CD38 and HLA-DR (48). From day 7, a significant increase in
the percentage of Treg cells was observed. Certain studies revealed
a lower level of Tregs in severe patients than in mild or moderate
patients (51,52), whereas Chen et al indicated a
trend toward higher content of Tregs in the severe group (53). Moreover, the dynamics of Treg
frequency with a gradual increase from day 7 that peaked on day 22
compared to healthy donors, and a slight decrease up to day 28 was
reported in a case report of an asymptomatic COVID-19 patient
(54). It is considered that all
these discrepancies in results occurred due to variance in the time
of assessment and do not comprise the full pattern of dynamic
changes in cell subpopulations during the course of COVID-19.
It was revealed that the percentage of classical
and plasmacytoid dendritic cells was significantly lower on days 0
and 7 but restored from day 14 in the COVID-19 group. These data
are consistent with the previously reported lower frequency of
CD1c+ dendritic cells in peripheral blood in patients
with severe COVID-19 due to their increased migration to the lungs
(55). Moreover, it was reported
that lower percentages of plasmacytoid and myeloid dendritic cells
were observed in the blood of patients with severe COVID-19
compared to healthy donors (34).
The repeated increase in the content of
CD45+CD11clowCD11bdim regulatory
dendritic cells on days 14-28 after a slight decrease on day 7, is
considered to be an indicator of prolonged inflammation. The data
in the present study, are consistent with the previously reported
considerable increase in this cell population that was almost
restored to normal levels after intravenous transplantation of
mesenchymal stem cells in patients with severe COVID-19(56). Thus, it is surmised that regulatory
dendritic cells are essential for the excessive production of
proinflammatory cytokines and further aggravate infection by
suppressing T-cell functions (57).
Interestingly, regulatory dendritic cells were positively
correlated with NK cells and negatively with B cells.
Furthermore, it was hypothesized that the detected
under-represented classical dendritic cell content up to day 7,
with a concurrent increase in the percentage of plasmacytoid
dendritic cells observed after day 7, may be a consequence of
corticosteroid therapy (58).
In the present study, a gradual increase in the
percentage of inflammatory monocyte-derived dendritic cells along
with regulatory T cells was observed, implying the formation of
adaptive immunity. These cells have been shown to considerably
increase in numbers and promote the differentiation of memory
CD8+ T cells during acute viral infection (59). In addition, T-cell mediated-response
to the new coronavirus was shown in individuals with asymptomatic
or mild symptoms of COVID-19(60).
Moreover, inflammatory dendritic cells are involved in innate
defense and T-cell activation in a pathogen-dependent manner
(61,62).
Consistent with previous studies (63-65),
the present study confirmed that the CRP level is a useful
biomarker in the early stages of COVID-19 infection . Based on the
data of the present study, although CRP reached the normal value on
day 28 in patients with COVID-19, the levels of several
subpopulation of T cells remained elevated. Therefore, the levels
of pro-inflammatory cytokines should be evaluated to control the
general inflammation status. In the present study, similar to a
previous study (66), a positive
correlation between CRP and inflammatory parameters including ESR,
granulocytes, and neutrophils was observed. While a negative
correlation was revealed between CRP levels and classical and
plasmacytoid dendritic cells that coincides with another study
(67). Furthermore, it was revealed
that CRP is strongly and inversely related to lymphocytes as was
previously reported (68,69).
Previously, high levels of G-CSF were detected in
both intensive care unit (ICU) and non-ICU patients compared to
healthy volunteers (70). In the
present study, it was revealed that G-CSF levels were positively
correlated with neutrophils and negatively with lymphocytes. In
addition, it was shown that the plasma levels of both G-CSF and
MIP-1α were positively correlated with CT scores. It was reported
that the progression of inflammation in patients with COVID-19 may
be related to the amount of G-CSF (71). However, the correlation between
G-CSF, NLR, and the prognosis is still being debated, as is the
utilization of dynamic changes in G-CSF and immune cells content to
predict disease course and response to therapy (72,73).
It was also found that the administration of corticosteroids can
significantly reduce the concentration of IP-10 in the plasma of
patients with COVID-19(20). In the
present study, a decrease was observed in plasma IP-10
concentration on day 7 and its return to baseline through the
second week, in contrast to the levels of IL-6 and CRP. It is
hypothesized that it may be associated with the discontinuation of
corticosteroid therapy. Thus, the plasma levels of IP-10 and MCP-1
in critically ill patients were significantly higher than those in
severe patients (74). Moreover,
IL-6 and MCP-1 are considered as the main risk factors related to
mortality in hospitalized COVID-19 patients (75). In the present study, the plasma
concentration of IP-10 was correlated with lung lesions that
coincides with the aforementioned data. However, in the present
study, the levels of IL-2 and IL-6 were not altered during the
observation period. Most studies reported an increase in IL-2
levels in patients with severe COVID-19 (23,76,77),
whereas, in other studies, IL-2 levels remained within the normal
range during the treatment period (78,79).
As previously reported, the level of IL-6 was higher than in
healthy donors, and similarly to the data of the present study, it
was not significantly altered during the observation period
(42,78). A high level of TNF-α in the serum
and/or plasma of patients with COVID-19 reported in previous
studies (29,56,80) is
consistent with the findings of the present study indicating
abnormally activated host immune cells.
It was observed that the relative expression levels
of miR-21-5p, miR-221-3p, miR-27a-3p, miR-133a-63p, and miR-146a-5p
were significantly higher at the beginning of hospitalization and
decreased within two weeks of treatment. miR-146a has been
previously reported to be an important molecular suppressor of
inflammation through its capacity to target members of TLR and
NF-κB signaling, as well as the proteoglycan family (81). miR-146a reduces NF-κB-dependent
pro-inflammatory cytokines in TNF-α-stimulated monocytes (82). Additionally, an increase in the
expression level of miR-146a was revealed to reduce lung cell
damage by suppressing inflammatory responses (83). Moreover, a high expression level of
miR-146a-5p in plasma in the COVID-19 patient group compared to the
healthy group has been previously shown (84). Furthermore, in the present study, a
negative correlation between the level of miR-146a and WBC was
observed. It has been previously reported that the serum
concentration of miR-21 was significantly increased in patients
with COVID-19 compared to healthy controls (85). It was revealed in the present study
that the plasma level of miR-21 in patients with COVID-19 was
negatively correlated with dendritic cells and senescent memory CD8
T cells suggesting its immunosuppressive properties. Similar
immunosuppressive capacity of miR-21 leading to a decrease in
cytotoxic T cells was shown in the tumor microenvironment (86).
In a previous study by Wang et al, miR-221
was significantly upregulated in the lung tissue of mice with
LPS-induced acute lung injury (ALI) . Furthermore, the study
revealed that the protective effect of miR-221 on LPS-induced ALI
may be mediated by the suppression of the NF-κB pathway (87). Consistent with this, the results of
the present study suggest miR-221 as an indicator for lung damage.
On days 7 and 14 of follow-up, miR-133a-3p relative expression
level was reduced 2-fold and 4-fold, respectively, compared to day
0. The relative level of miR-133a-3p in plasma was positively
associated with IL-6, which may indicate myocardial injury. Indeed,
the serum level of miR-133 was shown to be positively correlated
with IL-6 in patients with the therosclerotic thrombotic cerebral
infarction and cardioembolic stroke (88). In the present study, the relative
expression of miR-126 was higher than in non-COVID-19 volunteers in
contrast to previously published data (85). It was demonstrated that miR-126-3p
expression was positively correlated with inflammatory
monocyte-derived dendritic cells and negatively with regulatory
dendritic cells establishing their pro-inflammatory role in
COVID-19. The function of miR-126-5p as a positive regulator of
monocyte-mediated inflammatory responses was previously reported
(89). In addition, miR-126-3p was
the most strongly upregulated in CD14+ cells among
patients with axial spondyloarthritis (90). The majority of miRNAs have a
positive association with the levels of G-CSF and as follows, are
involved in inflammation, thus contributing to COVID-19
severity.
In summary, the present study highlights the
dynamic changes in different subpopulations of immune cells in
patients with severe COVID-19. The collected data indicated the
immunodeficiency state and development of the ‘cytokine storm’
syndrome in patients with COVID-19 on day 0 of observation. At the
beginning of the observation, lymphopenia and leucopenia were
detected in most patients with COVID-19, as well as an increase in
the percentage of banded neutrophils, B cells, and CD4+
Treg cells, while a decrease in the content of PD-1low T
cells, classical, plasmacytoid, and regulatory dendritic cells was
also observed. The increased content of different subpopulations of
T and dendritic cells starting from the 14th day of hospitalization
indicates the activation of the immune response against the
progression of inflammation in the lungs. For the first time,
dynamic changes in DP CD3+CD4+CD8+
cells, CD127-expressing T cells, CD25-expressing T cells,
PD-1low non-T cells, and PD-1low T-cell
frequencies have been described in patients with severe COVID-19
pneumonia. The increase of PD-1-positive subpopulations of T and
non-T cells and regulatory CD4 T cells in patients with COVID-19
during the observation period suggests the development of an
inflammation control mechanism. The positive response after
treatment was observed starting from the 7th day, except for T
cells, IL-6, TNF-α, and IP-10 levels, which remained increased
again from day 14. The high expression levels of miR-21-5p,
miR-221-3p, miR-27a-3p, miR-146a-5p, miR-133a-3p, and miR-126-3p at
the beginning of hospitalization may contribute to the disease
severity. Based on the results of lung CT score correlation
analysis, increased concentrations of G-CSF, IP-10, and MIP-1a, as
well as the content of lymphocytes, senescent memory T cells,
CD127+ T cells, and CD57+ T cells, had the
most prominent impact on post-COVID-19 lung injuries in a long-term
period.
Supplementary Material
Gating strategy for white blood cells,
T cells, B cells, natural killer cells, double-positive
CD4+CD8+ T cells,
CD3+PD-1low T cells, CD3-PD-1low
non-T cells, and CD25- and CD127-expressing T cells. PBMCs,
peripheral blood mononuclear cells; NK, natural killer; DP,
double-positive.
Gating strategy for subpopulations of
CD4+ and CD8+ T cells (memory, effector,
activated, senescent, exhausted, regulatory, and senescent memory).
PBMCs, peripheral blood mononuclear cells; CTLs, cytotoxic T
cells.
Gating strategy for myeloid
mononuclear cells subsets: Monocytes, classical DCs, DCs,
plasmacytoid DCs, regulatory DCs, inflammatory monocyte-derived
DCs. PBMCs, peripheral blood mononuclear cells; DCs, dendritic
cells; pDCs, plasmacytoid dendritic cells; Mo-DCs, monocyte-derived
dendritic cells.
Correlations between lymphocyte
subsets, cytokines, and microRNAs in COVID-19 patients. COVID-19,
coronavirus disease 19; CT, computed tomography; ESR, erythrocyte
sedimentation rate; IP-10, interferon γ-induced protein 10; MIP-1α,
macrophage inflammatory protein-1α; G-CSF, granulocyte
colony-stimulating factor; miR, microRNA; WBC, white blood cells;
CRP, C-reactive protein; DCs, dendritic cells; NK, natural
killer.
Antibodies used for cell
characterization by immunofluorescence.
Combinations of markers used for
distinct populations of PBMC analysis.
Primer sequences used for miRNA
detection.
Acknowledgements
The authors express their gratitude to Mr S.
Martynenko, the director of the Institute of Cell Therapy (Kyiv,
Ukraine), for helping to organize and supporting this research. The
authors wish to gratefully acknowledge PCR and clinical diagnostic
laboratories of the Institute of Cell Therapy for their assistance
in sample processing. The authors acknowledge the help of Dr A.
Ustymenko (State Institute of Genetic and Regenerative Medicine,
National Academy of Medical Sciences of Ukraine, Kyiv, Ukraine) for
technical aid.
Funding
Funding: The present study was funded by the National Research
Foundation of Ukraine, grant no. 2020.01/0246, ‘Study of the state
of respiratory, cardiovascular and immune systems in patients with
COVID-19 pneumonia after transplantation of cryopreserved
allogeneic mesenchymal stem cells’.
Availability of data and materials
All datasets presented in this study are provided
in the article. Data on correlation analysis may be obtained from
the corresponding author upon reasonable request.
Authors' contributions
TB, VS, and ISk conceived and designed the study.
TB, VK, GL, and VN developed the methodologies. AV, PN, and OC
acquired the clinical samples and data. TB performed ELISA. ISk,
VS, ISh, and OM performed the real-time PCR. VK designed the
cytometry panels and performed flow cytometry. TB, VK, VN, ISh, VS,
and OM performed the experiments and analyzed the data. TB, HS, and
VS analyzed the data and revised the manuscript. TB and VS confirm
the authenticity of all the raw data. All authors contributed to
the manuscript and, read and approved the final version.
Ethics approval and consent to
participate
The present study was approved (protocol no. 280;
April 23, 2020) by the Ethics Committee of the Kyiv City Clinical
Hospital No. 4 (Kyiv, Ukraine). The study protocol was designed in
accordance with the Declaration of Helsinki. Written informed
consent was obtained from all subjects enrolled in the study.
Patient consent for publication
Not applicable.
Competing interests
The authors declare that the research was conducted
in the absence of any commercial or financial associations that
could be construed as potential competing interests.
References
|
1
|
Rodriguez-Morales AJ, Cardona-Ospina JA,
Gutiérrez-Ocampo E, Villamizar-Peña R, Holguin-Rivera Y,
Escalera-Antezana JP, Alvarado-Arnez LE, Bonilla-Aldana DK,
Franco-Paredes C, Henao-Martinez AF, et al: Clinical, laboratory
and imaging features of COVID-19: A systematic review and
meta-analysis. Travel Med Infect Dis. 34(101623)2020.PubMed/NCBI View Article : Google Scholar
|
|
2
|
Ye Q, Wang B and Mao J: The pathogenesis
and treatment of the ‘Cytokine Storm’ in COVID-19. J Infect.
80:607–613. 2020.PubMed/NCBI View Article : Google Scholar
|
|
3
|
Chousterman BG, Swirski FK and Weber GF:
Cytokine storm and sepsis disease pathogenesis. Semin Immunopathol.
39:517–528. 2017.PubMed/NCBI View Article : Google Scholar
|
|
4
|
Islam MT, Nasiruddin M, Khan IN, Mishra
SK, Kudrat-E-Zahan M, Riaz TA, Ali ES, Rahman MS, Mubarak MS,
Martorell M, et al: A perspective on emerging therapeutic
interventions for COVID-19. Front Public Health.
8(281)2020.PubMed/NCBI View Article : Google Scholar
|
|
5
|
Puneet P, Moochhala S and Bhatia M:
Chemokines in acute respiratory distress syndrome. Am J Physiol
Lung Cell Mol Physiol. 288:L3–L15. 2005.PubMed/NCBI View Article : Google Scholar
|
|
6
|
Bhatia M, Zemans RL and Jeyaseelan S: Role
of chemokines in the pathogenesis of acute lung injury. Am J Respir
Cell Mol Biol. 46:566–572. 2012.PubMed/NCBI View Article : Google Scholar
|
|
7
|
Tomashefski JF Jr: Pulmonary pathology of
acute respiratory distress syndrome. Clin Chest Med. 21:435–466.
2000.PubMed/NCBI View Article : Google Scholar
|
|
8
|
Lyu P, Liu X, Zhang R, Shi L and Gao J:
The performance of chest CT in evaluating the clinical severity of
COVID-19 pneumonia: Identifying critical cases based on CT
characteristics. Invest Radiol. 55:412–421. 2020.PubMed/NCBI View Article : Google Scholar
|
|
9
|
Zhao W, Zhong Z, Xie X, Yu Q and Liu J:
Relation between chest CT findings and clinical conditions of
coronavirus disease (COVID-19) pneumonia: A multicenter study. AJR
Am J Roentgenol. 214:1072–1077. 2020.PubMed/NCBI View Article : Google Scholar
|
|
10
|
Wu J, Wu X, Zeng W, Guo D, Fang Z, Chen L,
Huang H and Li C: Chest CT findings in patients with coronavirus
disease 2019 and its relationship with clinical features. Invest
Radiol. 55:257–261. 2020.PubMed/NCBI View Article : Google Scholar
|
|
11
|
Alon R, Sportiello M, Kozlovski S, Kumar
A, Reilly EC, Zarbock A, Garbi N and Topham DJ: Leukocyte
trafficking to the lungs and beyond: Lessons from influenza for
COVID-19. Nat Rev Immunol. 21:49–64. 2020.PubMed/NCBI View Article : Google Scholar
|
|
12
|
Zemans RL, Colgan SP and Downey GP:
Transepithelial migration of neutrophils: Mechanisms and
implications for acute lung injury. Am J Respir Cell Mol Biol.
40:519–535. 2009.PubMed/NCBI View Article : Google Scholar
|
|
13
|
Zhang L, Yan X, Fan Q, Liu H, Liu X, Liu Z
and Zhang Z: D-dimer levels on admission to predict in-hospital
mortality in patients with Covid-19. J Thromb Haemost.
18:1324–1329. 2020.PubMed/NCBI View Article : Google Scholar
|
|
14
|
Li H, Xiang X, Ren H, Xu L, Zhao L, Chen
X, Long H, Wang Q and Wu Q: Serum amyloid A is a biomarker of
severe Coronavirus disease and poor prognosis. J Infect.
80:646–655. 2020.PubMed/NCBI View Article : Google Scholar
|
|
15
|
Gao L, Jiang D, Wen XS, Cheng XC, Sun M,
He B, You LN, Lei P, Tan XW, Qin S, et al: Prognostic value of
NT-proBNP in patients with severe COVID-19. Respir Res.
21(83)2020.PubMed/NCBI View Article : Google Scholar
|
|
16
|
Al Balushi A, Al Shekaili J, Al Kindi M,
Ansari Z, Al-Khabori M, Khamis F, Ambusaidi Z, Al Balushi A, Al
Huraizi A, Al Sulaimi S, et al: Immunological predictors of disease
severity in patients with COVID-19. Int J Inf Dis. 110:83–92.
2021.PubMed/NCBI View Article : Google Scholar
|
|
17
|
Sidiropoulou P, Docea AO, Nikolaou V,
Katsarou MS, Spandidos DA, Tsatsakis A, Calina D and Drakoulis N:
Unraveling the roles of vitamin D status and melanin during
COVID-19 (Review). Int J Mol Med. 47:92–100. 2021.PubMed/NCBI View Article : Google Scholar
|
|
18
|
Hussain T, Zhao D, Shah SZA, Wang J, Yue
R, Liao Y, Sabir N, Yang L and Zhou X: MicroRNA 27a-3p regulates
antimicrobial responses of murine macrophages infected by
mycobacterium avium subspecies paratuberculosis by targeting
interleukin-10 and TGF-β-activated protein kinase 1 binding protein
2. Front Immunol. 11(1915)2018.PubMed/NCBI View Article : Google Scholar
|
|
19
|
de Gonzalo-Calvo D, Benitez ID, Pinilla L,
Carratala A, Moncusi-Moix ANNA, Gort-Paniello C, Molinero M,
González J, Torres G, Bernal M, et al: Circulating microRNA
profiles predict the severity of COVID-19 in hospitalized patients.
Transl Res. 236:147–159. 2021.PubMed/NCBI View Article : Google Scholar
|
|
20
|
Lev S, Gottesman T, Levin GS, Lederfein D,
Berkov E, Diker D, Zaidman A, Nutman A, Ber AI, Angel A, et al:
Observational cohort study of IP-10's potential as a biomarker to
aid in inflammation regulation within a clinical decision support
protocol for patients with severe COVID-19. PLoS One.
16(e0245296)2021.PubMed/NCBI View Article : Google Scholar
|
|
21
|
Iannetta M, Buccisano F, Fraboni D,
Malagnino V, Campogiani L, Teti E, Spalliera I, Rossi B, Di Lorenzo
A, Palmieri R, et al: Baseline T-lymphocyte subset absolute counts
can predict both outcome and severity in SARS-CoV-2 infected
patients: A single center study. Sci Rep. 11(12762)2021.PubMed/NCBI View Article : Google Scholar
|
|
22
|
Deng R, Wang C, Ye Y, Gou L, Fu Z, Ye B,
Shao F, Zhang X, Fu W, Xiao J, et al: Clinical manifestations of
blood cell parameters and inflammatory factors in 92 patients with
COVID-19. Ann Transl Med. 9(62)2021.PubMed/NCBI View Article : Google Scholar
|
|
23
|
Shi H, Wang W, Yin J, Ouyang Y, Pang L,
Feng Y, Qiao L, Guo X, Shi H, Jin R and Chen D: The inhibition of
IL-2/IL-2R gives rise to CD8 + T cell and lymphocyte decrease
through JAK1-STAT5 in critical patients with COVID-19 pneumonia.
Cell Death Dis. 11(429)2020.PubMed/NCBI View Article : Google Scholar
|
|
24
|
Liao M, Liu Y, Yuan J, Wen Y, Xu G, Zhao
J, Cheng L, Li J, Wang X, Wang F, et al: Single-cell landscape of
bronchoalveolar immune cells in patients with COVID-19. Nat Med.
26:842–844. 2020.PubMed/NCBI View Article : Google Scholar
|
|
25
|
Clinical management of severe acute
respiratory infection when novel coronavirus (nCoV) infection is
suspected [Internet]. [cited 2021 Jul 25]. Available from:
https://www.who.int/publications/i/item/10665-332299.
|
|
26
|
Livak KJ and Schmittgen TD: Analysis of
relative gene expression data using real-time quantitative PCR and
the 2(-Delta Delta C(T)) method. Methods. 25:402–408.
2001.PubMed/NCBI View Article : Google Scholar
|
|
27
|
Büttner L, Aigner A, Fleckenstein FN,
Hamper CM, Jonczyk M, Hamm B, Scholz O and Böning G: Diagnostic
value of initial chest CT findings for the need of ICU
treatment/intubation in patients with COVID-19. Diagnostics
(Basel). 10(929)2020.PubMed/NCBI View Article : Google Scholar
|
|
28
|
Liu J, Li S, Liu J, Liang B, Wang X, Wang
H, Li W, Tong Q, Yi J, Zhao L, et al: Longitudinal characteristics
of lymphocyte responses and cytokine profiles in the peripheral
blood of SARS-CoV-2 infected patients. EBioMedicine.
55(102763)2020.PubMed/NCBI View Article : Google Scholar
|
|
29
|
Huang C, Wang Y, Li X, Ren L, Zhao J, Hu
Y, Zhang L, Fan G, Xu J, Gu X, et al: Clinical features of patients
infected with 2019 novel coronavirus in Wuhan, China. Lancet.
395:497–506. 2020.PubMed/NCBI View Article : Google Scholar
|
|
30
|
Lax SF, Skok K, Zechner P, Kessler HH,
Kaufmann N, Koelblinger C, Vander K, Bargfrieder U and Trauner M:
Pulmonary arterial thrombosis in COVID-19 with fatal outcome:
Results from a prospective, single-center, clinicopathologic case
series. Ann Intern Med. 173:350–361. 2020.PubMed/NCBI View Article : Google Scholar
|
|
31
|
Xu Z, Shi L, Wang Y, Zhang J, Huang L,
Zhang C, Liu S, Zhao P, Liu H, Zhu L, et al: Pathological findings
of COVID-19 associated with acute respiratory distress syndrome.
Lancet Respir Med. 8:420–422. 2020.PubMed/NCBI View Article : Google Scholar
|
|
32
|
Marté JL, Toney NJ, Cordes L, Schlom J,
Donahue RN and Gulley JL: Original research: Early changes in
immune cell subsets with corticosteroids in patients with solid
tumors: Implications for COVID-19 management. J Immunother Cancer.
8(e001019)2020.PubMed/NCBI View Article : Google Scholar
|
|
33
|
Abdin SM, Elgendy SM, Alyammahi SK,
Alhamad DW and Omar HA: Tackling the cytokine storm in COVID-19,
challenges and hopes. Life Sci. 257(118054)2020.PubMed/NCBI View Article : Google Scholar
|
|
34
|
Tomić S, Đokić J, Stevanović D, Ilić N,
Gruden-Movsesijan A, Dinić M, Radojević D, Bekić M, Mitrović N,
Tomašević R, et al: Reduced expression of autophagy markers and
expansion of myeloid-derived suppressor cells correlate with poor T
cell response in severe COVID-19 patients. Front Immunol.
22(614599)2021.PubMed/NCBI View Article : Google Scholar
|
|
35
|
Deng Z, Zhang M, Zhu T, Zhili N, Liu Z,
Xiang R, Zhang W and Xu Y: Dynamic changes in peripheral blood
lymphocyte subsets in adult patients with COVID-19. Int J Infect
Dis. 98:353–358. 2020.PubMed/NCBI View Article : Google Scholar
|
|
36
|
Riley JL: PD-1 signaling in primary T
cells. Immunol Rev. 229:114–125. 2009.PubMed/NCBI View Article : Google Scholar
|
|
37
|
Pyzik A, Grywalska E, Matyjaszek-Matuszek
B, Smoleń A, Pyzik D and Roliński J: Frequencies of PD-1-positive T
CD3+CD4+, T CD3+CD8+ and B CD19+ lymphocytes in female patients
with Graves' disease and healthy controls-preliminary study. Mol
Cell Endocrinol. 448:28–33. 2017.PubMed/NCBI View Article : Google Scholar
|
|
38
|
Nascimbeni M, Shin EC, Chiriboga L,
Kleiner DE and Rehermann B: Peripheral CD4(+)CD8(+) T cells are
differentiated effector memory cells with antiviral functions.
Blood. 104:478–486. 2004.PubMed/NCBI View Article : Google Scholar
|
|
39
|
Overgaard NH, Jung JW, Steptoe RJ and
Wells JW: CD4+/CD8+ double-positive T cells: More than just a
developmental stage? J Leukoc Biol. 97:31–38. 2015.PubMed/NCBI View Article : Google Scholar
|
|
40
|
Yang X, Dai T, Zhou X, Qian H, Guo R, Lei
L, Zhang X, Zhang D, Shi L, Cheng Y, et al: Naturally activated
adaptive immunity in COVID-19 patients. J Cell Mol Med.
24:12457–12463. 2020.PubMed/NCBI View Article : Google Scholar
|
|
41
|
Kalfaoglu B, Almeida-Santos J, Tye CA,
Satou Y and Ono M: T-cell hyperactivation and paralysis in severe
COVID-19 infection revealed by single-cell analysis. Front Immunol.
11(589380)2020.PubMed/NCBI View Article : Google Scholar
|
|
42
|
Chen X, Huang J, Huang Y, Chen J, Huang Y,
Jiang X and Shi Y: Characteristics of immune cells and cytokines in
patients with coronavirus disease 2019 in Guangzhou, China. Hum
Immunol. 81:702–708. 2020.PubMed/NCBI View Article : Google Scholar
|
|
43
|
Neidleman J, Luo X, Frouard J, Xie G, Gill
G, Stein ES, McGregor M, Ma T, George AF, Kosters A, et al:
SARS-CoV-2-Specific T cells exhibit phenotypic features of helper
function, lack of terminal differentiation, and high proliferation
potential. Cell Rep Med. 1(1000081)2020.PubMed/NCBI View Article : Google Scholar
|
|
44
|
Wang W, Xiang HP, Wang HP, Zhu LX and Geng
XP: CD4 + CD25 + CD127 high cells as a negative predictor of
multiple organ failure in acute pancreatitis. World J Emerg Surg.
12(7)2017.PubMed/NCBI View Article : Google Scholar
|
|
45
|
Kalfaoglu B, Almeida-Santos J, Tye CA,
Satou Y and Ono M: T-cell dysregulation in COVID-19. Biochem
Biophys Res Commun. 538:204–210. 2021.PubMed/NCBI View Article : Google Scholar
|
|
46
|
Hanna SJ, Codd AS, Gea-Mallorqui E,
Scourfield DO, Richter FC, Ladell K, Borsa M, Compeer EB, Moon OR,
Galloway SAE, et al: T cell phenotypes in COVID-19-a living review.
Oxf Open Immunol. 2(iqaa007)2021.PubMed/NCBI View Article : Google Scholar
|
|
47
|
Kusnadi A, Ramírez-Suástegui C, Fajardo V,
Chee SJ, Meckiff BJ, Simon H, Pelosi E, Seumois G, Ay F, Vijayanand
P and Ottensmeier CH: Severely ill COVID-19 patients display
impaired exhaustion features in SARS-CoV-2-reactive CD8+ T cells.
Sci Immunol. 6(eabe4782)2021.PubMed/NCBI View Article : Google Scholar
|
|
48
|
Peng Y, Mentzer AJ, Liu G, Yao X, Yin Z,
Dong D, Dejnirattisai W, Rostron T, Supasa P, Liu C, et al: Broad
and strong memory CD4+ and CD8+ T cells induced by SARS-CoV-2 in UK
convalescent individuals following COVID-19. Nat Immunol.
21:1336–1345. 2020.PubMed/NCBI View Article : Google Scholar
|
|
49
|
Neagu M, Calina D, Docea AO, Constantin C,
Filippini T, Vinceti M, Drakoulis N, Poulas K, Nikolouzakis TK,
Spandidos DA and Tsatsakis A: Back to basics in COVID-19: Antigens
and antibodies-completing the puzzle. J Cell Mol Med. 25:4523–4533.
2021.PubMed/NCBI View Article : Google Scholar
|
|
50
|
De Biasi S, Meschiari M, Gibellini L,
Bellinazzi C, Borella R, Fidanza L, Gozzi L, Iannone A, Lo Tartaro
D, Mattioli M, et al: Marked T cell activation, senescence,
exhaustion and skewing towards TH17 in patients with COVID-19
pneumonia. Nat Commun. 11(3434)2020.PubMed/NCBI View Article : Google Scholar
|
|
51
|
Qin C, Zhou L, Hu Z, Zhang S, Yang S, Tao
Y, Xie C, Ma K, Shang K, Wang W and Tian DS: Dysregulation of
immune response in patients with COVID-19 in Wuhan, China. Clin
Infect Dis. 71:762–768. 2020.PubMed/NCBI View Article : Google Scholar
|
|
52
|
Wang F, Hou H, Luo Y, Tang G, Wu S, Huang
M, Liu W, Zhu Y, Lin Q, Mao L, et al: The laboratory tests and host
immunity of COVID-19 patients with different severity of illness.
JCI Insight. 5(e137799)2020.PubMed/NCBI View Article : Google Scholar
|
|
53
|
Chen G, Wu D, Guo W, Cao Y, Huang D, Wang
H, Wang T, Zhang X, Chen H, Yu H, et al: Clinical and immunological
features of severe and moderate coronavirus disease 2019. J Clin
Invest. 130:2620–2629. 2020.PubMed/NCBI View Article : Google Scholar
|
|
54
|
Yang J, Zhang E, Zhong M, Yang Q, Hong K,
Shu T, Zhou D, Xiang J, Xia J, Zhou X, et al: Longitudinal
characteristics of t cell responses in asymptomatic SARS-CoV-2
infection. Virol Sin. 35:838–841. 2020.PubMed/NCBI View Article : Google Scholar
|
|
55
|
Sanchez-Cerrillo I, Landete P, Aldave B,
Sanchez-Alonso S, Sanchez-Azofra A, Marcos-Jimenez A, Avalos E,
Alcaraz-Serna A, de Los Santos I, Mateu-Albero T, et al:
Differential redistribution of activated monocyte and dendritic
cell subsets to the lung associates with severity of COVID-19.
medRxiv. 2020(20100925)2020.PubMed/NCBI View Article : Google Scholar
|
|
56
|
Leng Z, Zhu R, Hou W, Feng Y, Yang Y, Han
Q, Shan G, Meng F, Du D, Wang S, et al: Transplantation of ACE2-
mesenchymal stem cells improves the outcome of patients with
COVID-19 pneumonia. Aging Dis. 11:216–228. 2020.PubMed/NCBI View Article : Google Scholar
|
|
57
|
Fujita S, Seino KI and Sato K, Sato Y,
Eizumi K, Yamashita N, Taniguchi M and Sato K: Regulatory dendritic
cells act as regulators of acute lethal systemic inflammatory
response. Blood. 107:3656–3664. 2006.PubMed/NCBI View Article : Google Scholar
|
|
58
|
Boor PPC, Metselaar HJ, Mancham S, Tilanus
HW, Kusters JG and Kwekkeboom J: Prednisolone suppresses the
function and promotes apoptosis of plasmacytoid dendritic cells. Am
J Transplant. 6:2332–2341. 2006.PubMed/NCBI View Article : Google Scholar
|
|
59
|
Shin KS, Jeon I, Kim BS, Kim IK, Park YJ,
Koh CH, Song B, Lee JM, Lim J, Bae EA, et al: Monocyte-derived
dendritic cells dictate the memory differentiation of CD8+ T cells
during acute infection. Front Immunol. 10(1887)2019.PubMed/NCBI View Article : Google Scholar
|
|
60
|
Calina D, Sarkar C, Arsene AL, Salehi B,
Docea AO, Mondal M, Islam MT, Zali A and Sharifi-Rad J: Recent
advances, approaches and challenges in targeting pathways for
potential COVID-19 vaccines development. Immunol Res. 68:315–324.
2020.PubMed/NCBI View Article : Google Scholar
|
|
61
|
Aldridge JR Jr, Moseley CE, Boltz DA,
Negovetich NJ, Reynolds C, Franks J, Brown SA, Doherty PC, Webster
RG and Thomas PG: From the cover: TNF/iNOS-producing dendritic
cells are the necessary evil of lethal influenza virus infection.
Proc Natl Acad Sci USA. 106:5306–5311. 2009.PubMed/NCBI View Article : Google Scholar
|
|
62
|
Iijima N, Mattei LM and Iwasaki A:
Recruited inflammatory monocytes stimulate antiviral Th1 immunity
in infected tissue. Proc Natl Acad Sci USA. 108:284–289.
2011.PubMed/NCBI View Article : Google Scholar
|
|
63
|
Haroun RAH, Osman WH and Eessa AM:
Interferon-γ-induced protein 10 (IP-10) and serum amyloid A (SAA)
are excellent biomarkers for the prediction of COVID-19 progression
and severity. Life Sci. 269(119019)2021.PubMed/NCBI View Article : Google Scholar
|
|
64
|
Wang G, Wu C, Zhang Q, Wu F, Yu B, Lv J,
Li Y, Li T, Zhang S, Wu C, et al: C-reactive protein level may
predict the risk of COVID-19 aggravation. Open Forum Infect Dis.
7(ofaa153)2020.PubMed/NCBI View Article : Google Scholar
|
|
65
|
Chen W, Zheng KI, Liu S, Yan Z, Xu C and
Qiao Z: Plasma CRP level is positively associated with the severity
of COVID-19. Ann Clin Microbiol Antimicrob. 19(18)2020.PubMed/NCBI View Article : Google Scholar
|
|
66
|
Mardani R, Namavar M, Ghorbi E, Shoja Z,
Zali F, Kaghazian H, Aghasadeghi MR, Sadeghi SA, Sabeti S, Darazam
IA, et al: Association between serum inflammatory parameters and
the disease severity in COVID-19 patients. J Clin Lab Anal.
36(e24162)2022.PubMed/NCBI View Article : Google Scholar
|
|
67
|
Peruzzi B, Bencini S, Capone M, Mazzoni A,
Maggi L, Salvati L, Vanni A, Orazzini C, Nozzoli C, Morettini A, et
al: Quantitative and qualitative alterations of circulating myeloid
cells and plasmacytoid DC in SARS-CoV-2 infection. Immunology.
161:345–353. 2020.PubMed/NCBI View Article : Google Scholar
|
|
68
|
Mangano C and Oliva BM: Relationship
between lymphocyte subsets values and C-reactive protein in
COVID-19 patients. Cytometry A. 99:462–465. 2021.PubMed/NCBI View Article : Google Scholar
|
|
69
|
Tyurin AV, Salimgareeva MK, Miniakhmetov
IR, Khusainova RI, Samorodov A, Pavlov VN and Kzhyshkowska J:
Correlation of the imbalance in the circulating lymphocyte subsets
with c-reactive protein and cardio-metabolic conditions in patients
with COVID-19. Front Immunol. 13(856883)2022.PubMed/NCBI View Article : Google Scholar
|
|
70
|
Meizlish ML, Pine AB, Bishai JD, Goshua G,
Nadelmann ER, Simonov M, Chang CH, Zhang H, Shallow M, Bahel P, et
al: A neutrophil activation signature predicts critical illness and
mortality in COVID-19. Blood Adv. 5:1164–1177. 2021.PubMed/NCBI View Article : Google Scholar
|
|
71
|
Hasanvand A: COVID-19 and the role of
cytokines in this disease. Inflammopharmacology. 30:789–798.
2022.PubMed/NCBI View Article : Google Scholar
|
|
72
|
Tavakkoli M, Wilkins CR, Mones JV and
Mauro MJ: A novel paradigm between leukocytosis, G-CSF secretion,
neutrophil-to-lymphocyte ratio, myeloid-derived suppressor cells,
and prognosis in non-small cell lung cancer. Front Oncol.
9(295)2019.PubMed/NCBI View Article : Google Scholar
|
|
73
|
Miles B: G-CSF in Covid-19 patients:
Increased need for mechanical ventilation and inferior 60-day
survival. Supportive Care in Cancer [Internet]. 2022 Jun 1 [cited
2022 Sep 15];30:S77-S77. Available from: https://doi.org/10.1007/s00520-022-07099-y.
|
|
74
|
Chen Y, Wang J, Liu C, Su L, Zhang D, Fan
J, Yang Y, Xiao M, Xie J, Xu Y, et al: IP-10 and MCP-1 as
biomarkers associated with disease severity of COVID-19. Mol Med.
26(97)2020.PubMed/NCBI View Article : Google Scholar
|
|
75
|
Pons MJ, Ymaña B, Mayanga-Herrera A, Sáenz
Y, Alvarez-Erviti L, Tapia-Rojas S, Gamarra R, Blanco AB, Moncunill
G and Ugarte-Gil MF: Cytokine profiles associated with worse
prognosis in a hospitalized peruvian COVID-19 cohort. Front
Immunol. 12(700921)2021.PubMed/NCBI View Article : Google Scholar
|
|
76
|
Tjan LH, Furukawa K, Nagano T, Kiriu T,
Nishimura M, Arii J, Hino Y, Iwata S, Nishimura Y and Mori Y: Early
differences in cytokine production by severity of coronavirus
disease 2019. J Infect Dis. 223:1145–1149. 2021.PubMed/NCBI View Article : Google Scholar
|
|
77
|
Yang AP, Li HM, Tao WQ, Yang XJ, Wang M,
Yang WJ and Liu JP: Infection with SARS-CoV-2 causes abnormal
laboratory results of multiple organs in patients. Aging (Albany
NY). 12:10059–10069. 2020.PubMed/NCBI View Article : Google Scholar
|
|
78
|
Liu Y, Tan W, Chen H, Zhu Y, Wan L, Jiang
K, Guo Y, Tang K, Xie C, Yi H, et al: Dynamic changes in lymphocyte
subsets and parallel cytokine levels in patients with severe and
critical COVID-19. BMC Infect Dis. 21(79)2021.PubMed/NCBI View Article : Google Scholar
|
|
79
|
Leisman DE, Ronner L, Pinotti R, Taylor
MD, Sinha P, Calfee CS, Hirayama AV, Mastroiani F, Turtle CJ,
Harhay MO, et al: Cytokine elevation in severe and critical
COVID-19: A rapid systematic review, meta-analysis, and comparison
with other inflammatory syndromes. Lancet Respir Med. 8:1233–1244.
2020.PubMed/NCBI View Article : Google Scholar
|
|
80
|
Han H, Ma Q, Li C, Liu R, Zhao L, Wang W,
Zhang P, Liu X, Gao G, Liu F, et al: Profiling serum cytokines in
COVID-19 patients reveals IL-6 and IL-10 are disease severity
predictors. Emerg Microbes Infect. 9:1123–1130. 2020.PubMed/NCBI View Article : Google Scholar
|
|
81
|
Lambert KA, Roff AN, Panganiban RP,
Douglas S and Ishmael FT: MicroRNA-146a is induced by inflammatory
stimuli in airway epithelial cells and augments the
anti-inflammatory effects of glucocorticoids. PLoS One.
13(e0205434)2018.PubMed/NCBI View Article : Google Scholar
|
|
82
|
Taganov KD, Boldin MP, Chang KJ and
Baltimore D: NF-κB-dependent induction of microRNA miR-146, an
inhibitor targeted to signaling proteins of innate immune
responses. Proc Natl Acad Sci USA. 103:12481–12486. 2006.PubMed/NCBI View Article : Google Scholar
|
|
83
|
Zeng Z, Gong H, Li Y, Jie K, Ding C, Shao
Q, Liu F, Zhan Y, Nie C, Zhu W and Qian K: Upregulation of miR-146a
contributes to the suppression of inflammatory responses in
LPS-induced acute lung injury. Exp Lung Res. 39:275–282.
2013.PubMed/NCBI View Article : Google Scholar
|
|
84
|
Donyavi T, Bokharaei-Salim F, Baghi HB,
Khanaliha K, Janat-Makan MA, Karimi B, Nahand JS, Mirzaei H,
Khatami A, Garshasbi S, et al: Acute and post-acute phase of
COVID-19: Analyzing expression patterns of miRNA-29a-3p, 146a-3p,
155-5p, and let-7b-3p in PBMC. Int Immunopharmacol.
97(107641)2021.PubMed/NCBI View Article : Google Scholar
|
|
85
|
Garg A, Seeliger B, Derda AA, Xiao K,
Gietz A, Scherf K, Sonnenschein K, Pink I, Hoeper MM, Welte T, et
al: Circulating cardiovascular microRNAs in critically ill COVID-19
patients. Eur J Heart Fail. 23:468–475. 2021.PubMed/NCBI View Article : Google Scholar
|
|
86
|
Meng G, Wei J, Wang Y, Qu D and Zhang J:
MiR-21 regulates immunosuppression mediated by myeloid-derived
suppressor cells by impairing RUNX1-YAP interaction in lung cancer.
Cancer Cell Int. 20(495)2020.PubMed/NCBI View Article : Google Scholar
|
|
87
|
Wang T, Jiang L, Wei X, Dong Z, Liu B,
Zhao J, Wang L, Xie P, Wang Y and Zhou S: Inhibition of miR-221
alleviates LPS-induced acute lung injury via inactivation of
SOCS1/NF-κB signaling pathway. Cell Cycle. 18:1893–1907.
2019.PubMed/NCBI View Article : Google Scholar
|
|
88
|
Xu P, Xin J, Song L, Chen Y, Ma J, Liu L,
Qi Z, Pan X and Zhou S: Serum miR-133 as a potential biomarker in
acute cerebral infarction patients. Clin Lab. 66:1923–1928.
2020.PubMed/NCBI View Article : Google Scholar
|
|
89
|
Huang J, Zhu L, Qiu C, Xu X, Zhang L, Ding
X, Liao Q, Xu J and Zhang X: MicroRNA miR-126-5p enhances the
inflammatory responses of monocytes to lipopolysaccharide
stimulation by suppressing cylindromatosis in chronic HIV-1
Infection. J Virol. 5:e02048–e02016. 2017.PubMed/NCBI View Article : Google Scholar
|
|
90
|
Fogel O, Tinggaard AB, Fagny M, Sigrist N,
Roche E, Leclere L, Deleuze JF, Batteux F, Dougados M,
Miceli-Richard C and Tost J: Deregulation of microRNA expression in
monocytes and CD4+ T lymphocytes from patients with axial
spondyloarthritis. Arthritis Res Ther. 21(51)2019.PubMed/NCBI View Article : Google Scholar
|