Introduction
Cervical cancer (CC) is a high-risk human
papillomavirus (h-HPV)-induced tumor. Over 500,000 new cases of CC
are diagnosed worldwide every year and 130,000 of these are in
China, most of which are cervical squamous cell carcinomas (CSCC)
(1,2). The region of Xinjiang has one of the
highest rates of CC incidence in China and the ratio of CSCC
incidence between Uighur and Han women could be as great as 3.4:1
(3,4). Despite the advances in surgery and
chemotherapy that have been made over the last 20 years, the
overall survival rate for patients with CSCC has not changed
significantly. The high mortality rate of CSCC occurs primarily due
to the majority of women being diagnosed at an advanced stage of
the disease when the 5-year survival rate is 8–12%. By contrast,
patients who are accurately diagnosed with earlier stage or
precancerous diseases have a 5-year survival rate of 90%. CSCC is
characterized by a long period of preclinical dysplasia or
carcinoma in situ progressing into invasive cancer. Cervical
intraepithelial neoplasia (CIN) is a common type of precancerous
disease of CSCC, which is defined by WHO as a potential
precancerous condition representing a generalized state associated
with a significantly increased risk of cancer. Therefore, early
detection and screening of populations at a high risk of CSCC and
precursor lesions are attractive strategies to reduce the incidence
of CSCC. Although the Papanicolaou (Pap) smear test has contributed
significantly to the early detection of precursor lesions, the
cytological screening has inherent problems that produce
considerable false-negative/positive results (5,6).
Mucins present particularly difficult problems by forming sticky
layers or sheets of disorganized cords which appear irregularly in
the smear specimen. These approaches tend to contribute
insufficient diagnostic sensitivity and specificity.
The study of metabolic processes in biological
systems has been termed metabonomics. The primary goals of
meta-bonomics are to identify metabolic biomarkers or predictors
associated with a specific biochemical event and to relate these to
the mechanism of the effect (7).
Nuclear magnetic resonance (NMR) spectroscopy is an efficient and
nondestructive tool for generating data on a multitude of
metabolites in bodily fluids (8,9).
Certain studies have previously demonstrated that NMR-based plasma
metabonomics may be used to determine the diagnosis and prognosis
of disease (10–17). NMR spectroscopy has previously been
used to identify the metabolic signatures of CSCC compared with
normal tissues and this revealed that the malignant tissue of the
cervix differed from the nonmalignant tissue, with higher levels of
choline and amino acids and lower levels of glucose (18). 1H NMR spectroscopy for
the assessment of apoptosis in cervical carcinomas has revealed
that the choline:creatine ratio is significantly higher in CSCC
than in normal tissue (18–20).
The results of a previous study also revealed that high lactate
levels may be used to predict the likelihood of metastases, tumor
recurrence and restricted patient survival in human CCs (21). Research has mainly focused on CC
tissues since they provide several lines of enquiry for the
understanding of the metabolic processes and mechanisms in the
development of cancer. Urinary biomarkers which could be used to
distinguish between cancer and normal cases have been reported for
gynecological cancers, including breast, ovarian and cervical
cancer (22). However, the
metabonomic analysis of the plasma of patients with CC and
precancerous diseases has not been well documented thus far.
In this study, plasma samples from patients with
CSCC or CIN as well as from healthy controls were subjected to
metabonomic analyses by 1H NMR spectroscopy followed by
PCA and OPLS-DA to profile the concentration and composition of the
plasma metabolites in the three groups.
Materials and methods
Collection of plasma samples
The study protocol was approved by the Ethics
Committee of Xinjiang Medical University. All the diagnoses of CIN
and CSCC were confirmed by histopathology. In a total of 38
patients with CIN, 2 had CIN I, 31 had CIN II and 5 had CIN III and
the average age (±SD) was 39.6±0.7 years. Plasma samples were taken
from 38 Uighur patients with CSCC on the date of diagnosis and
prior to initial treatment. Their tumor stages (according to the
criteria of the International Federation of Gynecology and
Obstetrics) were IIb (18 patients), IIIb (16 patients) and IVb (4
patients) and their average age (±SD) was 45.6±0.3 years. Samples
of 38 healthy controls were obtained from Uighur individuals who
underwent a routine health check. The selection criteria were for
the control subjects to be free of neoplasm and any inflammatory
disease. The average age (±SD) for the healthy controls was
41.6±0.3 years. The blood samples were collected prior to the
morning meal in tubes and the plasma was obtained by centrifugation
of the blood samples at 3,500 rpm for 10 min at 4°C. The plasma
samples were stored at −80°C until NMR analysis.
Preparation of plasma samples and
acquisition of 1H NMR spectral data
The frozen plasma samples were thawed prior to use
and prepared for NMR analysis by mixing 200 μl of plasma with 400
μl of saline (0.9% w/v NaCl in 20% v/v D2O and 80% v/v
H2O). The plasma-saline mixture was left to stand at
room temperature for 10 min and was then centrifuged at 10,000 rpm
for 10 min. The clear supernatant (550 μl) was then transferred to
a 5-mm NMR tube. The samples were analyzed by 1H NMR
spectroscopy at 599.95 MHz using a Varian Inova 600 spectrometer at
298 K. Water signals and broad protein resonances were suppressed
by a combination of presaturation and the Carr-Purcell-Meiboom-Gill
(CPMG) pulse sequence [relaxation
delay-90°-(τ-180°-τ)n-acquire]. For each sample there
were 128 scans into 32,768 data points over a spectral width of
10,000 Hz, which resulted in an acquisition time of 1.64 sec and a
relaxation delay of 2 sec. 1H NMR spectra were processed
and corrected for phase and baseline with Topspin 2.0 software
(Brokers Biospin, Rheinstetten, Germany). Chemical shifts were
referenced to the anomeric proton of α-glucose at δ5.233 and the
spectra were put into 2,834 integrated regions of 0.003 ppm,
corresponding to δH=9.0, to 0.5 ppm. The region 5.20–4.66 ppm was
removed in order to avoid the effects of water suppression and the
2.72–2.47 ppm region was also removed due to decoagulant signals.
The data sets were then imported into Microsoft® Excel.
Multivariate data analysis was carried out on the normalized NMR
data sets using the software package SIMCA-P+11 (Umetrics Inc.,
Umea, Sweden).
One-way analysis of variance (ANOVA) and
pattern recognition analysis
The spectral segments for each NMR spectrum were
normalized to the total integrated area of each spectrum. The
integral values were imported into the SIMCA-P+11 software as
variables for the multivariate pattern recognition analysis.
Principal component analysis (PCA) and the orthogonal projection to
latent structure with discriminant analysis (OPLS-DA) methods with
unit variance (UV) scaling were carried out for class
discrimination and biomarker identification (23). PCA was conducted using
mean-centered scaling and the results are presented in scatter
plots; each pointing the former represented one sample, whereas the
latter showed the magnitude and manners of the NMR signals (thus
metabolites) to classification. Further analysis of the NMR data
was carried out using OPLS-DA, which is one of the most accurate
methods for identifying the metabolic profiles which are associated
with a given clinical condition (24–26).
The data were visualized with the score plots of the first two
principal components (PCs 1 and 2) in order to provide the most
efficient 2D representation of the information contained in the
data set. Based on the number of samples in each group, a
correlation coefficient (determined by the Pearson's product-moment
correlation coefficient) of 0.33 was used as the cut-off value that
calculated discrimination at the level of P=0.05. The normalized
NMR data set was subjected to classical statistical analysis
(one-way ANOVA) using SPSS 16.0 software. The ANOVA was carried out
using a two-sided Tukey post-test for the comparison of the
absolute values of the spectral variables among the plasma samples.
P<0.05 was considered to indicate a statistically significant
result.
Results
Determination of metabolic changes
according to 1H NMR spectra
Fig. 1 shows the
typical 1H NMR spectra of a plasma sample obtained from
a healthy individual, a patient with CIN and a patient with CSCC
(Fig. 1A–C, respectively). The
resonances in these spectra were assigned to individual metabolites
(based on http:/metabolomics.ca) and confirmed
using the two dimensional NMR methods 1H-1H
homonuclear correlation spectroscopy (COSY), total correlation
spectroscopy (TOCSY) and J-Resolved spectroscopy (J-Res). The
resulting NMR spectra were then used to visualize chemical shifts
and scalar couplings along different spectral dimensions and
increase the peak dispersion and therefore the metabolite
specificity in the 1D projection (27).
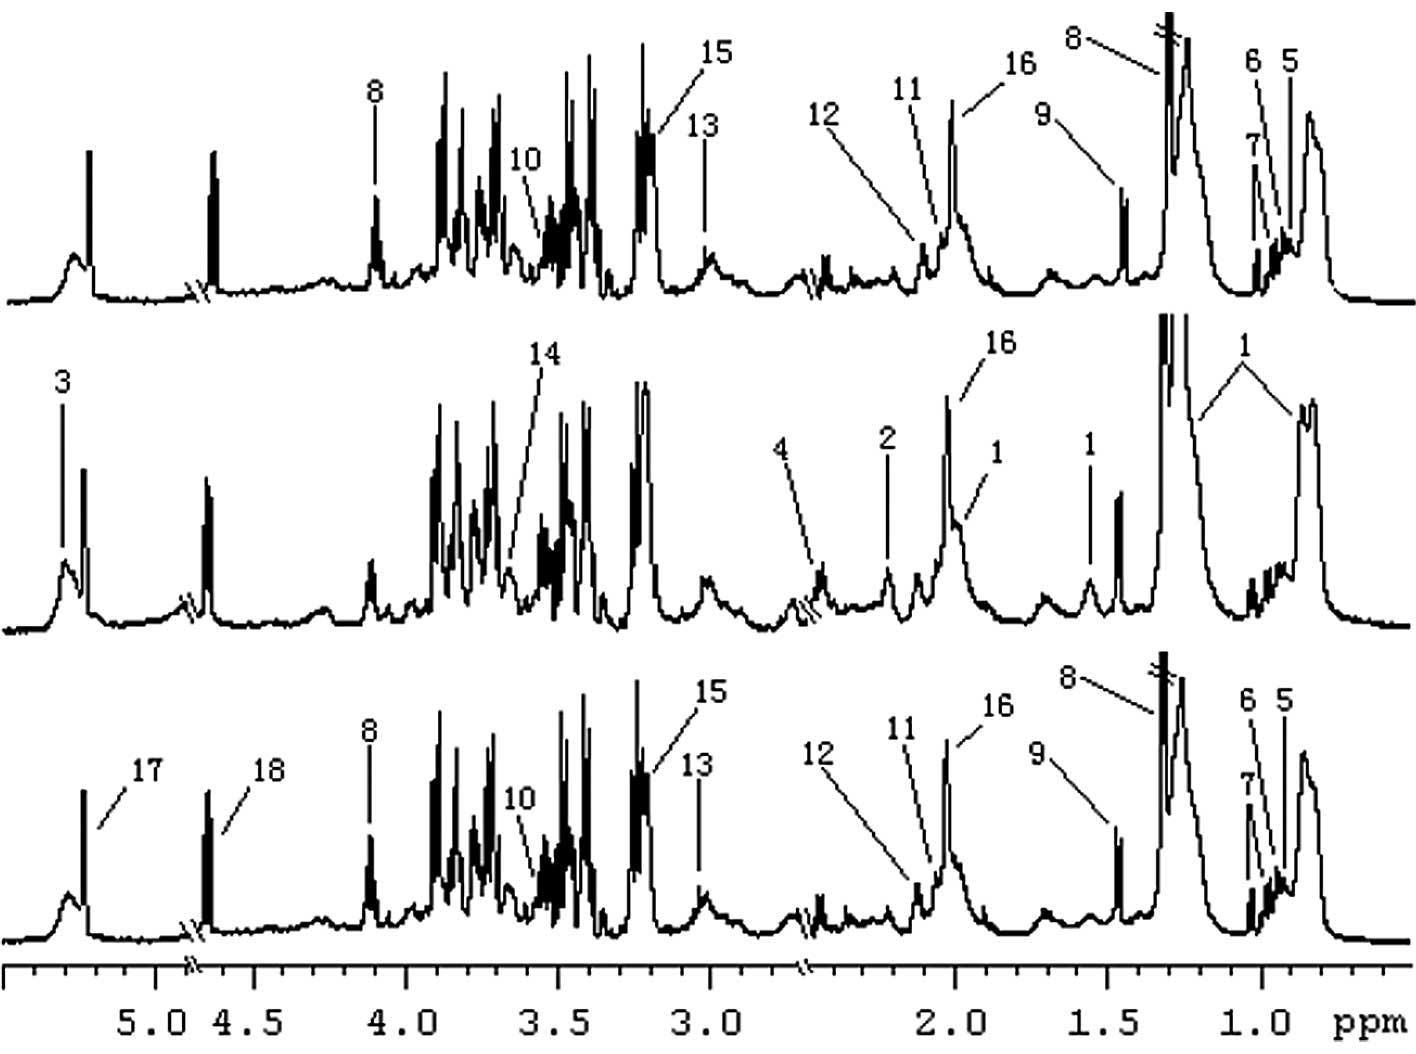 | Figure 1.Representative 599.95 MHz
1H NMR spectra (δ5.5-0.5) of the plasma obtained from a
patient with (A) CSCC, (B) CIN and (C) a healthy control. Only
significant metabolites have been labeled for each of the three
plasma metabolic profiles. 1, very-low density lipoprotein (VLDL);
2, acetone; 3, unsaturated lipid; 4, carnitine; 5, isoleucine; 6,
leucine; 7, valine; 8, lactate; 9, alanine; 10, glycine; 11,
acetylcysteine; 13, creatine; 15, cho-line; 16, glycoprotein; 17,
α-glucose; 18, β-glucose; NMR, nuclear magnetic resonance; CSCC,
cervical squamous cell carcinoma; CIN, cervical intraepithelial
neoplasia. |
Discrimination between different cervical
lesions using pattern recognition analysis
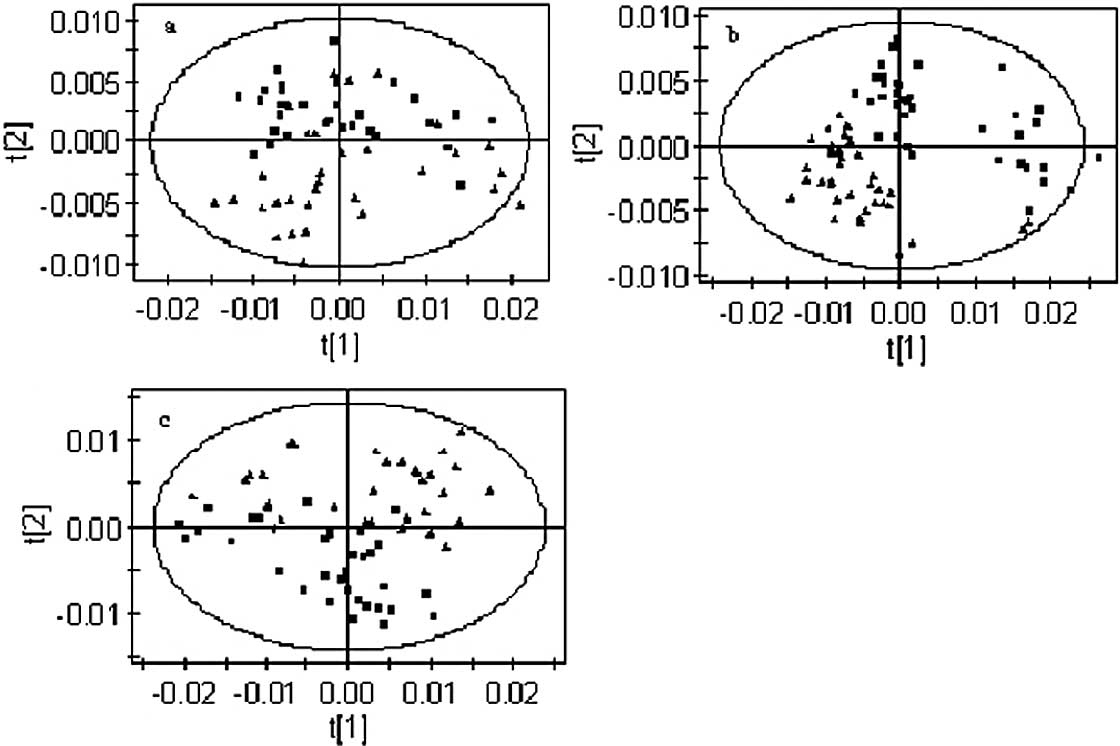
Initially, PCA was conducted on the spectral data
and two PCs were calculated for the extracts contained from
metabolites being explained by PC1 and PC2, respectively. Fig. 2 shows the PCA score plot of the
three groups, namely the patients with CIN or CSCC and the healthy
controls. The PCA applied to the 1D projection is depicted in
Fig. 2 and shows a clear
separation between the samples from the healthy subjects and those
from patients with CIN and CSCC. The scatter plot shows each set of
two groups scattering into different regions. It was possible to
achieve a good separation of the patients with CSCC and CIN from
the healthy controls (Fig. 2A–C).
Although there were several cases showing an overlap between
patients with CIN and those with CSCC (Fig. 2C), PCA not only differentiated
between the disease and control samples but also showed the
potential to distinguish between the precancerous and cancer cases
with a high specificity.
To obtain a more objective statistical estimation
and specific loadings, we used OPLS-DA for a model discriminating
between the samples from patients with CIN and CSCC and those of
the healthy controls that was more focused on distinguishing
variation than the PCA approach (Fig.
3). In this case, the sensitivity and specificity for the
detection of CIN and CSCC were >90 and >95%, respectively,
following the application of the Venetian blind algorithm for
cross-validation. Fig. 3A shows
the OPLS-DA scatter plot of the CIN patients and the healthy
controls (R2X=0.434, R2Y=0.668,
Q2=0.569). Notably, several samples from patients with
CIN were mixed in the cluster of healthy samples and two healthy
samples were mixed in the cluster of CIN samples. Similarly, the
OPLS-DA scatter plot for the CSCC patients and the healthy controls
(Fig. 3B, R2X=0.34,
R2Y=0.87, Q2=0.83) shows a clear discrimination between samples
from the two groups. It was observed that the cluster of patients
with CSCC was located at a distance from that of the healthy
controls, which indicates that the metabolic profile of the CSCC
patients is different from that of the healthy controls. Patients
located towards the edges of the plots were CSCC patients with
metastases. Fig. 3C shows the
scatter plot of CIN and CSCC patients (R2X=0.31,
R2Y=0.89, Q2=0.84) which, although scattered,
were located in different clusters, demonstrating a different
metabolic profile in patients with CIN and CSCC.
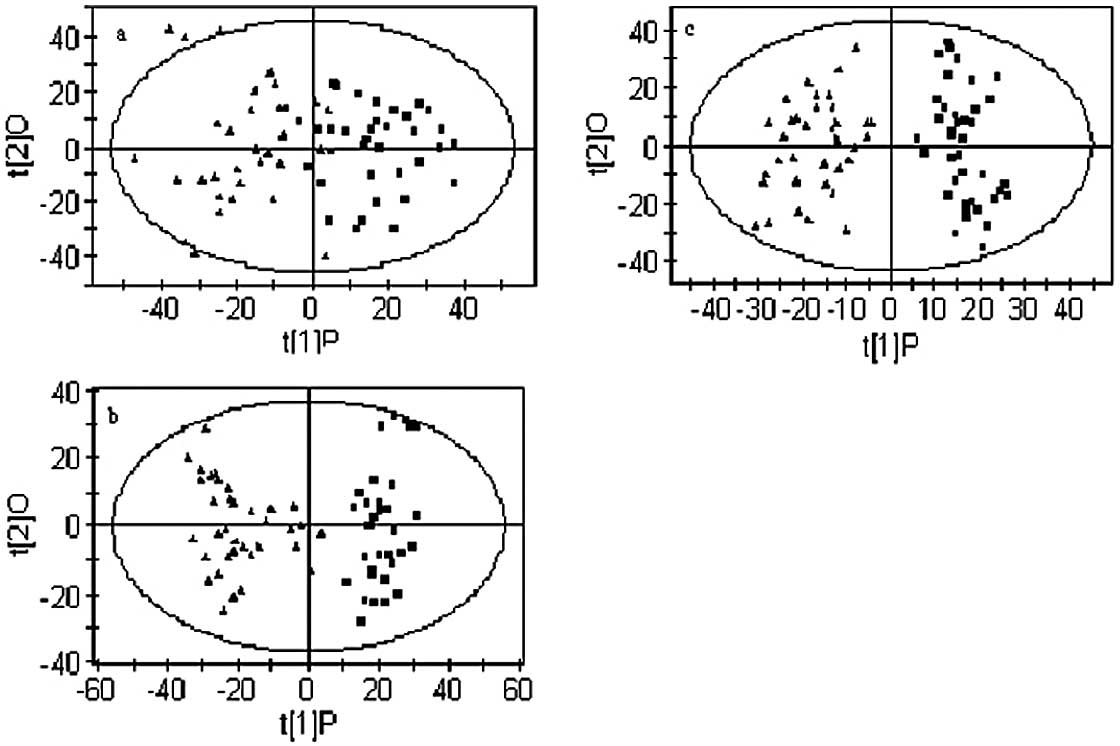 | Figure 3.OPLS-DA models based on 1H
NMR spectra of plasma from patients with CSCC or CIN and healthy
controls. (A) Separation between CIN and healthy controls; ▪
healthy controls; ▴ CIN. (B) Separation between CSCC and healthy
controls; ▪ healthy controls; ▴ CSCC. (C) Separation between CIN
and CSCC; ▪ CIN; ▴ CSCC. Model parameters were R2X=0.434,
R2Y=0.668, Q2=0.569; R2X=0.34, R2Y=0.87,
Q2=0.83; R2X=0.31, R2Y=0.89, Q2=0.84,
respectively. OPLS-DA, orthogonal partial least-squares
discriminant analysis; NMR, nuclear magnetic resonance; CSCC,
cervical squamous cell carcinoma; CIN, cervical intraepithelial
neoplasia. |
Loading plots were calculated from the OPLS-DA
models in order to identify discriminatory metabolites for
different models. According to the correlation coefficients which
resulted from the OPLS-DA, 22 metabolites may be used to
quantitatively separate the CSCC, CIN and healthy control groups.
Table I summarizes the variations
in certain metabolite signals in the plasma of CIN and CSCC
patients compared with that of the healthy controls. Positive
values represent a relatively low abundance in the plasma of
patients with CSCC and CIN compared with the healthy controls.
Negative values represent a high abundance in the plasma of
patients with CSCC and CIN compared with the healthy controls. In
the samples from the CIN patients, the levels of very-low density
lipoprotein (VLDL), acetone, unsaturated lipid and carnitine were
increased compared with those of the healthy controls, whereas the
level of creatine, lactate, isoleucine, leucine, valine, alanine,
glutamine, histidine, glycine, acetylcysteine, myo-inositol,
choline and glycoprotein were reduced. Similarly, plasma from
patients with CSCC had higher levels of acetate and formate,
together with lower levels of creatine, lactate, isoleucine,
leucine, valine, alanine, glutamine, histidine and tyrosine
compared with the healthy controls. Concerning the differences
between samples from patients with CSCC and CIN, an altered plasma
concentration of acetone, acetate, formate, glycoprotein, α-glucose
and β-glucose may form a unique profile which could be used to
separate CSCC and CIN.
 | Table I.Differential plasma metabolites of
patients with CSCC or CIN and healthy controls. |
Table I.
Differential plasma metabolites of
patients with CSCC or CIN and healthy controls.
| | Integral values
(correlation coefficients)
|
|---|
| Metabolite | Chemical shift | Controls | CINa | CSCCb | CIN to CSCC | Assigned with |
|---|
| Formate | 8.45 (s) |
0.0183±2.4009E-05 | 0.0001±5.3812E-05
(-) | 0.0003±8.887E-05
(−0.75) ↑ | (−0.73) ↑ | CPMG, J-Res |
| Histidine | 7.06 (s), 7.73
(s) | 0.0183±0.0001 | 0.0008±0.0001 (0.41)
↓ | 0.0007±0.0001 (0.48)
↓ | (−0.55) ↑ | CPMG, J-Res,
COSY |
| Tyrosine | 6.88 (d), 7.18
(d) |
0.0008±6.7364E-05 | 0.0004±8.7480E-05
(-) | 0.0004±7.7638E-05
(0.71) ↓ | (−0.50) ↑ | CPMG, J-Res,
COSY |
| Unsaturated
lipid | 5.26 (m), 5.28 (m),
5.30 (m), 5.32 (m) | 0.0004±0.0048 | 0.0221±0.0060
(−0.46) ↑ | 0.0197±0.0062
(-) | (0.47) ↓ | CPMG,COSY |
| α-glucose | 3.24 (dd), 3.49
(t), 4.64 (d) | 0.02109±0.0014 | 0.0102±0.0022
(-) | 0.0102±0.0026
(-) | (−0.83) ↑ | CPMG, J-Res, COSY,
TOCSY |
| β-glucose | 3.72 (dd), 5.23
(d) | 0.0086±0.0022 | 0.0022±0.00317
(-) | 0.0144±0.0033
(-) | (−0.84) ↑ | CPMG, J-Res, COSY,
TOCSY |
| Creatine | 3.03 (s), 3.92
(s) | 0.0111±0.0002 | 0.0015±0.0008
(0.80) ↓ | 0.0022±0.0004
(0.64) ↓ | (-) | CPMG, COSY |
| Myo-inositol | 3.65 (dd), 3.56
(dd), 3.27 (t) | 0.0016±0.0010 | 0.0089±0.0046
(0.55) ↓ | 0.0137±0.0028
(-) | (-) | CPMG, J-Res,
COSY |
| Glycine | 3.55 (s) | 0.0087±0.0009 | 0.0051±0.0008
(0.57) ↓ | 0.0084±0.0022
(-) | (−0.58) ↑ | CPMG, J-Res |
| Choline | 3.21 (s) | 0.0057±0.0051 | 0.0271±0.0161
(0.35) ↓ | 0.0036±0.0010
(-) | (-) | CPMG, J-Res |
| Carnitine | 2.46 (dd) | 0.02557±0.0010 | 0.0081±0.0026
(−0.44) ↑ | 0.0037±0.0008
(-) | (0.82) ↓ | CPMG, J-Res |
| Acetone | 2.22 (s) | 0.00658±0.0010 | 0.0038±0.0018
(−0.45) ↑ | 0.0015±0.0003
(-) | (0.54) ↓ | CPMG, J-Res |
| Glutamine | 2.10 (m), 2.13
(m) | 0.0029±0.00019 | 0.0016±0.0002
(0.80) ↓ | 0.0005±0.0002
(0.67) ↓ | (-) | CPMG, J-Res,
COSY |
| Acetylcysteine | 2.07 (s) | 0.0019±0.0007 | 0.0069±0.0010
(<0.66) ↓ | 0.0012±0.0005
(-) | (−0.68) ↑ | CPMG, J-Res |
| Glycoprotein | 2.03 (s) | 0.0079±0.0018 | 0.0195±0.0037
(-) | 0.0022±0.0006
(-) | (−0.66) ↑ | CPMG, J-Res |
| Acetate | 1.91 (s) | 0.0204±0.00024 | 0.0014±0.0003
(-) | 0.0010±0.0003
(−0.43) ↑ | (−0.73) ↑ | CPMG, J-Res |
| Alanine | 1.47 (d), 3.76
(q) | 0.00174±0.0012 | 0.0081±0.0014
(0.52) ↓ | 0.0140±0.0042
(0.66) ↓ | (−0.60) ↑ | CPMG, J-Res, COSY,
TOCSY |
| Lactate | 1.33 (d), 4.11
(q) | 0.0097±0.01483 | 0.0477±0.0132
(0.83) ↓ | 0.0049±0.0008
(0.55) ↓ | (−0.72) ↑ | CPMG, J-Res, COSY,
TOCSY |
| Valine | 0.98 (d), 1.04
(d) | 0.0043±0.0005 | 0.0041±0.0008
(0.58) ↓ | 0.0023±0.0005
(0.66) ↓ | (−0.75) ↑ | CPMG, J-Res, COSY,
TOCSY |
| Isoleucine | 0.93 (t), 1.00
(d) | 0.0032±0.0003 | 0.0029±0.0004
(0.79) ↓ | 0.0013±0.0004
(0.64) ↓ | (−0.83) ↑ | CPMG, J-Res, COSY,
TOCSY |
| Leucine | 0.95 (d), 0.97
(d) | 0.0138±0.0012 | 0.0118±0.0017
(0.74) ↓ | 0.0016±0.0005
(0.69) ↓ | (−0.76) ↑ | CPMG, J-Res, COSY,
TOCSY |
| VLDL | 0.86 (m), 1.26 (m),
0.88 (m), 1.27 (m), 1.57 (m), 2.00 (m) | 0.0853±0.0100 | 0.0804±0.0133
(−0.47) ↑ | 0.0021±0.0008
(-) | (-) | CPMG, COSY |
Diagnostic sensitivity of the metabonomic
profiles of CIN and CSCC by 1H NMR spectroscopy
All samples from patients were examined with the
Thinprep cytological test (TCT), a routine method in the clinical
screening of cervical diseases. The results revealed that, of all
38 cases positive for CIN and CSCC confirmed by the
histopathological diagnosis, which is a current standard diagnostic
criterion, 7 and 4 were negative with TCT, respectively. We matched
the sensitivity of the metabonomic profiles derived from the
OPLS-DA, discriminating patients with CIN or CSCC from the healthy
controls with the TCT test. The analysis revealed a high
sensitivity of the metabonomic profile for the clinical diagnosis
of CIN and CSCC (91.6 and 100%, respectively), whereas TCT had a
lower sensitivity for the same cases (80.6 and 88.9%; Table II). This indicates that metabonomic
profiling with 1H NMR spectroscopy may increase the
feasibility and accuracy of the diagnosis.
| Table II.Comparision of the sensitivity and
false-positive rate of the diagnosis of CSCC and CIN with the TCT
method and 1H NMR metabonomics coupled with OPLS-DA. |
Table II.
Comparision of the sensitivity and
false-positive rate of the diagnosis of CSCC and CIN with the TCT
method and 1H NMR metabonomics coupled with OPLS-DA.
| 1H NMR
metabonomics coupled with OPLS-DA
| Cervical TCT
|
|---|
| CIN | CSCC | CIN | CSCC |
|---|
| Sensitivity
(%) | 33/36 (91.6) | 36/36 (100%) | 29/36 (80.6) | 32/36 (88.9) |
| False-negative rate
(%) | 3/36 (8.4) | 0 | 7/36 (19.4) | 4/36 (11.1) |
Discussion
In this study, compared with plasma samples from
healthy individuals, plasma from patients with CIN had higher
levels of VLDL, acetone, unsaturated lipid and carnitine, together
with lower levels of creatine, lactate, isoleucine, leucine,
valine, alanine, glutamine, histidine, glycine, acetylcysteine,
myo-inositol and choline. Similarly, plasma from patients with CSCC
had higher levels of acetate and formate, together with lower
levels of creatine, lactate, isoleucine, leucine, valine, alanine,
glutamine, histidine and tyrosine. The scatter plots of the pattern
recognition analysis were capable of distinguishing CIN and CSCC
patients from the healthy controls. Compared with samples from
patients with CIN, the plasma of CSCC patients had higher levels of
acetate, formate, lactate, isoleucine, leucine, valine, alanine,
glutamine, histidine, tyrosine, acetylcysteine, myo-inositol,
glycoprotein, α-glucose and β-glucose, together with lower levels
of acetone, unsaturated lipid and carnitine.
Despite a tumor tissue being restricted to a certain
organ, cancer is believed to be a disease of the host and an
indication that the whole body has changed to a pathological state,
in which the body is functionally unable to defeat or remove tumor
cells. As a result, the plasma of the patients with cancer
principally contains all the information concerning the pathogenic
changes caused by the disease in the content of the metabolites,
which reflect aberrant alterations at the level of gene expression
and regulation as well as abnormalities in the function of multiple
organs and tissues. Due to blood plasma representing the effects of
metabolism in different organs, it is difficult to assign a
metabolic fingerprint to specific metabolic processes.
Nevertheless, changes in the blood plasma metabolite concentrations
of patients with CIN and CSCC clearly point to an altered energy
metabolism. The relatively low level of lactate is markedly
different from observations in other types of cancer where,
commonly, lactate levels are high (10,21,28).
Lactate is a metabolite that is found at high levels under the
conditions of tumor hypoxia, in which the lack of intracellular
oxygen alters the balance of cellular energy production from
oxidative phosphorylation to glycolysis, which is specific to the
tumor nest (29,30). A decreased level of lactate may
result from an increased energy metabolism, which leads to lactate
being directly decomposed into H2O and CO2
(31). Precursors of glucose in
gluconeogenesis, including lactate and alanine, were found at lower
concentrations in patients with CIN and CSCC, which clearly points
to an altered energy metabolism. Furthermore, several tricarboxylic
acid (TCA) cycle intermediates, including valine and isoleucine,
were found at a lower concentration in patients with CIN and CSCC,
suggesting a suppressed TCA cycle. This represents a typical
signature in cancer patients and it has been previously confirmed
that tumors rely on glycolysis as a main source of energy, even in
the presence of oxygen (32).
Increased levels of acetone, carnitine, unsaturated
lipid and VLDL in plasma from patients with CIN further supports
the hypothesis that the rate of lipid metabolism was increased in
response to the tissue injury caused when CIN occurs since they are
products of lipid metabolism. The role of these metabolites during
the progression of CC has also been described in previous studies.
This reflects the activation of the lipolysis pathway as a backup
mechanism for energy production (33). Choline and its derivatives are
constituents of the phospholipid metabolism pathway and have been
previously identified as markers of cellular proliferation
(31). In contrast to previous
studies, the low level of choline found in this study indicates an
activation of the phosphatidyl choline pathway and consequently a
high cell membrane turnover or the activation of cell proliferation
(34–37). Consistent with our study, a
decrease in the concentration of glutamine was also documented in
the plasma of patients with early stage head and neck cancer
(38).
CSCC patients were characterized as having a
relatively low abundance of creatine, lactate and amino acids as
well as a high abundance of acetate and formate in their plasma
compared with the healthy controls. The relatively low
concentration of lactate and creatine indicated an increased energy
metabolism and the concomitant decrease in the concentration of
amino acids may not imply an increased rate of protein
biosynthesis, but an increased energy consumption at the expense of
the amino acids. As acetate and formate are intermediates of
pyrimidine and amino acid degradation, respectively, the high
abundance of these metabolites may represent a deregulated energy
metabolism in CSCC patients. In cases of CIN, the pattern of a low
abundance of metabolites appears to be representative and common to
CIN and CSCC when compared with the healthy controls, indicating
that a deregulated energy metabolism had occurred as early as in
CIN, which is pathologically classified as a possible precursor of
CSCC. To compensate for the increased energy consumption, lipid
mobilization and transport may already be initiated in CIN, as
VLDL, acetone, unsaturated lipids and carnitine were found in high
abundance and contributed to the profiling of CIN patients compared
with the healthy controls.
CIN is generally believed to be the precursor of
CSCC. However, in contrast to the lower concentrations of amino
acids, lactate and creatine in CSCC compared with the healthy
controls, the ratio of these metabolites was reversely correlated
between CSCC and CIN and may not follow the pathological order from
normal and CIN to CSCC, revealing a more complex mechanism of CIN
development as a unique disease rather than a precursor of the
cancer. However, the low abundance of unsaturated lipids, acetone
and carnitine and the high abundance of acetate and formate may
still represent an active lipid catabolism and a more disordered
energy metabolism in CSCC than in CIN.
According to the statistical analysis using the PCA
and OPLS-DA as unsupervised and supervised methods, respectively,
the populations of patients with CSCC or CIN and the healthy
controls were scattered into two regions. This represents a good
separation of the cancer from non-cancer cases with the pattern of
metabolites and suggests that patients with CSCC have a specific
profile which is different from those with CIN and the healthy
controls. In this study, however, both approaches were unable to
separate cases of CIN from the healthy controls, as several cases
showed an overlap between the two groups. This result may be
reasonable for CIN, since the CIN was not further pathologically
classified into CIN I, II and III due to the limited number of
cases enrolled in this study. In particular, the definition of CIN
I as a precancerous stage has been controversial and this may have
an impact on the profiling of CIN. In this study, several samples
from patients with CIN were mixed in the cluster of the healthy
samples. These CIN patients had low-grade cervical squamous
intraepithelial lesions (CIN I). However, the sensitivity for CIN
and CSCC detection by 1H NMR coupled with OPLS-DA (91.6
and 100%, respectively) was higher than that of the TCT (80.6 and
88.9%, respectively).
From the results of this study and those carried out
previously, it was suggested that there were distinct metabonomic
signatures that are able to distinguish between CSCC, CIN and
healthy controls. Most of the alterations may reflect an altered
energy metabolism or a deregulated metabolism of corresponding
metabolites to compensate for the energy consumption of the cancer.
In future studies, it is important to further define the
precancerous lesions according to the pathological criteria, for
example CIN I, II and III, and to optimize the metabonomic analysis
of CIN with a relatively large number of samples and also to
compare early- with late-stage CSCC. The results of the present
study indicate that plasma NMR spectra, combined with pattern
recognition analysis techniques, offer an efficient and convenient
method to depict tumor biochemistry. This may contribute to the
early diagnosis of human malignant diseases and to the discovery of
potential plasma biomarkers from blood samples.
Acknowledgements
This study was supported by grants
from the Xinjiang Uighur Autonomous Region Fund (No.2012211A043),
the Xinjiang Medical University Research Foundation (YKDX2007-10)
and the Higher Education Research Foundation of Xinjiang Uighur
Autonomous Region (XJEDU2008S38).
References
|
1.
|
Parkin DM, Whelan SL, Ferlay J, Teppo L
and Thomas DB: Cancer Incidence in Five Continents. 8.
International Agency for Research on Cancer Scientific
Publications; Lyon: 2002
|
|
2.
|
Yang B, Bray F, Parkin D, Sellors J and
Zhang Z: Cervical cancer as a priority for prevention in different
world regions: an evaluation using years of life lost. Int J
Cancer. 109:418–424. 2004.PubMed/NCBI
|
|
3.
|
Suzuke Lalai, Peng YH, Zhou K, Fang X and
Wang L: Analysis of the cervical cancer distribution in Xinjiang. J
Xinjiang Med Univ. 29:569–571. 2006.(In Chinese).
|
|
4.
|
Ma D and Ling XI: Advances in the
epidemiology and etiology of cervical cancer. J Practical Obstet
Gynecol. 17:61–63. 2001.(In Chinese).
|
|
5.
|
Abulafia O, Pezzullo JC and Sherer DM:
Perfomance of Thinprep liquid-based cervical cytology in comparison
with conventionally prepared Papaniclaou smears: a quantitative
survey. Gynecol Oncol. 90:137–144. 2003. View Article : Google Scholar : PubMed/NCBI
|
|
6.
|
Monsonego J, Autillo-Touati A, Bergeron C,
Dachez R, Liaras J, Saurel J, Zerat L, Chatelain P and Mottot C:
Liquid-based cytology for primary cervical cancer screening: a
multi-centre study. Br J Cancer. 84:360–366. 2001. View Article : Google Scholar : PubMed/NCBI
|
|
7.
|
Waters NJ, Waterfield CJ, Farrant RD,
Holmes E and Nicholson JK: Integrated metabonomic analysis of
bromobenzene-induced novel hepatic 5-oxoprolinosis. J Proteome Res.
5:1448–1459. 2006. View Article : Google Scholar : PubMed/NCBI
|
|
8.
|
Nicholson JK, Foxall PJ, Spraul M, Farrant
RD and Lindon JC: 750 MHz 1H and 1H-13C NMR spectroscopy of human
blood plasma. Anal Chem. 67:793–811. 1995. View Article : Google Scholar : PubMed/NCBI
|
|
9.
|
Parvizi J: Metabolomics: key to
understanding human individuality. J Bone Joint Surg Am. 93:1–3.
2011.
|
|
10.
|
Odunsi K, Wollman RM, Ambrosone CB, Hutson
A, McCann SE, Tammela J, Geisler JP, Miller G, Sellers T, Cliby W,
et al: Detection of epithelial ovarian cancer using 1H-NMR-based
metabonomics. Int J Cancer. 113:782–788. 2005. View Article : Google Scholar : PubMed/NCBI
|
|
11.
|
Fossel ET, Carr JM and McDonagh J:
Detection of malignant tumors. Water suppressed proton nuclear
magnetic resonance spectroscopy of plasma. N Engl J Med.
315:1369–1376. 1986.PubMed/NCBI
|
|
12.
|
Carraro S, Rezzi S, Reniero F, Héberger K,
Giordano G, Zanconato S, Guillou C and Baraldi E: Metabolomics
applied to exhaled breath condensate in childhood asthma. Am J
Respir Crit Care Med. 175:986–990. 2007. View Article : Google Scholar : PubMed/NCBI
|
|
13.
|
Duarte IF, Goodfellow BJ, Barros A, Jones
JG, Barosa C, Diogo L, Garcia P and Gil AM: Metabolic
characterisation of plasma in juveniles with glycogen storage
disease type 1a (GSD1a) by high-resolution 1H NMR spectroscopy. NMR
Biomed. 20:401–412. 2007. View
Article : Google Scholar : PubMed/NCBI
|
|
14.
|
Bhawal UK, Ozaki Y, Nishimura M, Sugiyama
M, Sasahira T, Nomura Y, Sato F, Fujimoto K, Sasaki N, Ikeda MA, et
al: Association of expression of receptor for advanced glycation
end products and invasive activity of oral squamous cell carcinoma.
Oncology. 69:246–255. 2005. View Article : Google Scholar : PubMed/NCBI
|
|
15.
|
Lindon JC and Holcholson JK: Metabonomics
technologies and their applications in physiological monitoring,
drug safety assessment and disease diagnosis. Biomarkers. 9:1–31.
2004. View Article : Google Scholar : PubMed/NCBI
|
|
16.
|
Hollywood K, Brison DR and Goodace R:
Metabolomics: current technologies and future trends. Proteomics.
6:4716–4723. 2006. View Article : Google Scholar : PubMed/NCBI
|
|
17.
|
Ala-Korpela M: 1H-NMR spectroscopy of
human blood plasma. Prog Nucl Magn Reson Spectros. 27:475–484.
1995. View Article : Google Scholar
|
|
18.
|
Sitter B, Bathen T, Hagen B, Arentz C,
Skjeldestad FE and Gribbestad IS: Cervical cancer tissue
characterized by high-resolution magic angle spinning MR
spectroscopy. MAGMA. 16:174–181. 2004. View Article : Google Scholar : PubMed/NCBI
|
|
19.
|
Mahon MM, deSouza NM, Dina R, Soutter WP,
McIndoe GA, Williams AD and Cox IJ: Preinvasive and invasive
cervical cancer: an ex vivo proton magic angle spinning magnetic
resonance spectroscopy study. NMR Biomed. 17:144–153. 2004.
View Article : Google Scholar : PubMed/NCBI
|
|
20.
|
Lyng H, Sundfor K and Rofstad EK: Changes
in tumor oxygen tension during radiotherapy of uterine cervical
cancer: relationships to changes in vascular density, cell density,
and frequency of mitosis and apoptosis. Int J Radiat Oncol Biol
Phys. 46:935–946. 2000. View Article : Google Scholar : PubMed/NCBI
|
|
21.
|
Walenta S, Wetterling M, Lehrke M,
Schwickert G, Sundfør K, Rofstad EK and Mueller-Klieser W: High
lactate levels predict likelihood of metastases, tumor recurrence,
and restricted patient survival in human cervical cancers. Cancer
Res. 60:916–921. 2000.PubMed/NCBI
|
|
22.
|
Woo HM, Kim KM, Choi MH, Jung BH, Lee J,
Kong G, Nam SJ, Kim S, Bai SW and Chung BC: Mass spectrometry based
metabolomic approaches in urinary biomarker study of women's
cancers. Clinica Chimica Acta. 400:63–69. 2009.PubMed/NCBI
|
|
23.
|
Coen M, Lenz EM, Nicholson JK, Wilson ID,
Pognan F and Lindon JC: An integrated metabonomic investigation of
acetaminophen toxicity in the mouse using NMR spectroscopy. Chem
Res Toxicol. 16:295–303. 2003. View Article : Google Scholar : PubMed/NCBI
|
|
24.
|
Smilde AK, Jansen JJ, Hoefsloot HC, Lamers
RJ, van der Greef J and Timmerman ME: ANOVA-simultaneous component
analysis (ASCA): a new tool for analyzing designed metabolomics
data. J Bio Informatics. 21:3043–3048. 2005.PubMed/NCBI
|
|
25.
|
Nicholson JK, Connelly J, Lindon JC and
Holmes E: Metabonomics: a platform for studying drug toxicity and
gene function. Nat Rev Drug Discov. 1:153–161. 2002. View Article : Google Scholar : PubMed/NCBI
|
|
26.
|
Holmes E and Antti H: Chemometric
contributions to the evolution of metabonomics: mathematical
solutions to characterizing and interpreting complex biological NMR
spectra. Analyst. 127:1549–1557. 2002. View
Article : Google Scholar : PubMed/NCBI
|
|
27.
|
Viant MR: Improved methods for the
acquisition and interpretation of NMR metabolomic data. BMC
Bioinformatics. 310:943–948. 2003.PubMed/NCBI
|
|
28.
|
Fan W: Metabolite profiling by one-and
two-dimensional NMR analysis of complex mixtures. Prog NMR
Spectrosc. 28:161–219. 1996. View Article : Google Scholar
|
|
29.
|
Airu Zhou and Xiliang Zha: Biology [M].
People Health Publishing House; Beijing: 2004
|
|
30.
|
Morvan D and Demidem A: Metabolomics by
proton nuclear magnetic resonance spectroscopy of the response to
chloroethylnitrosourea reveals drug efficacy and tumor adaptive
metabolic pathways. Cancer Res. 67:2150–2159. 2007. View Article : Google Scholar
|
|
31.
|
Tiziani S, Lopes V and Günther UL: Early
stage diagnosis of oral cancer using 1H NMR-based metabolomics.
Neoplasia. 11:269–276. 2009.PubMed/NCBI
|
|
32.
|
Garber K: Energy boost: the Warburg effect
returns in a new theory of cancer. J Natl Cancer Inst.
96:1805–1806. 2004. View Article : Google Scholar : PubMed/NCBI
|
|
33.
|
Goodacre R, Vaidyanathan S, Dunn WB,
Harrigan GG and Kell DB: Metabolomics by numbers: Acquiring and
understanding global metabolite data. Trends Biotechnol.
22:245–252. 2004. View Article : Google Scholar : PubMed/NCBI
|
|
34.
|
Walenta S and Mueller-Klieser WF: Lactate:
mirror and motor of tumor malignancy. Semin Radiat Oncol.
14:267–274. 2004. View Article : Google Scholar : PubMed/NCBI
|
|
35.
|
Miller BL: A review of chemical issues in
H NMR spectroscopy: N-acetyl-L-aspartate, creatine and choline. NMR
Biomed. 4:47–52. 1991. View Article : Google Scholar : PubMed/NCBI
|
|
36.
|
Foster DA and Xu L: Phospholipase D in
cell proliferation and cancer. Mol Cancer Res. 1:789–800.
2003.PubMed/NCBI
|
|
37.
|
Ackerstaff E, Glunde K and Bhujwalla ZM:
Choline phospholipid metabolism: A target in cancer cells. J Cell
Biochem. 90:525–533. 2003. View Article : Google Scholar : PubMed/NCBI
|
|
38.
|
Kubota A, Meguid MM and Hitch DC:
Amino-acid profiles correlate diagnostically with organ site in 3
kinds of malignant tumors. Cancer. 69:2343–2348. 1992. View Article : Google Scholar : PubMed/NCBI
|