Introduction
The main pathogeneses of type 2 diabetes mellitus
(T2DM) are insulin resistance and islet β-cell impairment, and the
latter is central to the development and progression of T2DM
(1,2). The extent and characteristics of
islet β-cell dysfunction in the different courses of diabetes vary
(3). Thus, the accurate evaluation
of the insulin secretion level of islet β-cells in patients is
important for the diagnosis, treatment and prognosis judgment of
diabetes and for epidemiological analysis. Insulin secretion by
islet β-cells is evaluated using glucose and non-glucose
stimulation tests (4). If the
islet β-cell is functionally damaged, then the pancreatic islet
does not respond to glucose stimulation but does respond to
non-glucose stimulation. If the damage progresses to organic
damage, then the pancreatic islet does not respond to any
stimulation (5,6).
Arginine is the most commonly used non-glucose
stimulus. This amino acid has been widely studied and its
intravenous administration has been shown to stimulate insulin
secretion by islet β-cells (7,8).
Thus, arginine administration has become a traditional method for
the clinical evaluation of the insulin secretion capacity of islet
β-cells (7,8). However, this method promotes insulin
secretion non-physiologically since it avoids the effect of gut
hormones on insulin secretion. Oral glucose administration
stimulates the release of additional insulin compared with
intravenous glucose administration in healthy adults (9). Similarly to glucose, arginine
stimulates gut-affected insulin secretion through gut loading and
promotes greater insulin release through oral rather than
intravenous administration. Oral arginine administration may be
used clinically in addition to oral glucose administration to
evaluate the insulin secretion capacity of the islet β-cells of
patients with T2DM. It may also be used to identify whether islet
β-cell dysfunction or a reduced amount of β-cells in the pancreas
of individuals with hyperglycemia is the cause of the damaged
secretory capacity of islet β-cells, to ensure the appropriate
diabetes treatment (10). Gannon
et al reported that the serum insulin concentration in nine
healthy subjects failed to increase following the oral
administration of arginine with an average single dosage of 10.6 g
(11). In a study conducted by
Roslyn et al, six obese volunteers with >5 years of T2DM
were administered oral arginine at 3 g/h for 10 h (total dosage, 30
g). The plasma concentrations of C-peptide and insulin over the 10
h administration period failed to increase (12). An insufficient dosage of arginine
may be a reason for the two studies failing to obtain their
prospective results (13).
However, the stimulatory effect of large-dose oral arginine
administration on insulin release remains unknown. In the present
study, we investigated the effects of large-dose oral arginine on
the secretion of insulin by islet β-cells in healthy subjects with
normal glucose tolerance and used large-dose oral glucose
administration as the control.
Subjects and methods
Subjects
Eight non-obese healthy volunteers (four males and
four females) aged 20-40 years [mean ± standard deviation (SD),
30.5±3.7 years; Table I] with
normal body mass indices (mean ± SD, 21.0±2.4 kg/m2) and
normal glucose tolerance were enrolled in the study. These subjects
took no regular medication and had no family medical history of
diabetes. Subjects who suffered with diseases of the digestive
system, heart, lung, liver and kidney, or thyroid dysfunction were
excluded. Pregnant or lactating subjects and subjects who suffered
from stress or infection were also excluded. This study was
conducted in accordance with the Declaration of Helsinki and with
approval from the Ethics Committee of the Affiliated Hospital of
Nantong University. Written informed consent was obtained from all
participants.
 | Table I.Clinical characteristics of the
subjects. |
Table I.
Clinical characteristics of the
subjects.
| Characteristics
before test (n=8) | |
|---|
| Gender, male N
(%) | 4 (50) |
| Age, years | 30.5±3.7 |
| Weight, kg | 56.8±6.8 |
| BMI,
kg/m2 | 21.0±2.4 |
| Fasting serum glucose
concentration, mmol/l | 4.8±0.6 |
| Fasting insulin
concentration, mIU/l | 1.79±1.2 |
Measurements
All volunteers participated randomly in tests with
four stages (with an interval of at least 3 days): the 300 ml
purified water stage (PWS), the 75 g glucose stage (GSS), the 30 g
arginine stage (ARS) and the 75 g glucose with 30 g arginine stage
(GAS), respectively. Participants received a low protein diet for 3
days. Afterwards, tests were conducted in a fasting state at 8:00
a.m. Glucose and/or arginine were consumed with 300 ml purified
water in 5 min. Venous blood samples were collected from each
subject at baseline (0) and at 15, 30, 45, 60 and 120 min after
drug administration to detect the serum concentrations of glucose
and insulin. The discomfort reactions of the subjects during the
test period and the following 3 days were recorded.
Data analysis
The area under the concentration-time curve (AUC)
was calculated by the trapezoidal area formula (13). The net incremental area was AUC
minus the area of the fasting plasma glucose or fasting insulin.
The relative percentage of the net incremental area was calculated
as [(AUCN - AUCG)/AUCG] ×100,
where AUCN represents the AUC of a certain stage and
AUCG is the AUC of the GSS.
Statistical analysis
All statistical analyses were performed using SPSS
17.0 for Windows. Data are presented as mean ± SD for the
parameters in Gaussian distribution. Otherwise, the median
(quartile) [m(QL,QU)] were used. The serum
concentrations of glucose and insulin between different stages were
analyzed by repeated measurement variance analysis followed by
Tukey’s multiple comparison test. The AUCs of the four stages were
compared by the rank sum test. P<0.05 was considered to indicate
a statistically significant difference.
Results
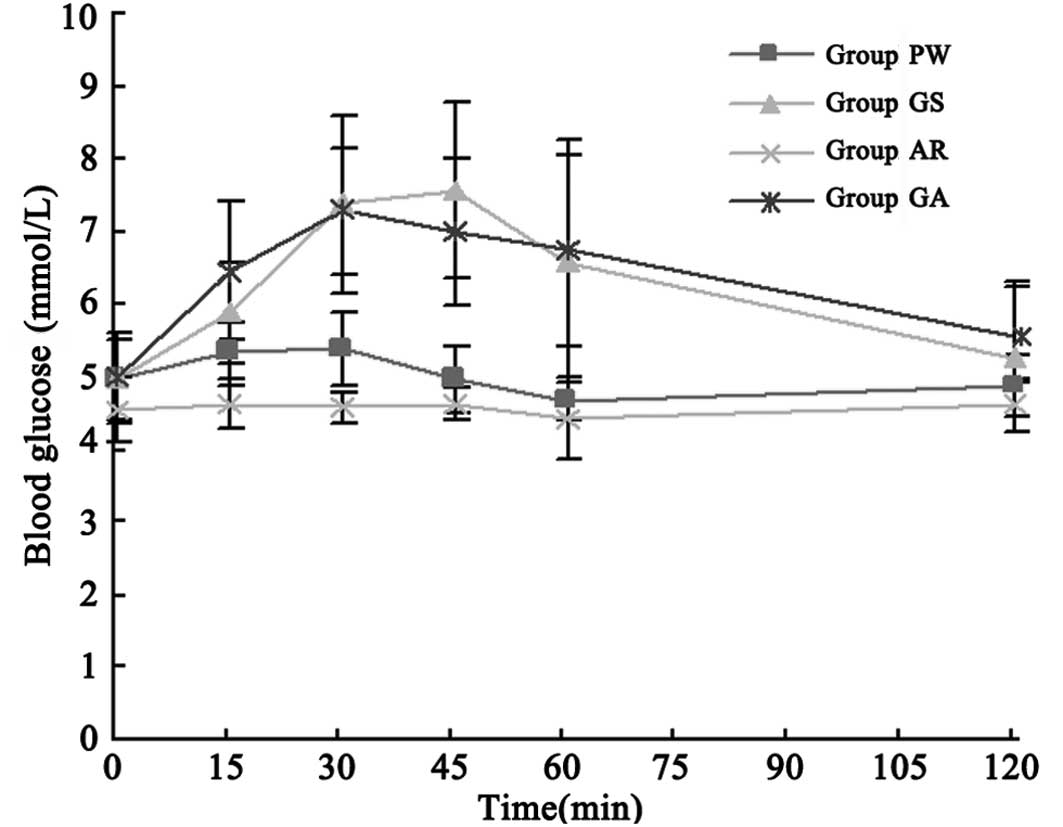
Blood glucose concentration
The venous blood samples collected at baseline (0)
and at 15, 30, 45, 60 and 120 min after drug administration were
used to detect the serum concentration of glucose through the
glucose oxidase method. There was no significant difference of
blood glucose concentration at baseline (0 min) among four stages
(Table II; P>0.05). The blood
glucose level during the detection period was not reduced
significantly in the ARS compared with that in the PWS (P>0.05).
The glucose concentration-time curve of the GSS was similar to that
of the GAS (Fig. 1). All samples
were run in duplicate.
| Table II.Blood glucose concentration in the
four stages (mmol/l) at different time points. |
Table II.
Blood glucose concentration in the
four stages (mmol/l) at different time points.
| Stage | 0 min | 15 min | 30 min | 45 min | 60 min | 120 min |
|---|
| PWS | 5.1 (4.5, 5.5) | 5.4 (5.0, 5.7) | 5.4 (5.0, 5.8) | 5.0 (4.6, 5.3) | 4.7 (4.4, 4.9) | 4.9 (4.5, 5.2) |
| GSS | 4.8 (4.5, 5.4) | 6.2 (5.3,
6.5)a | 7.3 (6.4,
8.4)a | 7.3 (6.5,
8.6)a | 6.2 (5.2,
8.0)a | 5.5 (4.4, 6.1) |
| ARS | 4.6 (4.2, 4.9) | 4.7 (4.3, 4.9) | 4.6 (4.4, 4.7) | 4.7 (4.4, 4.8) | 4.5 (3.9, 4.9) | 4.6 (4.3, 4.9) |
| GAS | 5.0 (4.5, 5.5) | 6.4 (5.7,
7.2)a | 7.1 (6.5,
8.0)a | 6.6 (6.1,
7.8)a | 6.6 (5.6,
7.8)a | 5.7 (5.0,
6.1)a |
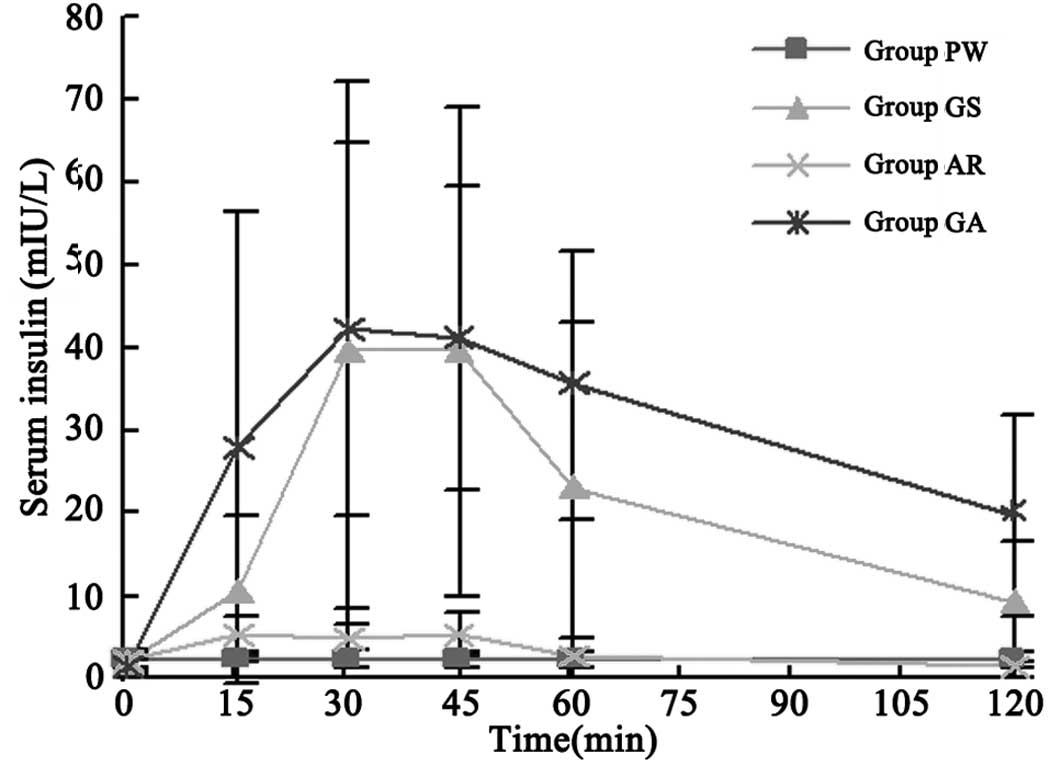
Blood insulin concentration
The venous blood samples collected were also used to
detect the serum concentrations of insulin by a chemoluminescence
test and were run in duplicate. At baseline (0 min), no significant
difference was identified among four stages (Table III; P>0.05). Insulin
concentration in the PWS at each time point after administration
demonstrated no significant difference compared with that of the
baseline (P>0.05). However, the peak concentration in the ARS
following administration was markedly higher compared with that of
the baseline (P<0.05); however, it was still significantly lower
compared with those of the GSS and GAS (P<0.05). The insulin
concentration curves of the GSS, ARS and GAS were all similarly
shaped (Fig. 2).
| Table III.Serum insulin concentration in the
four stages (mIU/l) at different time points. |
Table III.
Serum insulin concentration in the
four stages (mIU/l) at different time points.
| Stage | 0 min | 15 min | 30 min | 45 min | 60 min | 120 min |
|---|
| PWS | 2.29 (1.44,
3.13) | 2.20 (1.68,
2.78) | 2.51 (1.59,
3.18) | 2.23 (1.37,
2.97) | 1.90 (1.46,
2.86) | 2.06(1.45, 2.80) |
| GSS | 1.28 (0.47,
3.22) | 6.77 (3.08,
18.01) | 30.18 (11.88,
66.92)b | 33.15 (14.95,
64.33)b | 16.76 (6.30,
39.82)b | 8.97(2.83,
15.40)b |
| ARS | 1.91 (1.20,
2.97) | 4.89 (3.20,
7.05) | 3.60 (1.94,
7.60) | 4.15 (2.89,
7.56)a | 2.11 (0.49,
4.56) | 0.74(0.22, 2.63) |
| GAS | 1.33 (0.73,
2.12)c | 15.66 (3.71,
51.74)b | 39.36 (23.44,
60.95)b | 32.19 (25.63,
56.57)b | 34.88 (21.91,
49.11)b | 16.34 (9.32,
29.90)b |
Concentration-time curve
The net incremental AUCs of glucose
(AUCg) and insulin (AUCi) in the GSS and GAS
increased markedly compared with those of the PWS and ARS
(P<0.05). AUCi in the ARS increased notably compared
with that in the PWS (P<0.05); however, the difference in
AUCg between the ARS and PWS was not significant
(P>0.05). In Table IV, the
AUCg and AUCi in the GSS and GAS demonstrated
no significant differences (P>0.05). The AUCg and
AUCi in the GSS and ARS compared with those in the GAS
were not significantly different (z=−0.42, P=0.67; z=−1.26,
P=0.21).
| Table IV.Net incremental area under the
concentration-time curve of glucose and insulin and its relative
percentage in the four stages. |
Table IV.
Net incremental area under the
concentration-time curve of glucose and insulin and its relative
percentage in the four stages.
| Stage | AUCg
[(mmol/l) x min] | AUCi
[(mIU/l) x min] |
AUCg/AUCg (%) |
AUCi/AUCi (%) |
|---|
| PWS | −3.5 (−61.5,
54.6) | −10.7 (−66.1,
44.8) | −145.0 (−136.1,
−94.7) | −109.5 (−114.3,
−87.5) |
| GSS | 161.3 (42.8,
279.8)ab | 2274.1 (941.0,
3607.3)ab | 100 | 100 |
| ARS | −1.4 (−53.7,
50.9) | 129.7 (−8.1,
267.5)b | −40.5 (−123.5,
−90.6) | −342.6 (−110.7,
−80.4) |
| GAS | 167.3 (91.8,
242.7)ab | 3425.2 (2502.8,
4347.5)ab | 281.0 (−2.2,
9.7) | 227.8 (141.6,
312.1) |
Tolerability
Arginine tastes bitter, salty and acerbic. Fourteen
of the 16 administrations resulted in nausea but not vomiting.
Following all 16 administrations, the subjects had diarrhea three
to five times without abdominal pain on the day of administration
and the worst case lasted for seven episodes of diarrhea. All
subjects fully recovered on the second day.
Discussion
A previous study reported that oral protein
increases insulin concentration (14). Another study demonstrated that
amino acids absorbed by the gut stimulate insulin release and
arginine may be the main functional component (15). Floyd et al first identified
that intravenous arginine administration increases the insulin
concentration in the blood circulation (16). Thus, the intravenous arginine load
test is clinically used as the non-glucose promoting secretion test
to evaluate the function of islet β-cells in patients with T2DM
(17-20), leading to the exploration of the
oral arginine load test.
In 2002, Gannon et al performed the oral
arginine load test and identified that oral arginine increases
glucagon levels and delays glucose processing without affecting the
gastric emptying time. However, this amino acid does not increase
the serum insulin concentration (11). Given that the test was conducted on
healthy adults and obese volunteers with T2DM by low-dose oral
arginine administration, the blood arginine concentration was much
lower than the oral sensitivity threshold. In individuals with
normal glucose levels, the serum arginine concentration is 0.7
mmol/l when the insulin secretion volume reaches half of the
effective dose (ED50) in phase one, and the insulin
secretion volume is 2.7 mmol/l in phase two (13). Therefore, the large-dose oral
arginine administration may stimulate insulin secretion as
effectively as glucose; this possibility was the motivation for our
study.
Previous oral arginine load tests have shown that
arginine is perfectly tolerated in all subjects (11,12).
However, in the present study, the administration of a large dose
of oral arginine resulted in nausea in 14 out of 16 cases and all
subjects experienced varying degrees of diarrhea, which indicates
that the arginine dose used had reached the maximum tolerance for a
single oral dosage. Our results demonstrated that large-dose oral
arginine administration has the same effect on glucose
concentration as treatment with purified water. Large-dose oral
arginine administration stimulates insulin release independent of
glucose concentration; however, the extent is much less compared
with that of intravenous administration (8,21).
The stimulating effect of oral and intravenous glucose on insulin
release is not observed in arginine administration (9). This observation may be related to the
low bioavailability of ∼21% of oral arginine (13). Oral arginine administration is
affected by the gastrointestinal digestion absorption rate,
arginine metabolism of the intestinal mucosa cells, the first-pass
removal rate of the liver and others (22). Intravenous administration avoids
the metabolism of the gastrointestinal system and liver, as well as
effectively increasing the arginine content in the blood
circulation to significantly stimulate islet β-cells. In addition,
oral arginine administration has no stimulating effect on
gut-affected insulin secretion the same with oral glucose
administration (23). Arginine
combined with glucose quickly stimulates insulin secretion and
persists for a long time; however, it has no synergistic
stimulatory effect (19,24). Promoters of insulin secretion are
divided into two classes, namely, the initiator or primary irritant
and the enhancer or secondary irritant. The initiator increases
insulin release without any other irritant. Glucose is the most
effective initiator. The enhancer does not have an effect by
itself; however, it promotes insulin secretion with the existence
of an initiator, including glucose (25). Arginine may have a stronger
stimulatory effect on insulin secretion as a secondary irritant
than as a primary irritant. Therefore, oral arginine load tests may
be applied in patients with impaired glucose tolerance. A different
set of subjects are required for these tests to be conducted.
Further studies are required to detect the concentration of serum
arginine, glicentin and incretin.
In conclusion, the current study indicates that a
large dose of oral arginine does not affect the glucose
concentration and is not able to effectively stimulate the insulin
secretion of healthy adults with normal glucose tolerance. Further
studies are required to determine whether a large dose of oral
arginine stimulates insulin secretion in patients with serious
sugar toxicity and suffering from impaired glucose tolerance or
damaged islet cells that are unresponsive to glucose stimulation.
Further improvements, including changing the form of medication,
buccal and sublingual administration to avoid the metabolism of the
gastro-intestine, or using a microcapsule package technique to
reduce the removal rate of the liver, may promote the clinical
application of other administration means of arginine stimulation
tests as alternatives to intravenous administration.
References
|
1.
|
Wajchenberg BL: Beta-cell failure in
diabetes and preservation by clinical treatment. Endocr Rev.
28:187–218. 2007. View Article : Google Scholar : PubMed/NCBI
|
|
2.
|
Bonora E: Protection of pancreatic
beta-cells: is it feasible? Nutr Metab Cardiovasc Dis. 18:74–83.
2008. View Article : Google Scholar : PubMed/NCBI
|
|
3.
|
Leibowitz G, Kaiser N and Cerasi E: β-cell
failure in type 2 diabetes. J Diabetes Investigation. 2:82–90.
2011.
|
|
4.
|
Choi CS, Kim MY, Han K and Lee MS:
Assessment of β-cell function in human patients. Islets. 4:79–83.
2012.
|
|
5.
|
Marchetti P, Del Prato S, Lupi R and Del
Guerra S: The pancreatic beta-cell in human Type 2 diabetes. Nutr
Metab Cardiovasc Dis. 16(Suppl 1): S3–S6. 2006. View Article : Google Scholar
|
|
6.
|
Del Prato S and Marchetti P: Beta and
alpha-cell dysfunction in type 2 diabetes. Horm Metab Res.
36:775–781. 2004.PubMed/NCBI
|
|
7.
|
Portha B, Lacraz G, Chavey A, et al: Islet
structure and function in the GK rat. Adv Exp Med Biol.
654:479–500. 2010. View Article : Google Scholar : PubMed/NCBI
|
|
8.
|
Emoto M and Nishizawa Y: Acute insulin
response to arginine of pancreatic beta-cell. Nihon Rinsho.
60(Suppl 8): 313–318. 2002.(In Japanese).
|
|
9.
|
Lindgren O, Carr RD, Deacon CF, et al:
Incretin hormone and insulin responses to oral versus intravenous
lipid administration in humans. J Clin Endocrinol Metab.
96:2519–2524. 2011. View Article : Google Scholar : PubMed/NCBI
|
|
10.
|
Standl E: The importance of beta-cell
management in type 2 diabetes. Int J Clin Pract Suppl. 153:10–19.
2007. View Article : Google Scholar : PubMed/NCBI
|
|
11.
|
Gannon MC, Nuttall JA and Nuttall FQ: Oral
arginine does not stimulate an increase in insulin concentration
but delays glucose disposal. Am J Clin Nutr. 76:1016–1022.
2002.PubMed/NCBI
|
|
12.
|
Chaisanguanthum R and Tayek JA: Oral
arginine has no acute effect on blood glucose concentrations or
glucose production in type 2 diabetic volunteers. Nutr Res.
23:35–44. 2003. View Article : Google Scholar
|
|
13.
|
Tangphao O, Grossmann M, Chalon S, Hoffman
BB and Blaschke TF: Pharmacokinetics of intravenous and oral
L-arginine in normal volunteers. Br J Clin Pharmacol. 47:261–266.
1999. View Article : Google Scholar : PubMed/NCBI
|
|
14.
|
de Oliveira CA, Latorraca MQ, de Mello MA
and Carneiro EM: Mechanisms of insulin secretion in malnutrition:
modulation by amino acids in rodent models. Amino Acids.
40:1027–1034. 2011.PubMed/NCBI
|
|
15.
|
van Loon LJ, Saris WH, Verhagen H and
Wagenmakers AJ: Plasma insulin responses after ingestion of
different amino acid or protein mixtures with carbohydrate. Am J
Clin Nutr. 72:96–105. 2000.PubMed/NCBI
|
|
16.
|
Floyd JC Jr, Fajans SS, Conn JW, et al:
Stimulation of insulin secretion by amino acids. J Clin Invest.
45:1487–1502. 1966. View Article : Google Scholar : PubMed/NCBI
|
|
17.
|
Hubert T, Strecker G, Gmyr V, et al: Acute
insulin response to arginine in deceased donors predicts the
outcome of human islet isolation. Am J Transplant. 8:872–876. 2008.
View Article : Google Scholar : PubMed/NCBI
|
|
18.
|
Larsen MO: Beta-cell function and mass in
type 2 diabetes. Dan Med Bull. 56:153–164. 2009.PubMed/NCBI
|
|
19.
|
Vilsbøll T, Brock B, Perrild H, et al:
Liraglutide, a once-daily human GLP-1 analogue, improves pancreatic
B-cell function and arginine-stimulated insulin secretion during
hyperglycaemia in patients with Type 2 diabetes mellitus. Diabet
Med. 25:152–156. 2008.PubMed/NCBI
|
|
20.
|
Rickels MR, Naji A and Teff KL: Acute
insulin responses to glucose and arginine as predictors of
beta-cell secretory capacity in human islet transplantation.
Transplantation. 84:1357–1360. 2007. View Article : Google Scholar : PubMed/NCBI
|
|
21.
|
Ma XJ, Jia WP, Zhou J, Lu HJ, Lu JQ and Wu
SH: Blood levels of true insulin and immunoreactive insulin in
evaluating beta-cell function with arginine stimulation test.
Zhejiang Da Xue Xue Bao Yi Xue Ban. 35:255–259. 2006.(In
Chinese).
|
|
22.
|
Gannon MC and Nuttall FQ: Amino acid
ingestion and glucose metabolism - a review. IUBMB Life.
62:660–668. 2010. View
Article : Google Scholar : PubMed/NCBI
|
|
23.
|
Nilsson M, Stenberg M, Frid AH, Holst JJ
and Björck IM: Glycemia and insulinemia in healthy subjects after
lactose-equivalent meals of milk and other food proteins: the role
of plasma amino acids and incretins. Am J Clin Nutr. 80:1246–1253.
2004.PubMed/NCBI
|
|
24.
|
Eckersten D and Henningsson R: Nitric
oxide (NO) - production and regulation of insulin secretion in
islets of freely fed and fasted mice. Regul Pept. 174:32–37. 2012.
View Article : Google Scholar : PubMed/NCBI
|
|
25.
|
Henquin JC: The dual control of insulin
secretion by glucose involves triggering and amplifying pathways in
β-cells. Diabetes Res Clin Pract. 93(Suppl 1): S27–S31.
2011.PubMed/NCBI
|