Introduction
There is considerable evidence that nonsteroidal
anti-inflammatory drugs (NSAIDs) exert antitumor effects through
cyclooxygenase 2 (COX-2)-dependent and independent approaches
(1). Furthermore, it has been
suggested that nonsteroidal anti-inflammatory drug-activated gene-1
(NAG-1) is capable of inhibiting cell proliferation and promoting
apoptosis through various signal transduction pathways. NSAIDs and
other chemopreventive phytochemicals are able to induce the
expression of NAG-1 in certain tumor cells, and this is considered
to be an important non-COX-2 approach by which NSAIDs exert
antitumor effects. The role of NAG-1 in gastric cancer
carcinogenesis is controversial. We have previously demonstrated
that NAG-1 was induced by troglitazone to inhibit the proliferation
of a gastric cancer cell line and induce apoptosis in
vitro(2). It has been
suggested that the overexpression of NAG-1 mRNA in invasive areas
in gastric tissues functions as a promoter of tumor progression
(3). However, in a different
study, NAG-1 protein expression was reported to be low in gastric
cancer (4). Thus, in the present
study, immunohistochemistry and reverse transcription-polymerase
chain reaction (RT-PCR) were employed to assess NAG-1 protein and
mRNA expression in gastric cancer and normal tissues, with the aim
to investigate the possible role of NAG-1 in the carcinogenesis and
development of gastric carcinoma.
Materials and methods
Research subjects
Forty-six gastric cancer tissue samples were
randomly collected from individuals who had undergone gastrectomy
for gastric cancer between March 2009 and October 2012 at West
China Hospital, Sichuan University (Chengdu, China). The patients
included 31 males and 15 females, with a mean age of 56.3±8.1
years. In addition, 26 tumor-adjacent normal tissue samples were
collected from 17 male and 9 female patients (mean age, 50.3±9.4
years), and 57 normal gastric mucosa samples were collected by
endoscopic biopsy, including 31 males and 26 females (mean age,
57.3±9.97 years). All patients provided informed consent for the
biopsy procedure. All paraffin sections were generated and examined
using hematoxylin and eosin (H&E) and immunohistochemical
staining. Two pathologists independently examined the
H&E-stained sections, employing the World Health Organization
Histopathological Grading Standards for gastric cancer.
Tumor-adjacent normal tissue samples were validated histologically.
The fresh tissues were immediately frozen in liquid nitrogen for
RNA extraction.
Antibodies and reagents
Anti-NAG-1 rabbit anti-human polyclonal antibody was
purchased from Upstate Biotechnology (Lake Placid, NY, USA), while
the SP-9001 immunohistochemistry kit and 3,3′-diaminobenzidine
(DAB) were obtained from Zhongshan Biotechnology Co., Ltd.,
(Beijing, China). Triton X-100 was purchased from Sigma (St. Louis,
MO, USA) and TRIzol reagent was purchased from Invitrogen Life
Technologies (Carlsbad, CA, USA). A Takara RNA PCR kit (Takara,
Shiga, Japan) was used in the study.
Immunohistochemistry
Placental tissues were used as positive controls.
Paraffin sections were deparaffinized and rehydrated and endogenous
peroxidase activity was blocked using 3% toluene-hydrogen peroxide.
The slides were washed with 0.2% Triton X-100-phosphate-buffered
saline (PBS) three times, for 10 min each, and heat-fixed using a
pressure cooker with citrate buffer (pH 6.0) for antigen retrieval.
A total of 50 μl avidin solution (A solution) and 50 μl D-biotin
solution (B solution) was successively added to each slide to
further eliminate endogenous avidin biding activity. The slides
were incubated with 50 μl rabbit serum for ~20 min and dried, prior
to the addition of 50 μl 1:600 NAG-1 polyclonal antibody. Following
this, the slides were incubated overnight at 4ºC and washed with
PBS three times, for 5 min each time. A total of 50 μl secondary
antibody was then added to each slide and incubated at 37ºC for 20
min. The immunoreaction was developed by incubation with
streptavidin horseradish avidin and DAB chromogen. The integrated
optical density of each slice was assessed using Image-Pro Plus 5.0
Image Analysis Software (MediaCybernetics, Rockville, MD, USA).
RT-PCR detection
Total RNA was extracted from the fresh tissues using
a TRIzol kit, according to the manufacturer’s instructions. The
RT-PCR was designed in a two-step method. The primer sequences used
in the study were as follows: NAG-1 forward,
5′-GCAAGTGACCATGTGCATCGG-3 and reverse,
5′-CAGGAATCGGGTGTCTCAGGAAC-3′; β-actin forward,
5′-GGGCATGGGTCAGAAGGATT-3′ and reverse, 5′-ATGAGGTAGTCAGTCAGGTC-3′.
The cDNA synthesis reaction conditions were as follows: 30ºC for 10
min, 42ºC for 60 min, 99ºC for 5 min and 5ºC for 5 min. The PCR
system was utilized according to the manufacturer′s instructions,
with the following reaction conditions: Denaturation for 30 sec at
94ºC, annealing for 30 sec at 60ºC, extension for 45 sec at 72ºC,
30 cycles, extension for 10 min at 72ºC and cooling for 10 min at
4ºC. The final PCR products were loaded onto 1% agarose gels and
images were captured under ultraviolet light. The objective band
and β-actin gray value of the PCR products were measured using
Quantity One software® (Bio-Rad, Hercules, CA, USA) and
the ratio was taken as an indicator of NAG-1 expression intensity.
The PCR products were sent to Shanghai Invitrogen Biotechnology Co,
Ltd. (Shanghai, China) for sequencing.
Statistical analysis
SPSS 13.0 statistical software (SPSS, Inc., Chicago,
IL, USA) was used for the analysis. One-way analysis of variance
was employed for the comparison between the groups showing normal
distribution and the Student-Newman-Keuls method was used for
pairwise comparisons. The completely randomized rank sum test was
employed for comparisons between two groups of non-normal data. The
correlation between tumor-node-metastasis (TNM) staging,
infiltration degree, tumor size, differentiation and the expression
of NAG-1 was analyzed using the Spearman’s correlation. P<0.05
was considered to indicate a statistically significant
difference.
Results
Comparison of the NAG-1 protein
expression between normal gastric and gastric carcinoma
tissues
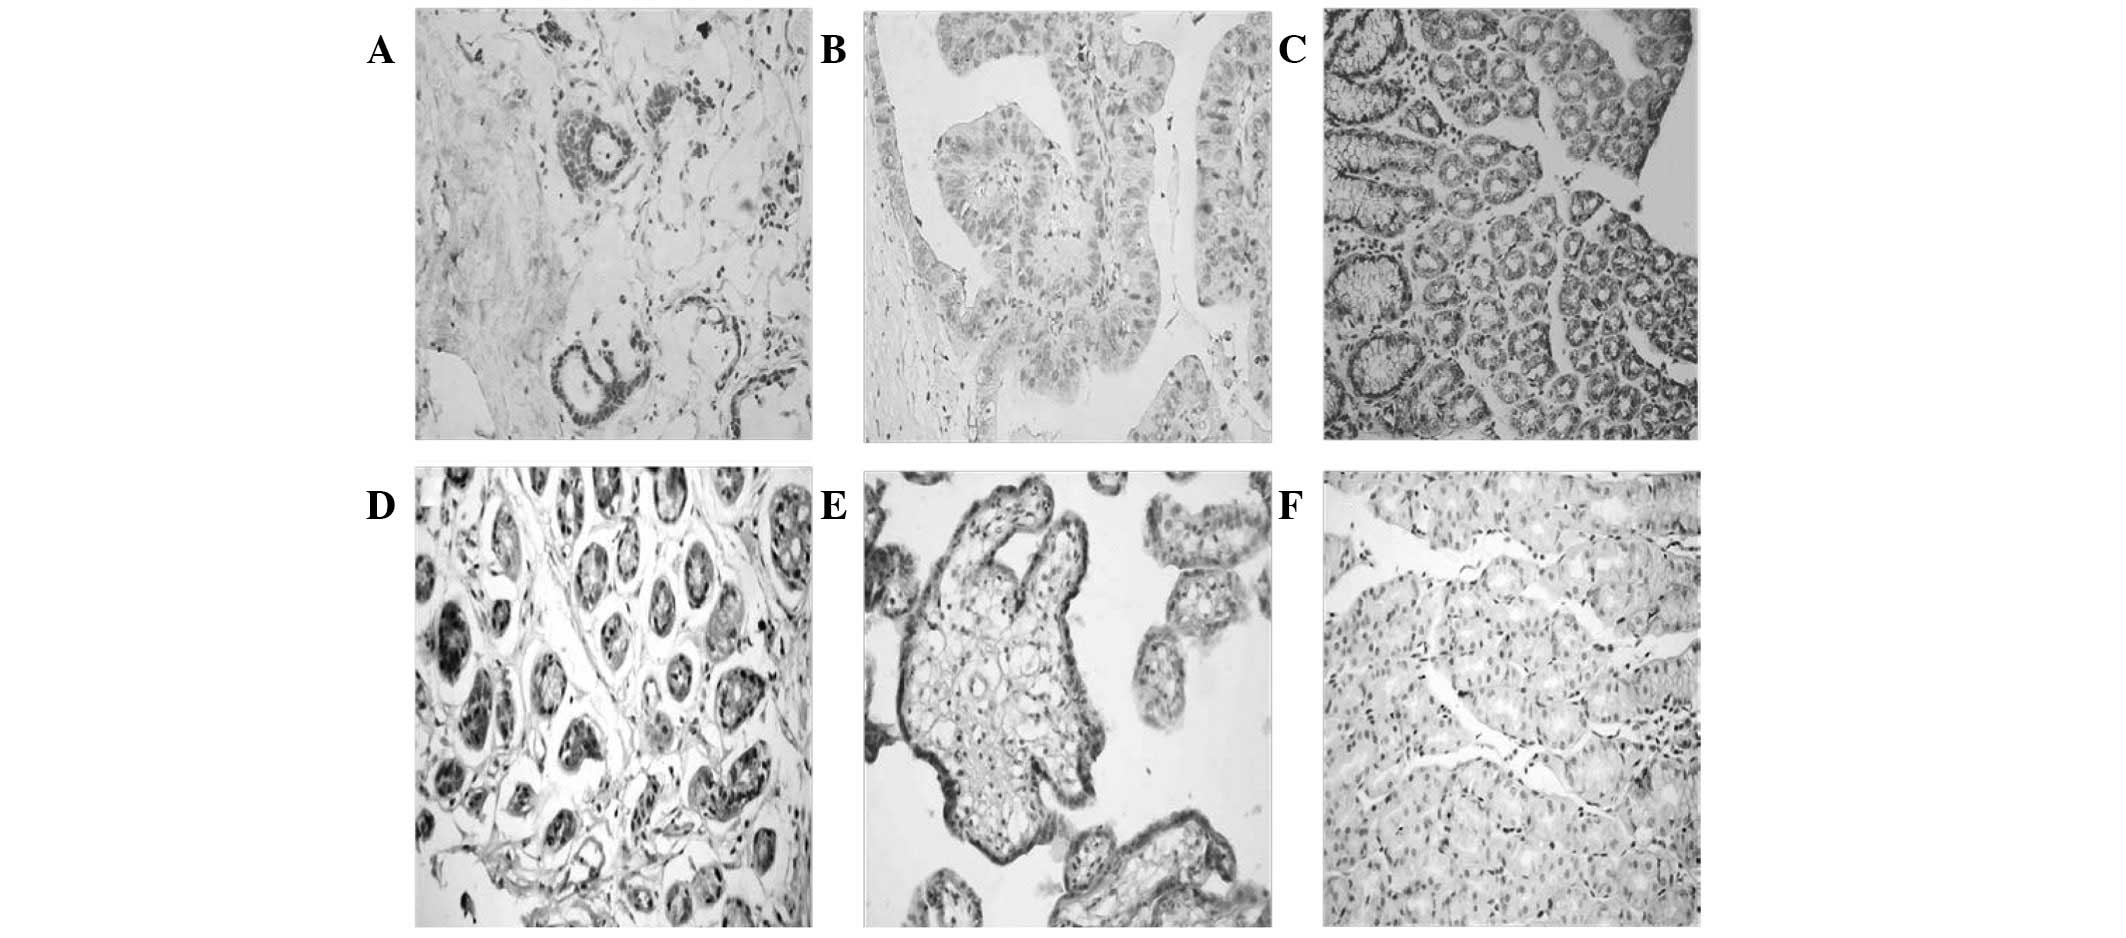
NAG-1 protein was expressed in the cytoplasm of the
placental and normal gastric tissue cells (Fig. 1). Semi-quantitative analysis
indicated that the expression of NAG-1 in tumor-adjacent normal
gastric tissues was significantly higher than that in the normal
gastric mucosa from the endoscopy biopsy (P=0.015; Table I). NAG-1 protein expression levels
were lowest in gastric carcinoma tissues and this expression was
significantly lower than that in tumor-adjacent normal tissues
(P=0.014), as well as lower than that in normal gastric mucosa
(P=0.02; Table II).
 | Table INAG-1 protein expression in
tumor-adjacent normal tissues and normal gastric mucosa. |
Table I
NAG-1 protein expression in
tumor-adjacent normal tissues and normal gastric mucosa.
| Group | Cases | Mean IOD value | P-value |
|---|
| Tumor-adjacent normal
tissues | 19 | 80.09±13.99 | 0.015 |
| Normal gastric
mucosa | 33 | 30.09±15.45 | |
| Table IINAG-1 protein expression in gastric
carcinoma tissues and normal gastric mucosa. |
Table II
NAG-1 protein expression in gastric
carcinoma tissues and normal gastric mucosa.
| Group | Cases | Median IOD value
(Quartile) | P-value |
|---|
| Gastric carcinoma
tissues | 46 | 2.46 (0–26.77) | 0.02 |
| Normal gastric
mucosa | 33 | 33.51
(15.25–42.58) | |
Correlation between NAG-1 expression and
degree of tumor differentiation, TNM staging, infiltration degree
and tumor size
Semi-quantitative immunohistochemical analysis
showed that NAG-1 protein expression in moderately and
well-differentiated adenocarcinoma tissues was higher than in
poorly differentiated adenocarcinoma tissues (P=0.005; Table III). Spearman’s correlation
analysis showed that the degree of tumor differentiation and NAG-1
expression intensity were correlated (r=0.854; P=0.03). There was
no variations in NAG-1 expression intensity in gastric cancer at
different TNM stages (stages I–II and III–IV), infiltration degrees
(T0–T2 and T3–T4) or tumor sizes (diameter, ≥5 and <5 cm;
Table IV). Spearman’s correlation
analysis indicated that there was no correlation between NAG-1
expression intensity and the TNM stage, infiltration degree or
tumor size of gastric cancer (r=−0.22, 0.007 and −0.138,
respectively).
| Table IIINAG-1 protein expression in
adenocarcinoma tissues. |
Table III
NAG-1 protein expression in
adenocarcinoma tissues.
| Group | Cases | Mean IOD value | P-value |
|---|
| Poorly differentiated
gastric cancer | 28 | 1.33±1.18 | 0.005 |
| Moderately
differentiated and well-differentiated adenocarcinoma tissues | 18 | 13.78±6.58 | |
| Table IVCorrelation between NAG-1 protein
expression and TNM stage, infiltration degree and tumor size of
gastric cancer. |
Table IV
Correlation between NAG-1 protein
expression and TNM stage, infiltration degree and tumor size of
gastric cancer.
| Characteristic | Cases | Median IOD value
(Quartile) | P-value |
|---|
| Infiltration
degree |
| T0–T2 | 20 | 2.46 (0–29.58) | 0.96 |
| T3–T4 | 26 | 2.45
(1.58–25.52) | |
| TNM staging |
| Stage I–II | 16 | 3.87 (0–32.36) | 0.139 |
| Stage III–IV | 30 | 2.95
(1.43–23.18) | |
| Tumor size, cm |
| ≥5 | 24 | 2.76 (0–17.99) | 0.089 |
| <5 | 22 | 3.17 (0–31.02) | |
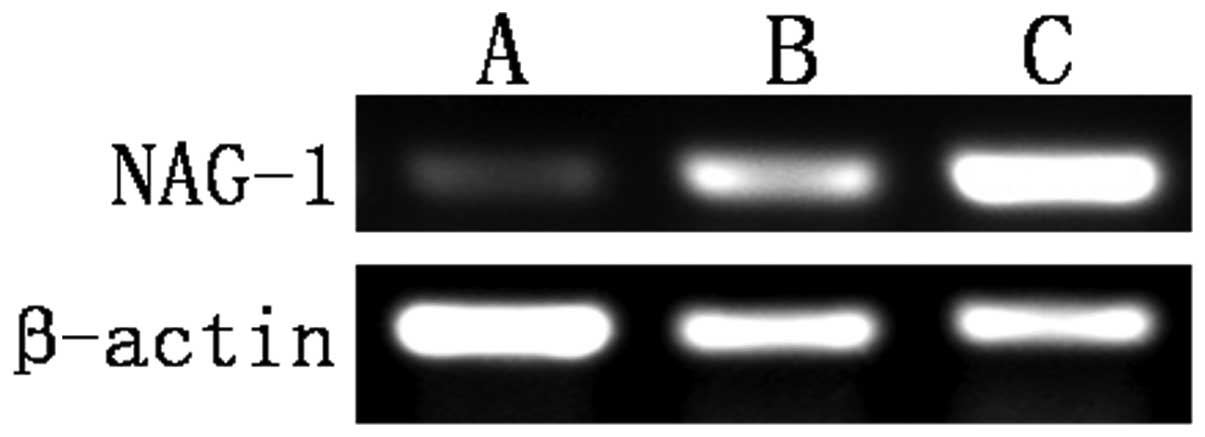
Comparison of the expression of NAG-1
mRNA between normal gastric and gastric carcinoma tissues
Gastric carcinoma tissues expressed the lowest
levels of NAG-1 mRNA. The expression of NAG-1 mRNA in the
tumor-adjacent normal gastric tissues was higher than that in the
normal gastric mucosa (Table V and
Fig. 2).
| Table VNAG-1 mRNA expression in normal
gastric and gastric carcinoma tissues. |
Table V
NAG-1 mRNA expression in normal
gastric and gastric carcinoma tissues.
| Group | Cases | Mean gray scale | P-value |
|---|
| Gastric carcinoma
tissues | 19 | 0.8210±0.10173 | |
| Tumor-adjacent normal
tissues | 26 | 1.8246±0.14971 | 0.012a |
| Normal gastric
mucosa | 24 | 1.1675±0.08779 | 0.027a; 0.032b |
Discussion
NAG-1, a member of the TGF-β superfamily, was
originally identified in sulindac sulfide-treated HCT-116 colon
cancer cells (5). It was later
suggested that a variety of NSAIDs were able to induce NAG-1 gene
expression to exert antitumor effects, independent of COX-2.
Therefore, this was considered to be one of the most important
non-COX-2 approaches by which NSAIDs elicited antitumor effects. In
addition to NSAIDs, a number of phytochemicals, including
resveratrol (6), genistein
(7), diallyl disulfide (8), indole-3-methanol (9), retinoic acid (10) and PPARγ; ligands (11), have been shown to be capable of
promoting apoptosis and mediating antitumor effects by inducing the
expression of NAG-1. NAG-1, also known as placental transforming
growth factor β (12), macrophage
inhibitory cytokine 1 (13),
placental bone morphogenetic protein (14), prostate differentiation factor
(15) and growth differentiation
factor 15 (16), is highly
expressed in the human placenta and prostate and weakly expressed
in the kidney and pancreas (15).
The NAG-1 prodomain consists of 167 amino acids and contains an
N-linked glycosylation site (17). Following dimerization of the
full-length pro-NAG-1 precursor by a disulfide linkage, the dimeric
pro-protein undergoes proteolytic cleavage catalyzed by furin-like
protease at the sequence RXXR, resulting in the release of a
112-amino acid C-terminal dimeric mature region. The mature dimer
is then secreted into the extracellular media. Therefore, NAG-1 may
have multiple forms in the cell, including the pro-NAG-1 monomer,
the pro-NAG-1 dimer, the pro-peptide N-terminal fragment following
cleavage and the mature dimer.
The role of NAG-1 in the development and progression
of cancer is complex and poorly understood. In vitro and
in vivo studies in colon and prostate cancer and some
experimental evidence have suggested that NAG-1 exhibits
tumor-suppressor activity (18–21),
while other data have suggested that it has oncogenic activity
(22,23). Similarly, the role of NAG-1 in
gastric cancer carcinogenesis is also controversial. NAG-1 has been
demonstrated to stimulate the growth of a number of gastric cell
lines, mediated by the activation of the extracellular
signal-regulated kinase 1/2 (ERK1/2) pathway (3). In addition, NAG-1 has been shown to
activate the protein kinase B and ERK1/2 pathways in human breast
and gastric cells by the transactivation of the ErbB2/human
epidermal growth factor receptor 2 oncogene (24). A clinical study revealed that NAG-1
expression was upregulated in the serum of patients with gastric
cancer and that its expression markedly correlated with cancer
metastasis, suggesting an oncogenic role for NAG-1 during gastric
cancer progression (25). By
contrast, the NAG-1 gene is capable of being induced by NSAIDs
(26,27) and troglitazone (2) to inhibit the proliferation of the
gastric cancer cell line and induce apoptosis in vitro,
suggesting that NAG-1 functions as a tumor suppressor in the
development of gastric cancer.
In the present study, it was observed that NAG-1
protein expression levels were lowest in gastric carcinoma tissues,
and that this expression was significantly lower than that of
tumor-adjacent normal tissues, as well as normal gastric mucosa.
This suggested that NAG-1 may function as a tumor-suppressor gene
in gastric cancer carcinogenesis. The expression of NAG-1 protein
in human gastric carcinoma was further analyzed to evaluate its
correlation with specific clinical features. NAG-1 protein
expression exhibited no correlation with tumor infiltration degree,
TNM stage or tumor size, which was inconsistent with the study by
Park et al(4). The NAG-1
protein expression intensity was inversely correlated with the
differentiation of gastric cancer, suggesting that NAG-1 may be
involved in regulating the differentiation of gastric cancer.
Furthermore, the NAG-1 protein expression in tumor-adjacent normal
gastric tissues was higher than that in the normal gastric mucosa,
which was attributed to the relatively superficial sampling of the
endoscopic biopsy.
NAG-1 expression in normal and cancer tissues has
been investigated in a number of studies, which were subsequently
reviewed by Mimeault and Batra (28). Collectively, there is no clear
consensus regarding the expression levels of NAG-1 in tumors
compared with normal tissues, although the majority of the data
indicate higher expression in tumors relative to normal tissues.
One consideration is the variations in methodologies used to
measure NAG-1 expression by different investigators (29). The specificity of the antibodies
used to measure the expression of NAG-1 in a number of the studies
is frequently not clearly stated. The use of an antibody that
detects the monomer form, while poorly reacting with the dimer
form, is likely to yield conflicting expression data when compared
with the use of an antibody that reacts well with the dimer and
poorly with the monomers.
Notably, it was observed in the present study that
NAG-1 protein was exclusively expressed in the cytoplasm of gastric
glands in the normal gastric mucosa, which was inconsistent with
the results of the study by Kim et al(30), in which NAG-1 was exclusively
expressed in the colonic epithelial membrane lining. This
demonstrates that there are secretory NAG-1 protein forms and
variations in the activity of the cleaving enzyme which cleave
pro-NAG-1 from the RXXR site in different tissues. The activity of
the cleaving enzyme is capable of influencing the level of NAG-1
inside the cell, as the cleaved NAG-1 is rapidly secreted. However,
the majority of the studies did not examine the activity of the
cleaving enzyme when analyzing NAG-1 expression. Thus, NAG-1
expression studies, which are conducted by the measurement of
protein expression, must be assessed with caution. Previously,
Kadowaki et al(31)
performed an ELISA in a glioma cell line and normal and
glioblastoma tumor samples, revealing that the correlation between
the gene copy number and the expression of the pro-NAG-1 in the
cells and the concentration of secreted NAG-1, were inconsistent.
In specific cells, the majority of NAG-1 was in the secreted form
in the media, while in other cells, NAG-1 remained as the pro-NAG-1
inside the cells. Thus, the measurement of gene copy number is a
better estimate of NAG-1. Therefore, in the present study, RT-PCR
was performed to assess the expression of NAG-1 mRNA in gastric
cancer and normal gastric tissues. In addition, PCR products were
confirmed by sequencing. The results showed that the expression of
NAG-1 mRNA was low in gastric cancer, significantly lower than that
of the tumor-adjacent normal tissues and normal gastric mucosa.
This was consistent with the immunohistochemical results, which
further demonstrated that the absence of NAG-1 is involved in
gastric tumorigenesis.
In conclusion, the present study demonstrated that
NAG-1 protein and mRNA levels in gastric carcinoma are
significantly lower than those in the tumor-adjacent normal tissues
and normal gastric mucosa, suggesting that NAG-1 may have a
negative regulatory role in gastric cancer by acting as a
tumor-suppressor gene. This indicates that low NAG-1 expression may
lead to cancer. In-depth studies of NAG-1 are likely to enhance the
understanding of the antitumor effect of NSAIDs and also provide a
novel target for the prevention and treatment of gastric
cancer.
Acknowledgements
This study was supported by the Research Program of
Sichuan Provincial Department of Science and Technology (no.
04SG022-015-05).
References
|
1
|
Wang R, Guo L, Wang P, et al:
Chemoprevention of cancers in gastrointestinal tract with
cyclooxygenase 2 inhibitors. Curr Pharm Des. 19:115–125.
2012.PubMed/NCBI
|
|
2
|
Wang C, Wang J and Bai P: Troglitazone
induces apoptosis in gastric cancer cells through the NAG-1
pathway. Mol Med Rep. 4:93–97. 2011.PubMed/NCBI
|
|
3
|
Lee DH, Yang Y, Lee SJ, et al: Macrophage
inhibitory cytokine-1 induces the invasiveness of gastric cancer
cells by up-regulating the urokinase-type plasminogen activator
system. Cancer Res. 63:4648–4655. 2003.PubMed/NCBI
|
|
4
|
Park JY, Park KH, Bang S, Kim MH, Koh SS
and Song SY: Expression of nonsteroidal anti-inflammatory
drug-activated gene-1 (NAG-1) inversely correlates with tumor
progression in gastric adenomas and carcinomas. J Cancer Res Clin
Oncol. 134:1029–1035. 2008. View Article : Google Scholar : PubMed/NCBI
|
|
5
|
Baek SJ, Kim KS, Nixon JB, Wilson LC and
Eling TE: Cyclooxygenase inhibitors regulate the expression of a
TGF-beta superfamily member that has proapoptotic and
antitumorigenic activities. Mol Pharmacol. 59:901–908.
2001.PubMed/NCBI
|
|
6
|
Baek SJ, Wilson LC and Eling TE:
Resveratrol enhances the expression of non-steroidal
anti-inflammatory drug-activated gene (NAG-1) by increasing the
expression of p53. Carcinogenesis. 23:425–434. 2002. View Article : Google Scholar : PubMed/NCBI
|
|
7
|
Wilson LC, Baek SJ, Call A and Eling TE:
Nonsteroidal anti-inflammatory drug-activated gene (NAG-1) is
induced by genistein through the expression of p53 in colorectal
cancer cells. Int J Cancer. 105:747–753. 2003. View Article : Google Scholar : PubMed/NCBI
|
|
8
|
Bottone FG Jr, Baek SJ, Nixon JB and Eling
TE: Diallyl disulfide (DADS) induces the antitumorigenic
NSAID-activated gene (NAG-1) by a p53-dependent mechanism in human
colorectal HCT 116 cells. J Nutr. 132:773–778. 2002.PubMed/NCBI
|
|
9
|
Lee SH, Kim JS, Yamaguchi K, Eling TE and
Baek SJ: Indole-3-carbinol and 3,3′-diindolylmethane induce
expression of NAG-1 in a p53-independent manner. Biochem Biophys
Res Commun. 328:63–69. 2005.
|
|
10
|
Newman D, Sakaue M, Koo JS, et al:
Differential regulation of nonsteroidal anti-inflammatory
drug-activated gene in normal human tracheobronchial epithelial and
lung carcinoma cells by retinoids. Mol Pharmacol. 63:557–564. 2003.
View Article : Google Scholar : PubMed/NCBI
|
|
11
|
Baek SJ, Kim JS, Nixon JB, DiAugustine RP
and Eling TE: Expression of NAG-1, a transforming growth
factor-beta superfamily member, by troglitazone requires the early
growth response gene EGR-1. J Biol Chem. 279:6883–6892. 2004.
View Article : Google Scholar : PubMed/NCBI
|
|
12
|
Li PX, Wong J, Ayed A, et al: Placental
transforming growth factor-beta is a downstream mediator of the
growth arrest and apoptotic response of tumor cells to DNA damage
and p53 overexpression. J Biol Chem. 275:20127–20135. 2000.
View Article : Google Scholar : PubMed/NCBI
|
|
13
|
Bootcov MR, Bauskin AR, Valenzuela SM, et
al: MIC-1, a novel macrophage inhibitory cytokine, is a divergent
member of the TGF-beta superfamily. Proc Natl Acad Sci USA.
94:11514–11519. 1997. View Article : Google Scholar : PubMed/NCBI
|
|
14
|
Hromas R, Hufford M, Sutton J, Xu D, Li Y
and Lu L: PLAB, a novel placental bone morphogenetic protein.
Biochim Biophys Acta. 1354:40–44. 1997. View Article : Google Scholar : PubMed/NCBI
|
|
15
|
Paralkar VM, Vail AL, Grasser WA, et al:
Cloning and characterization of a novel member of the transforming
growth factor-beta/bone morphogenetic protein family. J Biol Chem.
273:13760–13767. 1998. View Article : Google Scholar : PubMed/NCBI
|
|
16
|
Böttner M, Laaff M, Schechinger B, Rappold
G, Unsicker K and Suter-Crazzolara C: Characterization of the rat,
mouse, and human genes of growth/differentiation
factor-15/macrophage inhibiting cytokine-1 (GDF-15/MIC-1). Gene.
237:105–111. 1999.PubMed/NCBI
|
|
17
|
Bauskin AR, Zhang HP, Fairlie WD, et al:
The propeptide of macrophage inhibitory cytokine (MIC-1), a
TGF-beta superfamily member, acts as a quality control determinant
for correctly folded MIC-1. EMBO J. 19:2212–2220. 2000. View Article : Google Scholar : PubMed/NCBI
|
|
18
|
Tan M, Wang Y, Guan K and Sun Y:
PTGF-beta, a type beta transforming growth factor (TGF-beta)
superfamily member, is a p53 target gene that inhibits tumor cell
growth via TGF-beta signaling pathway. Proc Natl Acad Sci USA.
97:109–114. 2000. View Article : Google Scholar : PubMed/NCBI
|
|
19
|
Liu T, Bauskin AR, Zaunders J, et al:
Macrophage inhibitory cytokine 1 reduces cell adhesion and induces
apoptosis in prostate cancer cells. Cancer Res. 63:5034–5040.
2003.PubMed/NCBI
|
|
20
|
Lambert JR, Kelly JA, Shim M, et al:
Prostate derived factor in human prostate cancer cells: gene
induction by vitamin D via a p53-dependent mechanism and inhibition
of prostate cancer cell growth. J Cell Physiol. 208:566–574. 2006.
View Article : Google Scholar : PubMed/NCBI
|
|
21
|
Baek SJ, Okazaki R, Lee SH, et al:
Nonsteroidal anti-inflammatory drug-activated gene-1 over
expression in transgenic mice suppresses intestinal neoplasia.
Gastroenterology. 131:1553–1560. 2006. View Article : Google Scholar : PubMed/NCBI
|
|
22
|
Brown DA, Ward RL, Buckhaults P, et al:
MIC-1 serum level and genotype: associations with progress and
prognosis of colorectal carcinoma. Clin Cancer Res. 9:2642–2650.
2003.PubMed/NCBI
|
|
23
|
Senapati S, Rachagani S, Chaudhary K,
Johansson SL, Singh RK and Batra SK: Overexpression of macrophage
inhibitory cytokine-1 induces metastasis of human prostate cancer
cells through the FAK-RhoA signaling pathway. Oncogene.
29:1293–1302. 2010. View Article : Google Scholar : PubMed/NCBI
|
|
24
|
Kim KK, Lee JJ, Yang Y, You KH and Lee JH:
Macrophage inhibitory cytokine-1 activates AKT and ERK-1/2 via the
transactivation of ErbB2 in human breast and gastric cancer cells.
Carcinogenesis. 29:704–712. 2008. View Article : Google Scholar : PubMed/NCBI
|
|
25
|
Baek KE, Yoon SR, Kim JT, et al:
Upregulation and secretion of macrophage inhibitory cytokine-1
(MIC-1) in gastric cancers. Clin Chim Acta. 401:128–133. 2009.
View Article : Google Scholar : PubMed/NCBI
|
|
26
|
Pang RP, Zhou JG, Zeng ZR, et al:
Celecoxib induces apoptosis in COX-2 deficient human gastric cancer
cells through Akt/GSK3beta/NAG-1 pathway. Cancer Lett. 251:268–277.
2007. View Article : Google Scholar
|
|
27
|
Jang TJ, Kang HJ, Kim JR and Yang CH:
Non-steroidal anti-inflammatory drug activated gene (NAG-1)
expression is closely related to death receptor-4 and -5 induction,
which may explain sulindac sulfide induced gastric cancer cell
apoptosis. Carcinogenesis. 25:1853–1858. 2004. View Article : Google Scholar
|
|
28
|
Mimeault M and Batra SK: Divergent
molecular mechanisms underlying the pleiotropic functions of
macrophage inhibitory cytokine-1 in cancer. J Cell Physiol.
224:626–635. 2010. View Article : Google Scholar : PubMed/NCBI
|
|
29
|
Wang X, Baek SJ and Eling TE: The diverse
roles of nonsteroidal anti-inflammatory drug activated gene
(NAG-1/GDF15) in cancer. Biochem Pharmacol. 85:597–606. 2013.
View Article : Google Scholar : PubMed/NCBI
|
|
30
|
Kim KS, Baek SJ, Flake GP, Loftin CD,
Calvo BF and Eling TE: Expression and regulation of nonsteroidal
anti-inflammatory drug-activated gene (NAG-1) in human and mouse
tissue. Gastroenterology. 122:1388–1398. 2002. View Article : Google Scholar : PubMed/NCBI
|
|
31
|
Kadowaki M, Yoshioka H, Kamitani H,
Watanabe T, Wade PA and Eling TE: DNA methylation-mediated
silencing of nonsteroidal anti-inflammatory drug-activated gene
(NAG-1/GDF15) in glioma cell lines. Int J Cancer. 130:267–277.
2012. View Article : Google Scholar : PubMed/NCBI
|