Introduction
Osteoarthritis (OA) is a common form of arthritis, a
disease of the joints, considered the leading cause of disability
worldwide (1). Kashin-Beck disease
(KBD) is an endemic OA, prevailing in China, Eastern Siberia, and
North Korea (2). OA and KBD not only
affect physical function, but also cause emotional stress to
patients (3). Although OA and KBD
have similar clinical features, such as common articular cartilage
lesions and chronic pain, the pathogenesis is quite different. KBD
is characterized by degeneration and necrosis in the deep zone of
articular cartilage and epiphyseal plate cartilage, whereas in OA,
progressive articular cartilage degeneration and synovial
inflammation are the major pathological processes (4). OA is more common in the elderly,
whereas KBD typically affects children and adolescents (3). A clear understanding of the molecular
mechanisms underlying both OA and KBD remains elusive, and prevents
the development of effective therapeutic strategies.
Cartilage is composed of chondrocytes and the
extracellular matrix (ECM). Chondrocytes have a strong biological
activity and can differentiate and hypertrophy (5). The ECM has an important role in
cartilage regeneration and degradation (5). The family of matrix metalloproteinases
(MMPs) has been reported as the primary factor in arthritis
(6). Integrin, as a transmembrane
receptor, mediates the connection between the cell and its external
environment (such as the ECM) (5).
Therefore, when MMP activity is abnormal, the function of
chondrocytes will inevitably be affected through integrins
(7,8). In OA, cartilage may contain excessive
numbers of hypertrophy-like chondrocytes (9); however, chondrocytes can exhibit
dedifferentiation in KBD. Although the two diseases have certain
differences, there is no doubt that chondrocyte hypertrophy is
abnormal in both OA and KBD. Furthermore, OA and KBD are
oxidative-stress-associated diseases. In affected joints, oxidative
DNA damage occurring in chondrocytes accumulates with OA
progression (10).
In a previous study, 4-hydroxy-2-nonenal and
8-hydroxydeoxyguanisine were demonstrated to accumulate in the
articular cartilage of KBD patients (11). A generator of peroxynitrite
(ONOO−) in an aqueous solution, 3-morpholinosydnonimine
(SIN-1), has been widely used in studies on oxidative or
nitrosative stress (12,13). Considering the instability of
authentic ONOO− at physiological pH, SIN-1 was chosen as
an NO donor in the present study. Although numerous studies have
been performed on deregulated hypertrophic differentiation and
oxidative stress in chondrocytes of joint cartilages, studies that
explore the exact molecular mechanism of oxidative stress in
hypertrophic chondrocytes have not been published in recent years.
In the present study, expression of osteogenesis genes was detected
in hypertrophic chondrocytes treated with SIN-1 using chip array,
and the interactions between these deregulated genes and how
signaling factors change in OA was discussed. These data will
provide new insights into the pathogenesis of OA and KBD.
Materials and methods
Cell culture and establishment of the
hypertrophic chondrocyte model
The murine chondrogenitor cell line ATDC5 is
internationally used to study cartilage differentiation in
vitro, and has previously been applied to set up a hypertrophic
chondrocyte model (14). For the
present study, the ATDC5 cell line was purchased from the European
Collection of Cell Cultures (Salisbury, UK). ATDC5 cells were
cultured in a 1:1 mixture of Dulbecco's modified Eagle's medium and
Ham's F-12 medium (DMEM/F-12 medium; Hyclone; GE Healthcare Life
Sciences, Logan, UT, USA), supplemented with 5% fetal bovine serum
(FBS; Hyclone; GE Healthcare Life Sciences), penicillin (100 U/ml;
Hyclone; GE Healthcare Life Sciences), and streptomycin (100 µg/ml;
Hyclone; GE Healthcare Life Sciences). The cells were maintained at
37°C. ATDC5 cells were driven to hypertrophy using
Insulin-Transferrin-Selenium (ITS) differentiation medium
[DMEM/F-12 containing 5% FBS, penicillin (100 U/ml), streptomycin
(100 µg/ml) and 1% ITS (cat. no. 354352; BD Biosciences, Franklin
Lakes, NJ, USA)]. The ITS differentiation medium was changed every
other day.
Identification of the hypertrophic
chondrocyte model via reverse transcription-quantitative polymerase
chain reaction (RT-qPCR)
ATDC5 cells were seeded at a density of
4×10⁴ cells/well in a six-well plate. Total RNA was
isolated at 7, 14 and 21 days following ITS addition, using an
RNeasy Plus Mini Kit (cat. no. 74104; Qiagen GmbH, Hilden,
Germany). The concentration and purity of total RNA were determined
by spectrophotometric measurement on a NanoDrop ND-2000 (NanoDrop;
Thermo Fisher Scientific, Inc., Wilmington, Delaware, USA). A total
of 1 µg of total RNA from each sample was reverse transcribed using
a Revert Aid™ First cDNA Synthesis Kit (cat. no. K1622; Thermo
Fisher Scientific, Inc., Waltham, MA, USA), and the resulting cDNA
was diluted five times in nuclease-free water. Type X collagen (Col
X) and runt-related transcription factor 2 (Runx2), as marker genes
of hypertrophy, were assessed during the induction of hypertrophy
in ATDC5 cells using the QuantiFast SYBR Green PCR kit (cat. no.
204054; Qiagen GmbH, Hilden, Germany). The thermocycling conditions
were as follows: One cycle at 95°C for 10 min; 40 cycles at 95°C
for 5 sec, 60°C for 10 sec and 72°C for 10 sec. GAPDH mRNA served
as an endogenous control. The synthetic oligonucleotide primers
(Shanghai Boya Biotechnology Co., Ltd., Shanghai, China) for
RT-qPCR are presented in Table I.
The relative mRNA expression of the target genes were calculated
using relative quantification (2−ΔΔCq) (15).
 | Table I.Primers used in reverse
transcription-quantitative polymerase chain reaction
experiments. |
Table I.
Primers used in reverse
transcription-quantitative polymerase chain reaction
experiments.
| Genes | Forward primer
(5′-3′) | Reverse primer
(5′-3′) |
|---|
| GAPDH |
GGGCTCATGACCACAGTCCATGC |
CCTTGCCCACAGCCTTGGCA |
| Col X |
ACGCATCTCCCAGCACCAGAATC |
GGGGCTAGCAAGTGGGCCCT |
| Runx2 |
GGTTGTAGCCCTCGGAGAGG |
GCCATGACGGTAACCACAGTC |
| Smad1 |
AAAGACCTGTGGCTTCCGTCT |
TTATCGTGGCTCCTTCGTCAG |
| Smad2 |
ATGTCGTCCATCTTGCCATTC |
AACCGTCCTGTTTTCTTTAGCTT |
| Smad3 |
GCTGCCCTCCTAGCTCAG |
GGTGCTGGTCACTGTCTGTC |
| Smad4 |
GAGAACATTGGATGGACGACT |
CACAGACGGGCATAGATCAC |
| Col2a1 |
CCAGCTGACCTCGCCACTGC |
GGGTCCAGGCGCACCCTTTT |
| MMP10 |
GCAGCCCATGAACTTGGCCACT |
AGGGACCGGCTCCATACAGGG |
| Vcam1 |
GATAGACAGCCCACTAAACGCG |
GAATCTCTGGATCCTTGGGG |
Identification of the hypertrophic
chondrocyte model by a western blotting assay
Proteins were harvested at 7, 14 and 21 days
following ITS addition using radioimmunoprecipitation assay reagent
(Beyotime Institute of Biotechnology, Haimen, China). Proteins were
measured using a BCA kit (Beyotime Institute of Biotechnology). The
protein levels of Col X and Runx2 were measured by western
blotting. Equal amounts (20 µg) of total protein were separated by
10% SDS-PAGE, and were then transferred to an Immobilon
polyvinylidene difluoride membrane (EMD Millipore, Billerica, MA,
USA). Following blocking in 5% skimmed milk for 30 min at room
temperature, the membranes were incubated with primary antibodies
against Col X (1:200; cat. no. ab58632; Abcam, Cambridge, UK),
Runx2 (1:1,000; cat. no. 12556; Cell Signaling Technology, Inc.,
Danvers, MA, USA) and GAPDH (1:500; Boster Biological Technology,
Pleasanton, CA, USA) for 40 min at 37°C and then overnight at 4°C.
After washing, the secondary antibody [horseradish peroxidase
(HRP)-conjugated anti-rabbit antibody (1:10,000; cat. no. 120745;
Jackson ImmunoResearch Laboratories Inc, West Grove, PA, USA)] was
incubated for 30 min at 37°C. Following washing, the membrane was
reacted with the Immobilon Chemiluminescent HRP substrate (EMD
Millipore) in accordance with the manufacturer's protocol. Images
were captured and analyzed by means of the SuperSignal Ultra
Western blot chemiluminescence system (Gene Co., Ltd., Hong Kong,
China).
MTT assay to determine suitable SIN-1
concentration and incubation time
ATDC5 cells were seeded in a 96-well plate
(1×10³ cells/well) and the ITS differentiation medium
was used from the next day-day 21. The medium was changed every
other day. Cells were incubated with 0, 1, 5 and 10 mM SIN-1 for 4
h, or 0, 1, 2, 3, 4 or 5 mM SIN-1 for 24 h at 37°C, and then
further incubated for another 4 h in medium containing 0.5 mg/ml
MTT (MP Biomedicals, LLC, Santa Ana, CA, USA) at 37°C. The cell
culture medium was discarded and the intracellular purple formazan
in each well was dissolved in 150 µl dimethyl sulfoxide. The purple
crystals were quantified by measuring the absorbance at a
wavelength of 490 nm in a microplate reader (3550; Bio-Rad
Laboratories, Inc., Hercules, CA, USA).
RNA preparation for PCR array
analysis
Total RNA from hypertrophic chondrocytes stimulated
by 0 or 3 mM SIN-1 for 24 h was isolated using the RNeasy Plus Mini
Kit (Qiagen GmbH). The concentration and purity of total RNA were
measured, and RNA quality and integrity were evaluated by 2%
agarose gel electrophoresis. cDNA was synthesized from 1 µg total
RNA from each sample with the RT2 First Strand Kit (cat.
no. 330401; Qiagen GmbH). Eliminating genomic DNA contamination
with the RT2 Profiler PCR Array was essential for
obtaining optimal real-time gene expression profiling results. The
mixed sample was incubated at 42°C for 15 min and 95°C for 5 min. A
total of 91 µl RNase-free water was added to each 20 µl cDNA
synthesis reaction. The samples were mixed by pipetting up and down
several times. The mixtures were kept on ice until the PCR
procedure or stored at−20°C until processing.
Liquid chip analysis using
RT2 Profiler PCR Arrayss®
The 102 µl cDNA synthesis reaction was diluted with
1,248 µl RNase-free water and then added to 1,350 µl RT2
qPCR SYBR Green Mastermix (cat. no. 330522; Qiagen GmbH). A total
of 25 µl PCR master mix was dispensed into each well of the 96-well
Mouse Osteogenesis RT2 Profiler PCR Array (cat. no.
PAMM-026Z; Qiagen GmbH). qPCR was performed on a Thermal Cycler
Dice Real Time System (TP-800; Takara Bio, Inc., Otsu, Japan) via
SYBR Green detection, and the following thermal cycling program: 1
cycle at 95°C for 10 min; 40 cycles of 95°C for 15 sec, 55°C for 40
sec, and 72°C for 30 sec; and 1 cycle at 95°C for 15 sec, 60°C for
30 sec and 95°C for 15 sec. All data from the real-time instrument
were interpreted via the PCR Array Data web tool (https://www.qiagen.com/cn/shop/genes-and-pathways/data-analysis-center-overview-page/?akamai-feo=off;
SABiosciences; Qiagen GmbH).
Statistical analysis of PCR array
data
Each PCR array included 5 housekeeping genes (Actb,
B2m, GAPDH, Gusb, and Hsp90ab1) for normalization of the sample
data. According to the manusfacturer's instructions of the
aforementioned Mouse Osteogenesis RT2 Profiler PCR
Array, if the Cq value of Mouse Genomic DNA Contamination (MGDA)
control was >30, then no genomic DNA contamination was
detectable. Although the PCR array was performed only once, the
fold changes and P-values were calculated by means of the PCR Array
Data web tool.
RT-qPCR validation
RT-qPCR was conducted to validate PCR array data. A
total of 8 genes were selected, including 7 downregulated genes
(Smad1-4, ColX, Vcam1 and MMP10) and 1 upregulated gene (Col2a1).
The samples were prepared in the same way as described above. Total
RNA was extracted using the RNeasy Plus Mini Kit (Qiagen GmbH). A
total of 1 µg total RNA from each sample was reverse-transcribed
with the Revert Aid™ First cDNA Synthesis kit (cat. no. K1622;
Thermo Fisher Scientific, Inc.), and the resulting cDNA was diluted
5 times. GAPDH expression served as an endogenous control to
normalize all samples for potential variations in mRNA content. The
synthetic oligonucleotide primers for qPCR are presented in
Table I. Single-stranded cDNA was
amplified with the QuantiFast SYBR Green PCR Kit (cat. no. 204054;
Qiagen GmbH). The thermal cycling program was the same as that in
the PCR array experiment. The relative mRNA expression levels of
the target genes were calculated using relative quantification
(2−ΔΔCq) (15).
Analysis of protein-protein
interactions (PPIs), gene ontology (GO) functions and Kyoto
Encyclopedia of Genes and Genomes (KEGG) pathway enrichment
In the present study, PPIs, GO functions and KEGG
pathway enrichment of 40 differentially expressed genes were
analyzed in the STRING 10.05 software (https://string-db.org/) to understand their biological
processes, molecular function, cellular components, KEGG pathways
as well as their interactions at the protein level. The parameters
of the reliability and the additional nodes could be adjusted
according to the concrete analysis results. The PPI networks were
constructed. A gene-pathway network analysis was conducted using
Cytoscape 3.4.0 (http://www.cytoscape.org/).
Statistical analysis
All data were expressed as the mean ± standard
deviation and analyzed using SPSS version 16.0 (SPSS, Inc.,
Chicago, IL, USA). Differences between two sampled were analyzed
using Student's t-test. Data with more than two comparisons were
analyzed using one-way analysis of variance followed by post hoc
Fisher's least significant difference test or Bonferroni's
multiple-comparison test, as required. P<0.05 was considered to
indicate a statistically significant difference.
Results
Establishment of the hypertrophic
chondrocyte model
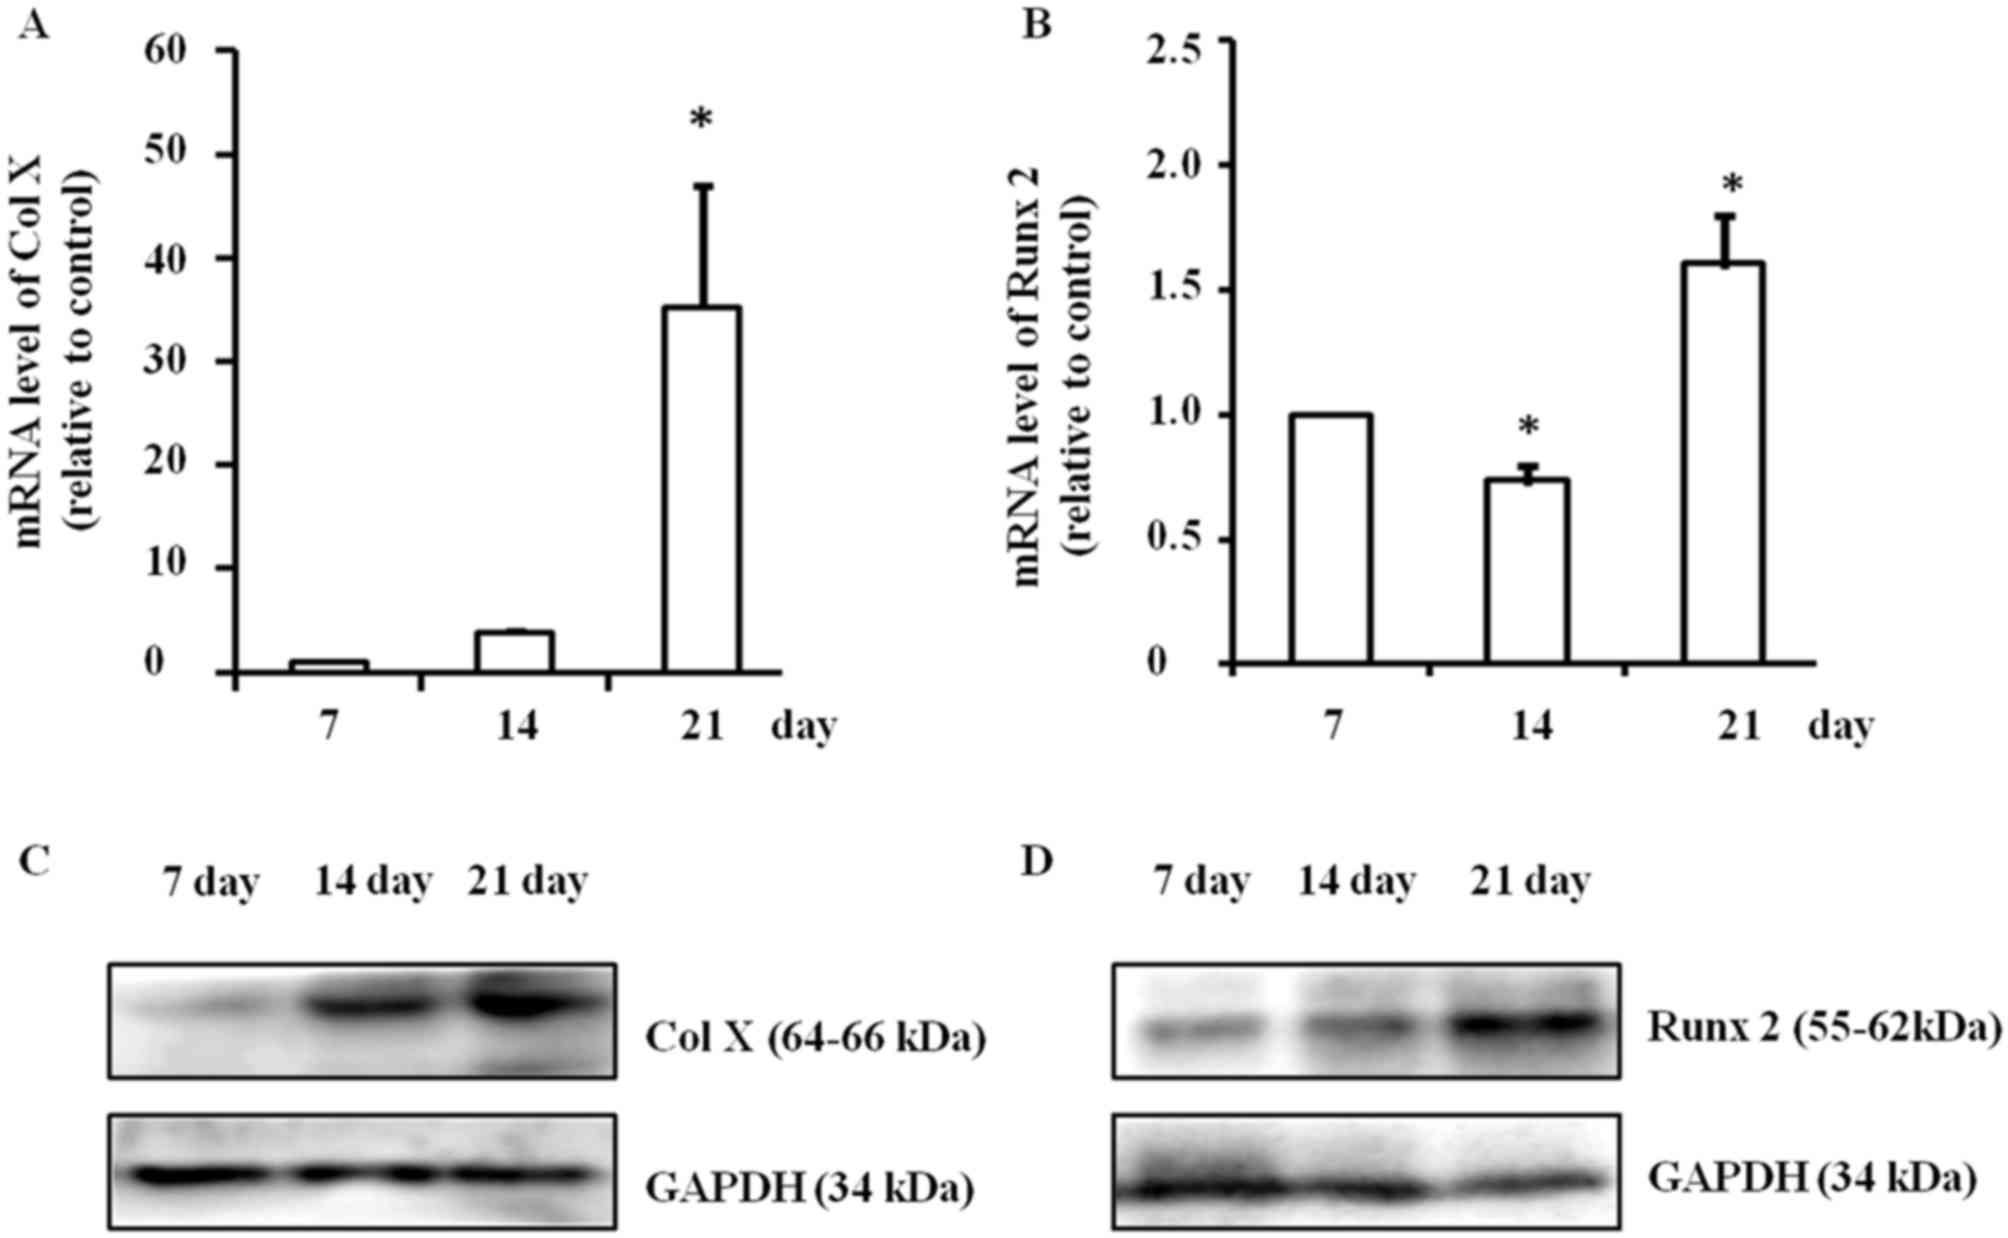
During the induction of hypertrophy, mRNA expression
of Col X was significantly upregulated (P<0.05) and it peaked on
day 21 (P<0.05; Fig. 1A). The
mRNA expression of Runx2 was also significantly changed
(P<0.05); it increased significantly on day 21 (P<0.05), but
decreased on day 14 (P<0.05) compared with day 7 (P<0.05;
Fig. 1B). Concurrently, protein
expression levels of Col X and Runx2 also markedly increased on day
21, according to western blotting. Representative data from three
independent experiments are presented (Fig. 1C and D). Thus, culturing ATDC5 cells
for 21 days to set up the hypertrophic chondrocyte model was
carried out for all subsequent experiments.
The effect of SIN-1 on vitality of
hypertrophic chondrocytes
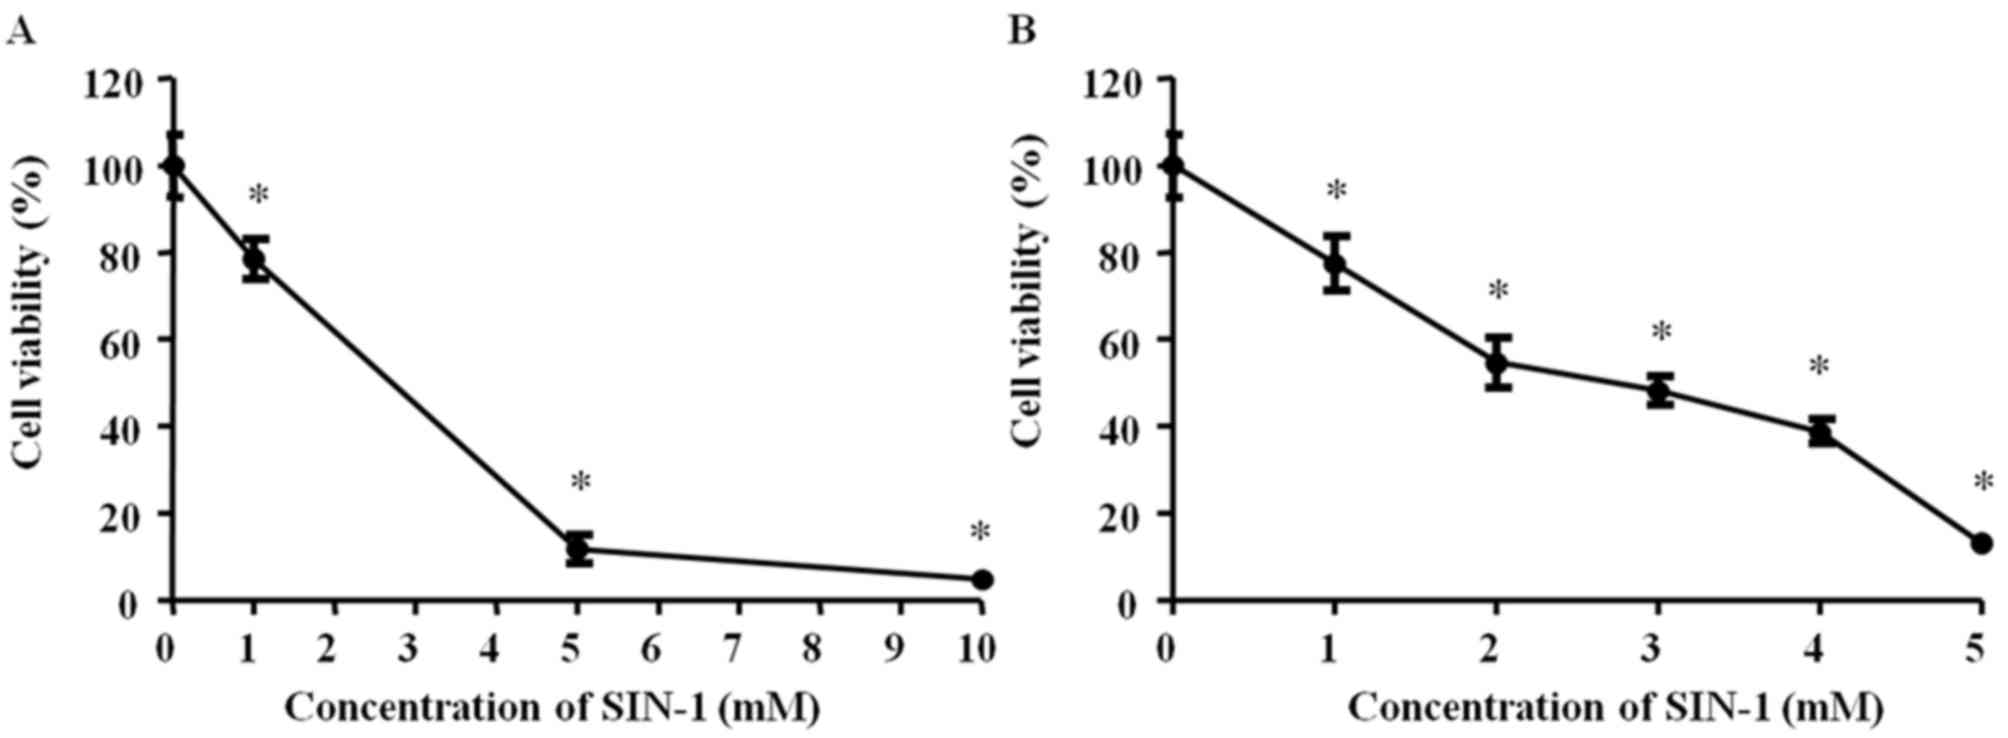
Subsequently, 0, 1, 5 or 10 mM SIN-1 was added to
hypertrophic chondrocytes for 4 h incubation and cellular viability
was measured via the MTT assay. All SIN-1 concentrations
significantly decreased the cell viability (P<0.05). The results
demonstrated a high degree of toxicity with 10 mM SIN-1 P<0.05;
Fig. 2A). Subsequently, 0, 1, 2, 3,
4 or 5 mM SIN-1 was added to hypertrophic chondrocytes for 24 h
incubation and cell viability was measured via the MTT assay. All
SIN-1 concentrations significantly decreased the cell viability
(P<0.05). There was a significant negative association between
cellular viability and SIN-1 concentration, and 3 mM SIN-1
decreased viability by 50% (P<0.05; Fig. 2B). Therefore, 3 mM SIN-1 treatment
was selected for 24 h as the standard procedure for the subsequent
experiments.
Differentially expressed genes in the
chip array
In the PCR array, a total of 84 genes associated
with osteogenesis were compared between the control and 3-mM SIN-1
group in hypertrophic chondrocytes. A scatter plot of 84 genes
indicated that 40 genes were differentially expressed by 3-fold or
greater (Fig. 3). In total, 34 genes
were downregulated (Table II),
which were mostly associated with collagen, gene expression
regulation (transcription factors), skeletal development, bone
mineral metabolism and cell adhesion. A total of 6 genes were
upregulated (Table III), which
were mostly associated with collagen, skeletal development and cell
adhesion molecules.
| Table II.Significantly downregulated genes in
hypertrophic chondrocytes treated with 3-morpholinosydnonimine. |
Table II.
Significantly downregulated genes in
hypertrophic chondrocytes treated with 3-morpholinosydnonimine.
| No. | ID | Symbol | Description | Fold
regulation |
|---|
| 1 | NM_013465 | Ahsg |
α-2-HS-glycoprotein | −6.19 |
| 2 | NM_007553 | BMP2 | Bone morphogenetic
protein 2 | −6.11 |
| 3 | NM_173404 | BMP3 | Bone morphogenetic
protein 3 | −8.52 |
| 4 | NM_009758 | BMPR1a | Bone morphogenetic
protein receptor, type 1A | −4.17 |
| 5 | NM_007560 | BMPR1b | Bone morphogenetic
protein receptor, type 1B | −7.16 |
| 6 | NM_007643 | Cd36 | Cluster of
differentiation 36 antigen | −7.26 |
| 7 | NM_009866 | Cdh11 | Cadherin 11 | −3.05 |
| 8 | NM_009893 | Chrd | Chordin | −5.28 |
| 9 | NM_009925 | Col10a1 | Collagen, type X, α
1 | −4.03 |
| 10 | NM_016685 | Comp | Cartilage
oligomeric matrix protein | −5.17 |
| 11 | NM_007802 | Ctsk | Cathepsin K | −3.14 |
| 12 | NM_010197 | Fgf1 | Fibroblast growth
factor 1 | −7.89 |
| 13 | NM_010206 | Fgfr1 | Fibroblast growth
factor receptor 1 | −11.16 |
| 14 | NM_010207 | Fgfr2 | Fibroblast growth
factor receptor 2 | −3.34 |
| 15 | NM_010228 | Flt1 | FMS-like tyrosine
kinase 1 | −7.41 |
| 16 | NM_010512 | Igf1 | Insulin-like growth
factor 1 | −3.48 |
| 17 | NM_008396 | Itga2 | Integrin α 2 | −4.76 |
| 18 | NM_008402 | Itgav | Integrin α V | −7.52 |
| 19 | NM_010578 | Itgb1 | Integrin β 1
(fibronectin receptor β) | −4.20 |
| 20 | NM_019471 | MMP10 | Matrix
metalloproteinase 10 | −45.25 |
| 21 | NM_008610 | MMP2 | Matrix
metalloproteinase 2 | −3.66 |
| 22 | NM_013599 | MMP9 | Matrix
metalloproteinase 9 | −4.66 |
| 23 | NM_008689 | Nfkb1 | Nuclear factor of κ
light polypeptide gene enhancer in B cells 1, p105 | −3.66 |
| 24 | NM_011077 | Phex | Phosphate
regulating gene with homologies to endopeptidases on the X
chromosome | −4.44 |
| 25 | NM_008539 | Smad1 | Mothers against
decapentaplegic homolog 1 (Drosophila) | −3.89 |
| 26 | NM_010754 | Smad2 | Mothers against
decapentaplegic homolog 2 (Drosophila) | −3.10 |
| 27 | NM_016769 | Smad3 | Mothers against
decapentaplegic homolog 3 (Drosophila) | −4.63 |
| 28 | NM_008540 | Smad4 | Mothers against
decapentaplegic homolog 4 (Drosophila) | −4.17 |
| 29 | NM_009367 | Tgfb2 | Transforming growth
factor, β 2 | −5.31 |
| 30 | NM_009370 | Tgfbr1 | Transforming growth
factor, β receptor I | −16.00 |
| 31 | NM_009371 | Tgfbr2 | Transforming growth
factor, β receptor II | −5.70 |
| 32 | NM_013693 | Tnf | Tumor necrosis
factor | −9.19 |
| 33 | NM_011613 | Tnfsf11 | Tumor necrosis
factor (ligand) superfamily, member 11 | −4.14 |
| 34 | NM_011693 | Vcam1 | Vascular cell
adhesion molecule 1 | −6.68 |
| Table III.Significantly upregulated genes in
hypertrophic chondrocytes treated with 3-morpholinosydnonimine. |
Table III.
Significantly upregulated genes in
hypertrophic chondrocytes treated with 3-morpholinosydnonimine.
| No. | ID | Symbol | Description | Fold
regulation |
|---|
| 1 | NM_007542 | Bgn | Biglycan | 5.82 |
| 2 | NM_007555 | Bmp5 | Bone morphogenetic
protein 5 | 7.26 |
| 3 | NM_007743 | Col1a2 | Collagen, type I, α
2 | 4.08 |
| 4 | NM_031163 | Col2a1 | Collagen, type II,
α 1 | 7.26 |
| 5 | NM_010544 | Ihh | Indian
hedgehog | 3.32 |
| 6 | NM_024449 | Sost | Sclerostin | 4.26 |
mRNA levels of 9 associated genes in
experimental hypertrophic chondrocytes
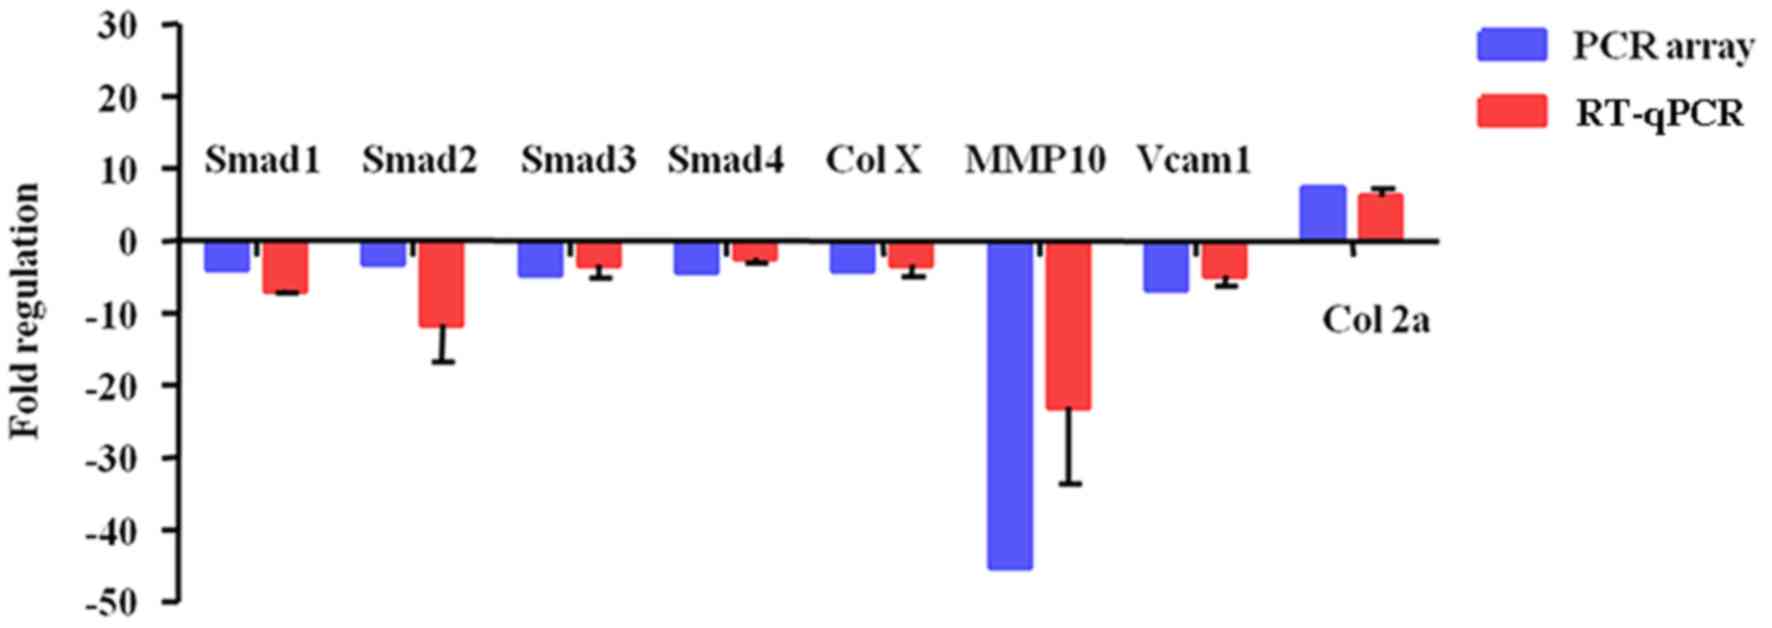
To further confirm these PCR array data, 8
differentially expressed genes (Smad1-4, Col X, MMP10, Vcam1, and
Col2a1) were validated in hypertrophic chondrocytes treated with 0
or 3 mM SIN-1. The RT-qPCR results demonstrated that 3 mM SIN-1
induced Smad1-4, Col X, MMP10, and Vcam1 downregulation and Col2a1
upregulation (Fig. 4). These results
are consistent with and support the reliability of the PCR array
findings.
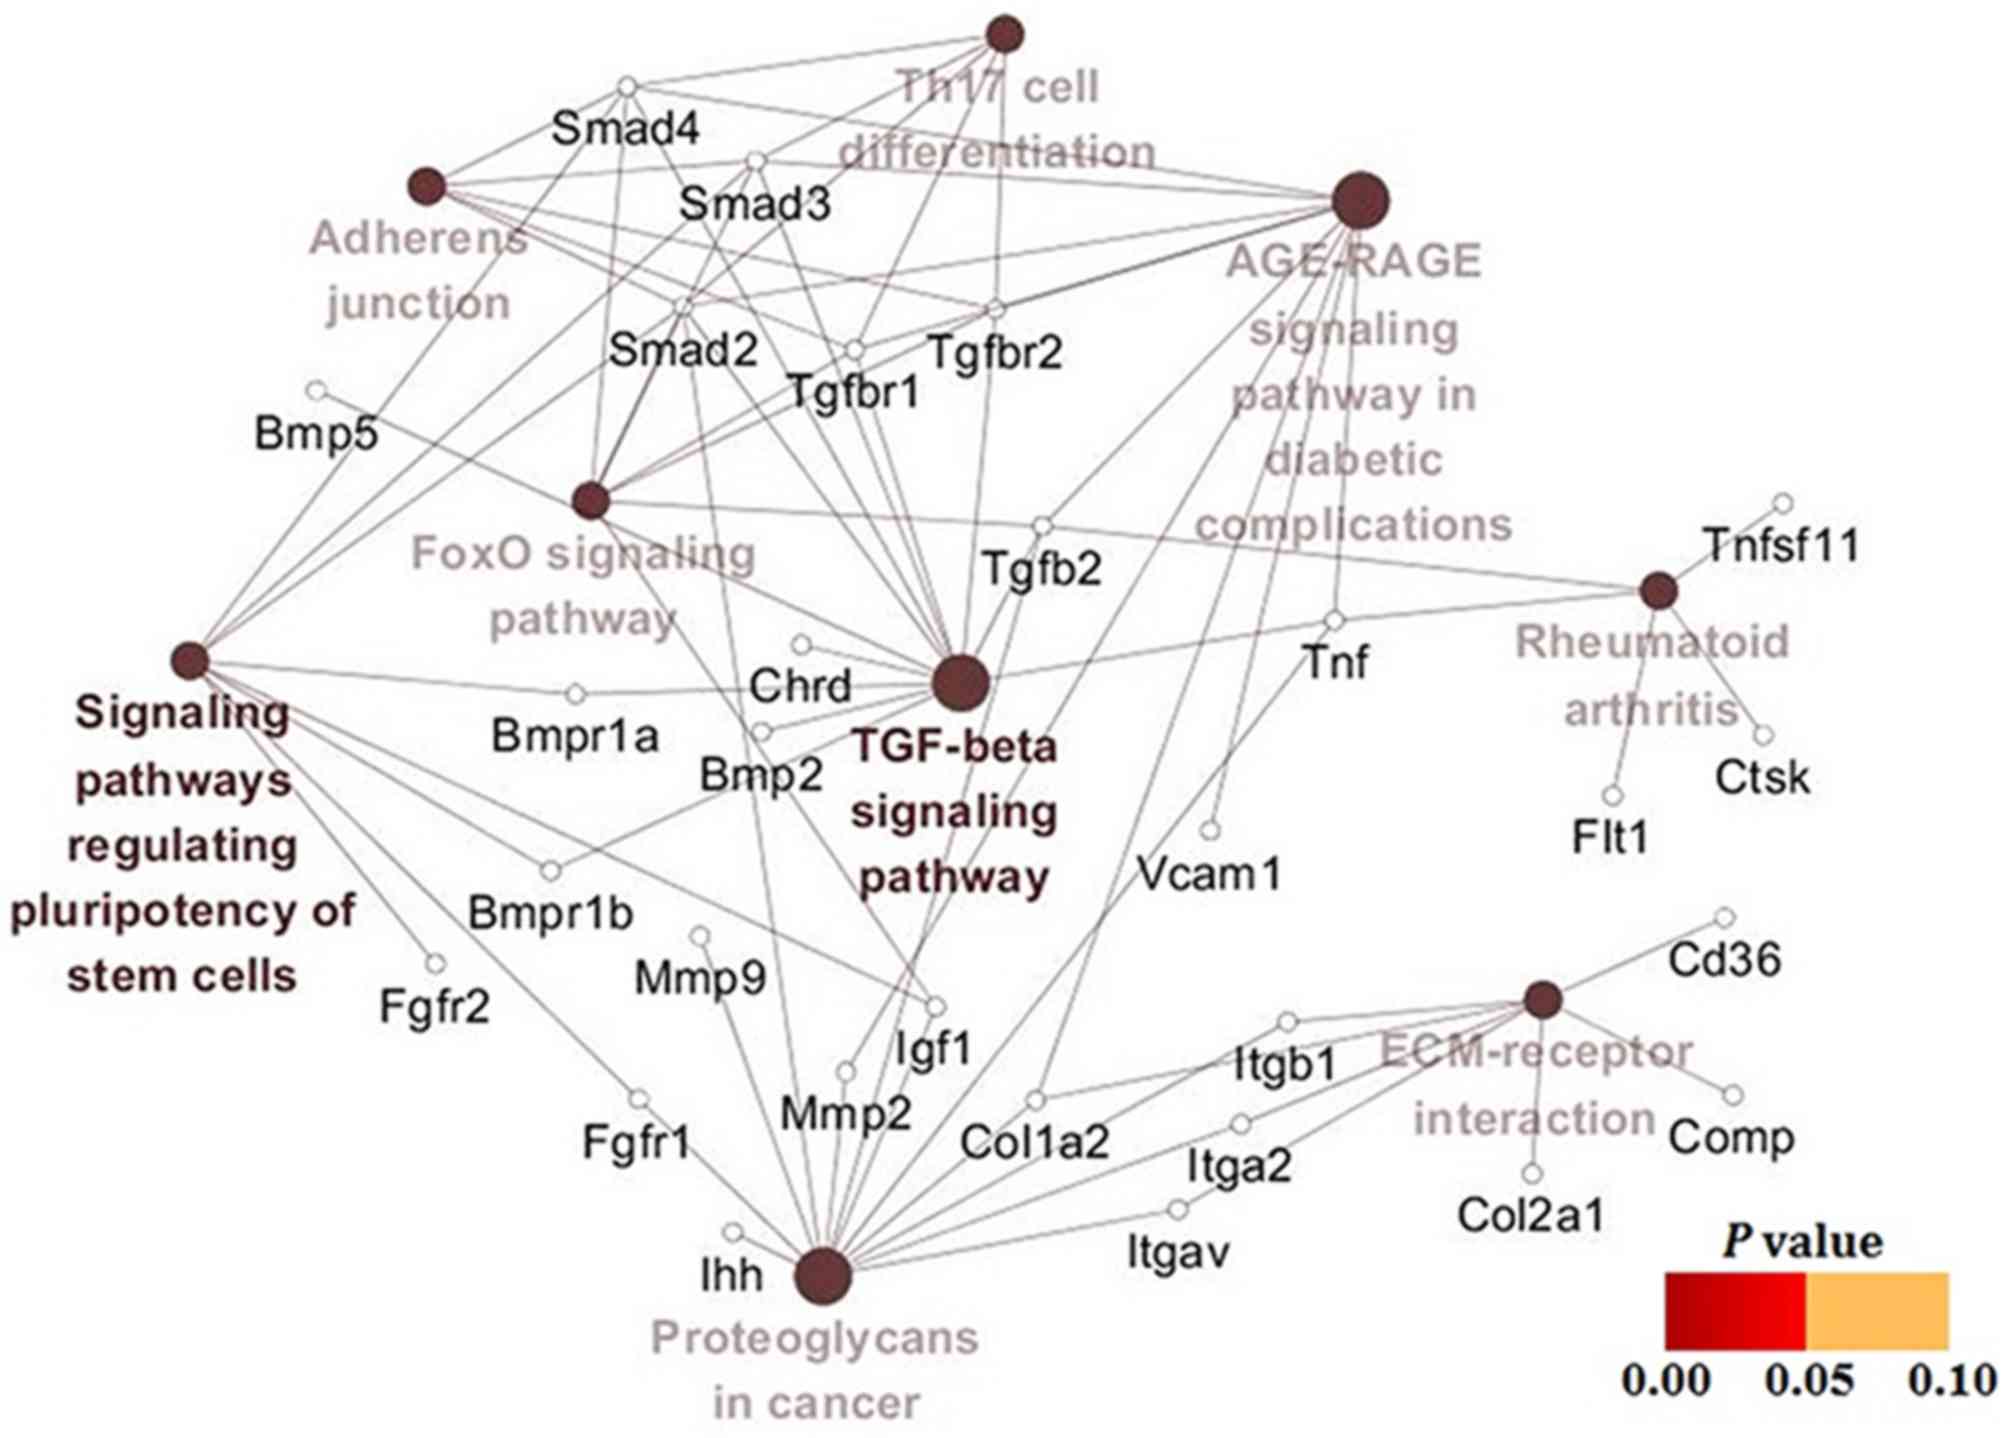
Transforming growth factor (TGF)-β
signaling cascades are the key pathways in hypertrophic
chondrocytes treated with SIN-1
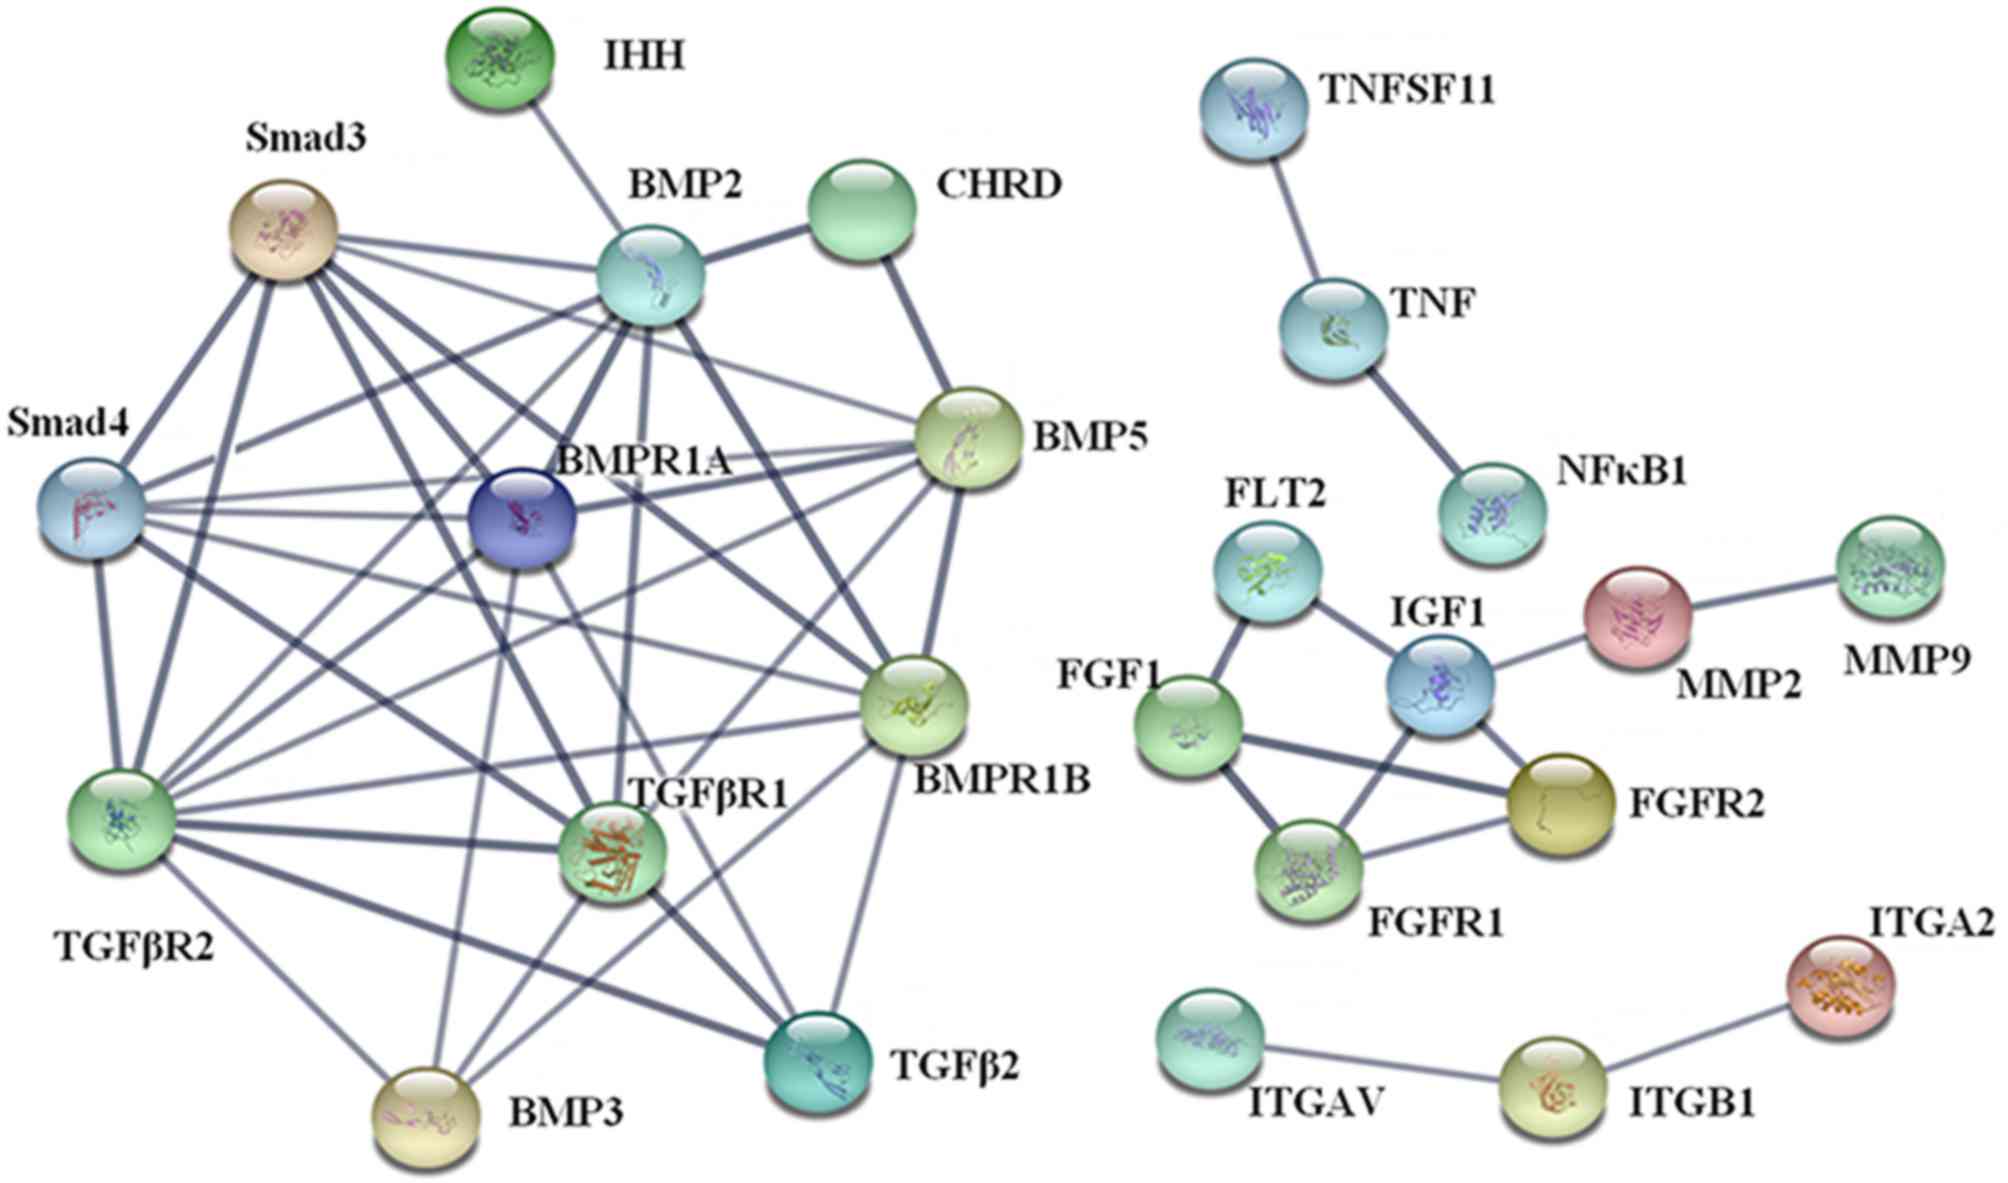
The results of PPI analysis demonstrated that there
were four clusters in the PPI network (Fig. 5). The most important cluster included
TGF-βs [TGF-β2 and TGF-β receptors (TGF-βr1 and−2)], bone
morphogenic proteins (BMPs; BMP2,−3, and−5, and BMP receptors 1A
and 1B) and mothers against decapentaplegic homologs (Smads; Smad3
and−4), which were beneficial for the elucidation of biological
systems participating in the oxidative stress in hypertrophic
chondrocytes. KEGG pathway enrichment results (Table IV) also demonstrated that TGF-β
signaling cascades were the key pathways in hypertrophic
chondrocytes treated with SIN-1, indicating that TGF-β/Smad
signaling and BMP/Smad signaling were potential pathways associated
with the above process. Once again, the gene-pathway network
analysis yielded results similar to the above findings (Fig. 6).
| Table IV.Results on top five GO functions and
KEGG pathway enrichment analysis of differentially expressed
genes. |
Table IV.
Results on top five GO functions and
KEGG pathway enrichment analysis of differentially expressed
genes.
| Function and
pathway | ID | Description | Count in gene
set | False discovery
rate |
|---|
| Biological
process | GO: 0001501 | Skeletal system
development | 20 |
2.03×10⁻²⁰ |
| (GO) | GO: 0009888 | Tissue
development | 27 |
3.18×10⁻¹⁹ |
|
| GO: 0001503 | Ossification | 16 |
2.27×10⁻¹⁸ |
|
| GO: 0071495 | Cellular response
to endogenous stimulus | 21 |
4.40×10⁻¹⁸ |
|
| GO: 0071363 | Cellular response
to growth factor stimulus | 17 |
5.39×10⁻¹⁸ |
| Molecular
function | GO: 0046332 | Mothers against
decapentaplegic homolog binding | 10 |
5.84×10⁻¹⁴ |
| (GO) | GO: 0005515 | Protein
binding | 32 |
4.67×10⁻¹³ |
|
| GO: 0005160 | Transforming growth
factor β receptor binding | 8 |
1.02×10⁻¹¹ |
|
| GO: 0005126 | Cytokine receptor
binding | 10 |
1.09×10⁻⁹ |
|
| GO: 0019838 | Growth factor
binding | 8 |
1.58×10⁻⁹ |
| Cellular
component | GO: 0005615 | Extracellular
space | 20 |
2.99×10⁻¹³ |
| (GO) | GO: 0044421 | Extracellular
region part | 26 |
2.01×10⁻¹⁰ |
|
| GO: 0005576 | Extracellular
region | 27 |
3.32×10⁻¹⁰ |
|
| GO: 0031012 | Extracellular
matrix | 12 |
3.32×10⁻¹⁰ |
|
| GO: 0005578 | Proteinaceous
extracellular matrix | 11 |
1.35×10⁻⁹ |
| KEGG pathways | 4350 | Transforming growth
factor-β signaling pathway | 13 |
1.50×10⁻²⁰ |
|
| 5200 | Pathways in
cancer | 17 |
2.04×10⁻¹⁹ |
|
| 4390 | Hippo signaling
pathway | 12 |
1.87×10⁻¹⁵ |
|
| 5205 | Proteoglycans in
cancer | 12 |
1.53×10⁻¹³ |
|
| 4151 | Phosphoinositide
3-kinase-protein kinase B signaling pathway | 12 |
2.49×10⁻¹¹ |
Discussion
The oxidative stress in hypertrophic chondrocytes is
regulated by multiple intricate signal transduction pathways. The
crosstalk among these signals has a fine balance in normal
hypertrophic chondrocytes (16).
Free radicals, called ‘the second messengers,’ may adjust the
expression of relevant target proteins through nuclear
transcription factors and regulate chondrocyte growth,
differentiation, and maturation (17,18). In
the normal physiological state, there is a dynamic balance between
the free-radical-generating system and the scavenging system
(19). Once excessive free radicals
are produced or ingested, the original balanced state is disrupted
and then causes cell damage (20).
On the basis of previous research findings that implicated
oxidative damage in the hypertrophy of chondrocytes in OA and KBD
(14,21), the present study was designed to
profile altered gene expression of the intricate signaling network
associated with oxidative stress to mimic cellular responses within
an articular joint affected by OA or KBD.
In the present study, the TGF-β (TGF-β1, −2
and -3, and TGF-βr1,−2 and -3) and Smad
(Smad1-5) families of genes. A total of 7 genes were
downregulated in hypertrophic chondrocytes following treatment with
SIN-1, including TGF-β2, TGF-βr1, TGF-βr2, Smad1, Smad2,
Smad3, and Smad4. Smads are the downregulated gene
targets of the TGF-β family of genes. TGF-β transduces signals from
the cell membrane to the nucleus via its receptors and Smad
proteins (22). In a European
patient cohort, a single nucleotide polymorphism in the intron
region of the Smad3 gene has been demonstrated to be
associated with hip and knee OA (23). TGF-β may stimulate chondrocyte matrix
production and has been demonstrated to promote cartilage repair to
alleviate OA (24). TGF-β/Smad3
signals could repress chondrocyte hypertrophic differentiation, and
are essential for maintaining articular cartilage (22). TGF-β3 and phosphorylated Smad2 levels
were significantly reduced in two murine models of osteoarthritis,
accompanied by a loss of proteoglycans (25). In analyses of PPIs, KEGG pathway
enrichment and gene-pathway network in the present study, it was
demonstrated that TGF-β signaling cascades were the key pathways in
hypertrophic chondrocytes treated with SIN-1. In accordance with
previous results, the present study indicates that these
differentially expressed TGF-β- and Smad-family genes may provide
novel approaches for drug targeting in OA and other
osteoarthroses.
BMPs are members of the pleiotropic TGF-β
superfamily and are key regulators of skeletal development,
osteogenesis and bone healing (26,27). BMP
signals are mediated by type I and type II receptors (BMPR1a,
BMPR1b and BMPR2) (26). BMP signal
binding to BMPRs is translocated to the nucleus via Smad signaling
(mainly via Smad1,−5 and−8) (28).
BMP2 significantly promotes bone formation and stimulates
osteoblast differentiation of C2C12 cells in conjunction with
specific levels of static stretching force (29). In addition, it has been confirmed
that BMP2 stimulates chondrocyte hypertrophy during chondrogenesis
of progenitor ATDC5 cells (30), and
in the present study it was also demonstrated that BMP2 was
downregulated in hypertrophic chondrocytes treated with SIN-1.
Therefore, BMP2 is important for the progression of hypertrophy.
BMP3 accelerates the differentiation of human mesenchymal stem
cells (31), and is associated with
rabbit articular cartilage repair (32). The BMP5 gene contains an
‘injury response’ control region, which is activated by multiple
types of injury in adult animals (33). In the present study, it was
demonstrated that BMP2, BMP3, BMPR1a and BMPR1b were downregulated
in hypertrophic chondrocytes treated with SIN-1 and BMP5 was
upregulated. Combined with the above discussion on Smads, these
data suggest that the BMP/SMAD pathway may also take part in an
oxidative stress reaction. The increased expression of BMP5 was
probably the result of the ‘injury response’ to oxidative
stress.
Matrix metalloproteinases (MMPs) serve important
roles in ECM remodeling and degradation. MMPs and their inhibitors
(TIMPs) are believed to be associated with the mechanisms
underlying KBD (34). In the present
study, it was demonstrated that the mRNA expression levels of
MMP2, -9 and -10 were downregulated in
hypertrophic chondrocytes following treatment with SIN-1. MMP2 and
9 are known to participate in significant degradation of collagen
in the muscle of fish (35). In the
present study, the mRNA expression levels of Col I and
Col II were both increased; thus it was speculated that this
increase was caused by downregulation of MMPs. Nevertheless, the
mRNA expression level of Col X, which is mainly expressed in
hypertrophic chondrocytes, was decreased in the present study. This
phenomenon may be directly caused by oxidative stress induced by
SIN-1. Combined with the literature, the present data suggest that
the alteration of Mmp2,−9, and -10 genes led to a
change in ECM, which may further affect the cell
differentiation.
Integrins are the major family of ECM receptors,
which have a vital role in cell-ECM interactions (36). Integrins are transmembrane
heterodimeric glycoproteins consisting of α and β subunits,
combining functions of cell adhesion and bidirectional signal
transduction (5). In the present
study, levels of α2, αv, and β1 integrins were
decreased in hypertrophic chondrocytes following treatment with
SIN-1. It has been previously reported that the expression of α2
and α5 integrins increased at later stages of OA in rats, and these
levels were associated with the severity of OA (37). Additionally α1, α5β1, and αvβ5
integrins have been demonstrated to mediate human chondrocyte
adhesion to cartilage (38).
Increased expression of Indian hedgehog (Ihh) and
sclerostin was also observed, as was decreased expression of
Col X. Ihh is expressed in prehypertrophic
chondrocytes on growth plates (39),
whereas Col X was mainly expressed in hypertrophic chondrocytes.
Sclerostin is a novel BMP antagonist, which competes with type I
and type II BMP receptors (40).
Thus, SIN-1 may first increase sclerostin and further decrease BMP
signaling.
In conclusion, the present study indicated that
oxidative stress produced by NO donor induced death of hypertrophic
chondrocytes is probably mediated by TGF-β/Smad or BMP/Smad
pathways, and dysfunctional pathways may then induce abnormal
expression of MMPs and collagens. The present results may provide
several novel clues to the molecular mechanisms underlying OA and
KBD, which may help to find novel diagnostic and therapeutic
targets for these debilitating diseases.
There were, however, certain limitations in the
present study: i) KBD does not immediately lead to death, and
harvesting the cartilage tissue of patients with KBD is traumatic
for patients, so it was very difficult to obtain fresh human
cartilage; and ii) there are no functional verification experiments
to be conducted. Therefore, further research is required.
Acknowledgements
The authors would like to thank Professor Rongqiang
zhang from Shaanxi University of Chinese Medicine (Xi'an, China)
for guidance in writing the manuscript.
Funding
The present study was supported by the National
Natural Science Foundation of China (grant nos. 81273006 and
81573102) and the Shaanxi Natural Science Research Project (grant
no. 2017JM8122).
Availability of data and materials
The datasets used and/or analyzed during the current
study are available from the corresponding author on reasonable
request.
Authors' contributions
JC and YH conceived and designed experiments; YH and
JC performed the experiments; YH, WY, MZ, YZ, DZ, ZJ, TM, JS and MS
analyzed the data; TM, JS and MS also contributed
reagents/materials/analysis tools; YH wrote the manuscript; and JC
revised it.
Ethics approval and consent to
participate
Not applicable.
Consent for publication
Not applicable.
Competing interests
The authors declare that they have no competing
interests.
References
|
1
|
Tsolis KC, Bei ES, Papathanasiou I,
Kostopoulou F, Gkretsi V, Kalantzaki K, Malizos K, Zervakis M,
Tsezou A and Economou A: Comparative proteomic analysis of
hypertrophic chondrocytes in osteoarthritis. Clin Proteomics.
12:122015. View Article : Google Scholar : PubMed/NCBI
|
|
2
|
Moreno-Reyes R, Suetens C, Mathieu F,
Begaux F, Zhu D, Rivera MT, Boelaert M, Nève J, Perlmutter N and
Vanderpas J: Kashin-Beck osteoarthropathy in rural Tibet in
relation to selenium and iodine status. N Engl J Med.
339:1112–1120. 1998. View Article : Google Scholar : PubMed/NCBI
|
|
3
|
Zhang F, Guo X, Duan C, Wu S, Yu H and
Lammi M: Identification of differentially expressed genes and
pathways between primary osteoarthritis and endemic osteoarthritis
(Kashin-Beck disease). Scand J Rheumatol. 42:71–79. 2013.
View Article : Google Scholar : PubMed/NCBI
|
|
4
|
Gao ZQ, Guo X, Duan C, Ma W, Xu P, Wang W
and Chen JC: Altered aggrecan synthesis and collagen expression
profiles in chondrocytes from patients with Kashin-Beck disease and
osteoarthritis. J Int Med Res. 40:1325–1334. 2012. View Article : Google Scholar : PubMed/NCBI
|
|
5
|
Kim SJ, Kim EJ, Kim YH, Hahn SB and Lee
JW: The modulation of integrin expression by the extracellular
matrix in articular chondrocytes. Yonsei Med J. 44:493–501. 2003.
View Article : Google Scholar : PubMed/NCBI
|
|
6
|
Peterson JT: The importance of estimating
the therapeutic index in the development of matrix
metalloproteinase inhibitors. Cardiovasc Res. 69:677–687. 2006.
View Article : Google Scholar : PubMed/NCBI
|
|
7
|
Schulze-Tanzil G, de Souza P, Merker HJ
and Shakibaei M: Co-localization of integrins and matrix
metalloproteinases in the extracellular matrix of chondrocyte
cultures. Histol Histopathol. 16:1081–1089. 2001.PubMed/NCBI
|
|
8
|
Pal S, Ganguly KK, Moulik S and Chatterjee
A: Modulation of MMPs by cell surface integrin receptor α5β1.
Anticancer Agents Med Chem Sep. 12:726–732. 2012. View Article : Google Scholar
|
|
9
|
van der Kraan PM and van den Berg WB:
Chondrocyte hypertrophy and osteoarthritis: Role in initiation and
progression of cartilage degeneration? Osteoarthritis Cartilage.
20:223–232. 2012. View Article : Google Scholar : PubMed/NCBI
|
|
10
|
Chen AF, Davies CM, De Lin M and Fermor B:
Oxidative DNA damage in osteoarthritic porcine articular cartilage.
J Cell Physiol. 217:828–833. 2008. View Article : Google Scholar : PubMed/NCBI
|
|
11
|
Wang W, Wei S, Luo M, Yu B, Cao J, Yang Z,
Wang Z, Goldring MB and Chen J: Oxidative stress and status of
antioxidant enzymes in children with Kashine-Beck disease.
Osteoarthritis Cartilage. 21:1781–1789. 2013. View Article : Google Scholar : PubMed/NCBI
|
|
12
|
Konishi K, Watanabe N and Arai T: SIN-1
cytotoxicity to PC12 cells is mediated by thiol-sensitive
short-lived substances generated through SIN-1 decomposition in
culture medium. Nitric Oxide. 20:270–278. 2009. View Article : Google Scholar : PubMed/NCBI
|
|
13
|
Tian J, Yan J, Wang W, Zhong N, Tian L,
Sun J, Min Z, Ma J and Lu S: T-2 toxin enhances catabolic activity
of hypertrophic chondrocytes through ROS-NF-jB-HIF-2α pathway.
Toxicol In Vitro. 26:1106–1113. 2012. View Article : Google Scholar : PubMed/NCBI
|
|
14
|
Hunter DJ and Felson DT: Osteoarthritis.
BMJ. 332:639–642. 2006. View Article : Google Scholar : PubMed/NCBI
|
|
15
|
Livak KJ and Schmittgen TD: Analysis of
relative gene expression data using real-time quantitative PCR and
the 2(-Delta Delta C(T)) method. Methods. 25:402–408. 2001.
View Article : Google Scholar : PubMed/NCBI
|
|
16
|
Ueno T, Yamada M, Sugita Y and Ogawa T:
N-Acetyl cysteine protects TMJ chondrocytes from oxidative stress.
J Dent Res. 90:353–359. 2011. View Article : Google Scholar : PubMed/NCBI
|
|
17
|
Hinoi E, Takarada T, Fujimori S, Wang L,
Iemata M, Uno K and Yoneda Y: Nuclear factor E2 p45-related factor
2 negatively regulates chondrogenesis. Bone. 40:337–344. 2007.
View Article : Google Scholar : PubMed/NCBI
|
|
18
|
Morita K, Miyamoto T, Fujita N, Kubota Y,
Ito K, Takubo K, Miyamoto K, Ninomiya K, Suzuki T, Iwasaki R, et
al: Reactive oxygen species induce chondrocyte hypertrophy in
endochondral ossification. J Exp Med. 204:1613–1623. 2007.
View Article : Google Scholar : PubMed/NCBI
|
|
19
|
Hoshida S, Kuzuya T, Yamashita N, Oe H,
Fuji H, Hori M, Tada M and Kamada T: Brief myocardial ischemia
affects free radical generating and scavenging systems in dogs.
Heart Vessels. 8:115–120. 1993. View Article : Google Scholar : PubMed/NCBI
|
|
20
|
Del Carlo M Jr and Loeser RF: Nitric
oxide-mediated chondrocyte cell death requires the generation of
additional reactive oxygen species. Arthritis Rheum. 46:394–403.
2002. View Article : Google Scholar : PubMed/NCBI
|
|
21
|
Guo X, Zuo H, Cao CX, Zhang Y, Geng D,
Zhang ZT, Zhang YG, von der Mark K and von der Mark H: Abnormal
expression of Col X, PTHrP, TGF-beta, bFGF, and VEGF in cartilage
with Kashin-Beck disease. J Bone Miner Metab. 24:319–328. 2006.
View Article : Google Scholar : PubMed/NCBI
|
|
22
|
Yang X, Chen L, Xu X, Li C, Huang C and
Deng CX: TGF-beta/Smad3 signals repress chondrocyte hypertrophic
differentiation and are required for maintaining articular
cartilage. J Cell Biol. 153:35–46. 2001. View Article : Google Scholar : PubMed/NCBI
|
|
23
|
Valdes AM, Spector TD, Tamm A, Kisand K,
Doherty SA, Dennison EM, Mangino M, Tamm A, Kerna I, Hart DJ, et
al: Genetic variation in the SMAD3 gene is associated with hip and
knee osteoarthritis. Arthritis Rheum. 62:2347–2352. 2010.
View Article : Google Scholar : PubMed/NCBI
|
|
24
|
Blom AB, van der Kraan PM and van den Berg
WB: Cytokine targeting in osteoarthritis. Curr Drug Targets.
8:283–292. 2007. View Article : Google Scholar : PubMed/NCBI
|
|
25
|
Davidson Blaney EN, Vitters EL, van der
Kraan PM and van den Berg WB: Expression of transforming growth
factor-beta (TGFbeta) and the TGFbeta signalling molecule SMAD-2P
in spontaneous and instability-induced osteoarthritis: Role in
cartilage degradation, chondrogenesis and osteophyte formation. Ann
Rheum Dis. 65:1414–1421. 2006. View Article : Google Scholar : PubMed/NCBI
|
|
26
|
Bragdon B, Moseychuk O, Saldanha S, King
D, Julian J and Nohe A: Bone morphogenetic proteins: A critical
review. Cell Signal. 23:609–620. 2011. View Article : Google Scholar : PubMed/NCBI
|
|
27
|
Long J, Li P, Du HM, Liu L, Zheng XH, Lin
YF, Wang H, Jing W, Tang W, Chen WH, et al: Effects of bone
morphogenetic protein 2 gene therapy on new bone formation during
mandibular distraction osteogenesis at rapid rate in rabbits. Oral
Surg Oral Med Oral Pathol Oral Radiol Endod. 112:50–57. 2011.
View Article : Google Scholar : PubMed/NCBI
|
|
28
|
Retting KN, Song B, Yoon BS and Lyons KM:
BMP canonical Smad signaling through Smad-1 and Smad-5 is required
for endochondral bone formation. Development. 136:1093–1104. 2009.
View Article : Google Scholar : PubMed/NCBI
|
|
29
|
Kim IS, Song YM, Cho TH, Kim JY, Weber FE
and Hwang SJ: Synergistic action of static stretching and BMP-2
stimulation in the osteoblast differentiation of C2C12 myoblasts. J
Biomech. 42:2721–2727. 2009. View Article : Google Scholar : PubMed/NCBI
|
|
30
|
Caron MM, Emans PJ, Cremers A, Surtel DA,
Coolsen MM, van Rhijn LW and Welting TJ: Hypertrophic
differentiation during chondrogenic differentiation of progenitor
cells is stimulated by BMP-2 but suppressed by BMP-7.
Osteoarthritis Cartilage. 21:604–613. 2013. View Article : Google Scholar : PubMed/NCBI
|
|
31
|
Zhou X, Tao Y, Liang C, Zhang Y, Li H and
Chen Q: BMP3 alone and together with TGF-β promote the
differentiation of human mesenchymal stem cells into a nucleus
pulposus-like phenotype. Int J Mol Sci. 16:20344–20359. 2015.
View Article : Google Scholar : PubMed/NCBI
|
|
32
|
Zhang Z, Yang W, Cao Y, Shi Y, Lei C, Du
B, Li X and Zhang Q: The functions of BMP3 in rabbit articular
cartilage repair. Int J Mol Sci. 16:25934–25946. 2015. View Article : Google Scholar : PubMed/NCBI
|
|
33
|
Guenther CA, Wang Z, Li E, Tran MC, Logan
CY, Nusse R, Pantalena-Filho L, Yang GP and Kingsley DM: A distinct
regulatory region of the Bmp5 locus activates gene expression
following adult bone fracture or soft tissue injury. Bone.
77:31–41. 2015. View Article : Google Scholar : PubMed/NCBI
|
|
34
|
Chen J, Luo M, Wang W, Zhang Z, He Y,
Duance VC, Hughes CE, Caterson B and Cao J: Altered proteolytic
activity and expression of MMPs and aggrecanases and their
inhibitors in Kashin-Beck disease. J Orthop Res. 33:47–55. 2015.
View Article : Google Scholar : PubMed/NCBI
|
|
35
|
Michelin AC, Justulin LA Jr, Delella FK,
Padovani CR, Felisbino SL and Dal-Pai-Silva M: Differential MMP-2
and MMP-9 activity and collagen distribution in skeletal muscle
from pacu (Piaractus mesopotamicus) during juvenile and adult
growth phases. Anat Rec (Hoboken). 292:387–395. 2009. View Article : Google Scholar : PubMed/NCBI
|
|
36
|
Tian J, Zhang FJ and Lei GH: Role of
integrins and their ligands in osteoarthritic cartilage. Rheumatol
Int. 35:787–798. 2015. View Article : Google Scholar : PubMed/NCBI
|
|
37
|
Almonte-Becerril M, Costell M and Kouri
JB: Changes in the integrins expression are related with the
osteoarthritis severity in an experimental animal model in rats. J
Orthop Res. 32:1161–1166. 2014. View Article : Google Scholar : PubMed/NCBI
|
|
38
|
Kurtis MS, Schmidt TA, Bugbee WD, Loeser
RF and Sah RL: Integrin-mediated adhesion of human articular
chondrocytes to cartilage. Arthritis Rheum. 48:110–118. 2003.
View Article : Google Scholar : PubMed/NCBI
|
|
39
|
Vortkamp A, Lee K, Lanske B, Segre GV,
Kronenberg HM and Tabin CJ: Regulation of rate of cartilage
differentiation by Indian hedgehog and PTH-related protein.
Science. 273:613–622. 1996. View Article : Google Scholar : PubMed/NCBI
|
|
40
|
Winkler DG, Sutherland MK, Geoghegan JC,
Yu C, Hayes T, Skonier JE, Shpektor D, Jonas M, Kovacevich BR,
Staehling-Hampton K, et al: Osteocyte control of bone formation via
sclerostin, a novel BMP antagonist. EMBO J. 22:6267–6276. 2003.
View Article : Google Scholar : PubMed/NCBI
|