Introduction
Breast cancer is one of the most common cancer types
among women worldwide. According to global cancer statistics, an
estimated >1.6 million patients were newly diagnosed and 500,000
breast cancer-associated mortalities occurred in 2012 worldwide
(1). The Global Burden of Disease
estimated that there were more than 1.7 million new cases and more
than 545 thousand deaths in 2016 (2). In China, breast cancer alone is
estimated to account for 15% of all newly diagnosed cancers in
women, and its incidence has increased in the past decades
(3). At present, chemotherapy is an
important means of systemic therapy for breast cancer, in addition
to surgical treatment. However, breast cancer may still be
associated with poor prognosis, short survival time and rapid
recurrence after therapy (4). The
treatment and prognosis of breast cancer are affected by the
expression levels of certain genes and proteins. For instance,
triple-negative breast cancer [estrogen receptor (ER)-,
progesterone receptor (PGR)- and human epidermal growth factor
receptor 2 (HER2)-negative] is associated with poor prognosis and
no targeted systemic therapy is currently available (5). However, patients with triple-positive
breast cancer have a better prognosis and longer overall survival
compared with triple-negative breast cancer patients (6).
The American Joint Committee on Cancer (AJCC) breast
cancer staging system provides important information for the
treatment and prognosis of this type of cancer (7). According to the 8th edition of the AJCC
staging system, breast cancer may be divided into four main stages
(stages I–IV) based on various factors, including the size of the
tumor, the status of the lymph nodes and metastasis (7). Breast cancer staging is crucial for
determining the extent of disease progression, as well as for
containing and eliminating the cancer. The treatment of breast
cancer depends partly on the stage of the disease, particularly in
the case of targeted therapy. During breast cancer progression,
diverse genetic signatures have been identified to drive processes
of genome, transcriptome and epigenome remodeling (8–13).
Therefore, it is necessary to select the most effective treatment
options for breast cancer patients at different stages.
To date, numerous genes and pathways have been
identified to be associated with breast cancer, and this
information may be useful for studies into the pathological
mechanisms and clinical treatment of breast cancer. According to
the evidence provided by a functional study, the Wnt/β-catenin
signaling pathway controls cell fate in developmental processes and
tumorigenesis, with β-catenin identified as a transforming factor
(14). Based on a genome-wide
assessment of allelic imbalances, an ATR/ATM-regulated DNA damage
response network was identified to be activated in early human
tumorigenesis, which may delay or prevent tumor progression
(15). The results of a medical
genomics study indicated that paired-box gene 2 may mediate
endometrial carcinogenesis induced by tamoxifen, which has been
widely used in the treatment of hormone-responsive breast cancer at
all stages (16).
Thomson Reuters Integrity™ is a knowledge solution
integrating biology, chemistry and pharmacology data (https://thomsonreutersintegrity.com). It contains
exhaustive information on therapeutic drugs and gene targets for
numerous complex human diseases. To the best of our knowledge, no
previous study has compared the expression profiles of breast
cancer target genes at different tumor stages. Gene expression
profiling datasets at different stages of breast cancer are
available from public databases, including the Gene Expression
Omnibus of the National Center for Biotechnology Information
(NCBI-GEO; http://www.ncbi.nlm.nih.gov/geo) (17,18). The
present study aimed to perform a comprehensive integrated analysis
of gene expression datasets to identify key targets for breast
cancer treatment and explore similarities and differences in the
abnormalities of molecular signaling pathways/biological functions
at different stages of breast cancer.
Materials and methods
Microarray data collection and
pre-processing
Human breast cancer microarray datasets were
searched and downloaded from the NCBI-GEO database in March 2016.
The key words ‘breast cancer’, ‘breast adenocarcinoma’ and ‘breast
tumor’ were used to perform a specific search. The selection
criteria for the datasets were as follows: i) All datasets were
genome-wide; ii) the samples of each dataset included breast cancer
patients and controls; iii) the samples in tumor and control group
were from breast tissue; iv) the dataset included different stages
of breast cancer; and v) raw data were available. Datasets were
excluded if: i) The number of samples was <3 for cases or
controls; and ii) severe RNA degradation or an insufficient number
of detected genes. Based on the aforementioned criteria, five
datasets were finally selected for the integrated analysis
[GSE10810 (19), GSE16391 (20), GSE29431 (21), GSE42568 (22) and GSE61304 (23)]. The integrated datasets included 257
breast cancer patients and 98 controls. A summary of the selected
datasets is presented in Table I.
All datasets had been generated using the Affymetrix Human Genome
U133 Plus 2.0 Array. Among these five studies, one study included
two stages of breast cancer (stages I–II), three studies included
three stages of breast cancer (stages I–III), and one study
included four stages of breast cancer (stages I–IV). As there was
only 1 patient in stage IV, the datasets were divided into three
subgroups (stage I–III).
 | Table I.Summary of Gene Expression Omnibus
breast cancer datasets used in the present study. |
Table I.
Summary of Gene Expression Omnibus
breast cancer datasets used in the present study.
| Dataset ID | Author (year) | Samples (n) | Breast cancer
stages | (Refs.) |
|---|
| GSE10810 | Pedraza (2010) | 58 | I, II, III | (19) |
| GSE16391 | Desmedt (2009) |
48a | I, II | (20) |
| GSE29431 | Lopez (2012) | 66 | I, II, III | (21) |
| GSE42568 | Clarke (2013) | 121 | I, II, III | (22) |
| GSE61304 | Aswad (2015) | 62 | I, II, III, IV | (23) |
R v3.2.2 (https://www.r-project.org/) was used for data
pre-processing. The Robust Multichip Average (RMA) algorithm in the
oligo-package was used to normalize the raw expression data and
generate normalized gene expression intensity (24). Gene annotation, integration and
re-normalization of the five datasets were performed using the
custom-written Python code (25).
Probes with no gene annotation or those that matched multiple gene
symbols were removed. Next, the mean expression value of multiple
probe IDs that matched an official gene symbol was calculated, and
this value was considered to represent the expression intensity of
the corresponding gene symbol. The re-normalization method was
reported in a previous study (26).
Differential gene expression
analysis
Differential gene expression analysis was performed
using R v3.2.2 and the Bioconductor Library (http://www.bioconductor.org/). The empirical Bayes
algorithm (function ‘eBayes’) in the limma package was used to
detect differentially expressed genes between breast cancer and
controls (27). Genes were
considered to be upregulated if the logarithmic transformed
fold-change log2(FC) was ≥log2(1.5) and the false discovery rate
(FDR)-adjusted P-value was ≤0.05. Genes were considered to be
downregulated if log2(FC) ≤-log2(1.5) and FDR-adjusted P≤0.05.
Differential expression analysis was performed for the whole cohort
and the sub-groups (stage I–III). The control samples in the
analysis for different stages were the same as the controls in the
analysis for the whole cohort.
Enrichment analysis for differentially
expressed genes in Gene Ontology (GO) terms in the category
biological process and in KEGG pathways
The Database for Annotation, Visualization and
Integrated Discovery Bioinformatics Resources 6.7 was used to
perform GO and KEGG pathway enrichment analysis (28). The input parameters were the list of
differentially expressed genes. The significance level for
enrichment was set at P≤0.05. The 4-set Venn diagram in
InteractiVenn (http://www.interactivenn.net/) was used to present the
GO terms in the category biological process in which the
differentially expressed genes in the unstaged cohort and in
different stages of breast cancer were enriched.
Breast cancer target gene
analysis
Breast cancer-specific target genes were defined
based on already available drugs or drugs under development that
target these genes. All of these target genes were searched and
downloaded from the Thomson Reuters Integrity Database. In total, a
list of 344 breast cancer target genes were obtained, which were
then mapped to the differentially expressed genes obtained in the
present study for the whole cohort and for the sub-groups (stage
I–III). The differentially expressed genes identified in the whole
cohort and the sub-groups were overlapped with the 344 breast
cancer target genes, and the ‘barplot’ function was used to present
the results.
Gene interaction network analysis
A genome-scale integrated analysis of gene networks
in breast cancer was performed using the Genome-scale Integrated
Analysis of Gene Networks in Tissues (GIANT) web server (http://giant.princeton.edu/) (29). Based on the aforementioned results of
the overlapping expression pattern of differentially expressed
breast cancer target genes among the whole cohort and the
sub-groups, the differentially expressed target genes in the
unstaged cohort were used as input parameters to perform the gene
network analysis. As the tissue options in the GIANT web server did
not include breast tissue, ‘all tissues’ was selected to perform
the analysis. The server generated a gene network of target genes
and other genes that interacted with the target genes, and
biological function enrichment analysis of the genes in the network
was performed. The enriched biological processes were then
presented using bar charts.
Results and Discussion
Overview of differentially expressed
genes
The number of differentially expressed genes in
breast cancer for each dataset is presented in Table II. A total of 153 upregulated and
183 downregulated genes were obtained for the whole cohort. In the
unstaged cohort and in the stage I–II groups, more downregulated
than upregulated genes were identified. However, in the stage-III
group, the number of upregulated genes was higher than that of
downregulated genes. The number of overlapping up- and
downregulated genes among all four groups was 29 and 51,
respectively.
| Table II.Number of differentially expressed
genes in breast cancer. |
Table II.
Number of differentially expressed
genes in breast cancer.
| Group | Casesa | Mapped genes | Upregulated | Downregulated |
|---|
| Entire cohort | 257 | 20307 | 153 | 183 |
| Stage I | 22 | 20307 | 53 | 275 |
| Stage II | 98 | 20307 | 167 | 309 |
| Stage III | 113 | 20307 | 202 | 165 |
GO and KEGG enrichment results
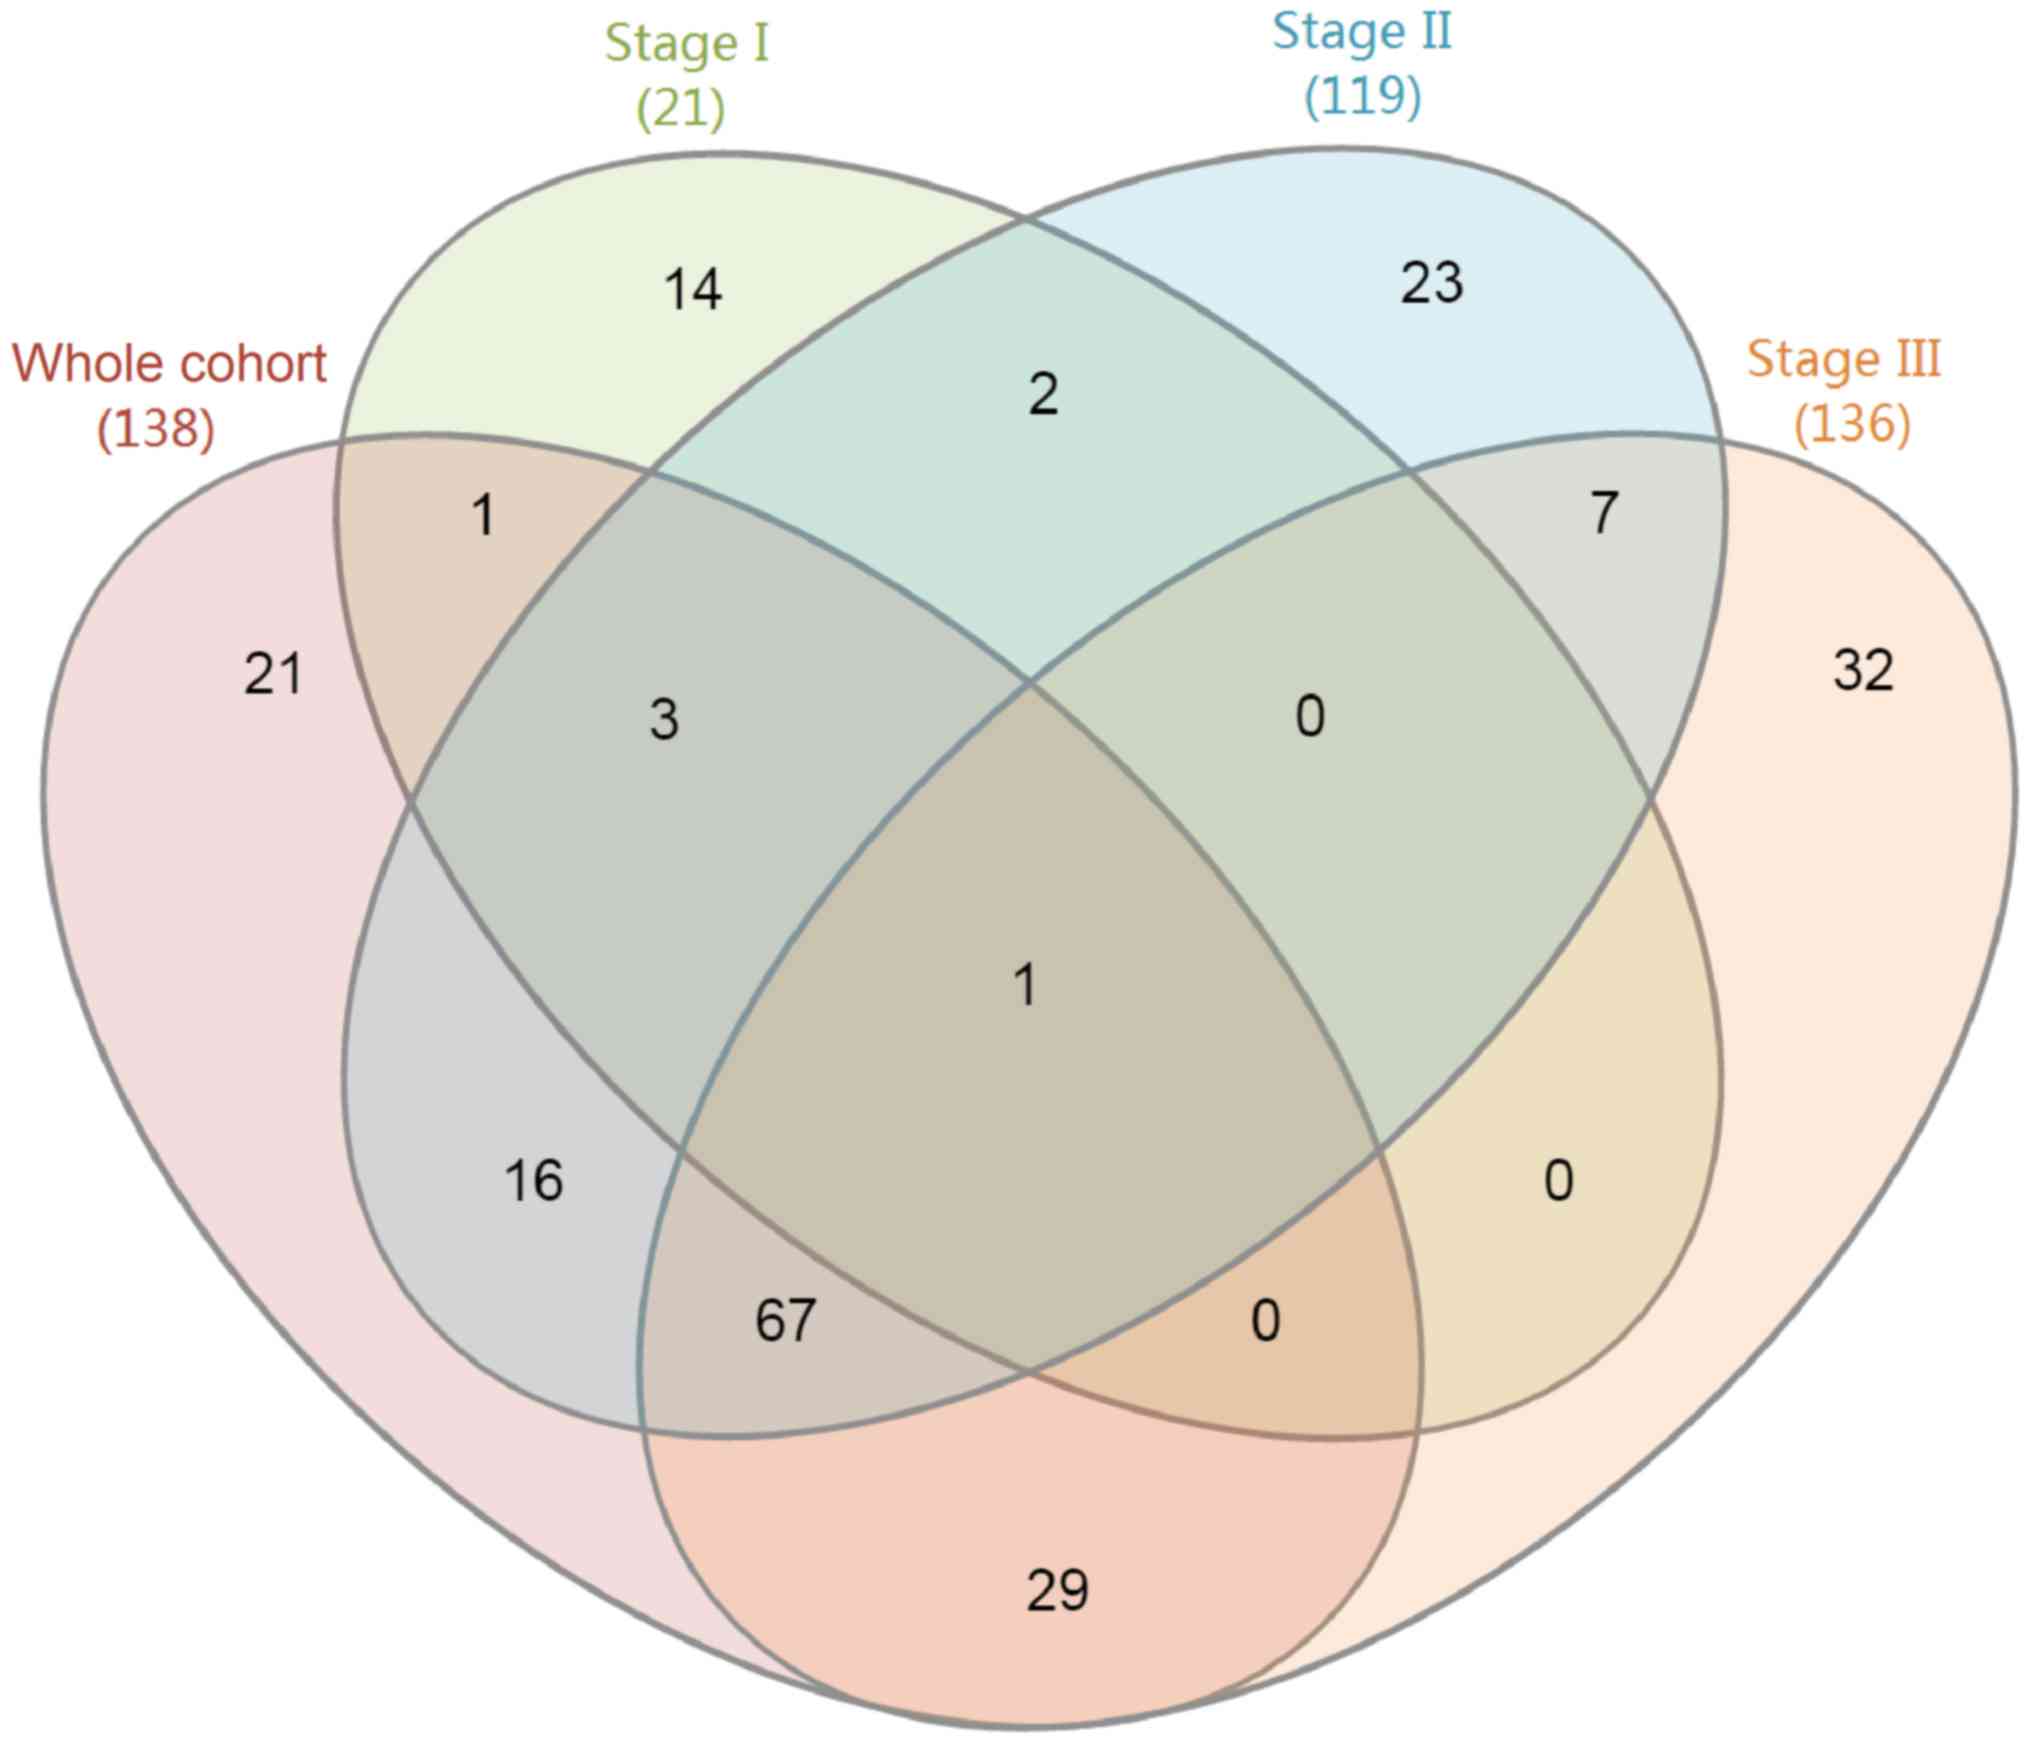
A Venn diagram displaying the enrichment results for
the GO category biological process for the unstaged cohort and the
individual stages is presented in Fig.
1. In the unstaged cohort, stage I–III groups, the
differentially expressed genes were enriched in 138, 21, 119 and
136 GO terms, respectively. The top 10 enriched GO terms in the
category biological process in each group are presented in Table III. Only one GO term in the
category biological process, namely ‘cell migration’, was enriched
in all four groups (the P-values for the unstaged cohort, stage
I–III groups were 0.018, 0.001, 0.008 and 0.035, respectively).
Activated cell migration is known to promote breast cancer
progression (30). By contrast,
inhibition of breast cancer cell migration contributes to
successful treatment (31).
Furthermore, 67 GO terms in the category biological process were
enriched in the unstaged cohort, stage II–III groups, and 29 were
enriched in the unstaged cohort and the stage III group.
| Table III.Top 10 enriched GO terms in the
category biological process by the differentially expressed genes
from the gene expression datasets for breast cancer. |
Table III.
Top 10 enriched GO terms in the
category biological process by the differentially expressed genes
from the gene expression datasets for breast cancer.
| Group/GO term | P-value |
|---|
| Entire cohort |
|
|
Response to wounding | <0.001 |
|
Epithelial cell
differentiation | <0.001 |
|
Response to endogenous
stimulus | <0.001 |
|
Response to nutrient
levels | <0.001 |
|
Epithelium development | <0.001 |
|
Regulation of hormone
levels | <0.001 |
| Defense
response | <0.001 |
|
Response to drug | <0.001 |
|
Response to extracellular
stimulus | <0.001 |
|
Response to steroid hormone
stimulus | <0.001 |
| Stage I |
|
| Cell
migration | 0.001 |
|
Vasculature development | 0.002 |
|
Localization of cell | 0.004 |
| Cell
motility | 0.004 |
|
Endothelial cell
migration | 0.005 |
|
Angiogenesis | 0.009 |
|
Odontogenesis | 0.010 |
|
Leukocyte migration | 0.012 |
| Blood
vessel development | 0.016 |
| Blood
vessel morphogenesis | 0.019 |
| Stage II |
|
| Gland
development | <0.001 |
|
Response to extracellular
stimulus | <0.001 |
|
Cellular di-, tri-valent
inorganic cation homeostasis | <0.001 |
|
Response to wounding | <0.001 |
| Di-,
tri-valent inorganic cation homeostasis | <0.001 |
|
Response to nutrient
levels | <0.001 |
|
Response to nutrient | <0.001 |
|
Cellular cation
homeostasis | <0.001 |
|
Cell-cell signaling | <0.001 |
|
Regulation of hormone
levels | <0.001 |
| Stage III |
|
|
Response to endogenous
stimulus | <0.001 |
|
Response to hormone
stimulus | <0.001 |
|
Response to steroid hormone
stimulus | <0.001 |
|
Response to organic
substance | <0.001 |
|
Response to nutrient
levels | <0.001 |
|
Response to wounding | <0.001 |
|
Oxidation reduction | <0.001 |
|
Epithelial cell
differentiation | <0.001 |
| Defense
response | <0.001 |
|
Response to oxygen levels | <0.001 |
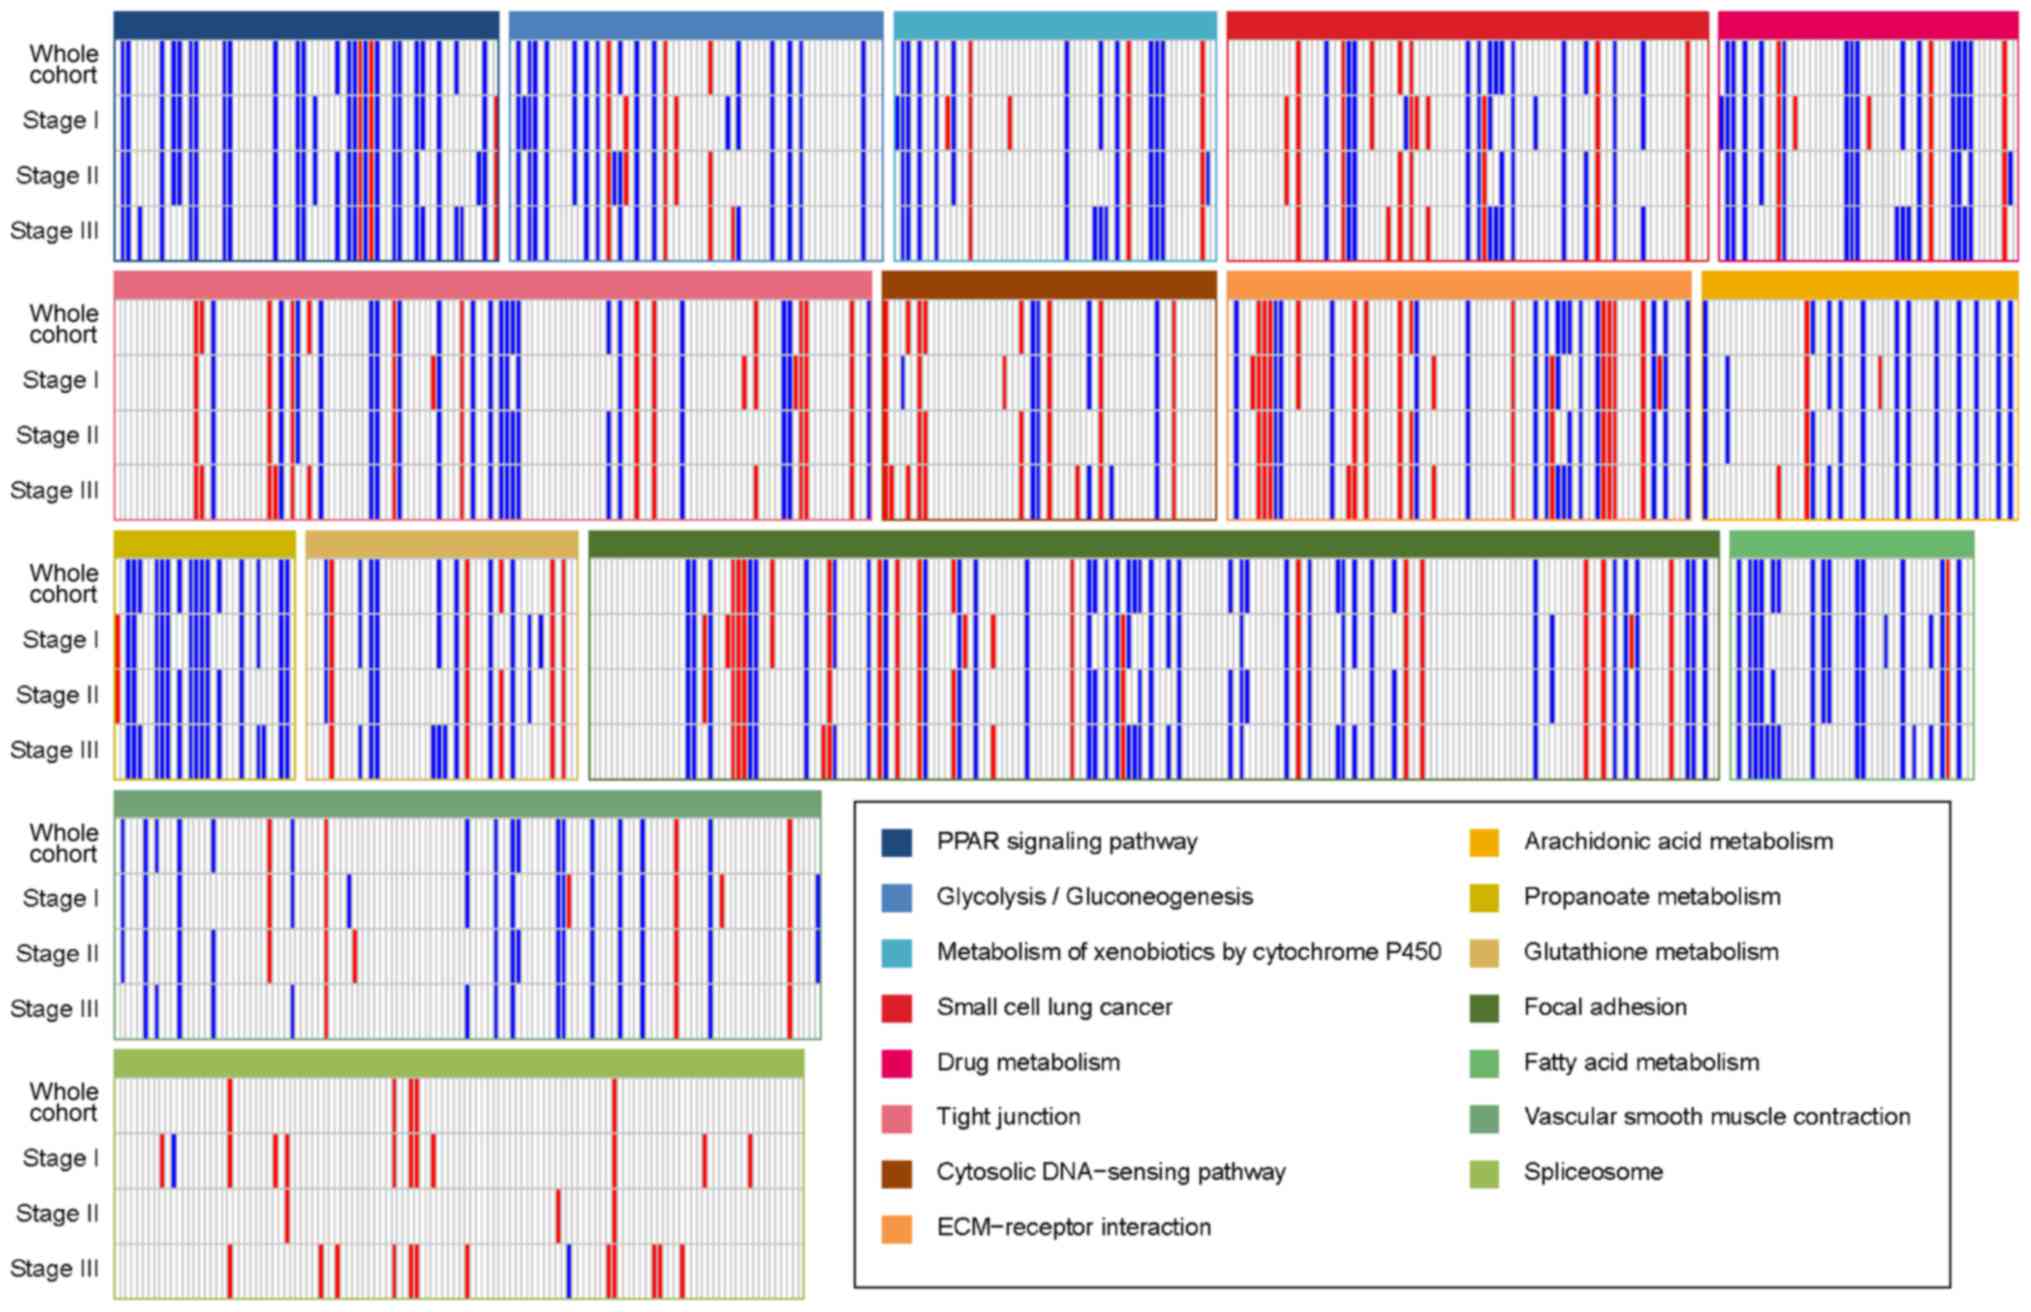
The KEGG pathways in which the differentially
expressed genes of the four groups were enriched are presented in
Table IV. The pathways ‘glutathione
metabolism’, ‘peroxisome proliferator activated receptor (PPAR)
signaling pathway’, ‘metabolism of xenobiotics by cytochrome P450
(CYP)’, ‘arachidonic acid metabolism’, ‘drug metabolism’ and ‘tight
junction’ were significantly enriched in the whole cohort (P-values
of <0.001, 0.001, 0.004, 0.018, 0.025 and 0.034, respectively).
Fig. 2 presents the gene expression
profiles in the sets of enriched pathways in the whole cohort and
the three sub-groups based on cancer stage. Overall, all of these
pathways were severely affected. The pathways ‘PPAR signaling’,
‘arachidonic acid metabolism’, ‘propanoate metabolism’ and ‘fatty
acid metabolism’ had a large number of downregulated genes across
all groups. However, the ‘spliceosome’ pathway had more upregulated
than downregulated genes. Glutamine has been reported to control
cancer cell proliferation by activating signal transducer and
activator of transcription 3 independent of glutamine metabolism
(32). According to a study on
mammary epithelial cell-specific PPARγ knockout mice, PPARγ
expression and signaling has an inhibitory role in breast tumor
progression (33). According to a
previous study by our group, certain downstream genes mainly
involved in lipid metabolism and adipocyte differentiation in the
PPAR signaling pathway were suppressed following downregulation of
PPARγ in breast cancer, which may lead to tumorigenesis (13). It was previously reported that the
expression of the CYP1A1, −2E1 and −3A4 was downregulated in tumor
tissue, which may alter the biological effects of carcinogens and
may represent a potential target for breast cancer chemoprevention
(34). Previous studies demonstrated
that induction of the expression of CYP2E1 reduces, whereas
downregulation of CYP2E1 increases the migratory capacity, thereby
promoting breast cancer cell progression (35). Thus, CYP2E1 may be associated with
the regulation of breast cancer cell migration. CYP2E1 gene encodes
a member of the cytochrome P450 superfamily of enzymes. Cytochrome
P450 proteins are monooxygenases that catalyze many reactions
involved in drug metabolism and synthesis of cholesterol, steroids
and other lipids (36). It was
previously demonstrated that differences in the expression of drug
and xenobiotic metabolizing enzymes (DXME) markedly affect drug
resistance. Substantial differences in DXME expression were
identified in breast cancer patients of different ethnicities,
which may affect pathways involved in drug metabolism (37).
| Table IV.Enriched KEGG pathways by the
differentially expressed genes from the gene expression datasets
for breast cancer. |
Table IV.
Enriched KEGG pathways by the
differentially expressed genes from the gene expression datasets
for breast cancer.
| Group/KEGG
pathway | P-value |
|---|
| Entire cohort |
|
|
Glutathione metabolism | <0.001 |
| PPAR
signaling pathway | 0.001 |
|
Metabolism of xenobiotics by
cytochrome P450 | 0.004 |
|
Arachidonic acid
metabolism | 0.018 |
| Drug
metabolism | 0.025 |
| Tight
junction | 0.034 |
| Stage I |
|
| Small
cell lung cancer | 0.008 |
| Focal
adhesion | 0.009 |
|
ECM-receptor interaction | 0.035 |
|
Spliceosome | 0.038 |
|
Cytosolic DNA-sensing
pathway | 0.047 |
| Stage II |
|
| Tight
junction | 0.034 |
| Focal
adhesion | 0.041 |
|
ECM-receptor interaction | 0.043 |
|
Vascular smooth muscle
contraction | 0.043 |
|
Metabolism of xenobiotics by
cytochrome P450 | 0.048 |
| Stage III |
|
|
Propanoate metabolism | 0.001 |
|
Glutathione metabolism | 0.001 |
| PPAR
signaling pathway | 0.001 |
|
Metabolism of xenobiotics by
cytochrome P450 | 0.002 |
| Fatty
acid metabolism | 0.011 |
|
Arachidonic acid
metabolism | 0.033 |
|
Glycolysis/gluconeogenesis | 0.041 |
| Drug
metabolism | 0.046 |
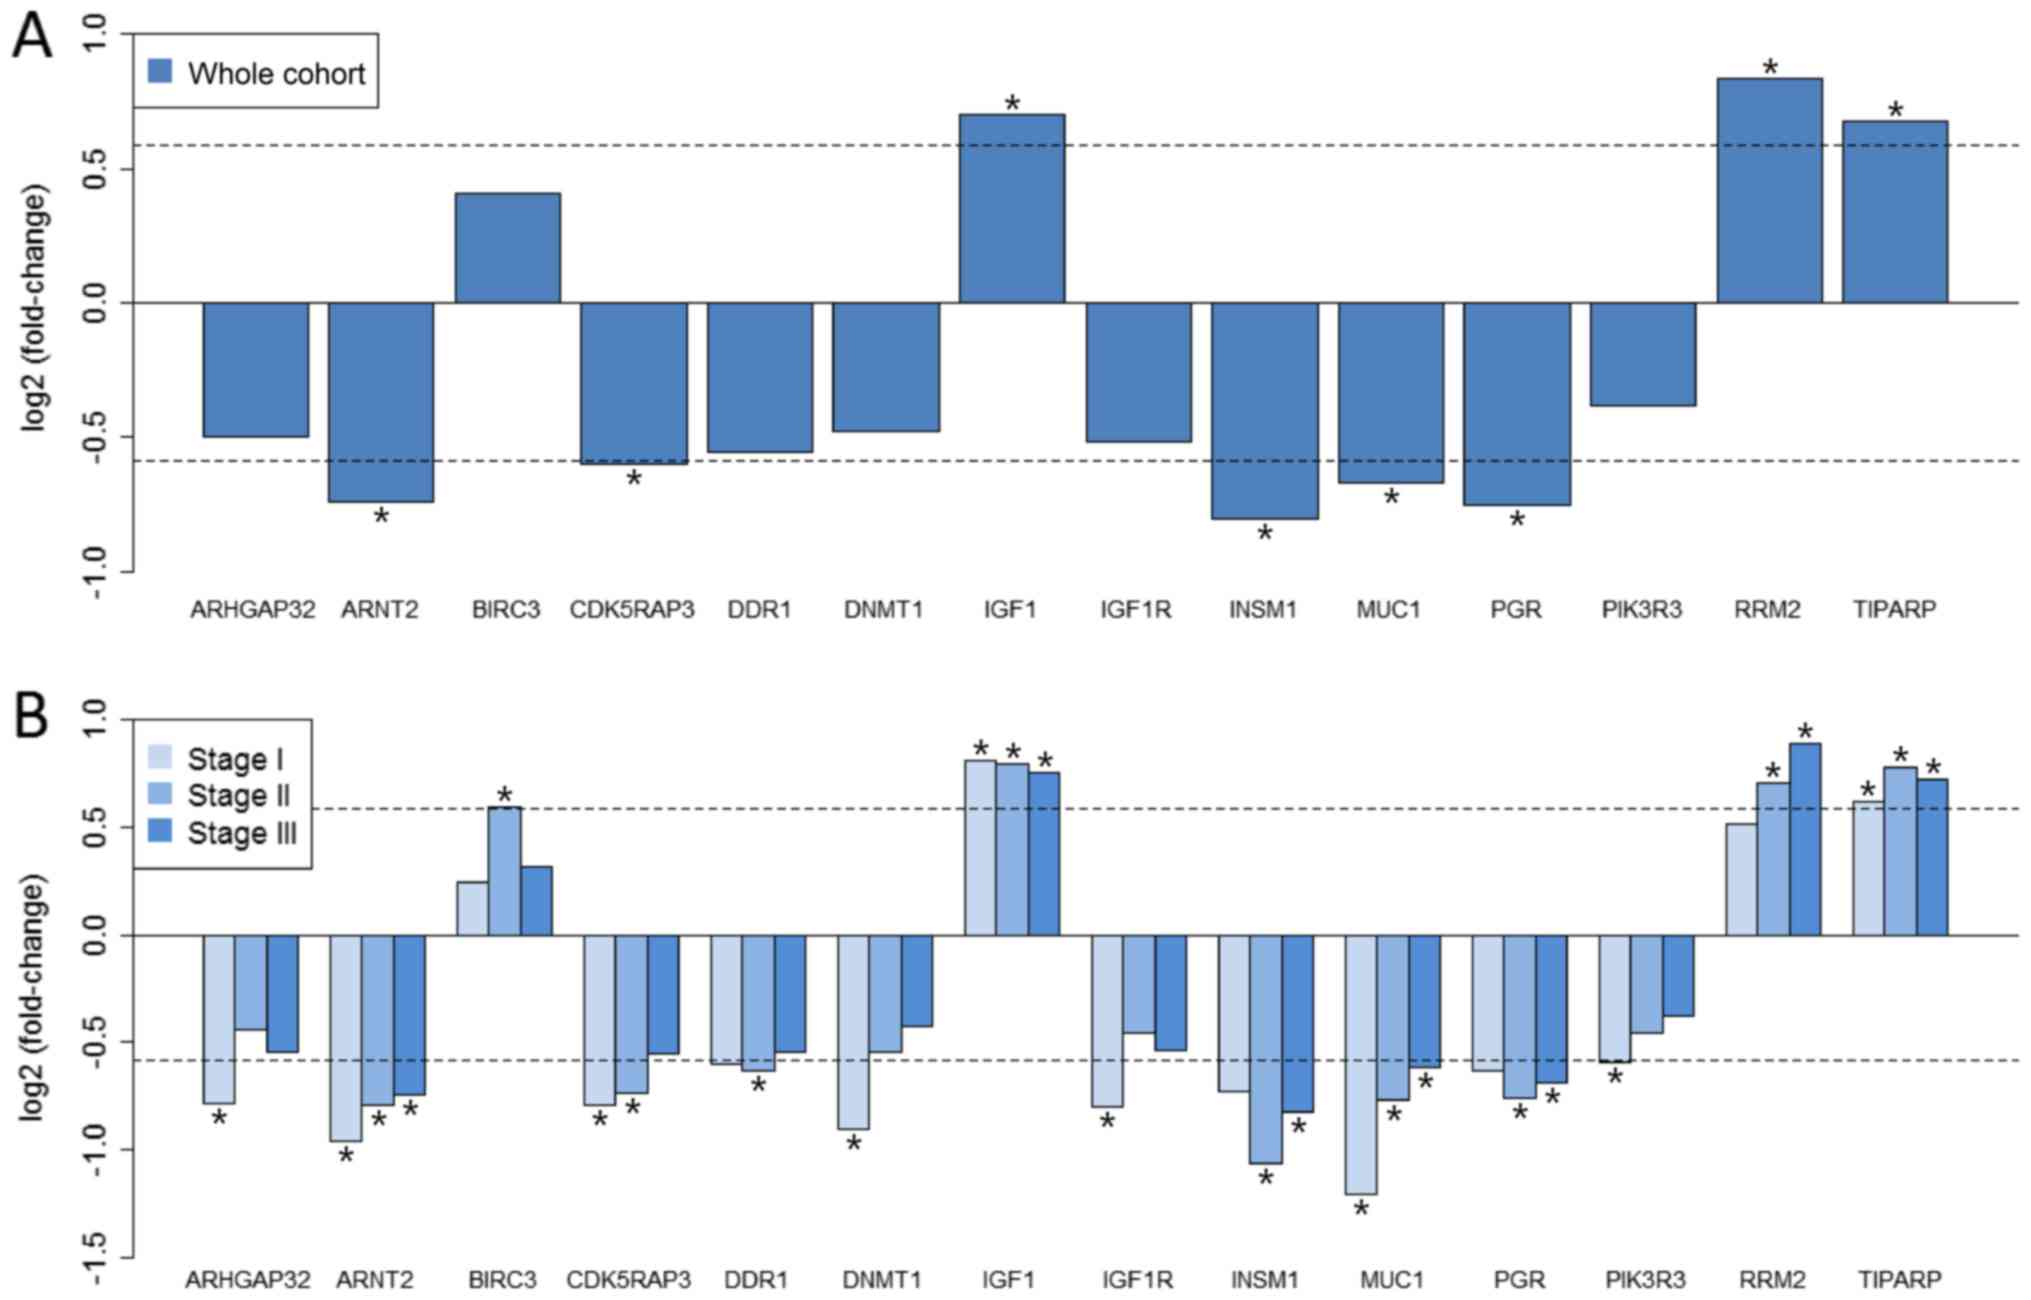
Mapping of anti-breast cancer target
genes
The differentially expressed breast cancer target
genes were screened in the four groups. Subsequently, 8, 6, 9 and 7
breast cancer target genes from the differentially expressed genes
in the unstaged cohort and stage I–III groups, respectively, were
mapped. The combined set of these target genes contained 14 genes.
Fig. 3 presents the log2(FC) of
these targets in each group. Insulin-like growth factor (IGF) 1 and
TCDD-inducible poly (ADP-ribose) polymerase (TIPARP) were
overexpressed in all groups, whereas aryl hydrocarbon receptor
nuclear translocator 2 (ARNT2), INSM1, mucin (MUC)1 and PGR were
downregulated in all groups, compared with the healthy controls.
Overall, all these targets in the groups of different stages
exhibited the same expression pattern as in the unstaged cohort.
The IGF1 signaling axis has been reported to be crucial for
tumorigenesis, and the activation of IGF1 receptor may promote
breast cancer development by increasing glycolysis and promoting
biomass production (38). Several
polymorphisms of IGF1 pathway genes were reported to be associated
with the risk of breast cancer (39). TIPARP is a poly(ADP-ribose)
polymerase and a transcriptional repressor of the aryl hydrocarbon
receptor, the polymorphism of which was previously reported to be
associated with ovarian and breast cancer (40,41). The
mRNA expression level of ARNT2 was previously reported to be useful
in determining the prognosis of breast cancer, and ARNT2 was
reported to form functional complexes with hypoxia-inducible factor
(HIF), which is a key to factor involved in tumor angiogenesis
(42,43). The results of small interfering
RNA-mediated knockdown of ARNT2 suggested that ARNT2 may have a
pivotal part in the modulation of HIF-1-regulated signaling and
metabolism in MCF7 human breast cancer cells (43). The tumor oncoprotein MUC1 is a
potential target in breast cancer immunotherapy, and the expression
of MUC1 is absent or low in normal breast tissue, while it is high
in breast cancer (44). PGR is one
of the well-established breast cancer biomarkers, along with
HER2/ERBB2 and ER (45).
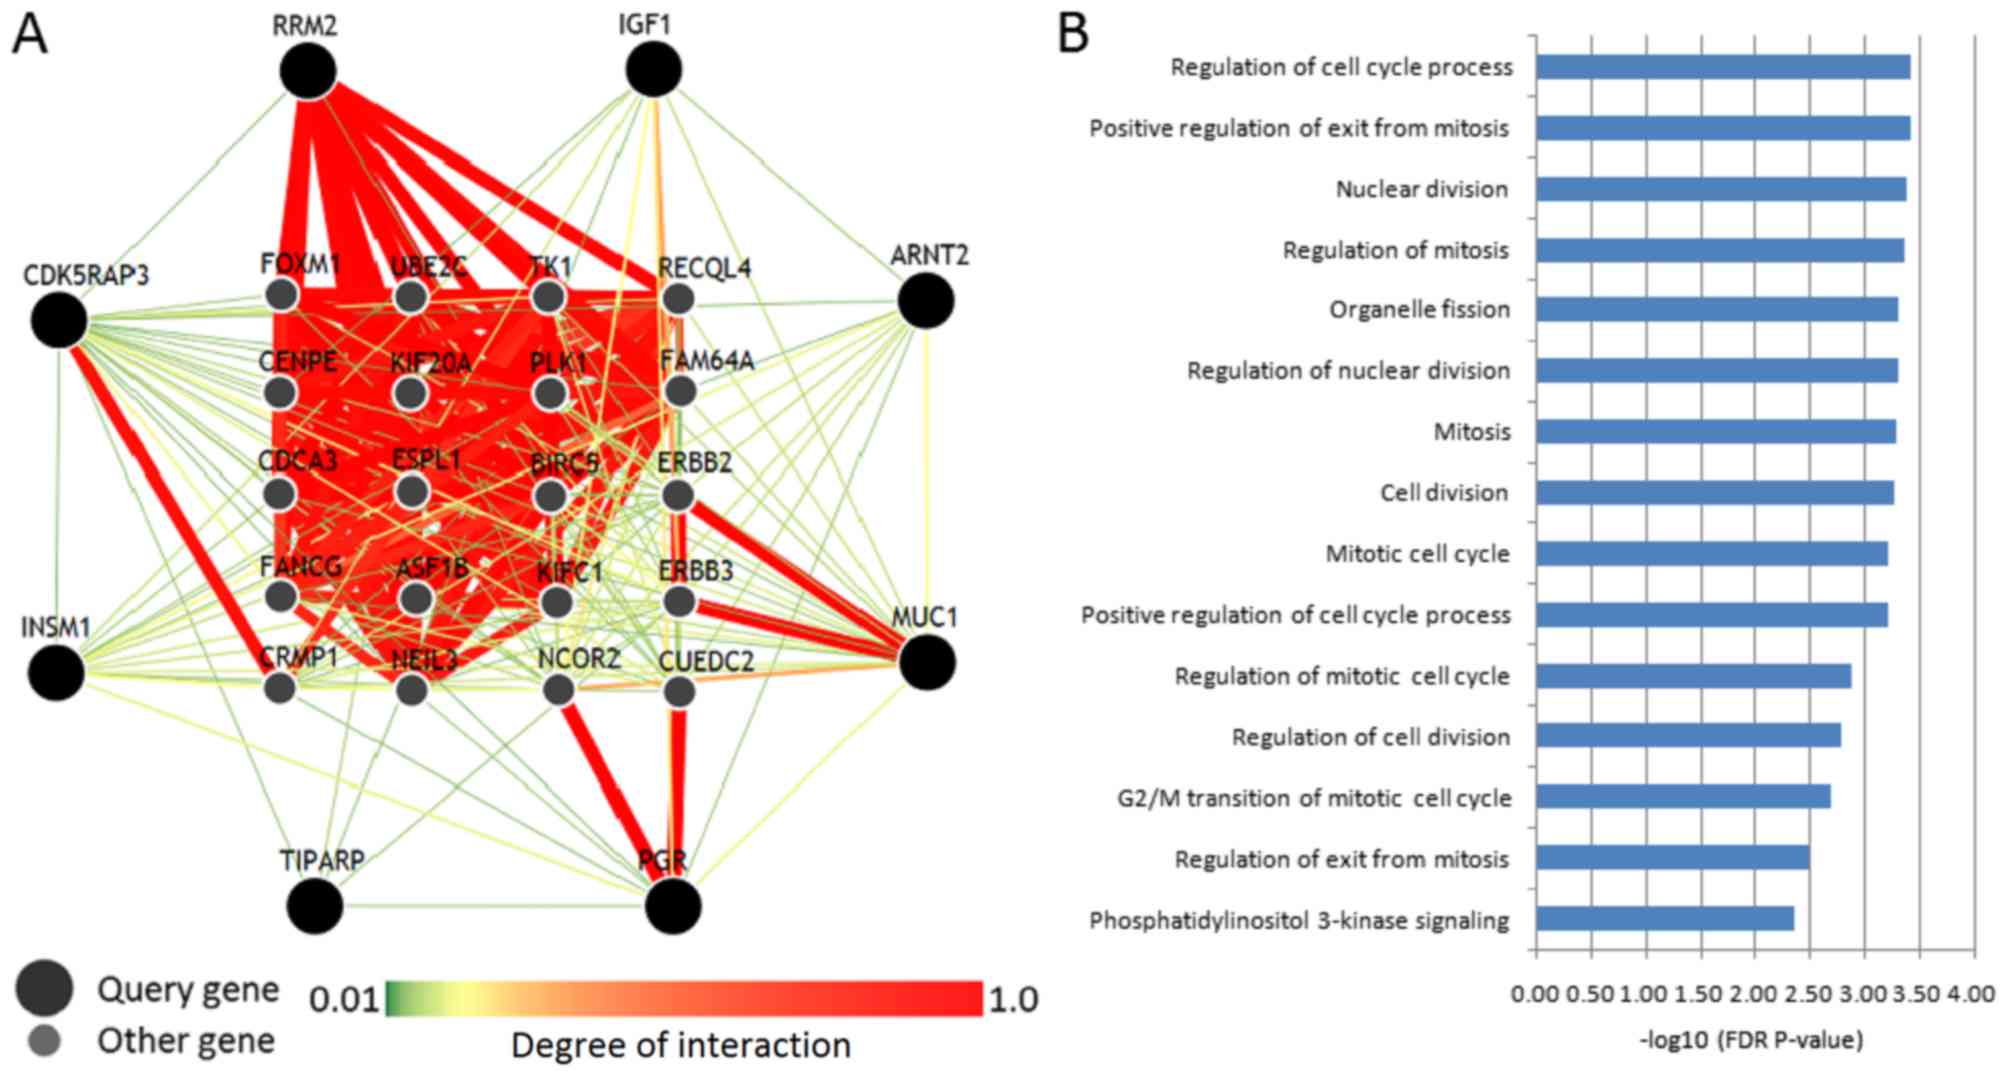
Gene network of breast cancer
targets
The present study identified 8 differentially
expressed anti-breast cancer target genes in the whole cohort
(Fig. 3), which were used to perform
a genome-scale integrated analysis. The gene-gene interaction
network and the top 15 enriched biological processes are shown in
Fig. 4. Among all these targets,
RRM2 displayed the highest degree of interaction with other
interacting genes. Ribonucleotide reductase M2 (RRM2) is required
for pyrimidine metabolism, and it is associated with aggressive
tamoxifen-resistant breast tumors, whereas pharmacological
inhibition and genetic knockdown of RRM2 sensitizes tumors to
tamoxifen (46). In MCF-7 breast
cancer cells, overexpression of RRM2 reduced the expression of
ERα66 and caused an upregulation of the 36-kDa variant of ER,
ERα36, resulting in a reduction in the effectiveness of tamoxifen,
which is widely used as an adjuvant therapy for patients with
ERα-positive tumors (47).
Therefore, RRM2-associated metabolites may potentially be developed
as prognostic markers for breast cancer. Furthermore, MUC1
exhibited a high degree of interaction with ERBB2 and ERBB3, PGR
exhibited a high degree of interaction with nuclear receptor
corepressor 2 and CUE domain containing 2, and cyclin-dependent
kinase 5 regulatory subunit associated protein 3 exhibited a high
degree of interaction with collapsin response mediator protein 1
(Fig. 4A). It has been demonstrated
that the oncogenic MUC1 C-terminal may act on the polycomb
repressive complex 1 during epigenetic gene silencing, which is
overexpressed in breast and other cancer types (48). The MUC1 oncoprotein was reported to
be aberrantly overexpressed and associated with HER2/ERBB2
activation in breast cancer cells (49). The ERBB2/ERBB3 heterocomplex is a
vital etiological feature of breast cancer, and it is important to
understand its mechanisms of action to improve the design of novel,
effective chemotherapeutics (50).
As presented in Fig. 4B, the
enriched biological processes of these target genes and interacting
genes were mostly associated with cell cycle and mitosis. These
results indicated that altered expression of these anti-breast
cancer genes may severely affect the cell cycle and mitosis.
Previous cell cycle-targeting agents have been reviewed, and
emerging strategies for targeting mitosis in cancer have been
refined and improved (51). Of note,
in a recent study on functional mutagenesis screens in mice, human
breast cancer susceptibility genes were, at large, not associated
with cell cycle/mitosis genes (52).
These results suggested that integration of human cancer
transcriptomic data is required to identify breast cancer
biomarkers with a high prognostic value. A limitation is that the
tissue options in the GIANT web server did not include breast
tissue, we choose ‘all tissues’ option to perform the analysis.
This may have some influence on the result.
Acknowledgements
Not applicable.
Funding
This study was supported by the Natural Science
Foundation Project of Anhui Province (grant no. 1508085QC63), the
Scientific Research Foundation and Academic & Technology
Leaders Introduction Project (the 211 Project) of Anhui University
(grant no. 10117700023) and the Student Research Training Program
of Anhui University (grant nos. J10118520218 and J10118520307).
Availability of data and materials
The datasets used and/or analyzed during the current
study are available from the corresponding author on reasonable
request.
Authors' contributions
WXL and KH designed the present study. WXL, MTG and
WWL performed breast cancer data collection. WXL, MTG and SDY
conducted data analysis. WXL, KH and MTG wrote the manuscript. The
final version of the manuscript has been read and approved by all
authors, and each author believes that the manuscript represents
honest work.
Ethical approval and consent to
participate
Not applicable.
Patient consent for publication
Not applicable.
Competing interests
The authors declare that they have no competing
interests.
References
|
1
|
Torre LA, Bray F, Siegel RL, Ferlay J,
Lortet-Tieulent J and Jemal A: Global cancer statistics, 2012. CA
Cancer J Clin. 65:87–108. 2015. View Article : Google Scholar : PubMed/NCBI
|
|
2
|
Global Burden of Disease Cancer
Collaboration, . Fitzmaurice C, Allen C, Barber RM, Barregard L,
Bhutta ZA, Brenner H, Dicker DJ, Chimed-Orchir O, Dandona R, et al:
Global, regional, and national cancer incidence, mortality, years
of life lost, years lived with disability, and disability-adjusted
life-years for 32 cancer groups, 1990 to 2015: A systematic
analysis for the global burden of disease study. JAMA Oncol.
3:524–548. 2017. View Article : Google Scholar : PubMed/NCBI
|
|
3
|
Chen W, Zheng R, Baade PD, Zhang S, Zeng
H, Bray F, Jemal A, Yu XQ and He J: Cancer statistics in China,
2015. CA Cancer J Clin. 66:115–132. 2016. View Article : Google Scholar : PubMed/NCBI
|
|
4
|
O'Shaughnessy J: Extending survival with
chemotherapy in metastatic breast cancer. Oncologist. 10 Suppl
3:S20–S29. 2005. View Article : Google Scholar
|
|
5
|
Huang CS, Lin CH, Lu YS and Shen CY:
Unique features of breast cancer in Asian women-breast cancer in
Taiwan as an example. J Steroid Biochem Mol Biol. 118:300–303.
2010. View Article : Google Scholar : PubMed/NCBI
|
|
6
|
Reddy SM, Barcenas CH, Sinha AK, Hsu L,
Moulder SL, Tripathy D, Hortobagyi GN and Valero V: Long-term
survival outcomes of triple-receptor negative breast cancer
survivors who are disease free at 5 years and relationship with low
hormone receptor positivity. Br J Cancer. 118:17–23. 2018.
View Article : Google Scholar : PubMed/NCBI
|
|
7
|
Giuliano AE, Connolly JL, Edge SB,
Mittendorf EA, Rugo HS, Solin LJ, Weaver DL, Winchester DJ and
Hortobagyi GN: Breast Cancer-Major changes in the American Joint
Committee on Cancer eighth edition cancer staging manual. CA Cancer
J Clin. 67:290–303. 2017. View Article : Google Scholar : PubMed/NCBI
|
|
8
|
Locke WJ and Clark SJ: Epigenome
remodelling in breast cancer: Insights from an early in vitro model
of carcinogenesis. Breast Cancer Res. 14:2152012. View Article : Google Scholar : PubMed/NCBI
|
|
9
|
Harvell DM, Kim J, O'Brien J, Tan AC,
Borges VF, Schedin P, Jacobsen BM and Horwitz KB: Genomic
signatures of pregnancy-associated breast cancer epithelia and
stroma and their regulation by estrogens and progesterone. Horm
Cancer. 4:140–153. 2013. View Article : Google Scholar : PubMed/NCBI
|
|
10
|
Mobasheri MB, Shirkoohi R, Zendehdel K,
Jahanzad I, Talebi S, Afsharpad M and Modarressi MH: Transcriptome
analysis of the cancer/testis genes, DAZ1, AURKC, and TEX101, in
breast tumors and six breast cancer cell lines. Tumour Biol.
36:8201–8206. 2015. View Article : Google Scholar : PubMed/NCBI
|
|
11
|
Nogales-Cadenas R, Cai Y, Lin JR, Zhang Q,
Zhang W, Montagna C and Zhang ZD: MicroRNA expression and gene
regulation drive breast cancer progression and metastasis in PyMT
mice. Breast Cancer Res. 18:752016. View Article : Google Scholar : PubMed/NCBI
|
|
12
|
Lang JE, Scott JH, Wolf DM, Novak P, Punj
V, Magbanua MJ, Zhu W, Mineyev N, Haqq CM, Crothers JR, et al:
Expression profiling of circulating tumor cells in metastatic
breast cancer. Breast Cancer Res Treat. 149:121–131. 2015.
View Article : Google Scholar : PubMed/NCBI
|
|
13
|
Li WX, He K, Tang L, Dai SX, Li GH, Lv WW,
Guo YC, An SQ, Wu GY, Liu D, et al: Comprehensive tissue-specific
gene set enrichment analysis and transcription factor analysis of
breast cancer by integrating 14 gene expression datasets.
Oncotarget. 8:6775–6786. 2016.
|
|
14
|
Miyoshi K and Hennighausen L:
Beta-catenin: A transforming actor on many stages. Breast Cancer
Res. 5:63–68. 2003. View
Article : Google Scholar : PubMed/NCBI
|
|
15
|
Bartkova J, Horejsí Z, Koed K, Krämer A,
Tort F, Zieger K, Guldberg P, Sehested M, Nesland JM, Lukas C, et
al: DNA damage response as a candidate anti-cancer barrier in early
human tumorigenesis. Nature. 434:864–870. 2005. View Article : Google Scholar : PubMed/NCBI
|
|
16
|
Wu H, Chen Y, Liang J, Shi B, Wu G, Zhang
Y, Wang D, Li R, Yi X, Zhang H, et al: Hypomethylation-linked
activation of PAX2 mediates tamoxifen-stimulated endometrial
carcinogenesis. Nature. 438:981–987. 2005. View Article : Google Scholar : PubMed/NCBI
|
|
17
|
Edgar R, Domrachev M and Lash AE: Gene
expression omnibus: NCBI gene expression and hybridization array
data repository. Nucleic Acids Res. 30:207–210. 2002. View Article : Google Scholar : PubMed/NCBI
|
|
18
|
Barrett T, Wilhite SE, Ledoux P,
Evangelista C, Kim IF, Tomashevsky M, Marshall KA, Phillippy KH,
Sherman PM, Holko M, et al: NCBI GEO: Archive for functional
genomics data sets-update. Nucleic Acids Res. 41:(Database Issue).
D991–D995. 2013. View Article : Google Scholar : PubMed/NCBI
|
|
19
|
Pedraza V, Gomez-Capilla JA, Escaramis G,
Gomez C, Torné P, Rivera JM, Gil A, Araque P, Olea N, Estivill X
and Fárez-Vidal ME: Gene expression signatures in breast cancer
distinguish phenotype characteristics, histologic subtypes, and
tumor invasiveness. Cancer. 116:486–496. 2010. View Article : Google Scholar : PubMed/NCBI
|
|
20
|
Desmedt C, Giobbie-Hurder A, Neven P,
Paridaens R, Christiaens MR, Smeets A, Lallemand F, Haibe-Kains B,
Viale G, Gelber RD, et al: The Gene expression Grade Index: A
potential predictor of relapse for endocrine-treated breast cancer
patients in the BIG 1–98 trial. BMC Med Genomics. 2:402009.
View Article : Google Scholar : PubMed/NCBI
|
|
21
|
Lopez FJ, Cuadros M, Cano C, Concha A and
Blanco A: Biomedical application of fuzzy association rules for
identifying breast cancer biomarkers. Med Biol Eng Comput.
50:981–990. 2012. View Article : Google Scholar : PubMed/NCBI
|
|
22
|
Clarke C, Madden SF, Doolan P, Aherne ST,
Joyce H, O'Driscoll L, Gallagher WM, Hennessy BT, Moriarty M, Crown
J, et al: Correlating transcriptional networks to breast cancer
survival: A large-scale coexpression analysis. Carcinogenesis.
34:2300–2308. 2013. View Article : Google Scholar : PubMed/NCBI
|
|
23
|
Aswad L, Yenamandra SP, Ow GS, Grinchuk O,
Ivshina AV and Kuznetsov VA: Genome and transcriptome delineation
of two major oncogenic pathways governing invasive ductal breast
cancer development. Oncotarget. 6:36652–36674. 2015. View Article : Google Scholar : PubMed/NCBI
|
|
24
|
Carvalho BS and Irizarry RA: A framework
for oligonucleotide microarray preprocessing. Bioinformatics.
26:2363–2367. 2010. View Article : Google Scholar : PubMed/NCBI
|
|
25
|
Li WX, Dai SX, Wang Q, Guo YC, Hong Y,
Zheng JJ, Liu JQ, Liu D, Li GH and Huang JF: Integrated analysis of
ischemic stroke datasets revealed sex and age difference in
anti-stroke targets. PeerJ. 4:e24702016. View Article : Google Scholar : PubMed/NCBI
|
|
26
|
Li WX, Dai SX, Liu JQ, Wang Q, Li GH and
Huang JF: Integrated analysis of Alzheimer's disease and
schizophrenia dataset revealed different expression pattern in
learning and memory. J Alzheimers Dis. 51:417–425. 2016. View Article : Google Scholar : PubMed/NCBI
|
|
27
|
Ritchie ME, Phipson B, Wu D, Hu Y, Law CW,
Shi W and Smyth GK: limma powers differential expression analyses
for RNA-sequencing and microarray studies. Nucleic Acids Res.
43:e472015. View Article : Google Scholar : PubMed/NCBI
|
|
28
|
da Huang W, Sherman BT and Lempicki RA:
Systematic and integrative analysis of large gene lists using DAVID
bioinformatics resources. Nat Protoc. 4:44–57. 2009. View Article : Google Scholar : PubMed/NCBI
|
|
29
|
Greene CS, Krishnan A, Wong AK, Ricciotti
E, Zelaya RA, Himmelstein DS, Zhang R, Hartmann BM, Zaslavsky E,
Sealfon SC, et al: Understanding multicellular function and disease
with human tissue-specific networks. Nat Genet. 47:569–576. 2015.
View Article : Google Scholar : PubMed/NCBI
|
|
30
|
Liu Z, Zhan Y, Tu Y, Chen K, Liu Z and Wu
C: PDZ and LIM domain protein 1(PDLIM1)/CLP36 promotes breast
cancer cell migration, invasion and metastasis through interaction
with a-actinin. Oncogene. 34:1300–1311. 2015. View Article : Google Scholar : PubMed/NCBI
|
|
31
|
Dong H, Claffey KP, Brocke S and Epstein
PM: Inhibition of breast cancer cell migration by activation of
cAMP signaling. Breast Cancer Res Treat. 152:17–28. 2015.
View Article : Google Scholar : PubMed/NCBI
|
|
32
|
Cacace A, Sboarina M, Vazeille T and
Sonveaux P: Glutamine activates STAT3 to control cancer cell
proliferation independently of glutamine metabolism. Oncogene.
36:2074–2084. 2017. View Article : Google Scholar : PubMed/NCBI
|
|
33
|
Apostoli AJ, Roche JM, Schneider MM,
SenGupta SK, Di Lena MA, Rubino RE, Peterson NT and Nicol CJ:
Opposing roles for mammary epithelial-specific PPARg signaling and
activation during breast tumour progression. Mol Cancer. 14:852015.
View Article : Google Scholar : PubMed/NCBI
|
|
34
|
El-Rayes BF, Ali S, Heilbrun LK, Lababidi
S, Bouwman D, Visscher D and Philip PA: Cytochrome p450 and
glutathione transferase expression in human breast cancer. Clin
Cancer Res. 9:1705–1709. 2003.PubMed/NCBI
|
|
35
|
Leung T, Rajendran R, Singh S, Garva R,
Krstic-Demonacos M and Demonacos C: Cytochrome P450 2E1 (CYP2E1)
regulates the response to oxidative stress and migration of breast
cancer cells. Breast Cancer Res. 15:R1072013. View Article : Google Scholar : PubMed/NCBI
|
|
36
|
Davydov DR, Davydova NY, Rodgers JT,
Rushmore TH and Jones JP: Toward a systems approach to the human
cytochrome P450 ensemble: Interactions between CYP2D6 and CYP2E1
and their functional consequences. Biochem J. 474:3523–3542. 2017.
View Article : Google Scholar : PubMed/NCBI
|
|
37
|
Li Y, Steppi A, Zhou Y, Mao F, Miller PC,
He MM, Zhao T, Sun Q and Zhang J: Tumoral expression of drug and
xenobiotic metabolizing enzymes in breast cancer patients of
different ethnicities with implications to personalized medicine.
Sci Rep. 7:47472017. View Article : Google Scholar : PubMed/NCBI
|
|
38
|
Braak Ter B, Siezen CL, Lee JS, Rao P,
Voorhoeve C, Ruppin E, van der Laan JW and van de Water B:
Insulin-like growth factor 1 receptor activation promotes mammary
gland tumor development by increasing glycolysis and promoting
biomass production. Breast Cancer Res. 19:142017. View Article : Google Scholar : PubMed/NCBI
|
|
39
|
Shi J, Aronson KJ, Grundy A, Kobayashi LC,
Burstyn I, Schuetz JM, Lohrisch CA, SenGupta SK, Lai AS,
Brooks-Wilson A, et al: Polymorphisms of insulin-like growth factor
1 pathway genes and breast cancer risk. Front Oncol. 6:1362016.
View Article : Google Scholar : PubMed/NCBI
|
|
40
|
MacPherson L, Tamblyn L, Rajendra S,
Bralha F, McPherson JP and Matthews J:
2,3,7,8-Tetrachlorodibenzo-p-dioxin poly(ADP-ribose) polymerase
(TiPARP, ARTD14) is a mono-ADP-ribosyltransferase and repressor of
aryl hydrocarbon receptor transactivation. Nucleic Acids Res.
41:1604–1621. 2013. View Article : Google Scholar : PubMed/NCBI
|
|
41
|
McKay J, Tenet V, Franceschi S, Chabrier
A, Gheit T, Gaborieau V, Chopin S, Avogbe PH, Tommasino M, Ainouze
M, et al: Immuno-related polymorphisms and cervical cancer risk:
The IARC multicentric case-control study. PLoS One.
12:e01777752017. View Article : Google Scholar : PubMed/NCBI
|
|
42
|
Maltepe E, Keith B, Arsham AM, Brorson JR
and Simon MC: The role of ARNT2 in tumor angiogenesis and the
neural response to hypoxia. Biochem Biophys Res Commun.
273:231–238. 2000. View Article : Google Scholar : PubMed/NCBI
|
|
43
|
Qin XY, Wei F, Yoshinaga J, Yonemoto J,
Tanokura M and Sone H: siRNA-mediated knockdown of aryl hydrocarbon
receptor nuclear translocator 2 affects hypoxia-inducible factor-1
regulatory signaling and metabolism in human breast cancer cells.
FEBS Lett. 585:3310–3315. 2011. View Article : Google Scholar : PubMed/NCBI
|
|
44
|
Yang E, Hu XF and Xing PX: Advances of
MUC1 as a target for breast cancer immunotherapy. Histol
Histopathol. 22:905–922. 2007.PubMed/NCBI
|
|
45
|
Varga Z, Lebeau A, Bu H, Hartmann A,
Penault-Llorca F, Guerini-Rocco E, Schraml P, Symmans F, Stoehr R,
Teng X, et al: An international reproducibility study validating
quantitative determination of ERBB2, ESR1, PGR, and MKI67 mRNA in
breast cancer using MammaTyper®. Breast Cancer Res.
19:552017. View Article : Google Scholar : PubMed/NCBI
|
|
46
|
Putluri N, Maity S, Kommagani R, Creighton
CJ, Putluri V, Chen F, Nanda S, Bhowmik SK, Terunuma A, Dorsey T,
et al: Pathway-centric integrative analysis identifies RRM2 as a
prognostic marker in breast cancer associated with poor survival
and tamoxifen resistance. Neoplasia. 16:390–402. 2014. View Article : Google Scholar : PubMed/NCBI
|
|
47
|
Shah KN, Wilson EA, Malla R, Elford HL and
Faridi JS: targeting ribonucleotide reductase M2 and NF-κB
activation with didox to circumvent tamoxifen resistance in breast
cancer. Mol Cancer Ther. 14:2411–2421. 2015. View Article : Google Scholar : PubMed/NCBI
|
|
48
|
Hiraki M, Maeda T, Bouillez A, Alam M,
Tagde A, Hinohara K, Suzuki Y, Markert T, Miyo M, Komura K, et al:
MUC1-C activates BMI1 in human cancer cells. Oncogene.
36:2791–2801. 2017. View Article : Google Scholar : PubMed/NCBI
|
|
49
|
Raina D, Uchida Y, Kharbanda A, Rajabi H,
Panchamoorthy G, Jin C, Kharbanda S, Scaltriti M, Baselga J and
Kufe D: Targeting the MUC1-C oncoprotein downregulates HER2
activation and abrogates trastuzumab resistance in breast cancer
cells. Oncogene. 33:3422–3431. 2014. View Article : Google Scholar : PubMed/NCBI
|
|
50
|
Ishizawar RC, Miyake T and Parsons SJ:
c-Src modulates ErbB2 and ErbB3 heterocomplex formation and
function. Oncogene. 26:3503–3510. 2007. View Article : Google Scholar : PubMed/NCBI
|
|
51
|
Dominguez-Brauer C, Thu KL, Mason JM,
Blaser H, Bray MR and Mak TW: Targeting mitosis in cancer: Emerging
strategies. Mol Cell. 60:524–536. 2015. View Article : Google Scholar : PubMed/NCBI
|
|
52
|
Chen L, Jenjaroenpun P, Pillai AM, Ivshina
AV, Ow GS, Efthimios M, Zhiqun T, Tan TZ, Lee SC, Rogers K, et al:
Transposon insertional mutagenesis in mice identifies human breast
cancer susceptibility genes and signatures for stratification. Proc
Natl Acad Sci USA. 114:E2215–E2224. 2017. View Article : Google Scholar : PubMed/NCBI
|