Introduction
Autism spectrum disorder (ASD) is a
neurodevelopmental and network-level disorder characterized by
impaired development of social interaction, communication skills
and a restricted repertoire of activities and interests (1). In 2014, the Centers for Disease Control
and Prevention (CDCP) estimated that 1 in 68 children were
identified with ASD in the United States, an increase of ~30%
compared with previous estimates of 1 in 88 children identified
with ASD in 2012 (2,3). In 2014, China's Health and Family
Planning Commission reported that an estimated 41,000 children aged
0–6 years were identified with ASD (4). ASD mostly affects language, social
communication, motor behaviors and sensory systems (5). Therefore, parents/guardians of children
with ASD should consult with pediatric specialists as early as
possible, to begin rehabilitation and avoid abuse of diagnosis
(6). Currently, the diagnosis of
children with ASD is based mostly on behavioral phenotypes
(7), which include Autism Diagnostic
Interview-Revised (ADI-R) (8),
Autism Diagnostic Observation Schedule (ADOS) (9) and the Diagnostic and Statistical Manual
of Mental Disorders, Fourth Edition-Text Revision (10). In the United States, only 8% of
pediatric specialists capable of conducting ASD screening and
diagnosis routinely evaluate toddlers for autism (11). In 2014, China's Health and Family
Planning Commission reported that there were ≤100 doctors
nationwide trained in diagnosing autism (4). Additionally, the majority of ASD
diagnostic tools are not available for use in school-age children.
Thus, there is an urgent need for auxiliary diagnosis tools, which
may aid to distinguish children with ASD from those typically
developing (TD), in particular school-aged children.
Currently, there are several commonly used
diagnostic methods and auxiliary diagnostic tools, which include
diagnostic methods based on language, behavior, genes, animal
models and/or functional magnetic resonance imaging (fMRI) data
(12). With the development of
interdisciplinary technology, a diagnostic method based on
multi-modulus data and machine learning has become popular in
recent years (13–16). One of the most effective methods is
based on brain frequency and machine learning (14,15,17–19). Zuo
et al (20) proposed a
concept of brain frequency band and divided the brain frequency
band into four frequency sub-bands Slow-2 (0.198–0.25 Hz), Slow-3
(0.073–0.198 Hz), Slow-4 (0.027–0.073 Hz) and Slow-5 (0.01–0.027
Hz). Other studies also demonstrated that the method of diagnosing
autism based on brain frequency was possible (21–24).
These studies also demonstrated that different brain frequency
bands revealed different properties and physiological functions and
they hypothesized that these could be the ‘fingerprints’ of
neuronal activity (25). However,
these investigations based on brain frequencies demonstrated
limited use for the classification of children with ASD and those
TD. In addition, the accuracy of classification decreased when the
fMRI data was obtained from a single institution (19). Chen et al (19) used fMRI data from multiple
institutions to distinguish ASD from TD and demonstrated a 74%
diagnostic accuracy when using two frequency bands compared with a
69% diagnostic accuracy when using only one frequency band. The
heterogeneity and complexity of ASD has impaired the research of
ASD in children (26). Therefore,
methods based on one frequency band and traditional machine
learning cannot be used for the auxiliary diagnosis of ASD. Full
brain frequency bands contain more information, however they also
have some noise, such as physiological noise (20). The stacked auto-encoders (SAE) deep
learning framework is a neural network consisting of multiple
layers and it can extract important features from input data
(27). In the current study, an
advanced deep learning method based on SAE, full frequency bands
and multi-institutional fMRI data was used to distinguish
school-aged children with ASD from those TD. The current study
examined large fMRI datasets of 198 school-aged children from three
different institutions obtained from the Autism Brain Imaging Data
Exchange (ABIDE) II database (fcon_1000.projects.nitrc.org/indi/abide/index.html)
(28) and demonstrated relatively
high classification accuracy compared with previous studies
(16,19,29–31).
Materials and methods
Data collection
Original fMRI datasets of 198 school-aged children
(5–12 years) were downloaded from the ABIDE II database, which was
released in June 2016 and enables unrestricted use for
non-commercial purposes. The current study was approved by the
Ethics Committee of Nanchang University (Nanchang, China).
Patient charts
The current study used original fMRI datasets of
school-aged children obtained from the New York University Langone
Medical Center (New York, NY, USA), Georgetown University
(Washington, DC, USA) and the Kennedy Krieger Institute (Baltimore,
MD, USA). For each participant, a high-resolution structural MRI
sequence was acquired using different MRI scanners with different
parameters, as well as a resting-state fMRI sequence using
different MRI scanners with different parameters. The names of the
three different institutions and the different fMRI scanning
parameters are summarized in Table
I.
 | Table I.fMRI scanning parameters and
settings. |
Table I.
fMRI scanning parameters and
settings.
| Institution | MRI
manufacturer | TR (msec) | TE (msec) | Voxel
(mm3) | Slices | Scan time
(min) | Eyes |
|---|
| Georgetown
University | Siemens AG, Munich,
Germany | 2,000 | 30 | 3.00×3.00×2.50 | 43 | 5.23 | Open |
| Kennedy Krieger
Institute | Philips Medical
Systems, Inc., Bothell, WA, USA | 2,500 | 30 | 2.67×2.67×3.00 | 47 | 6.67 | Open |
| New York
University | Siemens AG, Munich,
Germany | 2,000 | 30 | 3.00×3.00×3.00 | 34 | 6.00 | Open |
| Langone Medical
Center |
|
|
|
|
|
|
|
All participants were diagnosed according to the
score obtained in both the ADI-R and the ADOS. The TD participants
were screened during clinical interviews conducted by child
psychiatrists and details of the diagnostic procedures and
questionnaires are listed in the ABIDE II database (28). According to age, sex and full-scale
intelligence quotient (FIQ), 117 participants with ASD (minimum
age, 5.22 years; maximum age, 11.99 years; mean age [standard
deviation (SD)], 9.32 [5.62] years; FIQ [SD], 107.87 [15.26]) and
81 age- and FIQ-matched TD participants [minimum age, 5.88 years;
maximum age, 11.95 years; mean age (SD), 9.67 (5.31); mean FIQ
(SD), 109.40 (15.12)] were selected from the datasets obtained from
New York University Langone Medical Center, Georgetown University
and the Kennedy Krieger Institute. Demographic data for the
selected participants are summarized in Table II.
| Table II.Demographic data of ASD and TD
participants. |
Table II.
Demographic data of ASD and TD
participants.
| Participant
group | Patients (n) | Male/female
ratio | Minimum age,
years | Maximum age,
years | Mean age, years
(SD) | Mean FIQ (SD) |
|---|
| ASD | 117 | 93/24 | 5.22 | 11.99 | 9.32 (5.62) | 107.87 (15.26) |
| TD | 81 | 57/24 | 5.88 | 11.95 | 9.67 (5.31) | 109.40 (15.12) |
Resting-state fMRI data
preprocessing
Resting-state fMRI preprocessing was performed using
the multivariate exploratory linear optimized decomposition into
independent components (MELODIC; version 3.14), a tool of FMRIB
Software Library (FSL) software packages (32). Data preprocessing included head
motion correction slice timing correction, removal of non-brain
tissues, and spatial normalization into MNI152 space using
nonlinear registration and spatial smoothing using 6 mm full width
half maximum Gaussian kernel. Currently, the prediction of autism
using brain networks involves examining functional connectivity in
10 functional networks using independent component analysis
(33). A previous study identified
30 independent components (ICs) corresponding to 10 previously
described functional networks (34).
By contrast, several studies revealed that the number of ICs
increases to 50, additionally the time of fMRI data decomposition
increases exponentially and the dimension of obtaining brain
frequency signals also increases (26,35).
High-dimensional brain signals will directly make the neural node
of the deep learning algorithm increase, which will also increase
the training time of the system. Therefore, each participant's data
were decomposed into 30 ICs using MELODIC (36).
Frequency selection and
normalization
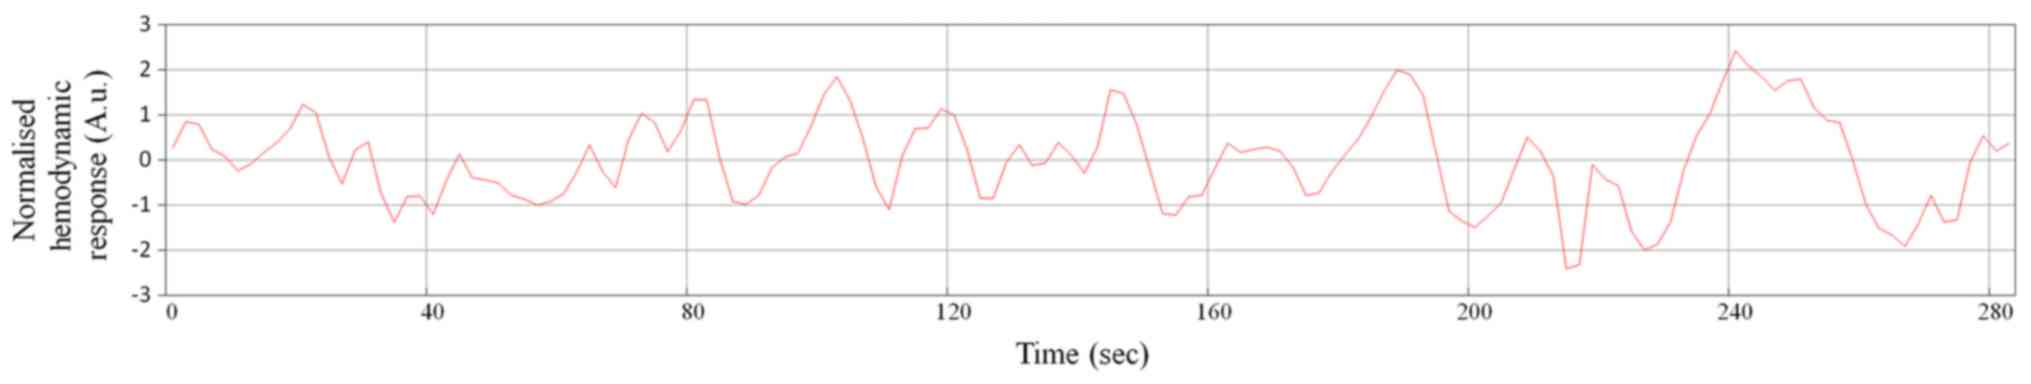
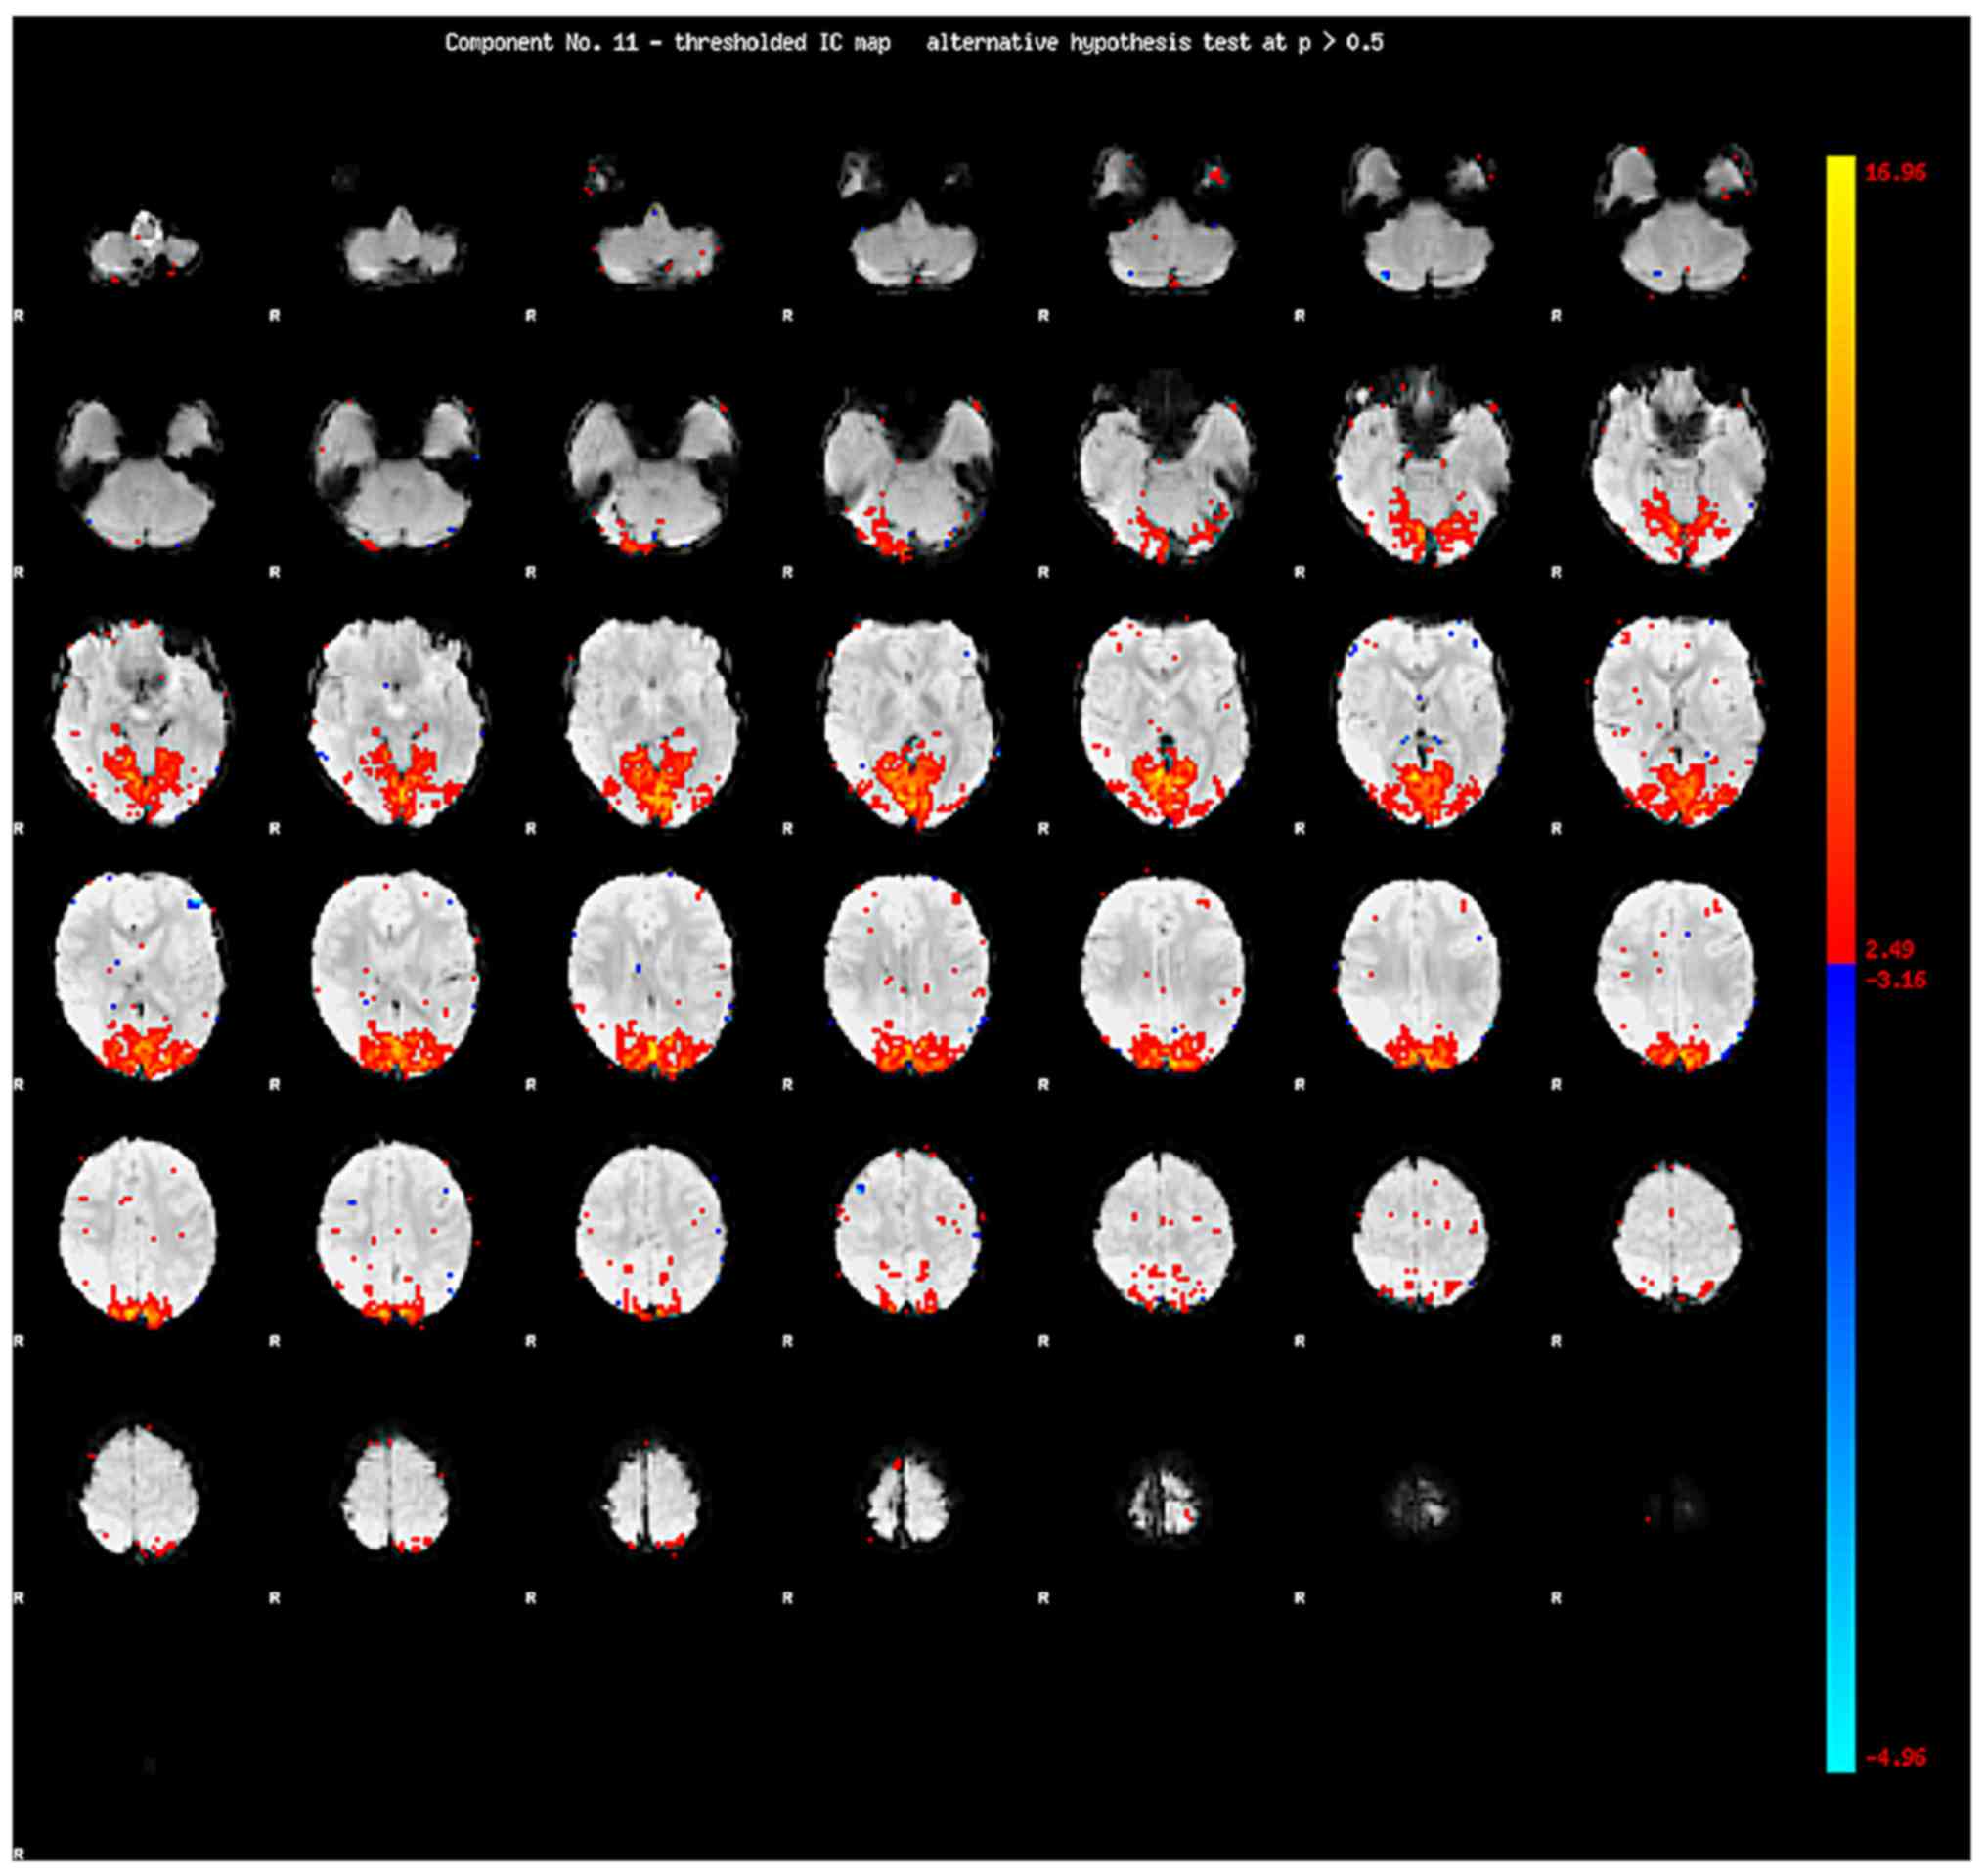
Following IC decomposition using MELODIC version
3.14, the time serial, the power spectrum and the spatial map are
generated for each IC (Figs.
1–3). MELODIC can generate the
ICs on one spatial map followed by the relevant time serial of the
IC and the power spectrum of the time serial. The power spectrum is
an expression of brain frequency power distribution. The full brain
frequency was divided into 5 different bands: Slow-6 (0–0.01 Hz),
Slow-5 (0.01–0.027 Hz), Slow-4 (0.027–0.073 Hz), Slow-3
(0.073–0.198 Hz) and Slow-2 (>0.198 Hz). The power spectra of 30
ICs for each participant contain the information of each
sub-frequency band in the network. In order to get more
information, all ICs were selected in a data-driven manner although
some ICs may contain useless information such as noise. All ICs
with full brain frequency were selected according to the frequency
ranges, although some ICs may contain low frequency drifting and
noise.
For each participant, a time-series of all ICs were
reshaped into a feature array with the same dimension. The feature
array was normalized in the range of (0,1) using Max-Min
normalization before it was input into the SAE-based
classifier.
SAE-based classification
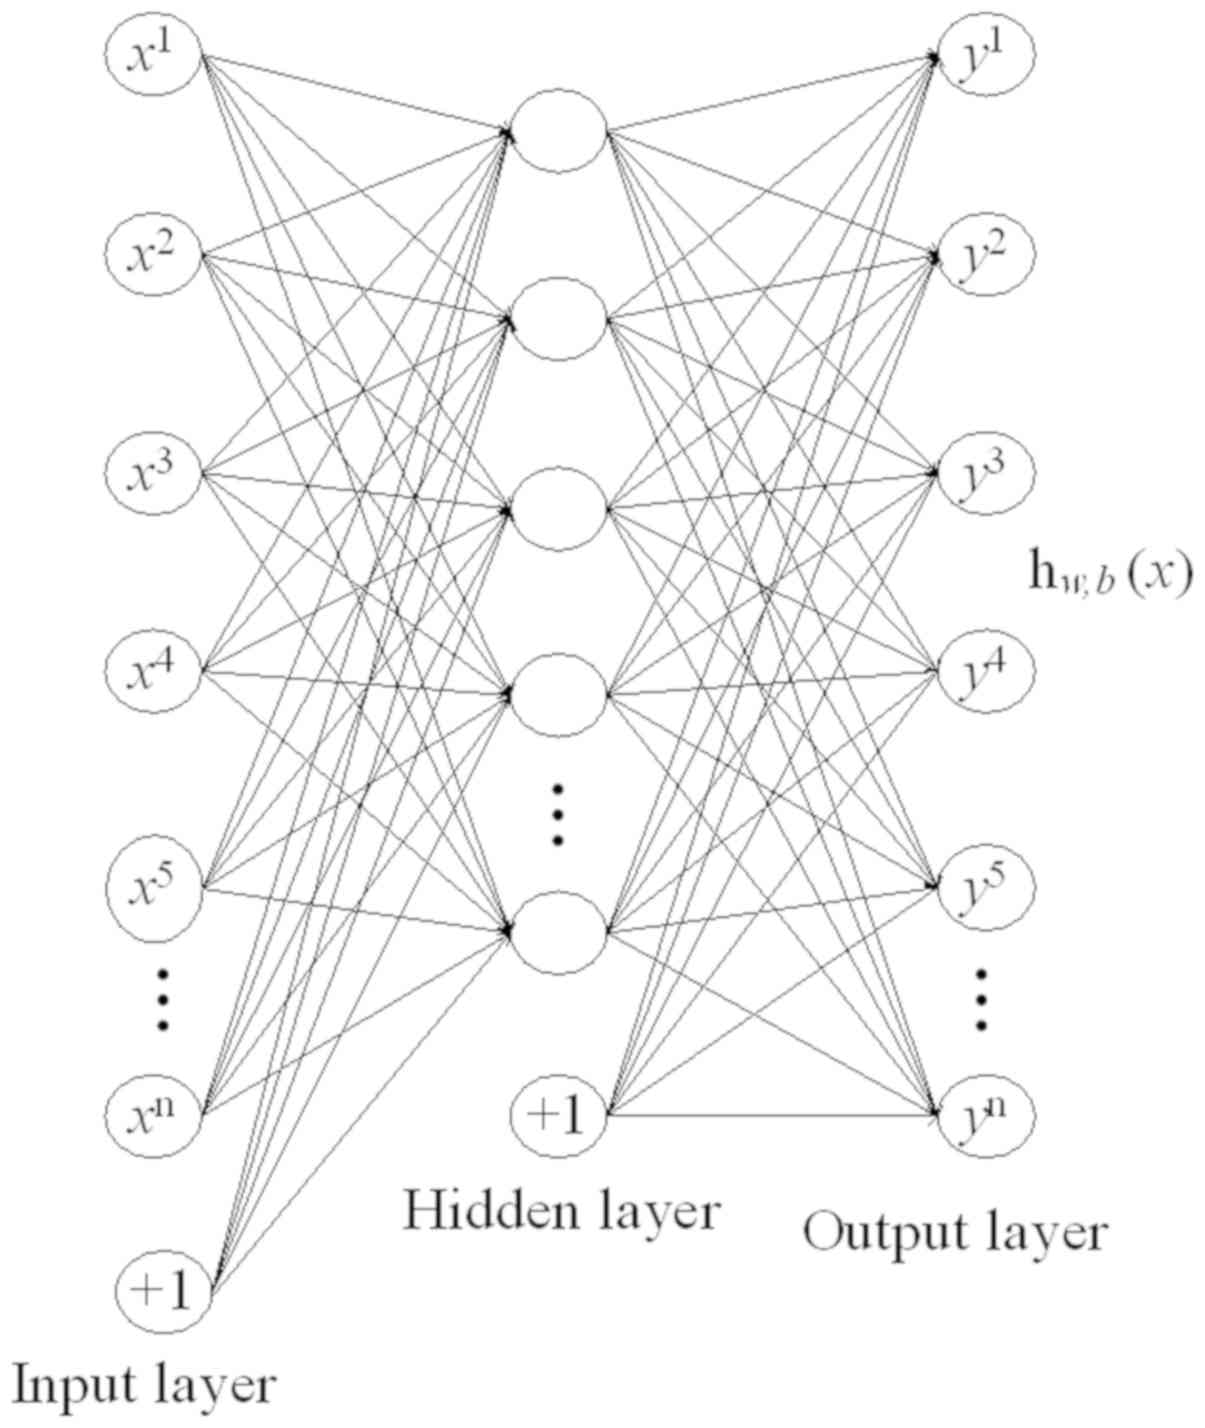
In general, a sparse auto-encoder (AE) is used for
feature extraction and dimensionality reduction. The sparse AE is a
framework of unsupervised learning method, and SAE is a neural
network consisting of multiple layers of sparse AE, where the
output of each layer is connected to the input of each successive
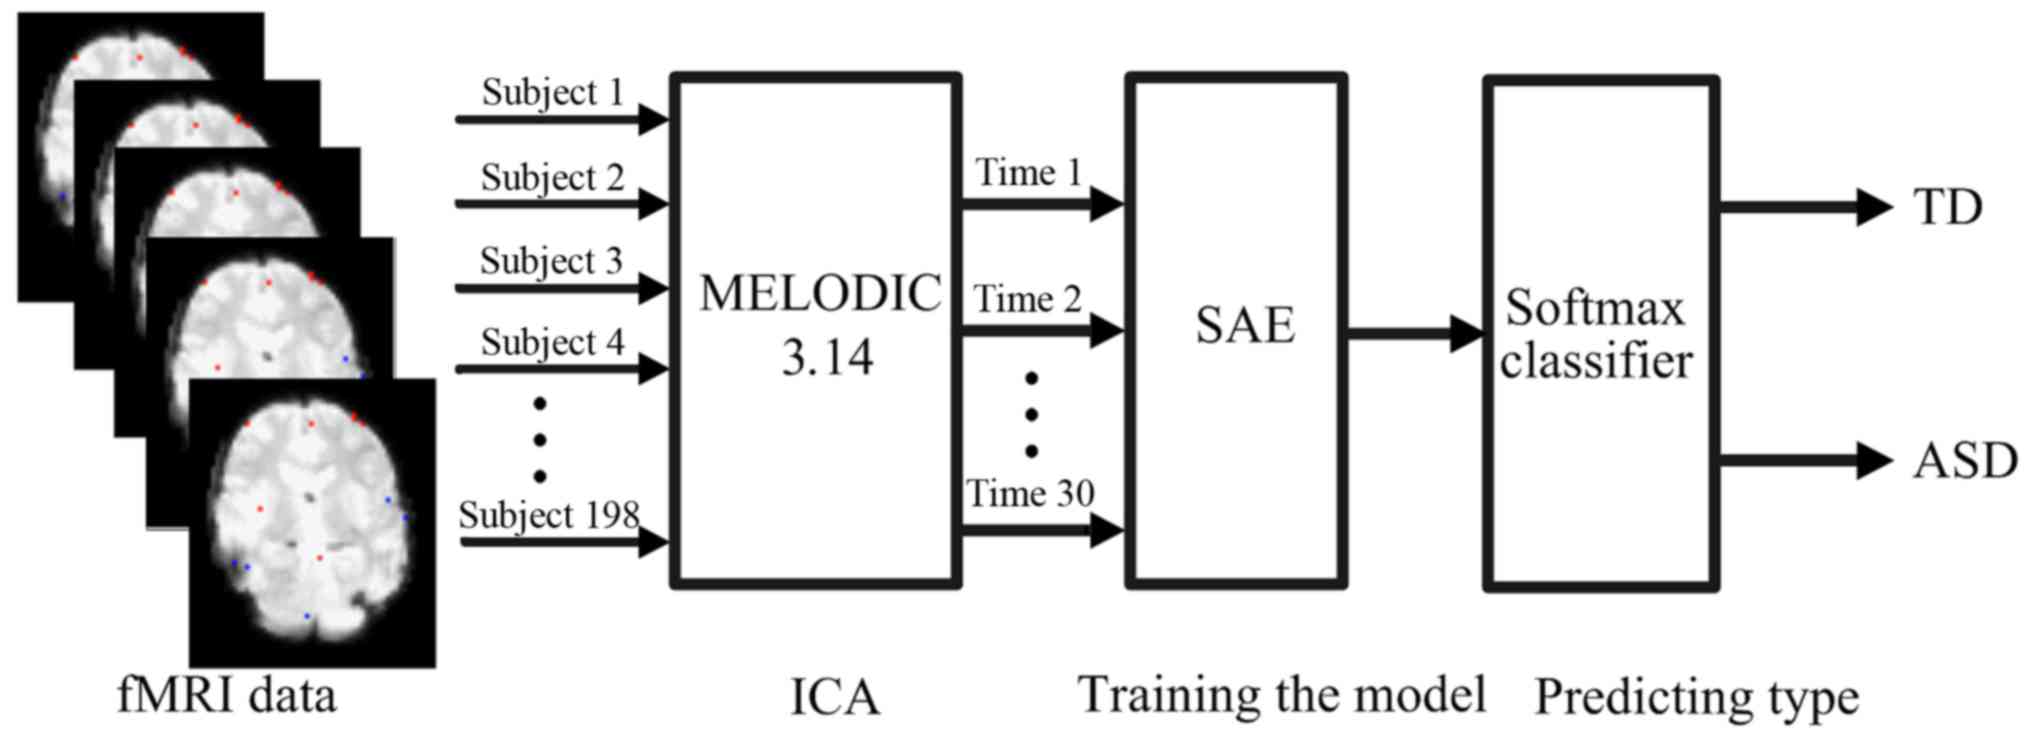
layer (35). A softmax classifier is
used for phase classification, a supervised learning approach
(37). SAE and softmax classifier
were integrated into the proposed computer-aided diagnosis method,
as shown in Fig. 4. AE is a key
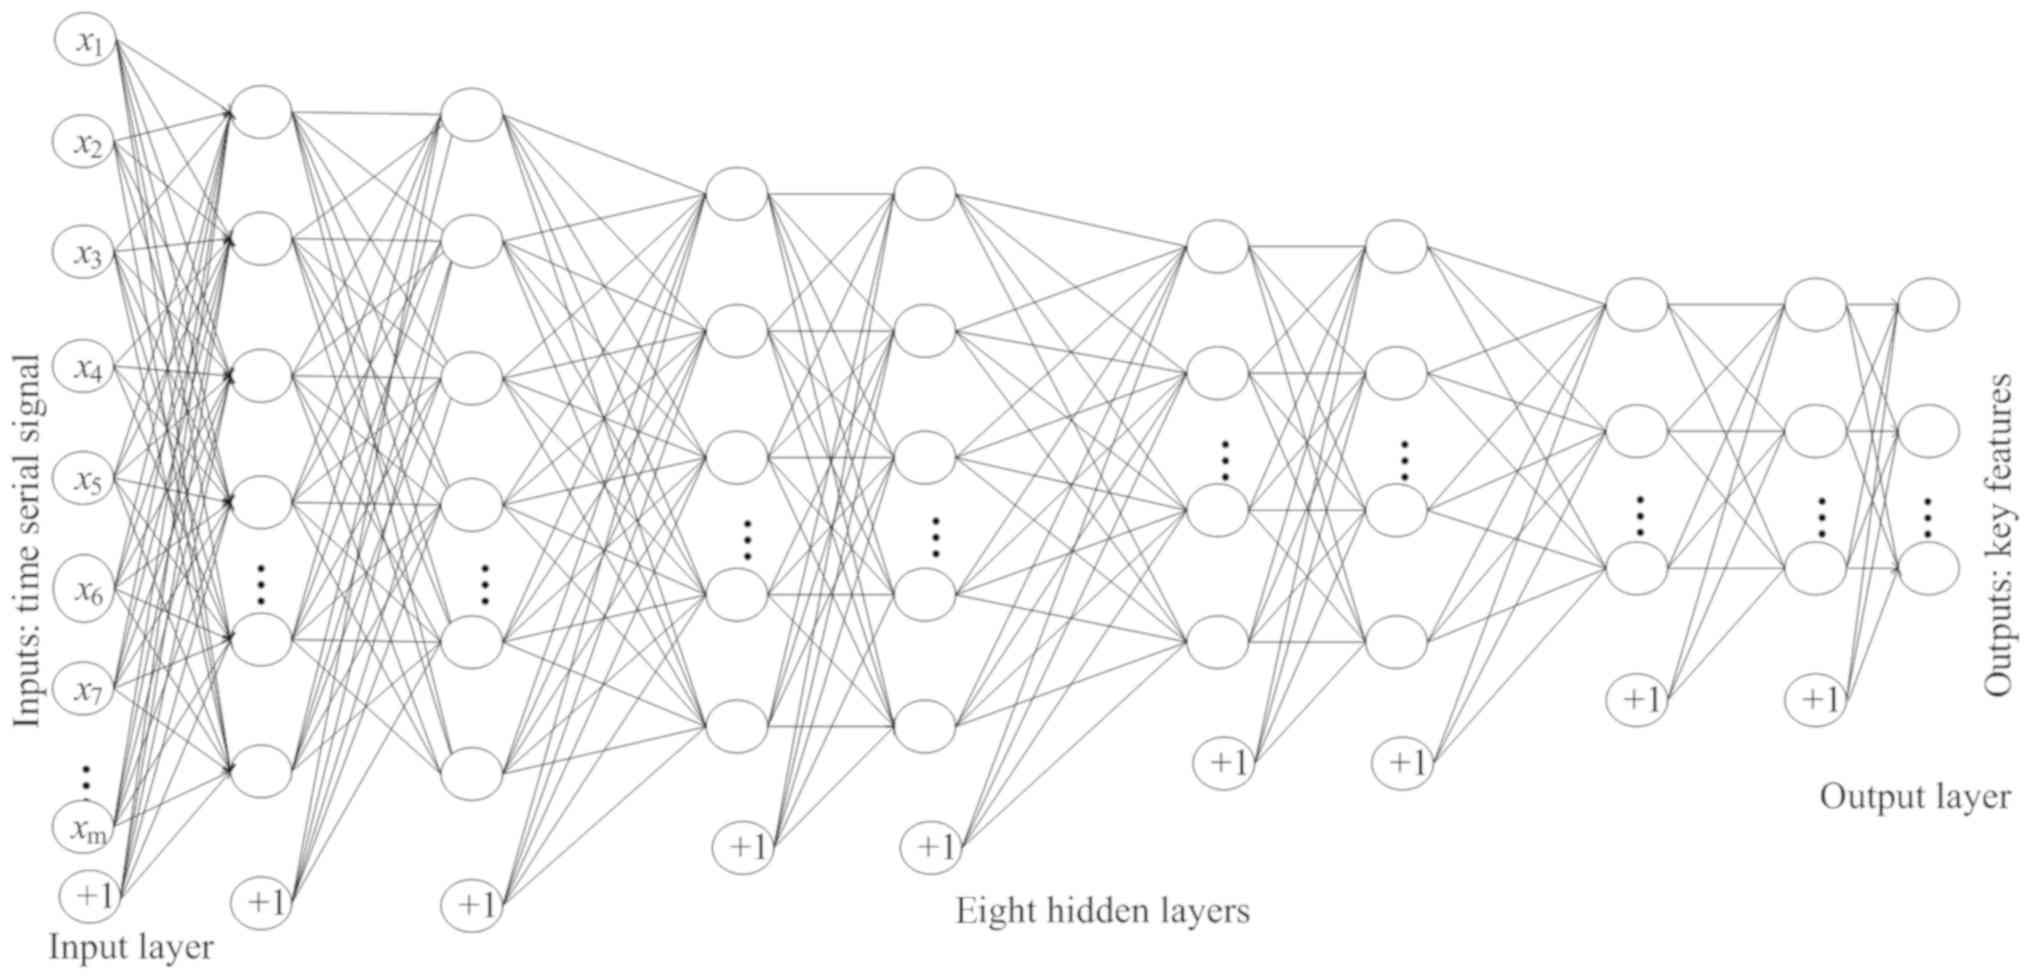
substructure of the SAE, with a symmetrical architecture (Fig. 5). The outputs of each layer in SAE
were wired to the inputs of the successive layer. As shown in
Fig. 6, the structure of the
enhanced SAE proposed in the current study contains 10 layers: An
input layer, 8 hidden layers and an output layer. The 8 hidden
layers were divided into 4 groups, each with 2 hidden layers. The
numbers of nodes in each of the 4 groups were as follows: 1,280,
320, 80 and 20.
The i-th activation unit
a(l)i of the l-th layer
can be represented by the sl−1 units of
(l−1)-th layer through the weight parameter set w, a
bias term set b and an activation function f as shown
below in Equations 1 and 2:
zi(l)=∑j=1nWij(l-1)aj(l-1)+bi(l-1)
ai(l)=f(zi(l))
[n=number of units in the (l-1)-th
layer, f(•) was chosen as the sigmoid function].
Given a training dataset with m samples,
{(x(1),
y(1)),…,(x(m),
y(m))} where y(i)
was the category label of i-th sample,
y(i) ϵ {1, 2,…,k}, for the first
layer, the activation units were the input data (i.e.
a(1)i=xi).
AE enabled the output values to gradually approach the input values
by applying a back propagation algorithm. Therefore, the goal of AE
was to minimize the distance between the inputs and outputs to
learn w and b. So the cost function was computed as
shown below in Equation 3:
J(W,b)=[1m∑i=1m(12‖hw,b(x(i))-y(i)‖2)]+λ2∑l=1nl-1∑i=1sl∑j=1sl+1(Wji(l))2
[m was the number of training samples,
nl (nl=3) was the number of
layers, sl was the number of units in the
l-th layer and λ was the weight decay parameter]. In
equation 3, the first term was the mean square error between input
and output values, representing the quality of learning, while the
second term was a regularization term that tends to decrease the
magnitude of the weights and to prevent the learning from
overfitting.
To ensure that the outputs of the hidden layer are
desirably sparse, a sparsity constraint must be introduced into the
cost function to control the learning process. So the average
activation of the j-th hidden unit was defined as (with
respect to input x) as shown below in Equation 4:
ρˆj=1m∑i=1m(aj(2)(xi))
If ρ̂j was small (close to 0.01),
most of the units of the hidden layer should be inactive. To force
ρ̂j to be equal to a very small value ρ,
the sparsity penalty term was designed based on the concept of
Kullback-Leibler divergence, as shown below in Equation 5:
KL(ρ‖ρˆj)=ρlogρρˆj+(1-ρ)log1-ρ1-ρˆj
Subsequently, the sparsity penalty term was
incorporated into the cost function, as shown below in Equation
6:
Jsparse(W,b)=J(W,b)+β∑jKL(ρ‖ρˆj)
(β was the weight of sparsity penalty term).
During the process of learning, the cost function
Jsparse (W, b) was minimized by updating
w and b. As presented in (31), limited-memory BFGS (L-BFGS) was a
suitable optimization algorithm for updating w and b
in the process of back propagation. In the current study, L-BFGS
was adopted, and the softmax regression model was used to classify
school-aged children with ASD and TD. After data preprocessing, the
time serial matrix was input into the multi-layer SAE, and the
output values from the SAE were input into the softmax classifier.
The current study used MELODIC (version 3.14), an analysis tool
used to decompose each participant's fMRI data into ICs. The
time-series was extracted from each IC, and used to generate a
vector time-series of each participant with 30 time-series.
Similarly, the system was used to obtain 198 vector time-series,
and all vector time-series were normalized to the same dimension in
order to build a matrix. The matrix was divided into training
matrix and test matrix according to the different fold
cross-validation (CV). The training matrix was input into the SAE
for optimization training. Finally, the trained multi-layer SAE and
softmax classifier were used to classify participants of the
testing matrix. In this cycle, multiple test results can be
obtained. In the current study, the classification accuracy of all
subjects was computed using a CV. For example, in the 198-fold CV,
the original samples are randomly partitioned into 198 groups, with
each group including one participant. Of the 198 groups, 197 groups
(197 participants) were chosen as the training set, and the
remaining one participant was used as the test data. The validation
was repeated 198 times such that each participant was used exactly
once as the test data. Averaging the 198 results during the
validation produced the final estimation. The classification
statistical indicators included true positive (TP), false negative
(FN), true negative (TN) and false positive (FP) values. The
parameters of accuracy, sensitivity, specificity, positive
prediction value (PPV) and negative prediction value (NPV) were
computed using the following formulae:
Accuracy=(TP+TN)/(TP+TN+FP+FN) ×100% (7); sensitivity=TP/(TP+FN) ×100% (8); specificity=TN/(TN+FP) ×100% (9); PPV=TP/(TP+FP) ×100% (10); and NPV=TN/(TN+FN) ×100% (11).
The sensitivity measured the proportion of positive
results that were correctly identified. Specificity measured the
proportion of negative results that were correctly identified, or
the percentage of TD children who were correctly identified as TD.
The whole process was performed using Dell Precision T5810 (CPU:
Xeon (R), 3.5 GHz; MM: 128 GB; OS: 64-bit Windows 10 professional
edition) and Matlab R2012a (7.14.0.739, 64 bits) was used to run
the multi-layer SAE and softmax regression algorithm. The specific
algorithm settings including, the weight decay, sparsity penalty
term, weight of sparsity term and the number of nodes, are
summarized in Table III.
| Table III.Algorithm parameter values used in
the 8 hidden layers. |
Table III.
Algorithm parameter values used in
the 8 hidden layers.
| Hidden layer | Weight decay | Sparsity penalty
term | Weight of sparsity
penalty term | Number of node |
|---|
| No. 1, 2 |
1×10⁻⁸ | 0.01 | 3 | 1,280 |
| No. 3, 4 |
1×10⁻⁸ | 0.01 | 3 | 320 |
| No. 5, 6 |
1×10⁻⁸ | 0.01 | 3 | 80 |
| No. 7, 8 |
1×10⁻⁸ | 0.01 | 3 | 20 |
Results
In the current study, the classification accuracy
was evaluated using CV. The classifier assigned a label (ASD=1,
TD=2) to each participant, and the total accuracy was computed for
each category. The accuracy, specificity, sensitivity, PPV and NPV
for each CV are summarized in Table
IV.
| Table IV.Cross-validation classification
accuracy analysis. |
Table IV.
Cross-validation classification
accuracy analysis.
| Parameter | 11-fold (%) | 33-fold (%) | 66-fold (%) | 99-fold (%) | 198-fold (%) | Average, %
(SD) |
|---|
| Accuracy | 94.19 | 93.69 | 98.99a | 97.47 | 96.97 | 96.26 (2.02) |
| Specificity | 87.04 | 87.23 | 100a | 96.30 | 97.53 | 93.62 (5.43) |
| Sensitivity | 99.15a | 97.86 | 98.29 | 98.29 | 96.58 | 98.03 (0.84) |
| PPV | 91.70 | 91.97 | 100a | 97.46 | 98.26 | 95.88 (3.40) |
| NPV | 98.60a | 96.60 | 97.59 | 97.50 | 95.18 | 97.09 (1.15) |
With the same 198 subject data and 198-fold CV, the
SAE, probabilistic neural network (PNN) and support vector machine
(SVM) algorithms achieved 96.97, 84.58 and 83.69% accuracy,
respectively (Table V). Therefore,
the proposed SAE with 8 hidden layers of the current study was more
accurate than other machine learning algorithms. These results
demonstrated that the SAE algorithm was a more effective method for
the analysis and processing of data in the current study. In
addition, the 66-fold CV results revealed that the proposed SAE
algorithm produced a better balance between the classification
accuracy and computation time compared with SAE algorithms with
different numbers of hidden layers (data not shown). The average
accuracy obtained using the SAE algorithm with 6, 8 and 10 hidden
layers was 93.69, 98.99 and 95.90%, respectively (data not shown).
However, the computation time taken for SAE algorithms with 6, 8
and 10 numbers of hidden layers was 70,018, 68,588 and 75,891 sec,
respectively (data not shown). In conclusion, increasing the number
of hidden layers did not improve the accuracy of the SAE algorithm,
however the running time increased. These results suggest that the
SAE algorithm with 8 hidden layers can balance the classification
accuracy and running time.
| Table V.Comparison of classification accuracy
of three different algorithms. |
Table V.
Comparison of classification accuracy
of three different algorithms.
|
| Stacked
auto-encoders (%) | Probabilistic
neural network (%) | Support vector
machine (%) |
|---|
| Accuracy | 96.97 | 84.58 | 83.69 |
The current study used a novel deep learning method
with full brain frequency, to generate a higher diagnostic accuracy
(96.26%), with increased sensitivity (98.03%) and specificity
(93.62%). Furthermore, the accuracy classification analysis of the
current study was compared with previously published studies
(Table VI). The results
demonstrated that the classification accuracy was ~15% higher in
the current study compared with previous studies, where only one or
two frequency bands were used (19,33,38–40).
| Table VI.Comparison between the classification
accuracy analysis obtained in the current study and previously
published studies. |
Table VI.
Comparison between the classification
accuracy analysis obtained in the current study and previously
published studies.
| Author, year | Functional
networks | Accuracy (%) | Sensitivity
(%) | Specificity
(%) | PPV (%) | NPV (%) | (Refs.) |
|---|
| Current study |
| 96.26 | 98.03 | 93.62 | 95.88 | 97.09 | – |
| Uddin et al,
2013 | Salience | 78.00 | 75.00 | 80.00 | 79.00 | 76.00 | (33) |
|
| Central
executive | 58.00 | 55.00 | 60.00 | 58.00 | 57.00 | (33) |
|
| Posterior default
mode | 63.00 | 65.00 | 60.00 | 62.00 | 63.00 | (33) |
|
| Ventral default
mode | 60.00 | 55.00 | 65.00 | 61.00 | 59.00 | (33) |
|
| Anterior default
mode | 63.00 | 50.00 | 75.00 | 67.00 | 60.00 | (33) |
|
| Motor | 68.00 | 60.00 | 75.00 | 71.00 | 65.00 | (33) |
|
| Visual
association | 65.00 | 65.00 | 65.00 | 65.00 | 65.00 | (33) |
|
| Dorsal
attention | 73.00 | 75.00 | 70.00 | 71.00 | 74.00 | (33) |
|
| Primary visual | 73.00 | 60.00 | 85.00 | 80.00 | 68.00 | (33) |
|
| Frontotemporal | 68.00 | 60.00 | 75.00 | 71.00 | 65.00 | (33) |
| Anderson et
al, 2011 (subject <20 years) |
| 89.00 | 83.00 | 95.00 | – | – | (38) |
| Chen et al,
2016 (NYU dataset) |
| 80.00 | 95.00 | 72.00 | – | – | (19) |
| Chen et al,
2016 (UM dataset) |
| 84.00 | 69.00 | 94.00 | – | – | (19) |
| Chen et al,
2016 (USM dataset) |
| 80.00 | 80.00 | 80.00 | – | – | (19) |
| Iidaka, 2015
(50-fold CV) |
| 90.30 | 92.30 | 88.40 | 88.30 | 92.40 | (40) |
| Iidaka, 2015
(10-fold CV) |
| 86.90 | 85.90 | 87.80 | 87.00 | 86.70 | (40) |
| Iidaka, 2015
(2-fold CV) |
| 77.20 | 75.00 | 79.30 | 77.50 | 76.90 | (40) |
Discussion
In the current study, the proposed SAE
algorithm-based classification system was generated using all
frequency bands using multi-institutional fMRI datasets to produce
high classification accuracy to distinguish school-aged children
(5–12 years) with ASD from those TD. The present study examined an
auxiliary method to distinguish ASD with high sensitivity and
specificity, which was considered as an entirely hypothesis-free
and data-driven method. In a previous study, ASD (12–42 years) and
TD (8–39 years) participants were classified with relatively low
accuracy (38). As ASD is an early
onset disorder with variable developmental trajectory, Uddin et
al (33) used a network-based
classification method to predict children (7–13 years) with ASD and
those TD. Although Uddin et al (33) examined 10 whole-brain functional
networks (salience, central executive, posterior default mode,
ventral default mode, anterior default mode, dorsal attention,
motor, visual association, primary visual and frontotemporal), the
salience network was the only network, which demonstrated good
classification accuracy. In the current study, several other brain
networks were integrated, and the classification accuracy was
increased compared with single brain network classification as
demonstrated by Uddin et al (33). Another study classifying ASD and TD
participants through a default network only achieved a relatively
low accuracy compared with the current study (39). Although previous studies gained some
success in mechanism research, previous studies used relatively low
numbers of participants and the results were based on single brain
networks only. However, the data-driven method used in the current
study used a bigger dataset, and attained a higher accuracy by not
only integrating single brain networks, but also measuring the
joint effect of several brain networks. In 2015, Iidaka (40) used a PNN approach on 640 participants
to distinguish between ASD and TD, with relatively high
accuracy.
Following a comparison with previously published
studies using PNN and SVM methods, the current study revealed that
the SAE algorithm achieved a higher classification accuracy
compared with traditional machine learning algorithm. In 2016, Chen
et al (19) used SVM to
distinguish between ASD and TD, and obtained relatively low
classification accuracy. Although Chen et al (19) and Iidaka (40) used larger datasets, which were
obtained from the same database, the 2 classification algorithms
(SVM and PNN) demonstrated less accuracy compared with the current
study. The differences in methodology between the SAE and SVM/PNN
algorithms may account for the differences observed in
classification accuracy of the above-mentioned studies and the
current study.
In conclusion, a deep learning based approach was
used to successfully distinguish 198 school-aged children with ASD
from those TD, using a data-driven method with high accuracy of
96.30%. Taken together, these results demonstrate the potential
clinical application of ASD diagnostic tools in school-aged
children with ASD.
Acknowledgements
The authors would like to thank the researchers and
funding agencies that contributed to the ABIDE II database.
Funding
The current study was funded by grants from The
Natural Science Foundation of China (grant nos. 61662047 and
61463035).
Availability of data and materials
All datasets used and/or analyzed during the
current study are available from the corresponding author in
reasonable request. In addition, the original functional magnetic
resonance imaging datasets can be obtained from the Autism Brain
Imaging Data Exchange II database (fcon_1000.projects.nitrc.org/indi/abide/index.html).
Authors' contributions
ZX designed the experiment, analyzed the functional
magnetic resonance imaging (fMRI) data, interpreted the results and
prepared the manuscript. JW and CW contributed significantly to the
conception and design of the work, and were involved in the
collection and interpretation of data. XY prepared all the figures
in the manuscript and detected the stacked auto-encoders algorithm.
NJ performed the preprocessing of the fMRI data. All authors read
and approved the final manuscript.
Ethical approval and consent to
participate
The current study was approved by the Ethics
Committee of Nanchang University. In addition, the ABIDE II
database allows unrestricted use for non-commercial purposes.
Patient consent for publication
Not applicable.
Competing interests
The authors declare that they have no competing
interests.
References
|
1
|
Belmonte MK, Allen G, Beckel-Mitchener A,
Boulanger LM, Carper RA and Webb SJ: Autism and abnormal
development of brain connectivity. J Neurosci. 24:9228–9231. 2004.
View Article : Google Scholar : PubMed/NCBI
|
|
2
|
Developmental Disabilities Monitoring
Network Surveillance Year 2010 Principal Investigators, . Centers
for Disease Control and Prevention (CDC): Prevalence of autism
spectrum disorder among children aged 8 years-autism and
developmental disabilities monitoring network, 11 sites, United
States, 2010. MMWR Surveill Summ. 63:1–22. 2014.
|
|
3
|
McCarthy M: Autism diagnoses in the US
rise by 30%, CDC reports. BMJ. 348:g25202014. View Article : Google Scholar : PubMed/NCBI
|
|
4
|
Experts, . Large Numbers of children under
3 with autism go undiagnosed. http://china.caixin.com/2018-10-25/101338630.htmlOctober
25–2018
|
|
5
|
Xiao Z, Wang C, Nan J and Wu J: SAE-based
classification of school-aged children with autism spectrum
disorders using functional magnetic resonance imaging. Multimed
Tools Applicat. 77:22809–22820. 2018. View Article : Google Scholar
|
|
6
|
Holzer L, Mihailescu R, Rodrigues-Degaeff
C, Junier L, Muller-Nix C, Halfon O and Ansermet F: Community
introduction of practice parameters for autistic spectrum
disorders: Advancing early recognition. J Autism Dev Disord.
36:249–262. 2006. View Article : Google Scholar : PubMed/NCBI
|
|
7
|
Goh S, Dong Z, Zhang Y, DiMauro S and
Peterson BS: Mitochondrial dysfunction as a neurobiological subtype
of autism spectrum disorder: Evidence from brain imaging. JAMA
Psychiatry. 71:665–671. 2014. View Article : Google Scholar : PubMed/NCBI
|
|
8
|
Lord C, Rutter M and Le Couteur A: Autism
Diagnostic Interview-Revised: A revised version of a diagnostic
interview for caregivers of individuals with possible pervasive
developmental disorders. J Autism Dev Disord. 24:659–685. 1994.
View Article : Google Scholar : PubMed/NCBI
|
|
9
|
Bastiaansen JA, Meffert H, Huizinga P,
Ketelaars C, Pijnenborg M, Bartels A, Minderaa R, Keysers C and de
Bildt A: Diagnosing Autism Spectrum Disorders in Adults: the Use of
Autism Diagnostic Observation Schedule (ADOS) Module 4. J Autism
Dev Disord 41 (9). 1256–1266. 2011. View Article : Google Scholar
|
|
10
|
Sungur MZ and Gündüz A: A comparison of
DSM-IV-TR and DSM-5 definitions for sexual dysfunctions: Critiques
and challenges. J Sex Med. 11:364–373. 2014. View Article : Google Scholar : PubMed/NCBI
|
|
11
|
Dosreis S, Weiner CL, Johnson L and
Newschaffer CJ: Autism spectrum disorder screening and management
practices among general pediatric providers. J Dev Behav Pediatr.
27:S88–S94. 2006. View Article : Google Scholar : PubMed/NCBI
|
|
12
|
Matson JL and Goldin RL: Diagnosing young
children with autism. Int J Dev Neurosci. 39:44–48. 2014.
View Article : Google Scholar : PubMed/NCBI
|
|
13
|
Di Martino A, Ghaffari M, Curchack J,
Reiss P, Hyde C, Vannucci M, Petkova E, Klein DF and Castellanos
FX: Decomposing intra-subject variability in children with
attention-deficit/hyperactivity disorder. Biol Psychiatry.
64:607–614. 2008. View Article : Google Scholar : PubMed/NCBI
|
|
14
|
Hoptman MJ, Zuo XN, Butler PD, Javitt DC,
D'Angelo D, Mauro CJ and Milham MP: Amplitude of low-frequency
oscillations in schizophrenia: A resting state fMRI study.
Schizophr Res. 117:13–20. 2010. View Article : Google Scholar : PubMed/NCBI
|
|
15
|
Han Y, Wang J, Zhao Z, Min B, Lu J, Li K,
He Y and Jia J: Frequency-dependent changes in the amplitude of
low-frequency fluctuations in amnestic mild cognitive impairment: A
resting-state fMRI study. Neuroimage. 55:287–295. 2011. View Article : Google Scholar : PubMed/NCBI
|
|
16
|
Barttfeld P, Wicker B, Cukier S, Navarta
S, Lew S, Leiguarda R and Sigman M: State-dependent changes of
connectivity patterns and functional brain network topology in
autism spectrum disorder. Neuropsychologia. 50:3653–3662. 2012.
View Article : Google Scholar : PubMed/NCBI
|
|
17
|
Bajaj S, Adhikari BM and Dhamala M: Higher
frequency network activity flow predicts lower frequency node
activity in intrinsic low-frequency BOLD fluctuations. PLoS One.
8:e644662013. View Article : Google Scholar : PubMed/NCBI
|
|
18
|
Deshpande G, Libero LE, Sreenivasan KR,
Deshpande HD and Kana RK: Identification of neural connectivity
signatures of autism using machine learning. Front Hum Neurosci.
7:6702013. View Article : Google Scholar : PubMed/NCBI
|
|
19
|
Chen H, Duan X, Liu F, Lu F, Ma X, Zhang
Y, Uddin LQ and Chen H: Multivariate classification of autism
spectrum disorder using frequency-specific resting-state functional
connectivity-A multi-center study. Prog Neuropsychopharmacol Biol
Psychiatry. 64:1–9. 2016. View Article : Google Scholar : PubMed/NCBI
|
|
20
|
Zuo XN, Di Martino A, Kelly C, Shehzad ZE,
Gee DG, Klein DF, Castellanos FX, Biswal BB and Milham MP: The
oscillating brain: Complex and reliable. Neuroimage. 49:1432–1445.
2010. View Article : Google Scholar : PubMed/NCBI
|
|
21
|
Penttonen M and Buzsáki G: Natural
logarithmic relationship between brain oscillators. Thalamus Relat
Syst. 2:145–152. 2003. View Article : Google Scholar
|
|
22
|
Buzsáki G and Draguhn A: Neuronal
oscillations in cortical networks. Science. 304:1926–1929. 2004.
View Article : Google Scholar : PubMed/NCBI
|
|
23
|
Siegel M, Donner TH and Engel AK: Spectral
fingerprints of large-scale neuronal interactions. Nat Rev
Neurosci. 13:121–134. 2012. View Article : Google Scholar : PubMed/NCBI
|
|
24
|
Lynch CJ, Uddin LQ, Supekar K, Khouzam A,
Phillips J and Menon V: Default mode network in childhood autism:
Posteromedial cortex heterogeneity and relationship with social
deficits. Biol Psychiatry. 74:212–219. 2013. View Article : Google Scholar : PubMed/NCBI
|
|
25
|
Balsters JH, Mantini D and Wenderoth N:
Connectivity-based parcellation reveals distinct cortico-striatal
connectivity fingerprints in Autism Spectrum Disorder. Neuroimage.
170:412–423. 2018. View Article : Google Scholar : PubMed/NCBI
|
|
26
|
Risk BB, Matteson DS, Ruppert D, Eloyan A
and Caffo BS: An evaluation of independent component analyses with
an application to resting-state fMRI. Biometrics. 70:224–236. 2014.
View Article : Google Scholar : PubMed/NCBI
|
|
27
|
Shin HC, Orton MR, Collins DJ, Doran SJ
and Leach MO: Stacked autoencoders for unsupervised feature
learning and multiple organ detection in a pilot study using 4D
patient data. IEEE Trans Pattern Anal Mach Intell. 35:1930–1943.
2013. View Article : Google Scholar : PubMed/NCBI
|
|
28
|
Autism Brain Imaging Data Exchange II,
2016, . http://fcon_1000.projects.nitrc.org/indi/abide/abide_II.htmlAug
30–2012
|
|
29
|
Assaf M, Jagannathan K, Calhoun VD, Miller
L, Stevens MC, Sahl R, O'Boyle JG, Schultz RT and Pearlson GD:
Abnormal functional connectivity of default mode sub-networks in
autism spectrum disorder patients. Neuroimage. 53:247–256. 2010.
View Article : Google Scholar : PubMed/NCBI
|
|
30
|
Di Martino A, Kelly C, Grzadzinski R, Zuo
XN, Mennes M, Mairena MA, Lord C, Castellanos FX and Milham MP:
Aberrant striatal functional connectivity in children with autism.
Biol Psychiatry. 69:847–856. 2011. View Article : Google Scholar : PubMed/NCBI
|
|
31
|
Perez Velazquez JL, Barcelo F, Hung Y,
Leshchenko Y, Nenadovic V, Belkas J, Raghavan V, Brian J and Garcia
Dominguez L: Decreased brain coordinated activity in autism
spectrum disorders during executive tasks: Reduced long-range
synchronization in the fronto-parietal networks. Int J
Psychophysiol. 73:341–349. 2009. View Article : Google Scholar : PubMed/NCBI
|
|
32
|
Fagiolo G, Waldman A and Hajnal JV: A
simple procedure to improve FMRIB Software Library Brain Extraction
Tool performance. Br J Radiol 81 (963). 2502008. View Article : Google Scholar
|
|
33
|
Uddin LQ, Supekar K, Lynch CJ, Khouzam A,
Phillips J, Feinstein C, Ryali S and Menon V: Salience
network-based classification and prediction of symptom severity in
children with autism. JAMA Psychiatry. 70:869–879. 2013. View Article : Google Scholar : PubMed/NCBI
|
|
34
|
Li YO, Adali T and Calhoun VD: Estimating
the number of independent components for functional magnetic
resonance imaging data. Hum Brain Mapp. 28:1251–1266. 2007.
View Article : Google Scholar : PubMed/NCBI
|
|
35
|
Beckmann CF, Noble JA and Smith SM:
Investigating the intrinsic dimensionality of FMRI data for ICA.
Neuroimage. 13:S762001. View Article : Google Scholar
|
|
36
|
McKeown MJ and Sejnowski TJ: Independent
component analysis of fMRI data: Examining the assumptions. Hum
Brain Mapp. 6:368–372. 1998. View Article : Google Scholar : PubMed/NCBI
|
|
37
|
Jiang M, Liang Y, Feng X, Fan X, Pei Z,
Xue Y and Guan R: Text classification based on deep belief network
and softmax regression. Neural Comput Applicat. 29:61–70. 2018.
View Article : Google Scholar
|
|
38
|
Anderson JS, Nielsen JA, Froehlich AL,
DuBray MB, Druzgal TJ, Cariello AN, Cooperrider JR, Zielinski BA,
Ravichandran C, Fletcher PT, et al: Functional connectivity
magnetic resonance imaging classification of autism. Brain.
134:3742–3754. 2011. View Article : Google Scholar : PubMed/NCBI
|
|
39
|
Murdaugh DL, Shinkareva SV, Deshpande HR,
Wang J, Pennick MR and Kana RK: Differential deactivation during
mentalizing and classification of autism based on default mode
network connectivity. PLoS One. 7:e500642012. View Article : Google Scholar : PubMed/NCBI
|
|
40
|
Iidaka T: Resting state functional
magnetic resonance imaging and neural network classified autism and
control. Cortex. 63:55–67. 2015. View Article : Google Scholar : PubMed/NCBI
|