Introduction
Wilms tumor (WT) is one of the most common types of
pediatric solid tumor, with a prevalence of 1 in 10,000 children
worldwide (1). WT typically occurs
in healthy children; however, ~10% of children who have congenital
anomalies, including Denys-Drash syndrome and Beckwith-Wiedemann
syndrome, have been reported to exhibit a predisposition to this
type of cancer (2,3). WT is an embryological tumor that is
composed of a variable mixture of stromal, blastemal and epithelial
elements and is histologically similar to renal embryogenesis
(4). It has been verified that
certain genetic mutations, including those in Wilms tumor 1 (WT1),
Wilms tumor on the X (WTX) and catenin b1 (CTNNB1), are associated
with WT susceptibility (5–7). WT1 is closely associated with renal
development and its mutations account for ~20% of WT cases
(8). It has been identified from a
large number of WT cases that CTNNB1 mutations overlap with the WT1
mutation while the WTX mutation is predominantly mutually exclusive
(9). Furthermore, a number of
studies have suggested the involvement of various genes and
cellular signaling pathways in the occurrence and development of WT
(10,11). A previous study indicated that KRAS
mutations participate in the WT occurrence by activating the
PI3K/AKT pathway (12). However, the
definite molecular mechanisms remain unknown. Therefore, it is
necessary to study the underlying molecular mechanisms of WT to
prevent tumorigenesis and develop effective therapeutic
measures.
MicroRNAs (miRNAs/miRs) are a class of small
non-coding RNAs that regulate gene expression by
post-transcriptionally binding to the 3′ untranslated region of
target mRNAs, inducing mRNA degradation or silencing (13). In previous decades, a large number of
miRNAs have been identified in humans and numerous previous studies
have demonstrated their role of acting as oncogenes or tumor
suppressors by regulating tumor occurrence, progression and
survival (14,15). For example, Zhu et al
(16) reported that miR-92a-3p
suppresses the proliferation, migration and invasion of WT cells by
modulating the NOTCH1 signaling pathway. Therefore, identification
of differentially expressed miRNAs (DEMs) has been demonstrated to
be a promising strategy in the identification of novel biomarkers
for the early diagnosis or prognosis of WT.
Application of microarray analysis or
high-throughput sequencing can quickly identify differentially
expressed genes (DEGs) and DEMs in tumor samples, and these are
promising techniques in clinical research, including molecular
classification, targeted drug discovery and survival prediction
(17,18). The present study identified DEGs in
WT using the GSE66405 dataset from the Gene Expression Omnibus
(GEO) database and data from The Cancer Genome Atlas (TCGA)
database (19). Additionally,
analysis of DEMs was performed using the GSE57370 dataset and TCGA
database (20). Overall, the present
study aimed to provide information that would promote the
understanding of the molecular mechanisms of WT.
Materials and methods
Raw data
All datasets used in the present study were
downloaded from the GEO (https://www.ncbi.nlm.nih.gov/geo/) and TCGA
(https://cancergenome.nih.gov/) databases
(21). The GSE66405 dataset includes
mRNA expression profiles of 28 WT and four paracancerous normal
samples, which were determined using the Agilent-039494 SurePrint
G3 Human GE v2 8×60K (GPL17077) platform (17). The GSE57370 dataset includes miRNA
expression profiles of 62 WT and four paracancerous normal samples,
which were determined using the Agilent-031181
Unrestricted_Human_miRNA_V16.0_Microarray (GPL16770) platform
(18). In addition, further mRNA and
miRNA expression profiles were downloaded from the TCGA WT datasets
(mRNA, https://portal.gdc.cancer.gov/repository?facetTab=files&filters=%7B%22op%22%3A%22and%22%2C%22content%22%3A%5B%7B%22op%22%3A%22in%22%2C%22content%22%3A%7B%22field%22%3A%22cases.project.project_id%22%2C%22value%22%3A%5B%22TARGET-WT%22%5D%7D%7D%2C%7B%22op%22%3A%22in%22%2C%22content%22%3A%7B%22field%22%3A%22files.analysis.workflow_type%22%2C%22value%22%3A%5B%22HTSeq%20-%20Counts%22%5D%7D%7D%2C%7B%22op%22%3A%22in%22%2C%22content%22%3A%7B%22field%22%3A%22files.experimental_strategy%22%2C%22value%22%3A%5B%22RNA-Seq%22%5D%7D%7D%5D%7D;
miRNA, https://portal.gdc.cancer.gov/repository?facetTab=files&filters=%7B%22op%22%3A%22and%22%2C%22content%22%3A%5B%7B%22op%22%3A%22in%22%2C%22content%22%3A%7B%22field%22%3A%22cases.project.project_id%22%2C%22value%22%3A%5B%22TARGET-WT%22%5D%7D%7D%2C%7B%22op%22%3A%22in%22%2C%22content%22%3A%7B%22field%22%3A%22files.data_category%22%2C%22value%22%3A%5B%22Transcriptome%20Profiling%22%5D%7D%7D%2C%7B%22op%22%3A%22in%22%2C%22content%22%3A%7B%22field%22%3A%22files.data_type%22%2C%22value%22%3A%5B%22miRNA%20Expression%20Quantification%22%5D%7D%7D%2C%7B%22op%22%3A%22in%22%2C%22content%22%3A%7B%22field%22%3A%22files.experimental_strategy%22%2C%22value%22%3A%5B%22miRNA-Seq%22%5D%7D%7D%5D%7D&searchTableTab=files),
which included 6 paracancerous normal renal tissues and 126 or 132
tumor samples, respectively.
Identification of DEGs and DEMs
The R 3.5.0 software (https://www.r-project.org/) was used to identify the
DEGs between WT and normal samples in the GSE66405 dataset using
the limma package with the following cut-off criteria: Fold change
(FC)>2 and P<0.05 (22).
Additionally, the DEGs in the TCGA WT dataset were determined using
the edgeR package with FC>2 and a false discovery rate (FDR)
adjusted P<0.05 as the cut-off criteria (23). Similarly, DEMs were screened with
FC>1 and P<0.05 in GSE57370, and FC>1 and FDR adjusted
P<0.05 in the TCGA dataset. The limma and edgeR packages were
installed using Bioconductor version 3.7 (https://www.bioconductor.org/).
Gene Ontology (GO) and pathway
enrichment analysis
The Database for Annotation, Visualization and
Integrated Discovery (DAVID 6.8; http://david.abcc.ncifcrf.gov/) was used to perform GO
and Kyoto Encyclopedia of Genes and Genomes (KEGG) pathway
enrichment analyses of the DEGs. P<0.05 was considered to
indicate a statistically significant result (24).
Protein-protein interaction (PPI)
network construction and module analysis
The Search Tool for the Retrieval of Interacting
Genes (STRING 11.0; http://string.embl.de/) database was used to obtain
PPI information for the DEGs, and interactions with a combined
score >0.7 were considered as significant protein pairs
(25). Subsequently, Cytoscape 3.6.1
software was used to visualize the PPI network and Molecular
Complex Detection (MCODE) was used to screen central modules of the
network with the following cut-off criteria: Degree=2, node score
cut-off=0.2, k-score=2 and maximum depth=100 (26,27).
Validation of hub genes
Oncomine (https://www.oncomine.org), an online microarray
database, was utilized to collect and analyze gene expression data
for tumor and paracarcinoma normal samples. The Yusenko et
al (28) renal dataset was used
to verify the differential expression of hub genes between four WT
and five normal renal samples. The log2 median-centered intensity
value was visualized by GraphPad Prism 5.0 software (GraphPad
Software, Inc.).
Prediction of miRNA targets
Target genes of the DEMs in the GSE57370 dataset and
TCGA dataset were predicted using TargetScan (http://www.targetscan.org/vert_72/), miRTarBase
(http://mirtarbase.mbc.nctu.edu.tw/php/index.php) and
miRDB (http://mirdb.org/). Only targets identified by
all three databases were further analyzed by comparing them with
previously identified DEGs (29).
Furthermore, the predicted mRNA-miRNA regulatory interactions were
visualized using Cytoscape version 3.6.1.
Results
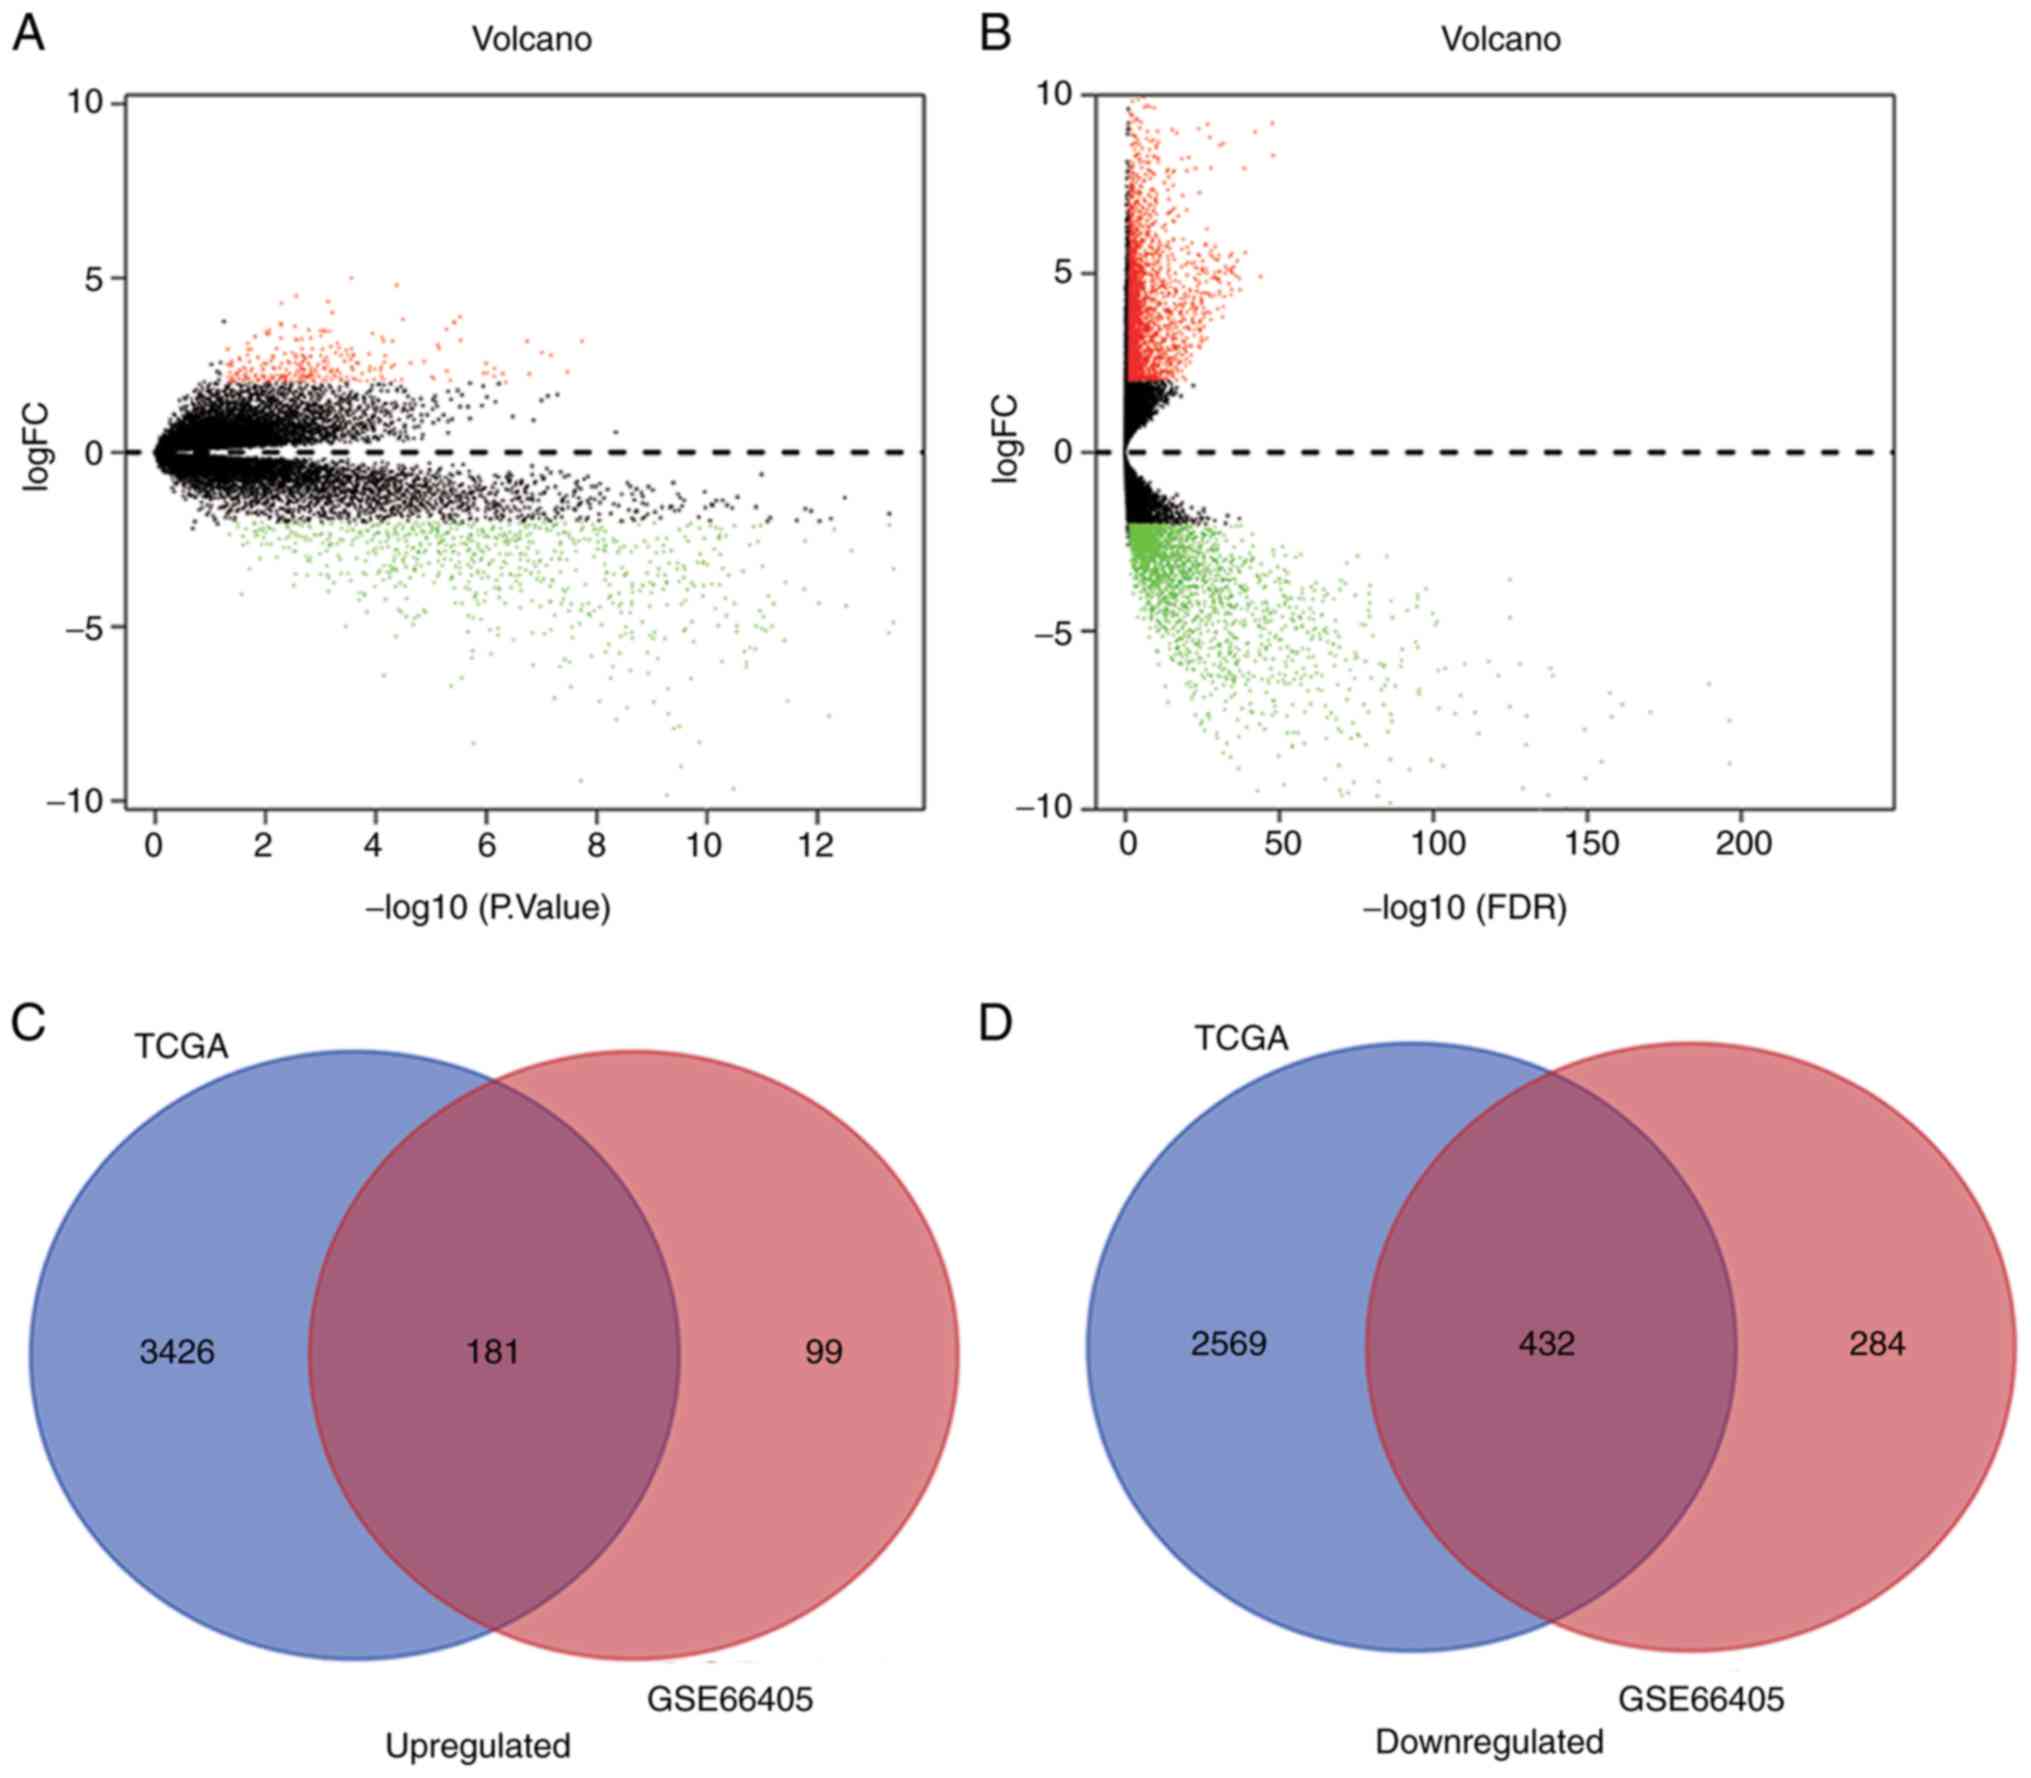
Identification of common DEGs in
GSE66405 and TCGA
A total of 996 DEGs in GSE66405 were identified
according to the aforementioned cut-off criteria, including 280
upregulated and 716 downregulated genes (Fig. 1A; Table
SI). In addition, 6,608 DEGs were identified in the TCGA
dataset, including 3,607 upregulated and 3,001 downregulated genes
(Fig. 1B; Table SII). A Venn diagram was used to
present the overlapping 181 upregulated and 432 downregulated genes
identified in both datasets (Fig. 1C and
D).
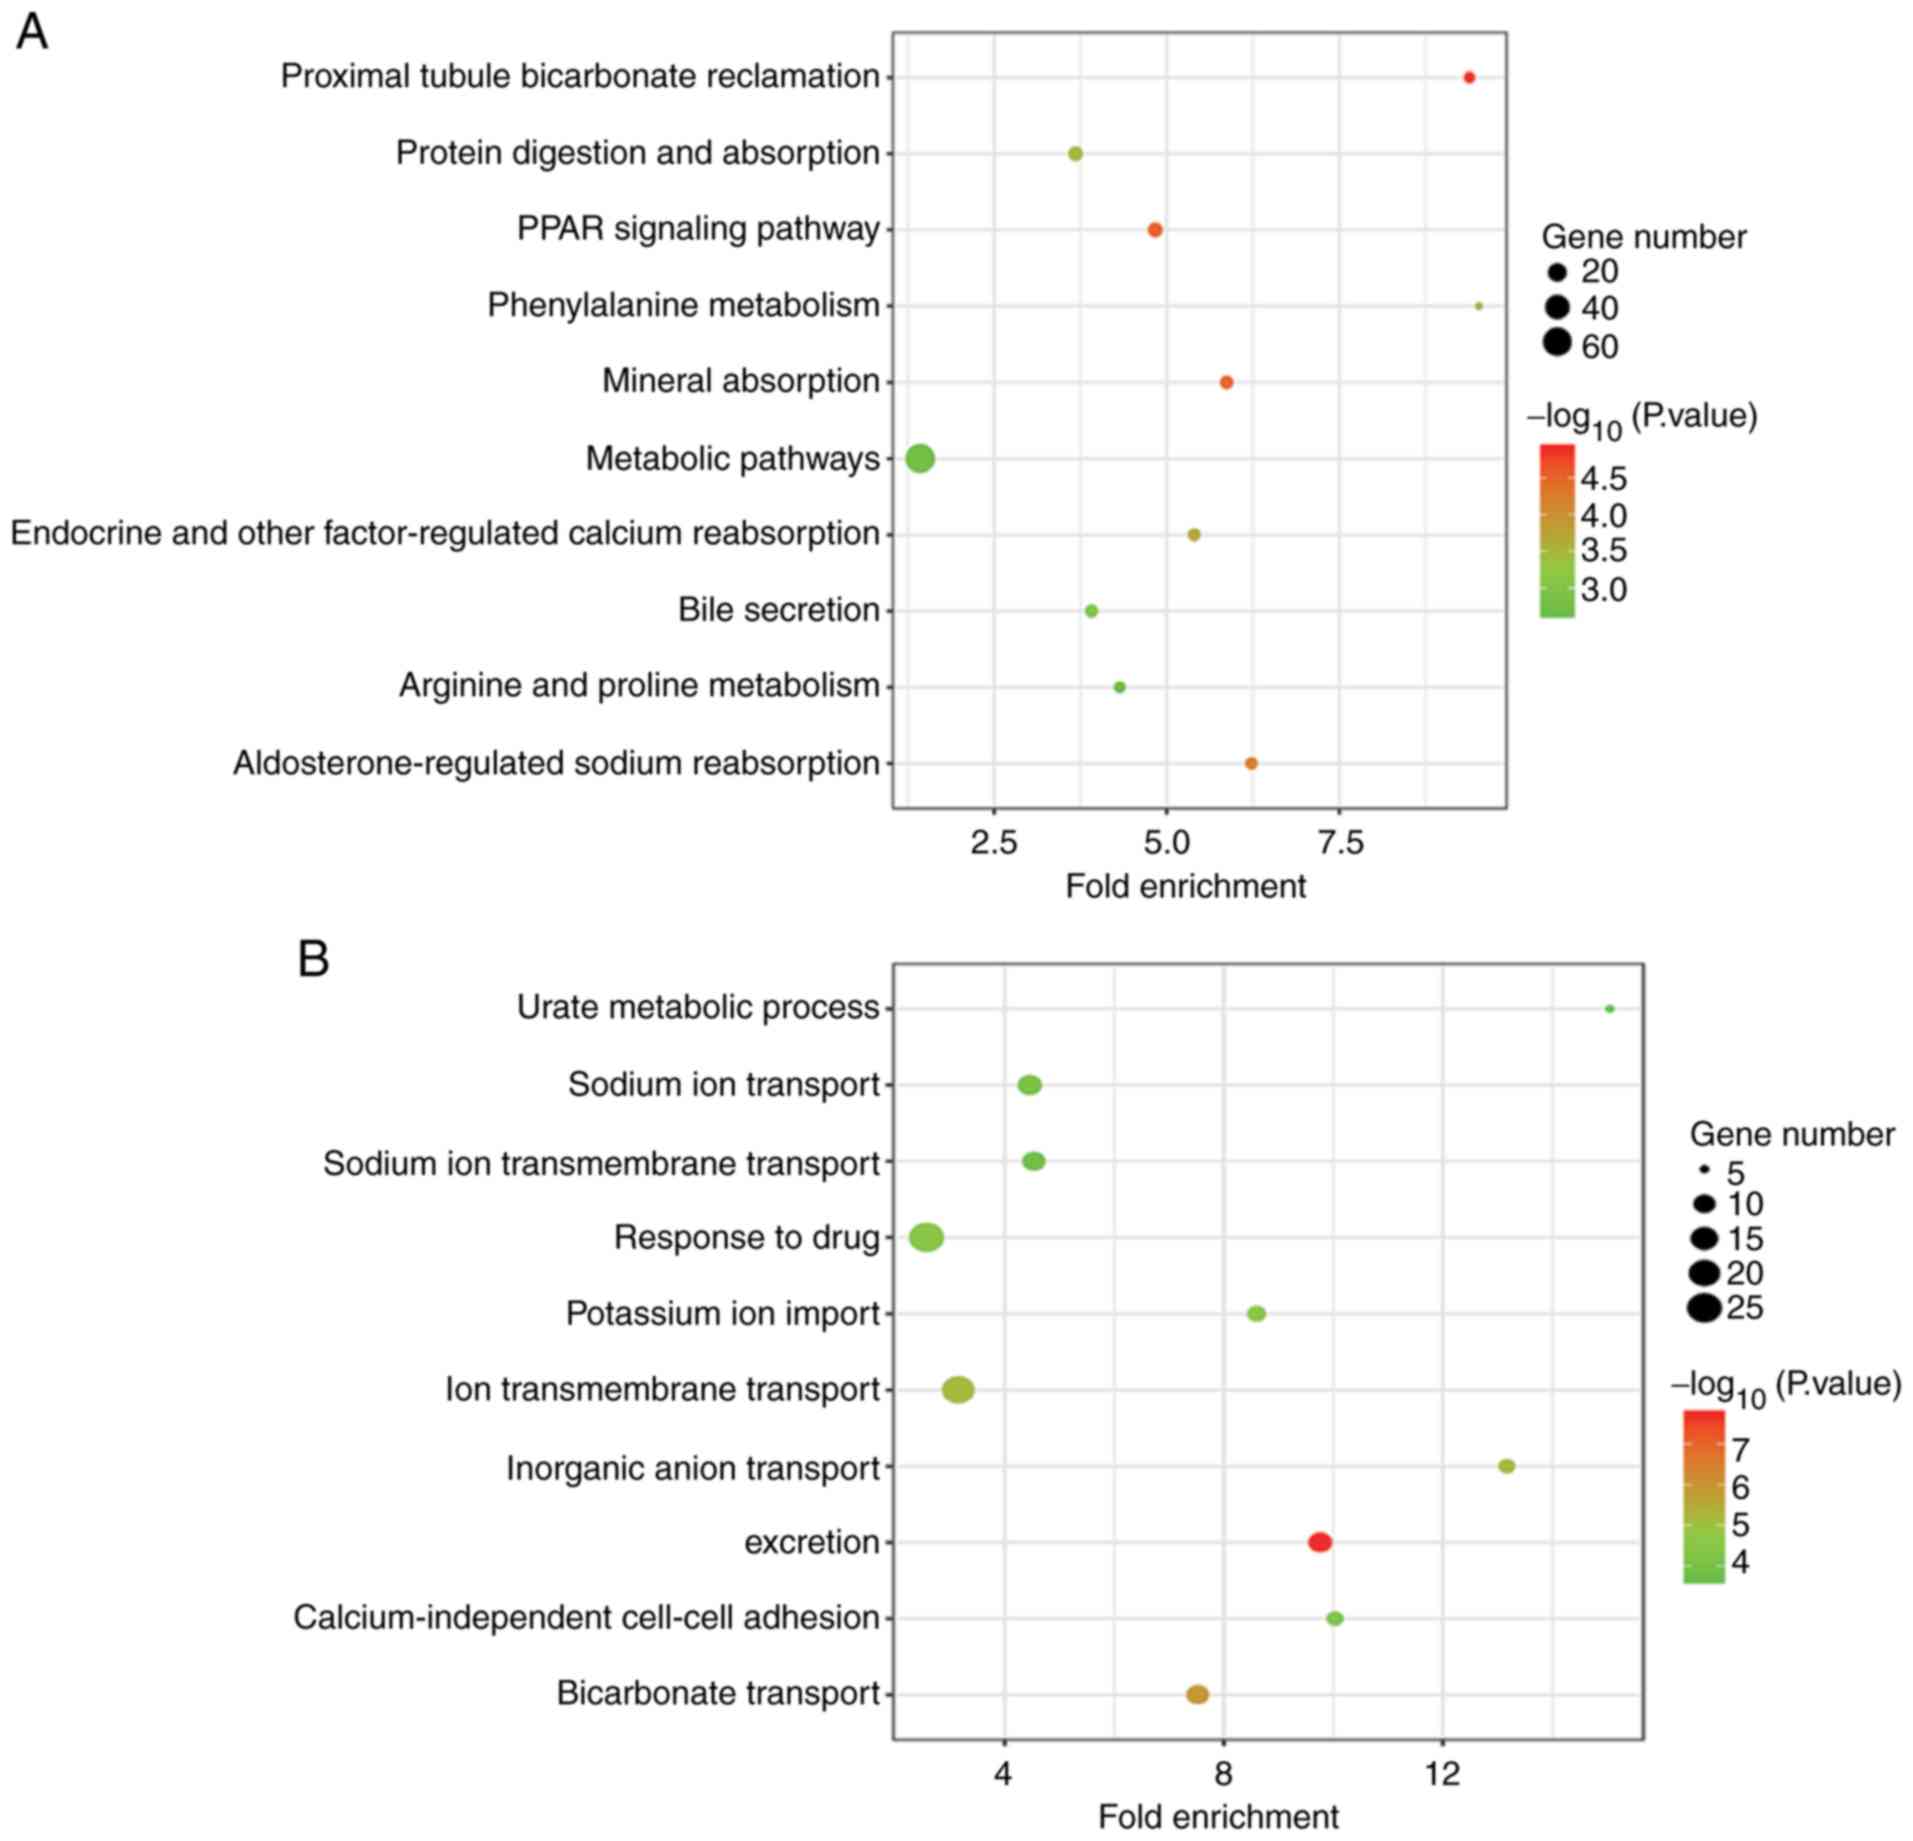
GO term and KEGG pathway enrichment
analysis of DEGs
To gain further insights into the function and
mechanisms of WT, the identified common DEGs were uploaded to DAVID
to perform GO and KEGG pathway enrichment analyses. The top 10
terms of each analysis with the lowest P-values are presented in
Fig. 2. According to KEGG pathway
analysis, the DEGs were predominantly enriched in the ‘Metabolic
pathway’. In addition, certain DEGs were significantly involved in
‘peroxisome proliferator-activated receptor (PPAR) signaling
pathway’ and ‘Protein digestion and absorption’. GO biological
process terms revealed that the DEGs were primarily enriched in
‘response to drug’, ‘ion transmembrane transport’ and ‘excretion’.
At the cellular component level, the DEGs were mainly enriched in
‘integral component of membrane’, ‘extracellular exosome’ and
‘plasma membrane’. At the molecular function level, the DEGs
predominantly served a role in ‘transporter activity’ and ‘heparin
binding’.
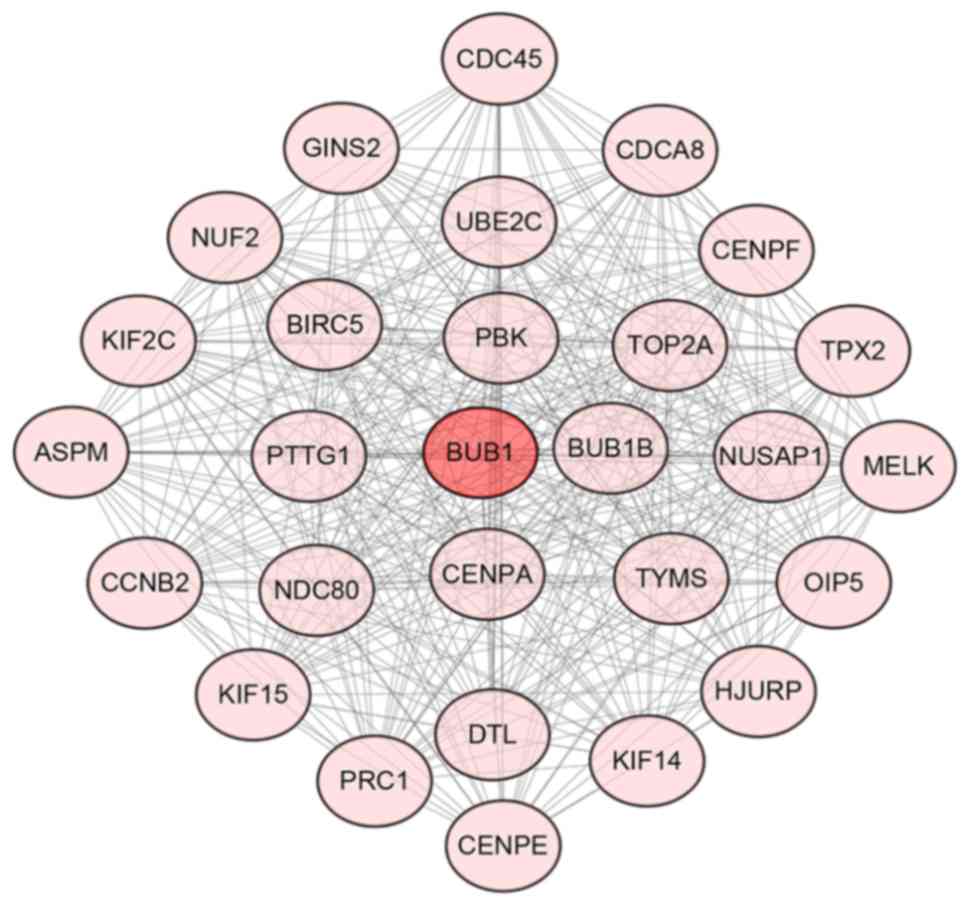
PPI network analysis
All 613 common DEGs were mapped into a PPI network
using the STRING online database and the network was visualized
using Cytoscape (Fig. S1). BUB1
mitotic checkpoint serine (BUB1) was identified as the gene with
the highest degree in the overall network, with a degree of 33.
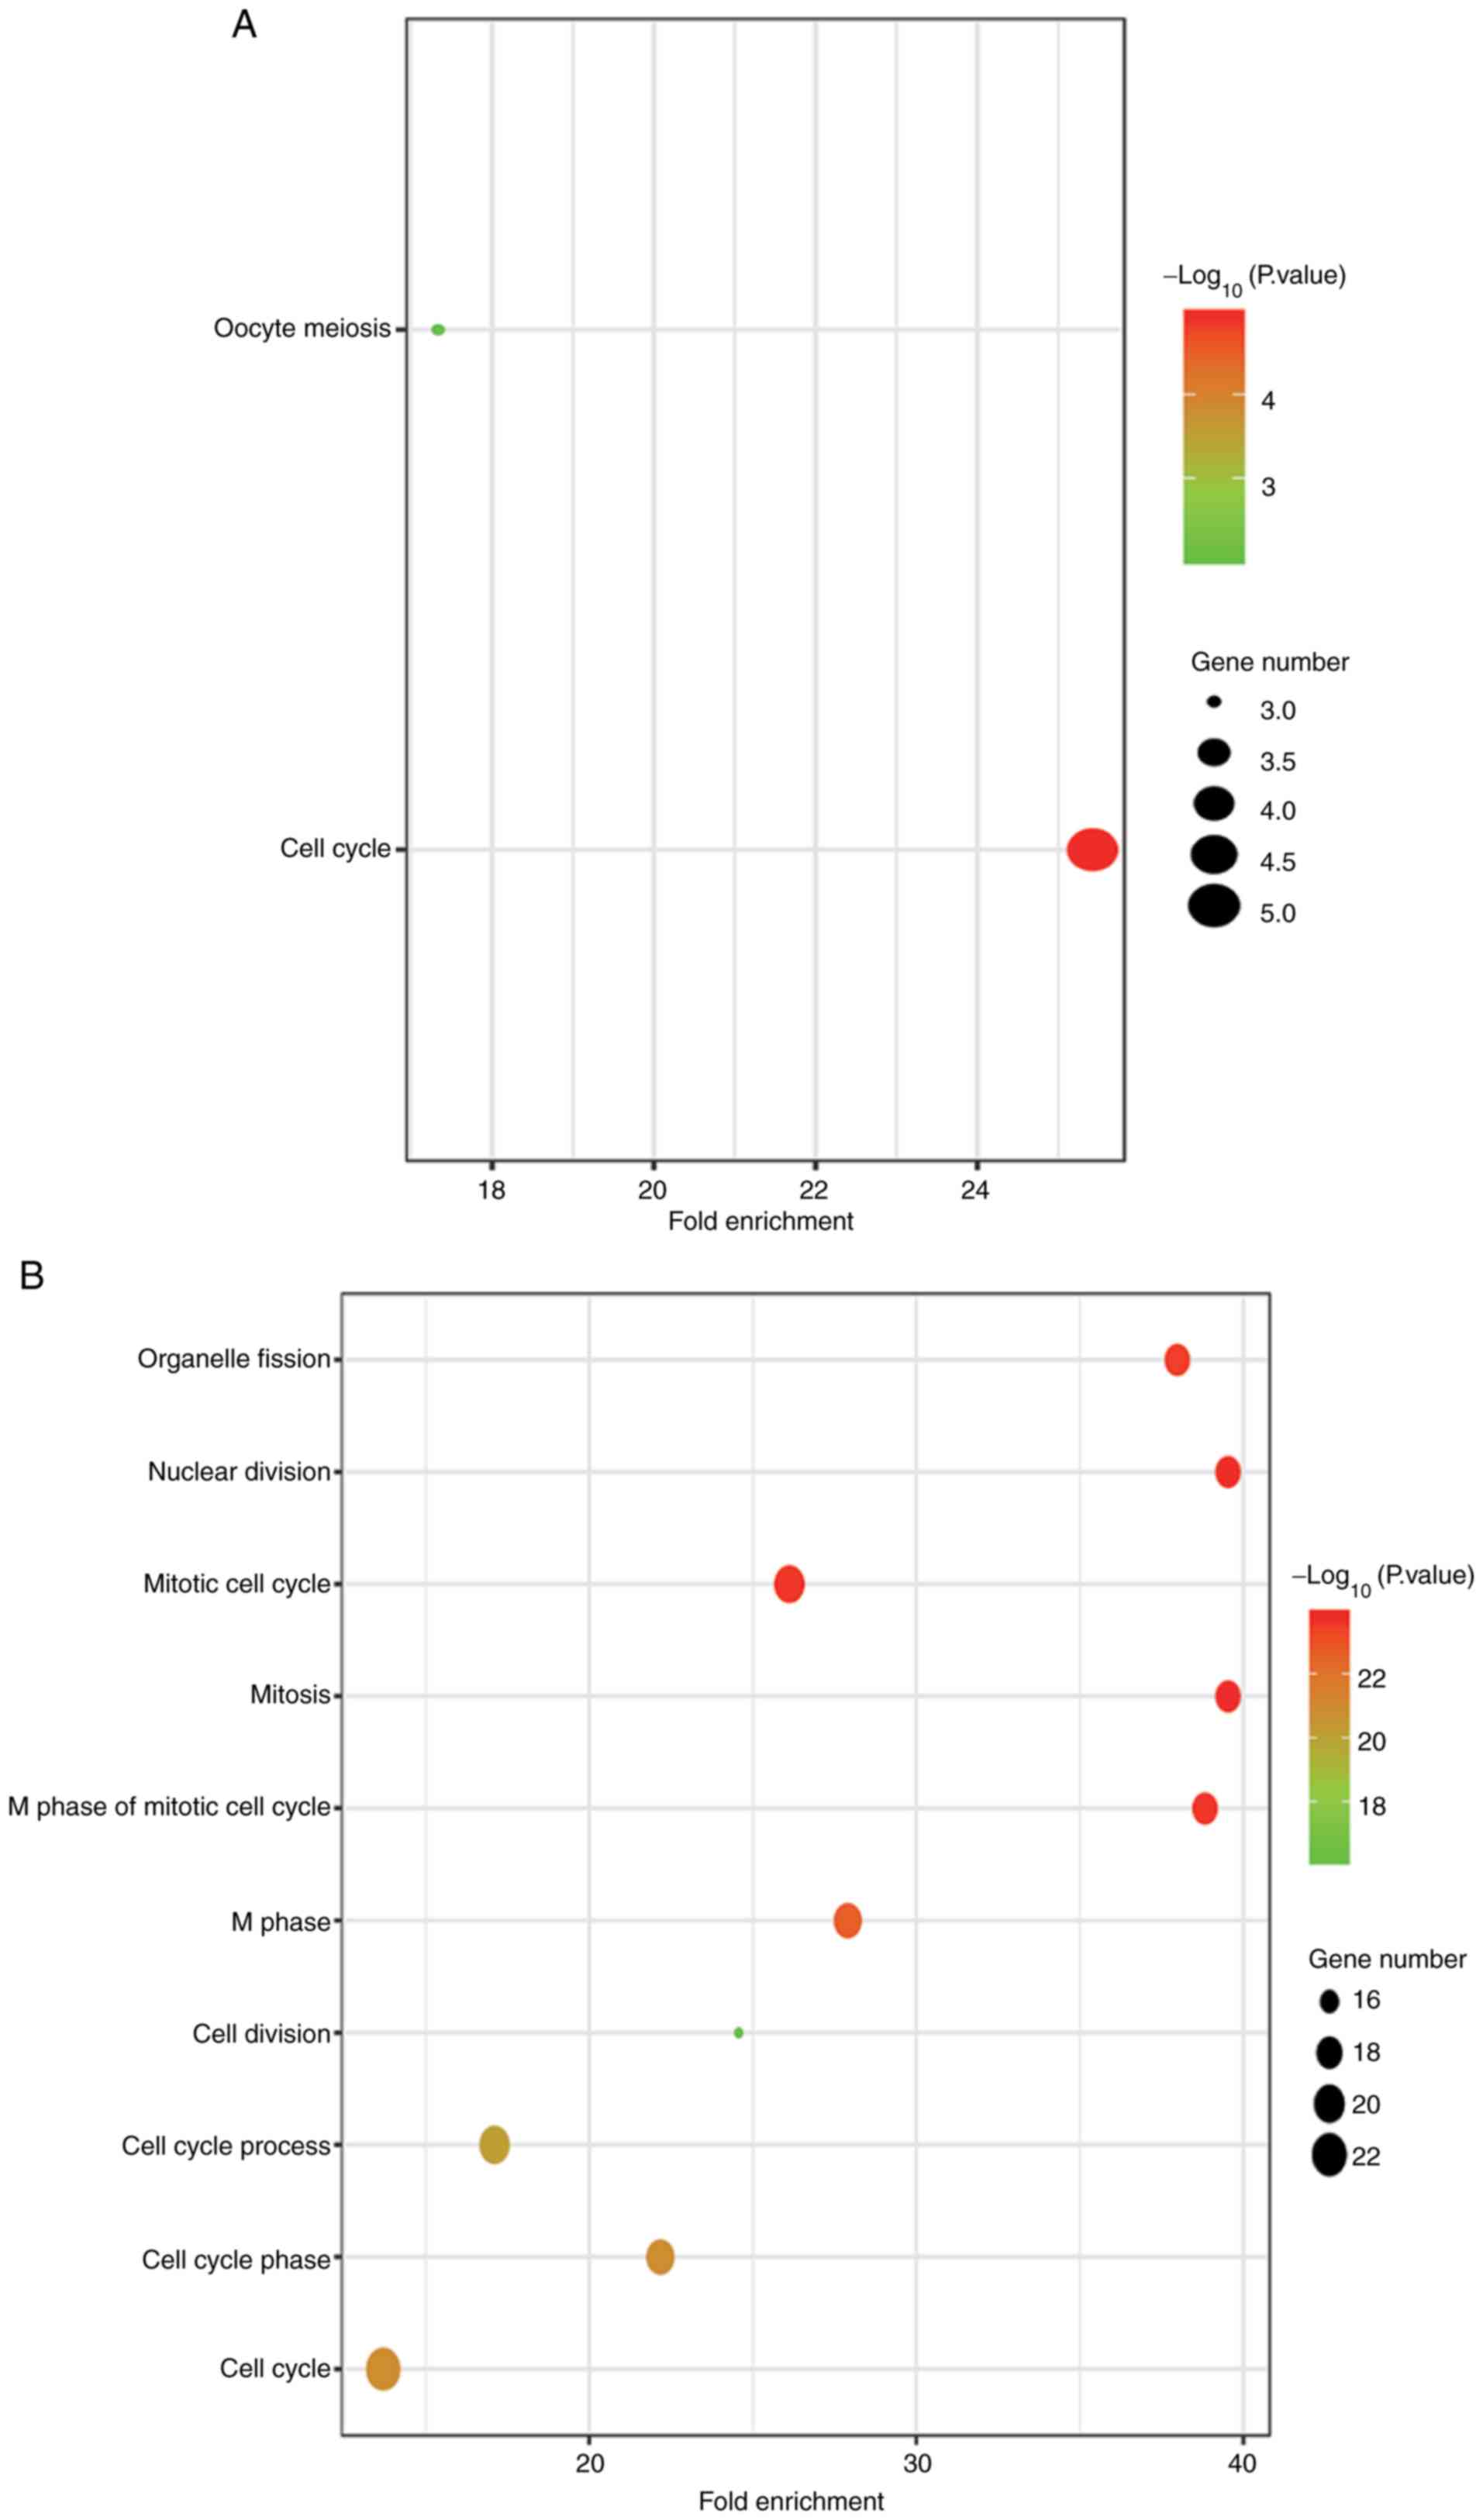
Fig. 3 presents the most significant
gene module of the PPI network, which included 28 genes with 366
edges. In addition, key pathways and GO terms of these hub genes
are presented in Fig. 4 and Table SIII. These hub genes were
predominantly involved in the cell cycle [BUB1, BUB1B mitotic
checkpoint serine/threonine kinase B (BUB1B), cell division cycle
protein 45 (CDC45), cyclin B2 (CCNB2) and pituitary
tumor-transforming 1 (PTTG1)] and oocyte meiosis pathways (BUB1,
CCNB2 and PTTG1). Furthermore, BUB1 was revealed to be involved in
all of the GO terms identified. As a result, BUB1 was considered to
be a central hub gene.
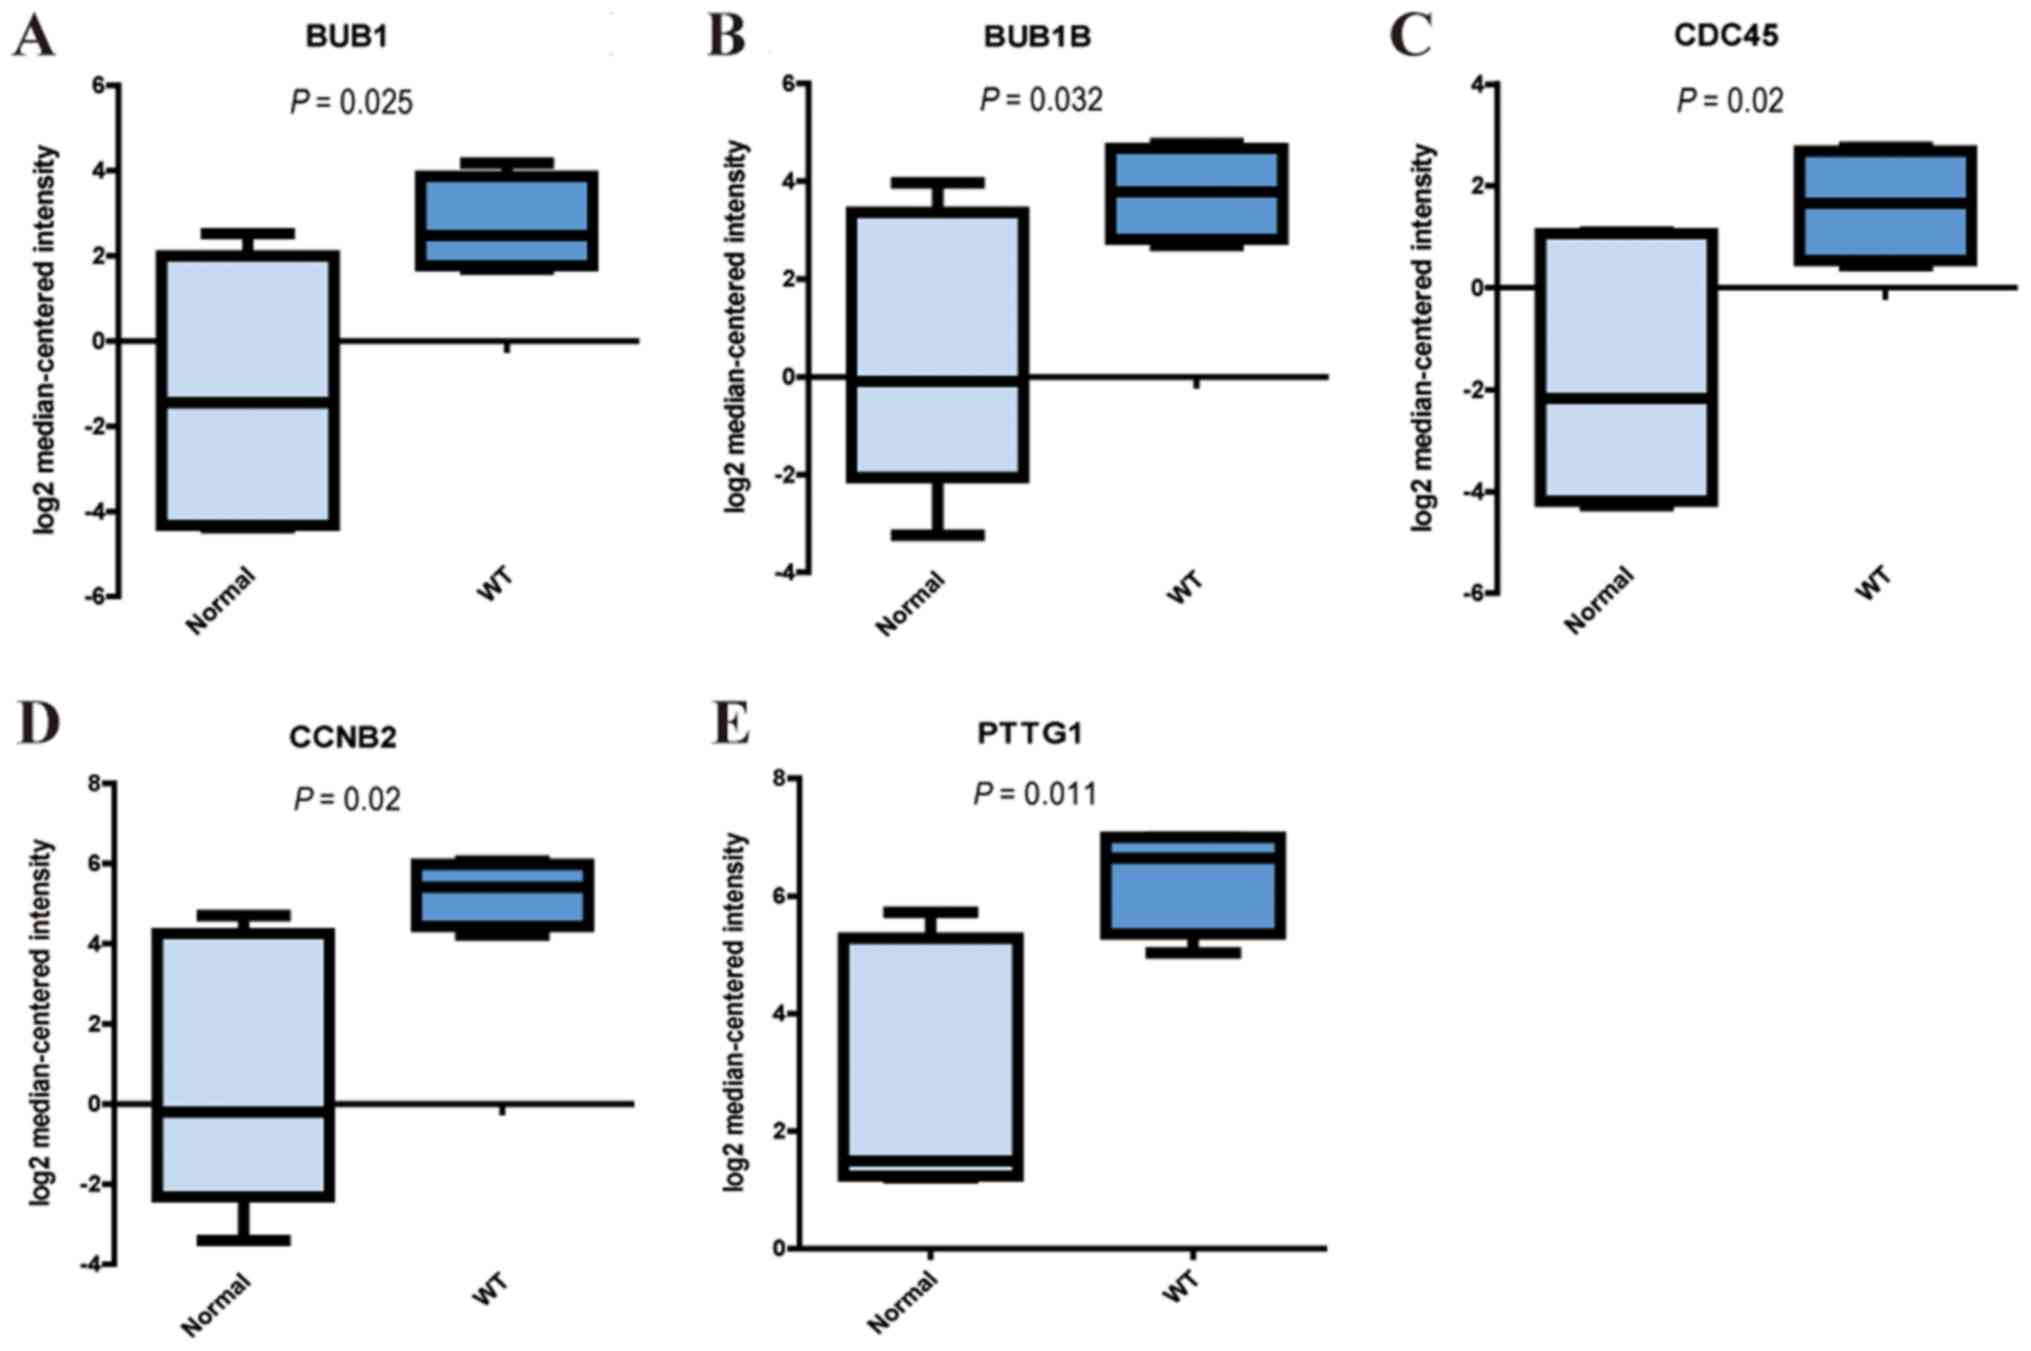
Validation of hub genes in the cell
cycle pathway
To further validate the results, the present study
examined the expression levels of five hub genes (BUB1, BUB1B,
CDC45, CCNB2 and PTTG1) using the Oncomine database. As indicated
by the Yusenko Renal dataset, all five genes were significantly
upregulated in tumor samples compared with in normal samples
(P<0.05; Fig. 5). This suggested
that dysregulation of the cell cycle pathway, as well as
alterations in the mRNA expression levels of these genes, may be
closely associated with WT.
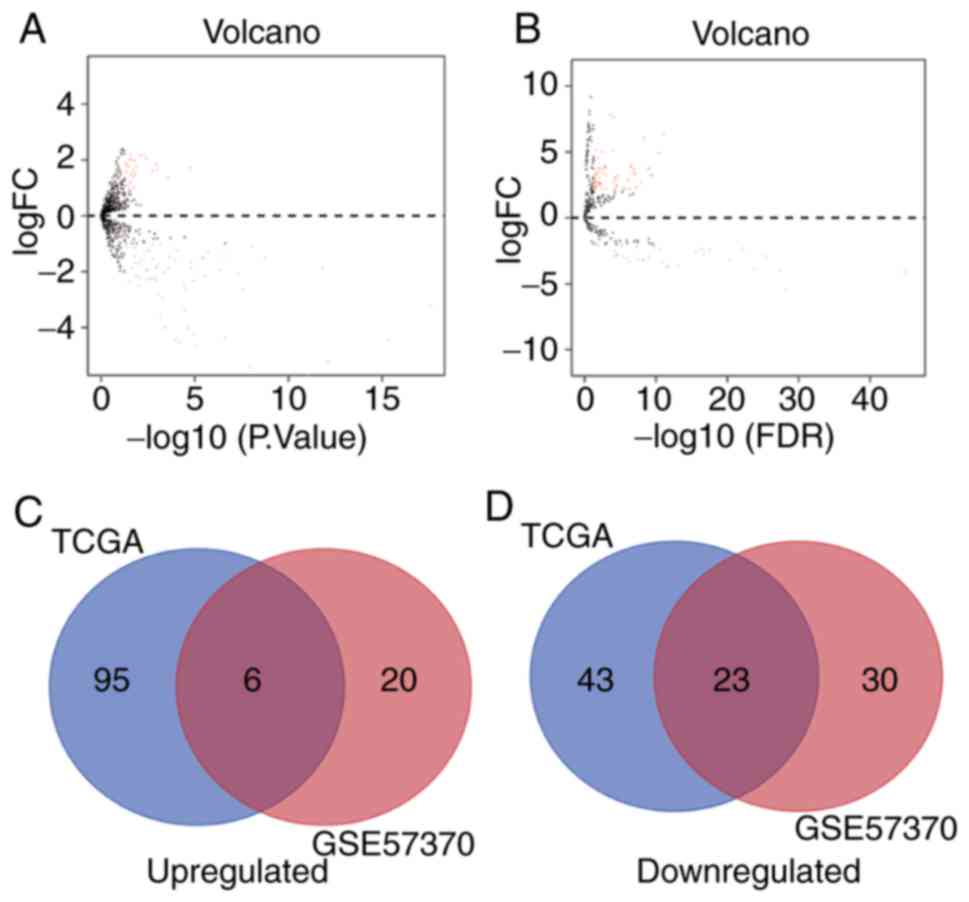
Identification of common DEMs in
GSE57370 and the TCGA dataset
A total of 79 and 167 DEMs were identified using the
GSE57370 and TCGA datasets, respectively, including 26 and 101
upregulated, and 53 and 66 downregulated miRNAs, respectively
(Fig. 6A and B; Tables SIV and SV). Venn diagrams present the 29
overlapping miRNAs, which included 6 upregulated and 23
downregulated miRNAs (Fig. 6C and
D).
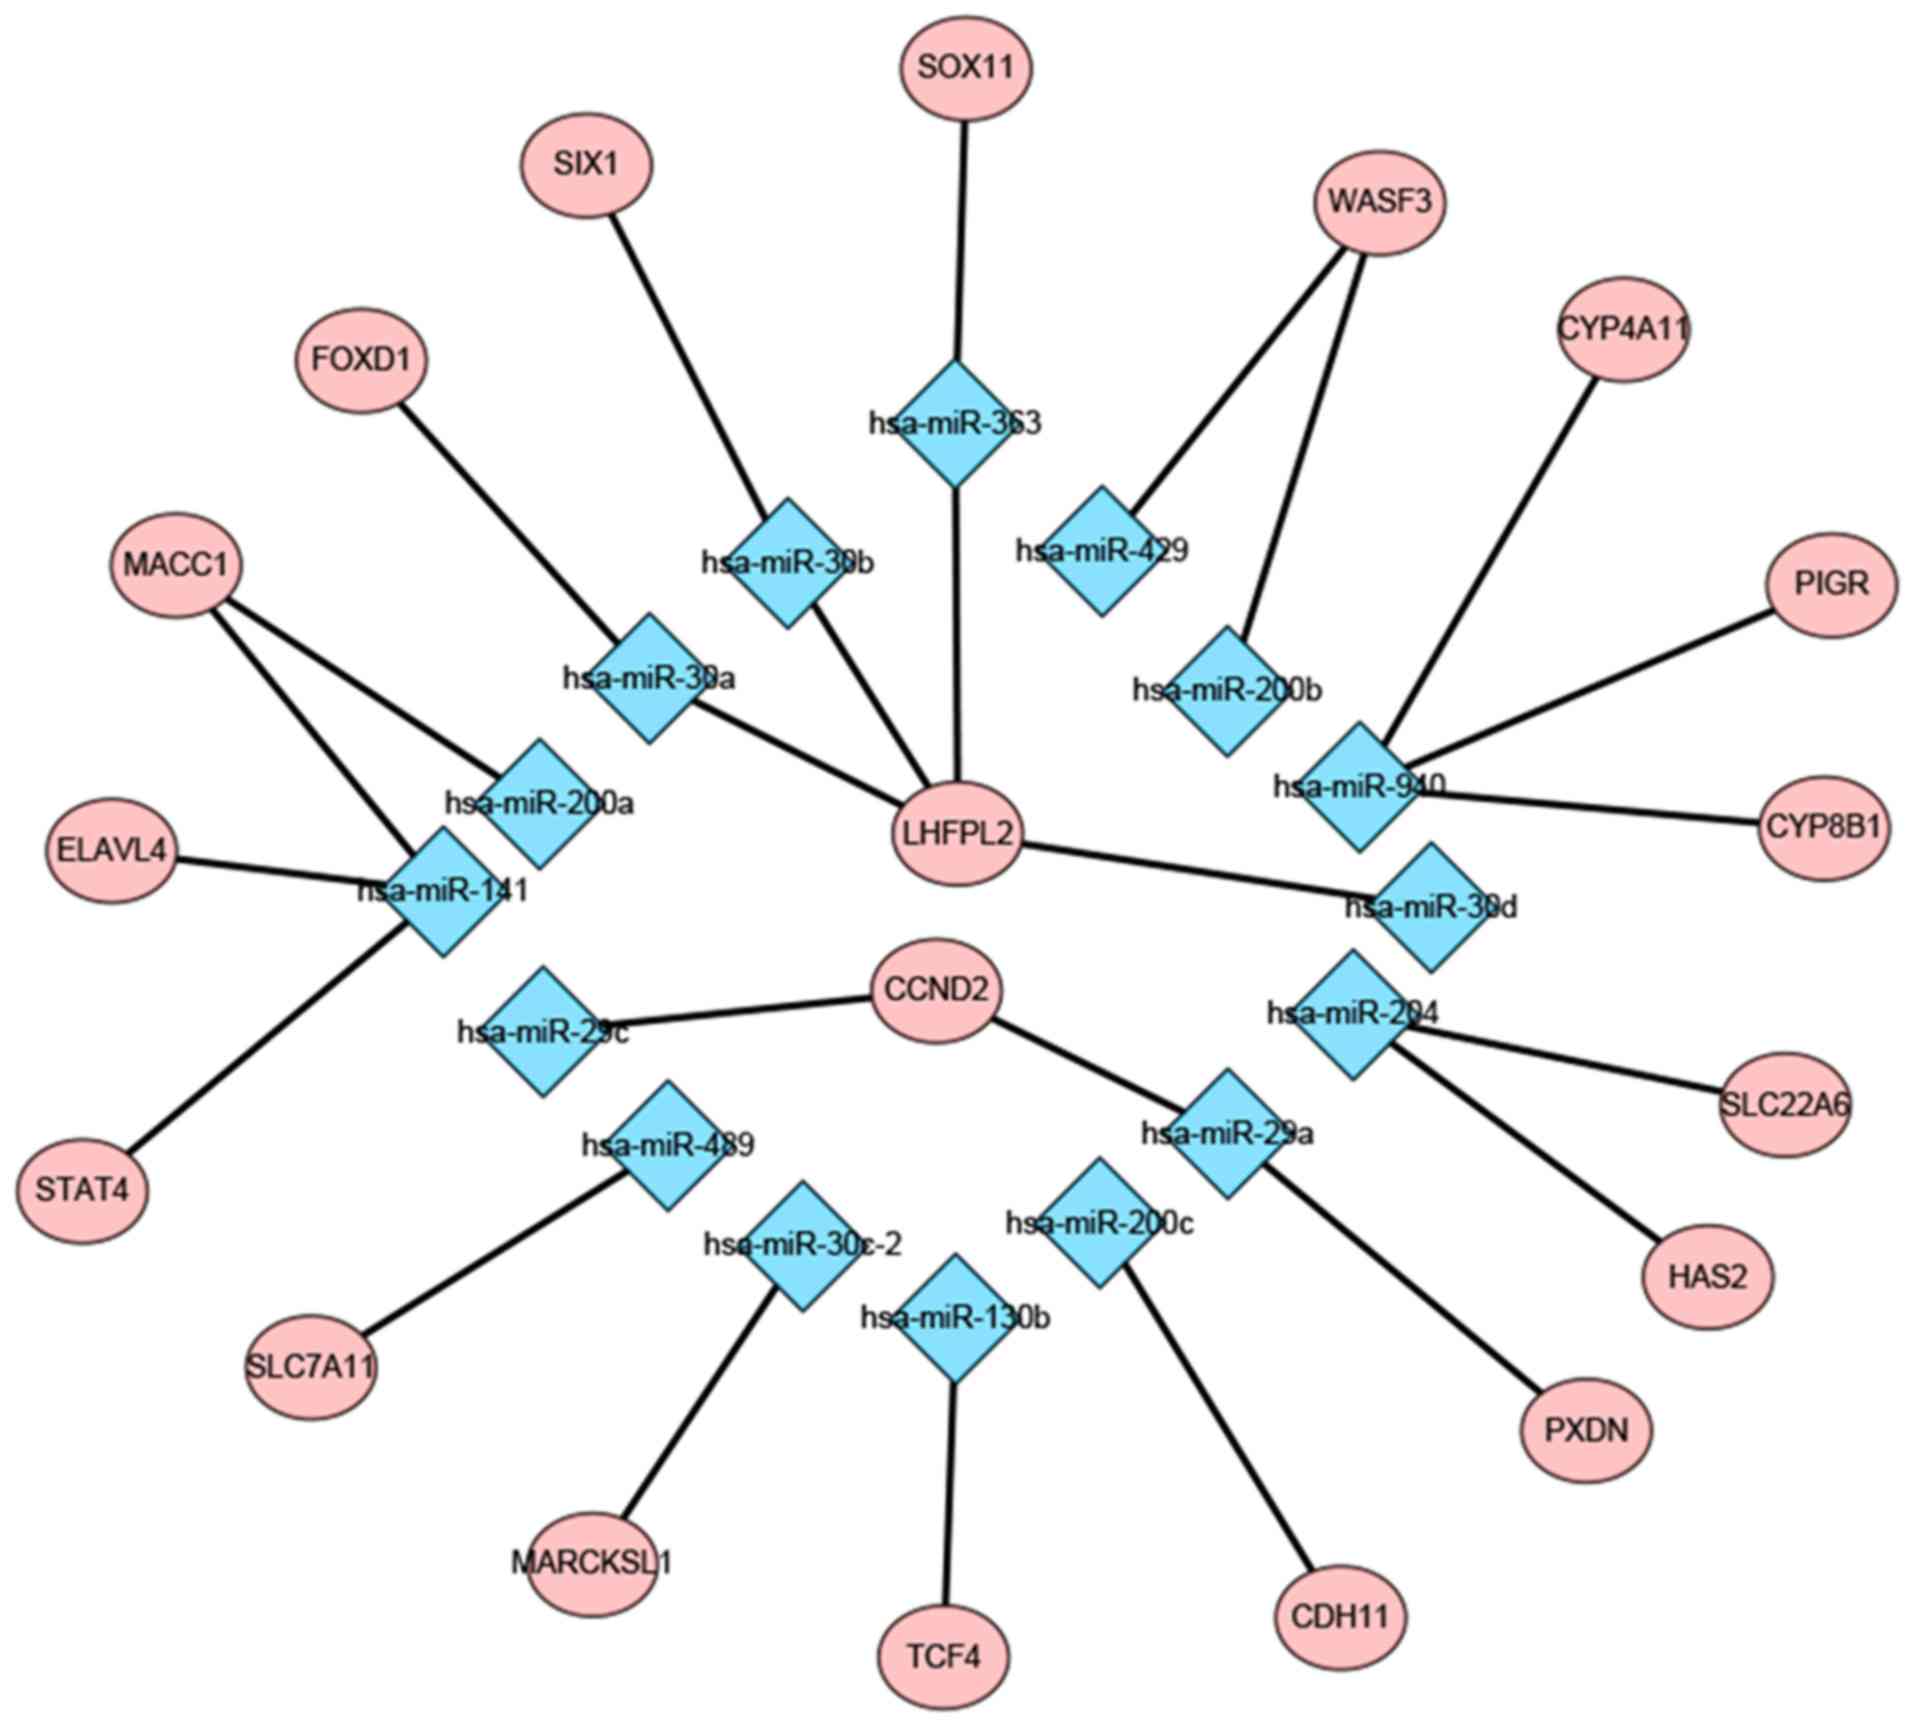
Prediction of a regulatory network of
DEMs-DEGs
A total of 879 target genes of the 6 upregulated and
23 downregulated miRNAs were predicted by the TargetScan,
miRTarBase and miRDB databases. Among the 879 genes, 19 were
identified to overlap with the identified DEGs (29–31).
Subsequently, the present study constructed a potential regulatory
network of the DEMs-DEGs, which was visualized using Cytoscape
(Fig. 7). In addition, Table SVI presents the GO term and KEGG
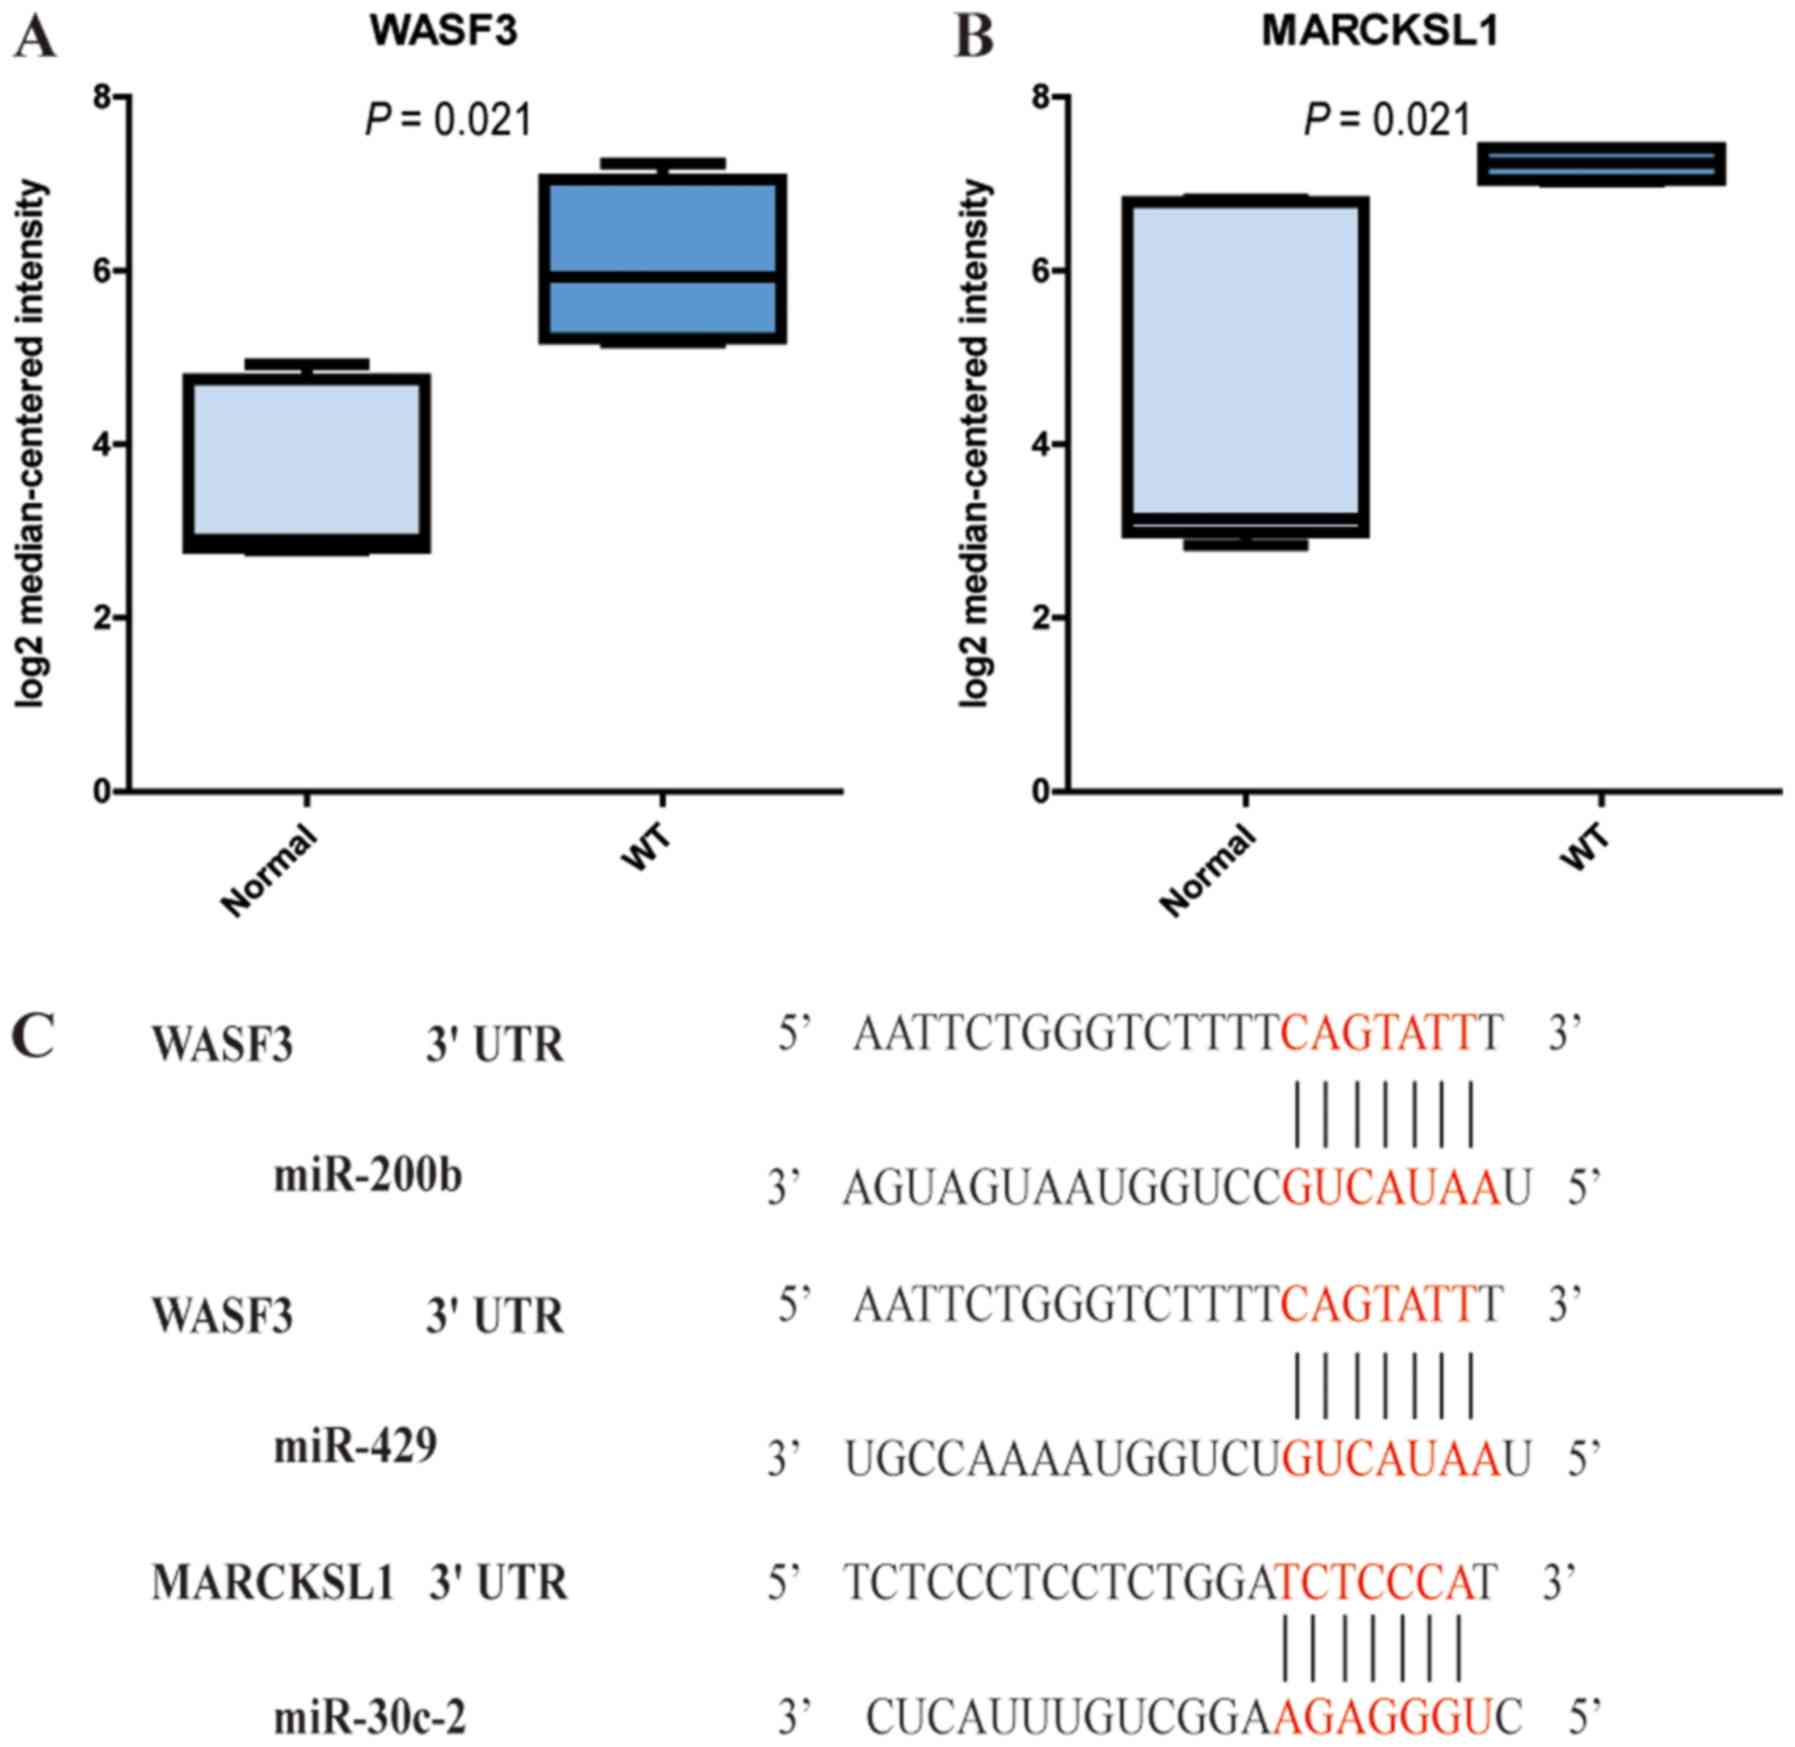
pathway enrichment analyses of the 19 overlapping genes. Among
these genes, Wiskott-Aldrich syndrome protein family member 3
(WASF3) and MARCKS like 1 (MARCKSL1) were enriched in the ‘Fc gamma
R-mediated phagocytosis pathway’. Subsequently, the present study
validated their expression using Oncomine and the Yusenko Renal
dataset and revealed that the two genes were overexpressed in WT
compared with in the normal group. When referring to the expression
profile of DEMs and the miRNA-mRNA network, downregulated
hsa-miR-200b, hsa-miR-429 and hsa-miR-30c-2 may be the upstream
regulatory elements of WASF3 and MARCKSL1 (Fig. 8).
Discussion
WT is a serious threat to the health of children and
develops as a result of abnormalities of various genes which are
normally responsible for cellular growth, proliferation and
differentiation (32,33). It has been reported that ~5% of
children have mutations in WT1 or epigenetic defects at chromosome
11p15, which are predispositions for WT (5,34). In
previous decades, a number of genes, including CTNNB1, WTX and
tumor protein p53, have been reported to be involved in the
tumorigenesis and progression of WT (35–37).
Therefore, identification of key genes is vital for understanding
the pathogenesis and abnormal biological behavior of WT, and to
identify novel therapeutic targets of WT.
First, the present study analyzed available
microarray and RNA-sequencing data from the GEO and TCGA databases
to identify significant DEGs and DEMs, and 613 significant DEGs
were selected by bioinformatics analysis. DAVID was used to perform
further analysis of these DEGs to identify their potential
associated cellular signaling pathways and functions. KEGG pathway
analysis revealed that 65 DEGs of WT were enriched in ‘Metabolic
pathways’, 12 were enriched in the ‘PPAR signaling pathway’ and 12
were enriched in ‘Protein digestion and absorption’. GO term
analysis indicated that DEGs were involved in the ‘response to
drug’, ‘ion transmembrane transport’ and ‘excretion’ biological
processes terms. Furthermore, the DEGs were demonstrated to serve a
role in ‘transporter activity’ and ‘heparin binding’ at the
molecular function level.
Subsequently, according to PPI network construction
and module analysis, a hub gene module was identified. This hub
gene module contained 28 upregulated genes, and BUB1 was considered
as the central gene. BUB1 was identified as the gene with the
highest degree (33) in the network,
while centromere protein A, ubiquitin conjugating enzyme E2 C and
kinesin family member 2C each had a degree of 32. KEGG and GO
analyses demonstrated that these 28 hub genes were mainly involved
in ‘Cell cycle’ and ‘Oocyte meiosis pathway’, and were also
associated with multiple processes of mitosis according to the
molecular biological function terms. Expression validation based on
the Oncomine database was performed to investigate the expression
levels of BUB1, BUB1B, CDC45, CCNB2 and PTTG1, which were all
associated with the ‘Cell cycle pathway’. As expected, all five
genes were upregulated in tumor tissues compared with in normal
samples. Therefore, it may be hypothesized that disorders of the
cell cycle pathway and associated genes may contribute to the
occurrence of WT.
Cell cycle progression consists of five known
phases: G0 (gap 0), G1 (gap 1), S (DNA
synthesis), G2 (gap 2) and M (mitosis) phase. A number
of checkpoints function between these phases to ensure that the
integrity of cellular components and the fidelity of DNA synthesis
are monitored (38). As is well
understood, an abnormal distribution of cells throughout the cell
cycle is a hallmark of human cancer, due to accumulating
alterations of genes in the cell cycle pathway possibly resulting
in impaired abilities of cell division, cell proliferation and
response to DNA damage (39,40). BUB1, a mitotic checkpoint protein,
has been demonstrated to be overexpressed in various types of
cancer, such as hepatocellular carcinoma and prostate cancer, and
has been associated with the proliferation, migration and invasion
of tumor cells (41,42). Furthermore, a number of studies have
suggested that BUB1 may be a biomarker for the clinical prognosis
of numerous types of tumor, including breast and gastric cancer
(43,44). Therefore, it is worth investigating
the role of BUB1 in WT further.
miRNAs are popularly applied in the diagnosis and
clinical prognosis of various types of tumor due to their
regulatory role of mRNAs, which affects the malignant behavior of
tumor cells (45,46). In addition, due to an increasing
amount of attention for miRNAs, a number of miRNAs have been
identified to be involved in the occurrence, development and
survival of tumor (47,48). Therefore, screening key miRNAs may be
beneficial to further investigate their specific roles in WT. By
integrating the miRNA microarray data in GSE57370 with the
miRNA-sequencing data in the TCGA dataset, 29 overlapping DEMs were
identified in the present study. These DEMs may serve important
roles in WT.
Furthermore, TargetScan, miRTarBase and miRDB were
used to predict the target genes of the DEMs and only genes
identified by all three databases were further analyzed.
Subsequently, 879 target genes were integrated with the
aforementioned DEGs, and 19 overlapping genes were identified. A
DEMs-DEGs network was constructed to reveal potential regulatory
pathways by which the 16 DEMs and 19 DEGs serve their roles. In
KEGG pathway analysis, two genes were revealed to be involved in
the Fc gamma R-mediated phagocytosis pathway. It was demonstrated
that WASF3 and MARCKSL1 were highly expressed in the tumor samples
in the Yusenko Renal dataset. Based on the expression profiles of
the DEMs and the miRNA-mRNA network, downregulated hsa-miR-200b and
hsa-miR-429 may be the upstream regulatory elements of WASF3, and
hsa-miR-30c-2 may be the regulator of MARCKSL1. It has been
reported that miR-200b may inhibit the growth and motility of
breast cancer cells (49). miR-429
can suppress the cell proliferation, migration and invasion of
nasopharyngeal carcinoma (50).
Similarly, miR-30c-2 has been demonstrated to be involved in cancer
cell proliferation and apoptosis (51). Additionally, WASF3 and MARCKSL1 have
been reported to be associated with malignant behaviors of certain
tumor types, including bladder and breast cancer (52,53).
Therefore, one may speculate that the three regulatory pathways of
miR-200b/WASF3, miR-429/WASF3 and miR-30c-2/MARCKSL1 may serve
significant roles in WT. However, this remains to be validated by
future experiments.
In the present study, five hub genes were
identified, and these were associated with the cell cycle pathway
and may be potential biomarkers of WT. Furthermore, the present
study predicted potential miRNA-mRNA regulatory pathways by
constructing an interaction network. These results may direct
experimental investigations regarding the molecular mechanisms in
WT.
In conclusion, the present study identified 613 DEGs
and 29 DEMs by bioinformatics analysis, which may be potential
biomarkers for the occurrence of WT. By screening the hub module in
a PPI network and performing functional enrichment analyses, five
hub genes (BUB1, BUB1B, CDC45, CCNB2 and PTTG1) associated with the
cell cycle and mitosis were identified. These may serve important
roles in WT. In addition, differential expression levels of these
genes were verified using the Oncomine database. Furthermore, the
present study predicted potential regulatory mechanisms of the DEMs
and DEGs in WT, and aimed to assist further molecular biological
investigations that may verify these mechanisms.
Supplementary Material
Supporting Data
Supporting Data
Supporting Data
Supporting Data
Supporting Data
Supporting Data
Supporting Data
Acknowledgements
Not applicable.
Funding
The present study was supported by the National
Natural Science Funding of China (grant nos. 81600514 and
81670608).
Availability of data and materials
The datasets generated and/or analyzed during the
current study are available in the Gene Expression Omnibus
repository (accession numbers GSE66405 and GSE57370) and TCGA
repository (mRNA, https://portal.gdc.cancer.gov/repository?facetTab=files&filters=%7B%22op%22%3A%22and%22%2C%22content%22%3A%5B%7B%22op%22%3A%22in%22%2C%22content%22%3A%7B%22field%22%3A%22cases.project.project_id%22%2C%22value%22%3A%5B%22TARGET-WT%22%5D%7D%7D%2C%7B%22op%22%3A%22in%22%2C%22content%22%3A%7B%22field%22%3A%22files.analysis.workflow_type%22%2C%22value%22%3A%5B%22HTSeq%20-%20Counts%22%5D%7D%7D%2C%7B%22op%22%3A%22in%22%2C%22content%22%3A%7B%22field%22%3A%22files.experimental_strategy%22%2C%22value%22%3A%5B%22RNA-Seq%22%5D%7D%7D%5D%7D;
miRNA, https://portal.gdc.cancer.gov/repository?facetTab=files&filters=%7B%22op%22%3A%22and%22%2C%22content%22%3A%5B%7B%22op%22%3A%22in%22%2C%22content%22%3A%7B%22field%22%3A%22cases.project.project_id%22%2C%22value%22%3A%5B%22TARGET-WT%22%5D%7D%7D%2C%7B%22op%22%3A%22in%22%2C%22content%22%3A%7B%22field%22%3A%22files.data_category%22%2C%22value%22%3A%5B%22Transcriptome%20Profiling%22%5D%7D%7D%2C%7B%22op%22%3A%22in%22%2C%22content%22%3A%7B%22field%22%3A%22files.data_type%22%2C%22value%22%3A%5B%22miRNA%20Expression%20Quantification%22%5D%7D%7D%2C%7B%22op%22%3A%22in%22%2C%22content%22%3A%7B%22field%22%3A%22files.experimental_strategy%22%2C%22value%22%3A%5B%22miRNA-Seq%22%5D%7D%7D%5D%7D&searchTableTab=files).
The remaining datasets used and/or analyzed during the current
study are available from the corresponding author on reasonable
request.
Authors' contributions
WW, MT and WZ designed the study and contributed to
language editing and proofreading. RL, ZQ, YW, LZ and XG retrieved
and processed the data. LZ and XZ analyzed the data. LZ and XG
wrote and edited the manuscript, and prepared figures and tables.
All authors read and approved the final manuscript.
Ethics approval and consent to
participate
Not applicable.
Patient consent for publication
Not applicable.
Competing interests
The authors declare that they have no competing
interests.
References
|
1
|
Charlton J, Pavasovic V and
Pritchard-Jones K: Biomarkers to detect Wilms tumors in pediatric
patients: Where are we now? Future Oncol. 11:2221–2234. 2015.
View Article : Google Scholar : PubMed/NCBI
|
|
2
|
Scott RH, Stiller CA, Walker L and Rahman
N: Syndromes and constitutional chromosomal abnormalities
associated with Wilms tumour. J Med Genet. 43:705–715. 2006.
View Article : Google Scholar : PubMed/NCBI
|
|
3
|
Hung IJ, Chang WH, Yang CP, Jaing TH,
Liang DC, Lin KH, Lin DT, Hsiao CC, Hsieh YL, Chen JS, et al:
Epidemiology, clinical features and treatment outcome of Wilms'
tumor in Taiwan: A report from Taiwan pediatric oncology group. J
Formos Med Assoc. 103:104–111. 2004.PubMed/NCBI
|
|
4
|
Al-Hussain T, Ali A and Akhtar M: Wilms
tumor: An update. Adv Anat Pathol. 21:166–173. 2014. View Article : Google Scholar : PubMed/NCBI
|
|
5
|
Segers H, Kersseboom R, Alders M, Pieters
R, Wagner A and van den Heuvel-Eibrink MM: Frequency of WT1 and
11p15 constitutional aberrations and phenotypic correlation in
childhood Wilms tumour patients. Eur J Cancer. 48:3249–3256. 2012.
View Article : Google Scholar : PubMed/NCBI
|
|
6
|
Fukuzawa R, Holman SK, Chow CW,
Savarirayan R, Reeve AE and Robertson SP: WTX mutations can occur
both early and late in the pathogenesis of Wilms tumour. J Med
Genet. 47:791–794. 2010. View Article : Google Scholar : PubMed/NCBI
|
|
7
|
Li CM, Kim CE, Margolin AA, Guo M, Zhu J,
Mason JM, Hensle TW, Murty VV, Grundy PE, Fearon ER, et al: CTNNB1
mutations and overexpression of Wnt/beta-catenin target genes in
WT1-mutant Wilms' tumors. Am J Pathol. 165:1943–1953. 2004.
View Article : Google Scholar : PubMed/NCBI
|
|
8
|
Haber DA, Buckler AJ, Glaser T, Call KM,
Pelletier J, Sohn RL, Douglass EC and Housman DE: An internal
deletion within an 11p13 zinc finger gene contributes to the
development of Wilms' tumor. Cell. 61:1257–1269. 1990. View Article : Google Scholar : PubMed/NCBI
|
|
9
|
Scott RH, Murray A, Baskcomb L, Turnbull
C, Loveday C, Al-Saadi R, Williams R, Breatnach F, Gerrard M, Hale
J, et al: Stratification of Wilms tumor by genetic and epigenetic
analysis. Oncotarget. 3:327–335. 2012. View Article : Google Scholar : PubMed/NCBI
|
|
10
|
Fu W, Zhuo Z, Hua RX, Fu K, Jia W, Zhu J,
Zhang J, Cheng J, Zhou H, Xia H, et al: Association of KRAS and
NRAS gene polymorphisms with Wilms tumor risk: A four-center
case-control study. Aging (Albany NY). 11:1551–1563. 2019.
View Article : Google Scholar : PubMed/NCBI
|
|
11
|
Diets IJ, Hoyer J, Ekici AB, Popp B,
Hoogerbrugge N, van Reijmersdal SV, Bhaskaran R, Hadjihannas M,
Vasileiou G, Thiel CT, et al: TRIM28 haploinsufficiency predisposes
to Wilms tumor. Int J Cancer. 145:941–951. 2019. View Article : Google Scholar : PubMed/NCBI
|
|
12
|
Polosukhina D, Love HD, Correa H, Su Z,
Dahlman KB, Pao W, Moses HL, Arteaga CL, Lovvorn HN III, Zent R and
Clark PE: Functional KRAS mutations and a potential role for
PI3K/AKT activation in Wilms tumors. Mol Oncol. 11:405–421. 2017.
View Article : Google Scholar : PubMed/NCBI
|
|
13
|
Bartel DP: MicroRNAs: Genomics,
biogenesis, mechanism, and function. Cell. 116:281–297. 2004.
View Article : Google Scholar : PubMed/NCBI
|
|
14
|
Volinia S, Calin GA, Liu CG, Ambs S,
Cimmino A, Petrocca F, Visone R, Iorio M, Roldo C, Ferracin M, et
al: A microRNA expression signature of human solid tumors defines
cancer gene targets. Proc Natl Acad Sci USA. 103:2257–2261. 2006.
View Article : Google Scholar : PubMed/NCBI
|
|
15
|
Liu GL, Yang HJ, Liu B and Liu T: Effects
of microRNA-19b on the proliferation, apoptosis, and migration of
Wilms' tumor cells via the PTEN/PI3K/AKT signaling pathway. J Cell
Biochem. 118:3424–3434. 2017. View Article : Google Scholar : PubMed/NCBI
|
|
16
|
Zhu S, Zhang L, Zhao Z, Fu W, Fu K, Liu G
and Jia W: MicroRNA-92a-3p inhibits the cell proliferation,
migration and invasion of Wilms tumor by targeting NOTCH1. Oncol
Rep. 40:571–578. 2018.PubMed/NCBI
|
|
17
|
Vogelstein B, Papadopoulos N, Velculescu
VE, Zhou S, Diaz LA Jr and Kinzler KW: Cancer genome landscapes.
Science. 339:1546–1558. 2013. View Article : Google Scholar : PubMed/NCBI
|
|
18
|
Guo Y, Bao Y, Ma M and Yang W:
Identification of key candidate genes and pathways in colorectal
cancer by integrated bioinformatical analysis. Int J Mol Sci.
18:E7222017. View Article : Google Scholar : PubMed/NCBI
|
|
19
|
Ludwig N, Werner TV, Backes C, Trampert P,
Gessler M, Keller A, Lenhof HP, Graf N and Meese E: Combining miRNA
and mRNA expression profiles in Wilms tumor subtypes. Int J Mol
Sci. 17:4752016. View Article : Google Scholar : PubMed/NCBI
|
|
20
|
Wegert J, Ishaque N, Vardapour R, Geörg C,
Gu Z, Bieg M, Ziegler B, Bausenwein S, Nourkami N, Ludwig N, et al:
Mutations in the SIX1/2 pathway and the DROSHA/DGCR8 miRNA
microprocessor complex underlie high-risk blastemal type Wilms
tumors. Cancer Cell. 27:298–311. 2015. View Article : Google Scholar : PubMed/NCBI
|
|
21
|
Tomczak K, Czerwińska P and Wiznerowicz M:
The cancer genome atlas (TCGA): An immeasurable source of
knowledge. Contemp Oncol (Pozn). 19:A68–A77. 2015.PubMed/NCBI
|
|
22
|
Diboun I, Wernisch L, Orengo CA and
Koltzenburg M: Microarray analysis after RNA amplification can
detect pronounced differences in gene expression using limma. BMC
Genomics. 7:2522006. View Article : Google Scholar : PubMed/NCBI
|
|
23
|
Robinson MD, McCarthy DJ and Smyth GK:
EdgeR: A Bioconductor package for differential expression analysis
of digital gene expression data. Bioinformatics. 26:139–140. 2010.
View Article : Google Scholar : PubMed/NCBI
|
|
24
|
Dennis G Jr, Sherman BT, Hosack DA, Yang
J, Gao W, Lane HC and Lempicki RA: DAVID: Database for annotation,
visualization, and integrated discovery. Genome Biol. 4:P32003.
View Article : Google Scholar : PubMed/NCBI
|
|
25
|
Szklarczyk D, Franceschini A, Wyder S,
Forslund K, Heller D, Huerta-Cepas J, Simonovic M, Roth A, Santos
A, Tsafou KP, et al: STRING v10: Protein-protein interaction
networks, integrated over the tree of life. Nucleic Acids Res.
43:D447–D452. 2015. View Article : Google Scholar : PubMed/NCBI
|
|
26
|
Smoot ME, Ono K, Ruscheinski J, Wang PL
and Ideker T: Cytoscape 2.8: New features for data integration and
network visualization. Bioinformatics. 27:431–432. 2011. View Article : Google Scholar : PubMed/NCBI
|
|
27
|
Bader GD and Hogue CW: An automated method
for finding molecular complexes in large protein interaction
networks. BMC Bioinformatics. 4:22003. View Article : Google Scholar : PubMed/NCBI
|
|
28
|
Yusenko MV, Kuiper RP, Boethe T, Ljungberg
B, van Kessel AG and Kovacs G: High-resolution DNA copy number and
gene expression analyses distinguish chromophobe renal cell
carcinomas and renal oncocytomas. BMC Cancer. 9:1522009. View Article : Google Scholar : PubMed/NCBI
|
|
29
|
Agarwal V, Bell GW, Nam JW and Bartel DP:
Predicting effective microRNA target sites in mammalian mRNAs.
Elife. 4:050052015. View Article : Google Scholar
|
|
30
|
Chou CH, Chang NW, Shrestha S, Hsu SD, Lin
YL, Lee WH, Yang CD, Hong HC, Wei TY, Tu SJ, et al: miRTarBase
2016: Updates to the experimentally validated miRNA-target
interactions database. Nucleic Acids Res. 44:D239–D247. 2016.
View Article : Google Scholar : PubMed/NCBI
|
|
31
|
Wong N and Wang X: miRDB: An online
resource for microRNA target prediction and functional annotations.
Nucleic Acids Res. 43:D146–D152. 2015. View Article : Google Scholar : PubMed/NCBI
|
|
32
|
Pierce J, Murphy AJ, Panzer A, de
Caestecker C, Ayers GD, Neblett D, Saito-Diaz K, de Caestecker M
and Lovvorn HN III: SIX2 effects on wilms tumor biology. Transl
Oncol. 7:800–811. 2014. View Article : Google Scholar : PubMed/NCBI
|
|
33
|
Yap LW, Brok J and Pritchard-Jones K: Role
of CD56 in normal kidney development and Wilms tumorigenesis. Fetal
Pediatr Pathol. 36:62–75. 2017. View Article : Google Scholar : PubMed/NCBI
|
|
34
|
Nordenskjöld A, Friedman E, Sandstedt B,
Söderhäll S and Anvret M: Constitutional and somatic mutations in
the WT1 gene in Wilms' tumor patients. Int J Cancer. 63:516–522.
1995. View Article : Google Scholar : PubMed/NCBI
|
|
35
|
Alexandrescu S, Akhavanfard S, Harris MH
and Vargas SO: Clinical, pathologic, and genetic features of Wilms
tumors with WTX gene mutation. Pediatr Dev Pathol. 20:105–111.
2017. View Article : Google Scholar : PubMed/NCBI
|
|
36
|
Deng C, Dai R, Li X and Liu F: Genetic
variation frequencies in Wilms' tumor: A meta-analysis and
systematic review. Cancer Sci. 107:690–699. 2016. View Article : Google Scholar : PubMed/NCBI
|
|
37
|
Ooms AH, Gadd S, Gerhard DS, Smith MA,
Guidry Auvil JM, Meerzaman D, Chen QR, Hsu CH, Yan C, Nguyen C, et
al: Significance of TP53 mutation in Wilms tumors with diffuse
anaplasia: A report from the children's oncology group. Clin Cancer
Res. 22:5582–5591. 2016. View Article : Google Scholar : PubMed/NCBI
|
|
38
|
Dominguez-Brauer C, Thu KL, Mason JM,
Blaser H, Bray MR and Mak TW: Targeting mitosis in cancer: Emerging
strategies. Mol Cell. 60:524–536. 2015. View Article : Google Scholar : PubMed/NCBI
|
|
39
|
Alimbetov D, Askarova S, Umbayev B, Davis
T and Kipling D: Pharmacological targeting of cell cycle, apoptotic
and cell adhesion signaling pathways implicated in chemoresistance
of cancer cells. Int J Mol Sci. 19:E16902018. View Article : Google Scholar : PubMed/NCBI
|
|
40
|
Knudsen ES, Pruitt SC, Hershberger PA,
Witkiewicz AK and Goodrich DW: Cell cycle and beyond: Exploiting
new RB1 controlled mechanisms for cancer therapy. Trends Cancer.
5:308–324. 2019. View Article : Google Scholar : PubMed/NCBI
|
|
41
|
Xu B, Xu T, Liu H, Min Q, Wang S and Song
Q: miR-490-5p suppresses cell proliferation and invasion by
targeting BUB1 in hepatocellular carcinoma cells. Pharmacology.
100:269–282. 2017. View Article : Google Scholar : PubMed/NCBI
|
|
42
|
Fu X, Chen G, Cai ZD, Wang C, Liu ZZ, Lin
ZY, Wu YD, Liang YX, Han ZD, Liu JC and Zhong WD: Overexpression of
BUB1B contributes to progression of prostate cancer and predicts
poor outcome in patients with prostate cancer. Onco Targets Ther.
9:2211–2220. 2016.PubMed/NCBI
|
|
43
|
Stahl D, Braun M, Gentles AJ, Lingohr P,
Walter A, Kristiansen G and Gütgemann I: Low BUB1 expression is an
adverse prognostic marker in gastric adenocarcinoma. Oncotarget.
8:76329–76339. 2017. View Article : Google Scholar : PubMed/NCBI
|
|
44
|
Ocaña A, Pérez-Peña J, Díez-González L,
Sánchez-Corrales V, Templeton A, Seruga B, Amir E and Pandiella A:
Transcriptomic analyses identify association between mitotic
kinases, PDZ-binding kinase and BUB1, and clinical outcome in
breast cancer. Breast Cancer Res Treat. 156:1–8. 2016. View Article : Google Scholar : PubMed/NCBI
|
|
45
|
Wei YT, Guo DW, Hou XZ and Jiang DQ:
miRNA-223 suppresses FOXO1 and functions as a potential tumor
marker in breast cancer. Cell Mol Biol (Noisy-le-grand).
63:113–118. 2017. View Article : Google Scholar : PubMed/NCBI
|
|
46
|
Sharma P and Sharma R: miRNA-mRNA
crosstalk in esophageal cancer: From diagnosis to therapy. Crit Rev
Oncol Hematol. 96:449–462. 2015. View Article : Google Scholar : PubMed/NCBI
|
|
47
|
Zhang D, Zhao L, Shen Q, Lv Q, Jin M, Ma
H, Nie X, Zheng X, Huang S, Zhou P, et al: Down-regulation of
KIAA1199/CEMIP by miR-216a suppresses tumor invasion and metastasis
in colorectal cancer. Int J Cancer. 140:2298–2309. 2017. View Article : Google Scholar : PubMed/NCBI
|
|
48
|
Jia AY, Castillo-Martin M, Bonal DM,
Sánchez-Carbayo M, Silva JM and Cordon-Cardo C: MicroRNA-126
inhibits invasion in bladder cancer via regulation of ADAM9. Br J
Cancer. 110:2945–2954. 2014. View Article : Google Scholar : PubMed/NCBI
|
|
49
|
Lv Z, Wei J, You W, Wang R, Shang J, Xiong
Y, Yang H, Yang X and Fu Z: Disruption of the
c-Myc/miR-200b-3p/PRDX2 regulatory loop enhances tumor metastasis
and chemotherapeutic resistance in colorectal cancer. J Transl Med.
15:2572017. View Article : Google Scholar : PubMed/NCBI
|
|
50
|
Wang Z, Zhu Z, Lin Z, Luo Y, Liang Z,
Zhang C, Chen J and Peng P: miR-429 suppresses cell proliferation,
migration and invasion in nasopharyngeal carcinoma by
downregulation of TLN1. Cancer Cell Int. 19:1152019. View Article : Google Scholar : PubMed/NCBI
|
|
51
|
Tang CT, Liang Q, Yang L, Lin XL, Wu S,
Chen Y, Zhang XT, Gao YJ and Ge ZZ: RAB31 targeted by miR-30c-2-3p
regulates the GLI1 signaling pathway, affecting gastric cancer cell
proliferation and apoptosis. Front Oncol. 8:5542018. View Article : Google Scholar : PubMed/NCBI
|
|
52
|
Jin H, Xie Q, Guo X, Xu J, Wang A, Li J,
Zhu J, Wu XR, Huang H and Huang C: p63α protein up-regulates heat
shock protein 70 expression via E2F1 transcription factor 1,
promoting Wasf3/Wave3/MMP9 signaling and bladder cancer invasion. J
Biol Chem. 292:15952–15963. 2017. View Article : Google Scholar : PubMed/NCBI
|
|
53
|
Kim BR, Dong SM, Seo SH, Lee JH, Lee JM,
Lee SH and Rho SB: Lysyl oxidase-like 2 (LOXL2) controls
tumor-associated cell proliferation through the interaction with
MARCKSL1. Cell Signal. 26:1765–1773. 2014. View Article : Google Scholar : PubMed/NCBI
|