Introduction
Lumbar disc prolapse (LDP) is a common type of
intervertebral disk degeneration disease (DDD) caused by
intervertebral disc degeneration (IDD). LDP results in serious
lower back pain and sciatia, causes short-term disability and
affects ~5% of the public population (1).
The molecular biological mechanism of DDD has been
studied for numerous years, with the primary focus on IDD (2–7), and
substantial progress has been made in the pathophysiology of IDD
(8–15). However, the specific mechanisms
underlying LDP, a specific type of DDD, have rarely been studied
individually, and almost all studies on IDD are based on the
analysis of intervertebral disc (IVD) tissues. The IVD is a complex
structure containing annulus fibrosis (AF) and nucleus pulpous
(NP), and the pathophysiological processes that occur in these two
components during degeneration are distinctly different. Therefore,
completely distinguishing between the two is difficult when
collecting IVD tissue. Thus, the etiopathogeneses of LDP and IDD
remain incompletely understood. The current limitation in the
understanding of the pathogenesis has restricted the clinical
treatment of this condition and obtaining a more comprehensive
interpretation of the mechanisms underlying LDP is therefore
critical for the development of successful therapeutic
strategies.
To date, only one study has explored the gene
expression profile of peripheral blood mononuclear cells obtained
from patients with IDD and limited data are available on the
transcriptome characteristics of whole blood (WB) in either IDD or
LDP. Thus, in the present study, microarray analysis was used to
investigate the mRNA transcriptome characteristics of WB obtained
from LDP patients. Differentially expressed genes (DEGs) in WB
(WB-DEGs) were identified and subjected to functional analyses.
DEGs in the degenerative AF (AF-DEGs) and NP (NP-DEGs) compared
with non-degenerative tissues were also identified based on
microarray data and the intersections of the WB-DEGs, AF-DEGs and
NP-DEGs were evaluated. Reverse transcription-quantitative
(RT-q)PCR assays were also performed using WB from the same 8 IDD
patients and 8 healthy volunteers to measure the expression levels
of selected WB-DEGs and DEGs common to WB-DEGs, AF-DEGs and NP-DEGs
(common DEGs).
Materials and methods
Human WB collection and ethics
statement
A total of 8 patients, including 4 males and 4
females aged between 33 and 60 years, as well as 8 volunteers,
including 4 males and 4 females aged between 19 and 23 years, were
recruited for the present study. For the patient group, the
inclusion criteria were as follows: Age of 35–60 years; severe
lower back pain and sciatica within 4 weeks; LDP confirmed by MRI;
and no drug use within 3 months. The development of LDP is based on
IDD, which is an age-related process, with the degree of
histopathologic degeneration increasing with age. All the patients
in the present study were diagnosed with LDP following MRI
examination. Previous studies have not described the degree of
histopathologic degeneration that may be observed in IDD via MRI.
LDP is a common disease in middle-aged and elderly people and
therefore, all patients recruited into the present study were aged
between 35–60 years. However, control group patients were not age
matched, as older individuals may have exhibited more degeneration,
making it harder to compare those with the disease to those that
were healthy. Younger controls were therefore selected for the
current study. Thus, the expression of certain genes associated
with LDP may not be statistically different between the two groups.
Young people (<24 years) are therefore more representative of
those without IDD or low IDD. Tsai et al (16) compared specimens obtained from young
and elderly individuals to investigate gene expression in IDD. The
current study therefore recruited young people as controls, with
all volunteers attending college. The inclusion criteria were as
follows: Age between 18 and 25 years; never experienced lower back
pain or sciatica; and no drug use within 3 months. For the two
groups, the exclusion criteria were as follows: Other types of
spinal disease, deformities, trauma, surgery, basic metabolic
disease, rheumatism, congenital disease or congenital disability,
tuberculosis and tumors. A total of 10 ml of fasting WB was
collected from the left medial cubital vein of each participant
between 7:00 and 7:30 a.m. All WB samples were immediately
incubated in a PAX gene Blood RNA tube (BD Biosciences) for 36–72 h
at −20°C and then sent to Shanghai Bohao Biotechnology Co., Ltd.
for gene chip hybridization screening.
All procedures described in the present study were
authorized by the Ethics Committee of the Sichuan Provincial
Orthopedic Hospital (Chengdu), and all patients and donors enrolled
in the study provided written informed consent to participate in
the study. The WB samples were collected between April 2018 and
August 2018 at Sichuan Provincial Orthopedic Hospital
(Chengdu).
Microarray analysis
Chip scanning was accomplished on an Agilent
Microarray Scanner platform (Agilent Technologies, Inc.). Gene chip
hybridization screening was performed between September 2018 and
October 2018 using an Agilent SurePrint G3 human gene expression
microarray 8×60 K at Shanghai Biotechnology Co., Ltd. following the
standard protocol of Agilent Technologies, Inc. The complete data
sets containing the gene expression profiles of the WB samples were
uploaded to the gene expression omnibus (GEO) database (http://www.ncbi.nlm.nih.gov/geo) and are
accessible under the accession no. GSE124272.
Identification of WB-DEGs
The raw data obtained in the chip scan were
normalized using the limma package in R. To identify WB-DEGs, the
Quantile algorithm was used, and the signal value was
log2-normalized. Student's t-test was performed with a threshold
P-value of 0.05 and absolute fold change (FC) of 2 to identify
WB-DEGs. For genes with multiple probes, the average FC value was
used.
Enrichment analysis
The enrichment analysis included Gene Ontology (GO)
and Kyoto Encyclopedia of Genes and Genomes (KEGG) pathway
analysis. The method adopted in the present study was Fisher's
exact test and the clusterProfiler package from R/bioconductor was
used to perform the enrichment analysis. The criteria selected were
the number of genes that were enriched in a certain term/GO term ≥2
and a P-value <0.05. The most significant terms/pathways
obtained by the enrichment analysis were ranked according to the
enrichment factor calculated as follows: Enrichment factor =
(number of DEGs in a term/total number of DEGs)/(total number of
genes in the database in a term/total number of genes in the
database).
Protein-protein interaction (PPI)
network and module analysis
DEGs were mapped using the Search Tool for the
Retrieval of Interacting Genes (STRING; http://string-db.org) using the default instructions.
Disconnected nodes in the network were excluded. A PPI network of
nodes with a combined score >0.4 was then constructed using
Cytoscape software (V3.6.1; http://www.cytoscape.org/). Degree centrality was
calculated with the plug-in CentiScaPe and the plug-in MCODE was
applied to filter out significant submodules according to the
following criteria: ‘degree cutoff = 2’, ‘node score cutoff = 0.2’,
‘k-core = 2’ and ‘max depth = 100’.
IVD microarray data
The microarray dataset GSE70362 based on the
Affymetrix GPL17810 platform [HG-U133_Plus_2] was downloaded from
the GEO database. This dataset contains gene expression data for 24
AF and 24 NP samples from the post-mortem tissues from 19 donors
aged between 21 and 82 years. All samples were collected from
T12/L1 to L4/L5 at <12 h after declaring brain death. The
original signal intensity data in CEL-format files and
classification based on the Thompson grading system (17) were downloaded for analysis for the
present study. To annotate the data, the original probe IDs were
transformed into gene symbols. Any unidentified probes were
discarded. For genes with multiple probes, the average FC value was
used. Within each set of 24 samples (AF or NP), 8 samples
classified as Thompson grade I or I–II were considered
non-degenerative, and 16 samples classified as Thompson grades II
to V were considered degenerative.
Identification of common DEGs
GeneSpring GX 11.5 software (Agilent Technologies,
Inc.) was employed to identify the AF-DEGs and NP-DEGs. The initial
data were pre-processed by using the Robust Multi-array Average
procedure. Paired t-tests were performed with a threshold P-value
of 0.05 and FC of 1.5 to identify AF-DEGs and NP-DEGs. When taking
the intersection of the three, WB-DEGs with FC>1.5 were
filtered.
Total RNA extraction, complementary
(c)DNA synthesis and RT-qPCR
Total RNA was extracted from blood cells and
purified using a PX Blood RNA Kit (Omega Bio-Tek, Inc.) following
the manufacturer's protocol. Each RNA sample was
reverse-transcribed into cDNA using a ReverTra Ace qPCR Kit
(Toyobo) and the cDNA was subsequently amplified using real-time
qPCR. Gene expression levels were quantified using a 7500 HT
Sequence Detection System with Power SYBR Green PCR Master Mix
(both from Applied Biosystems; Thermo Fisher Scientific, Inc.).
Primers for specific genes were designed by Primer Express (V3.0.1
http://www.thermofisher.com) and
synthesized by Sangon Biotech Co. All forward and reverse primers
used for qPCR are listed in Table
SI. The thermocycling conditions consisted of an initial
denaturation at 95°C for 10 min, followed by 40 cycles of 95°C for
10 sec, 60°C for 1 min, and a final extension at 60°C for 1 min.
The β-actin gene was used as an internal control, and gene
expression levels were normalized to those of β-actin according to
the 2−ΔΔCq method (17).
Statistical analysis
The RT-qPCR data are expressed as the mean ±
standard deviation. Statistical analyses were performed using
Student's t-test in GraphPad Prism 6.0 (GraphPad Software Inc.).
P<0.05 was considered to indicate statistical significance.
Results
WB-DEGs
A total of 58,341 probe sets corresponding to 34,758
genes were obtained using the Agilent SurePrint G3 human gene
expression microarray 8×60 K. A total of 161 genes in WB were
identified to be differentially expressed between LDP patients and
healthy volunteers with P<0.05 and FC>2. All of these DEGs
are listed in Table SII. These DEGs
represented 0.28% of the total transcriptome. A total of 128
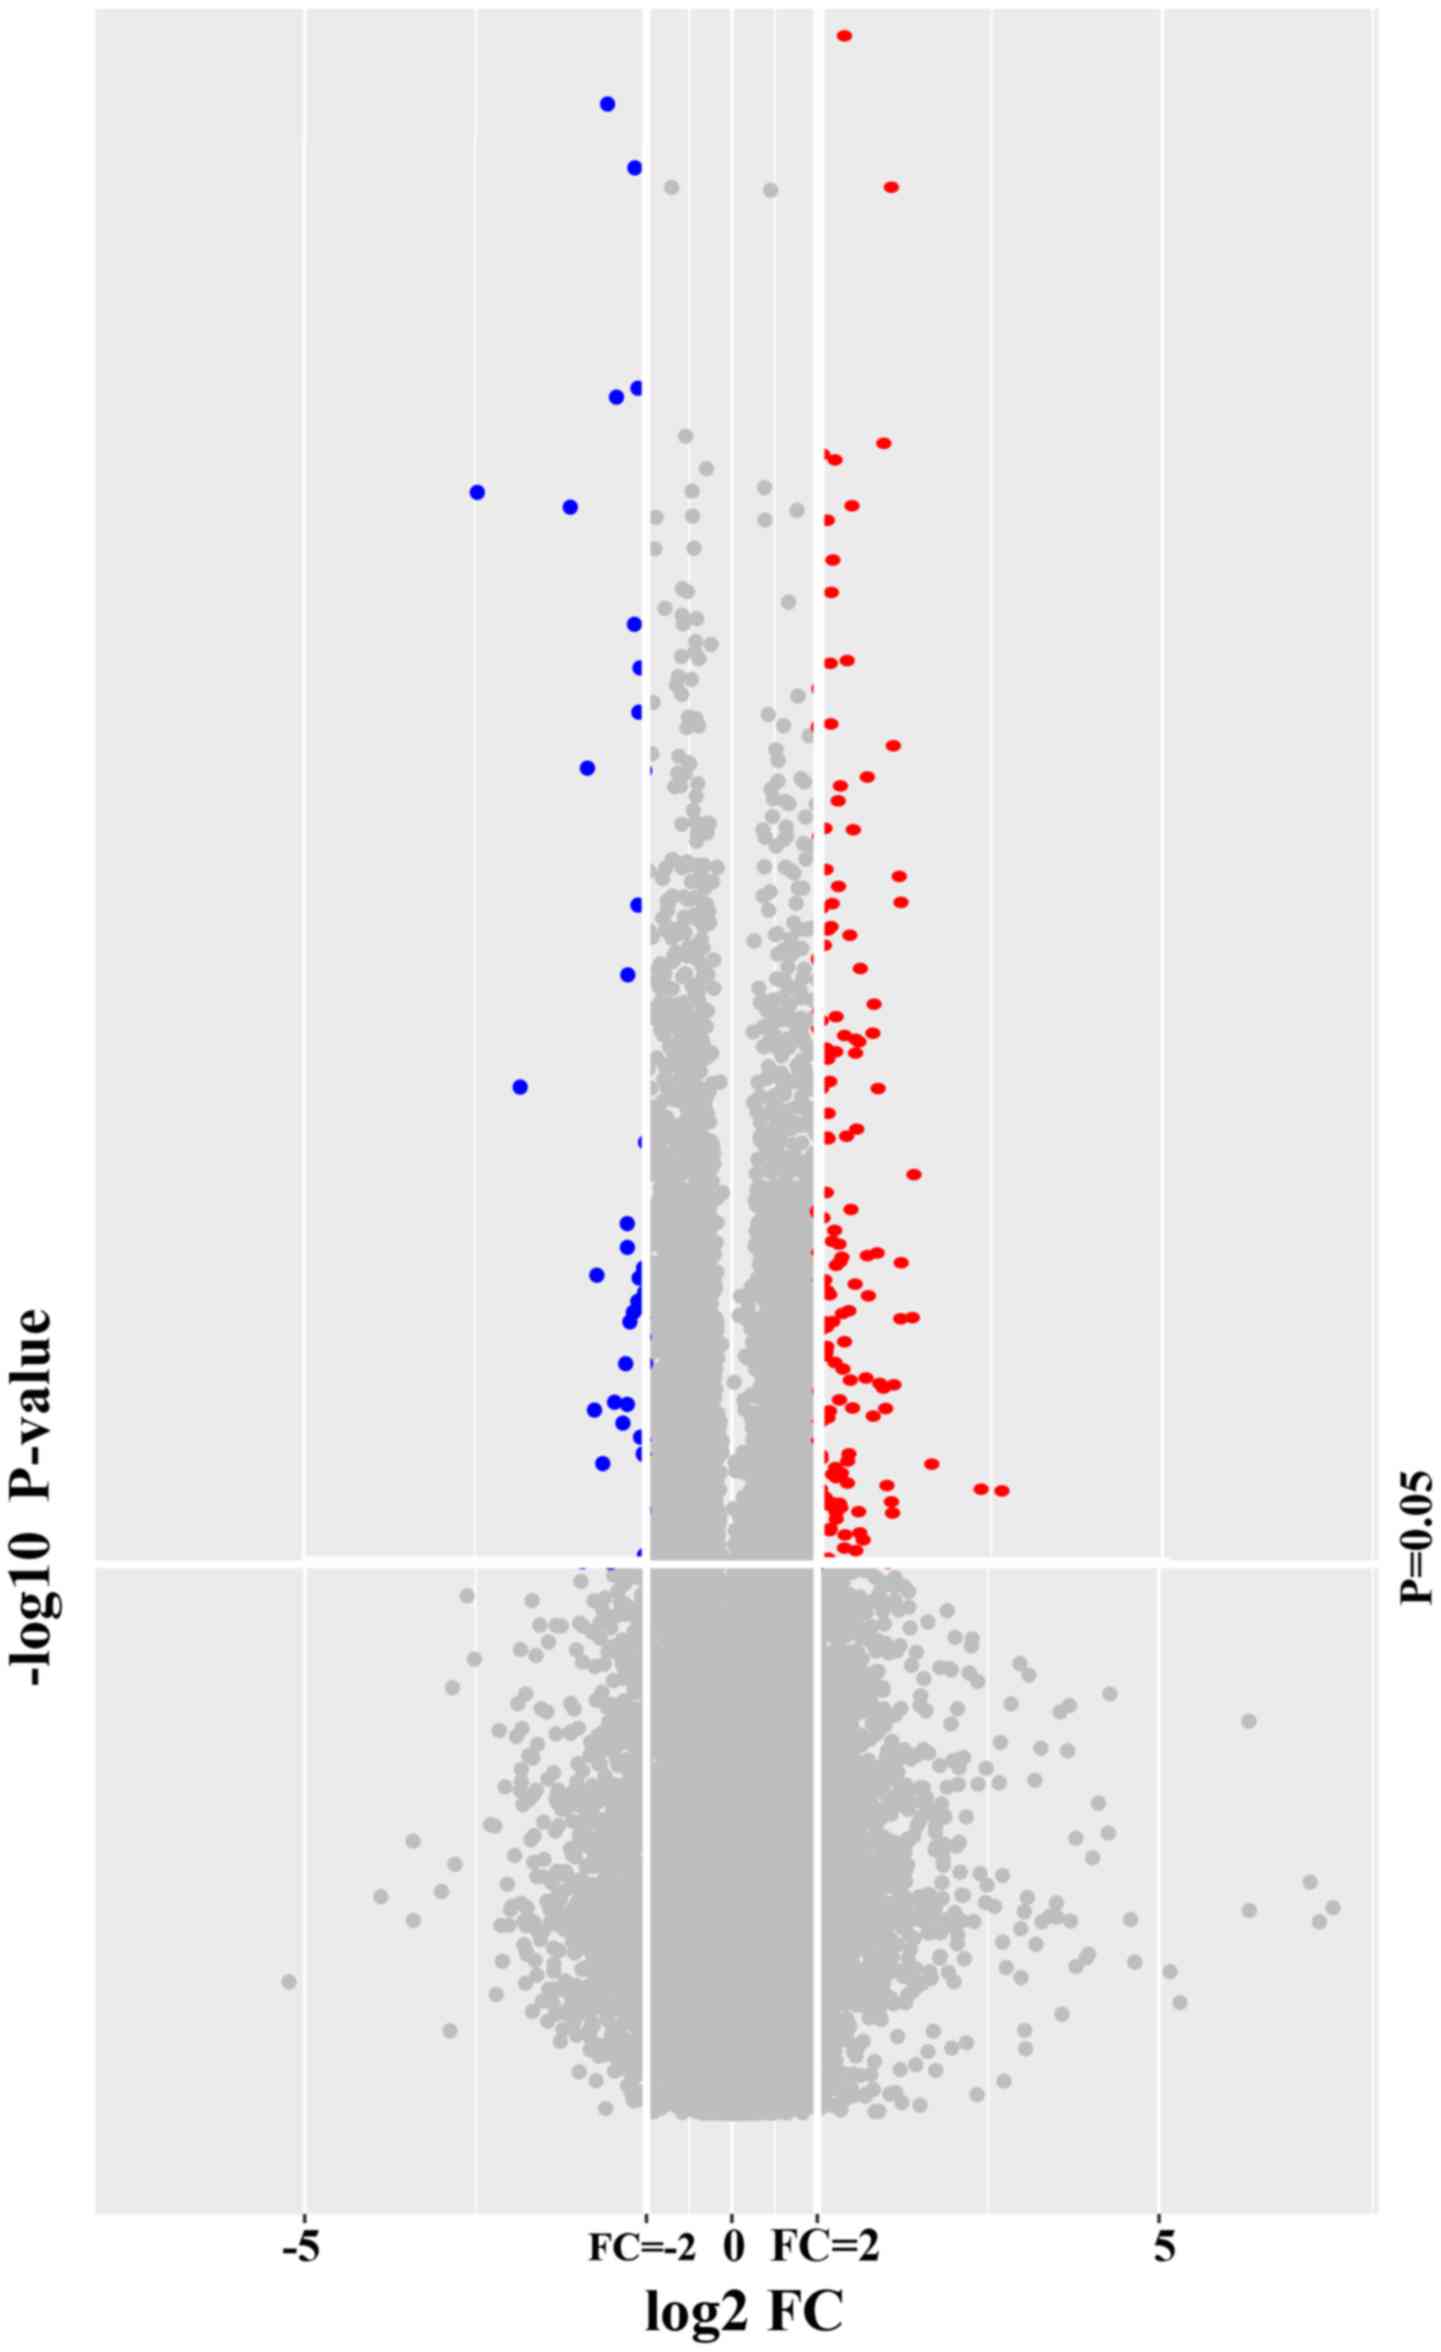
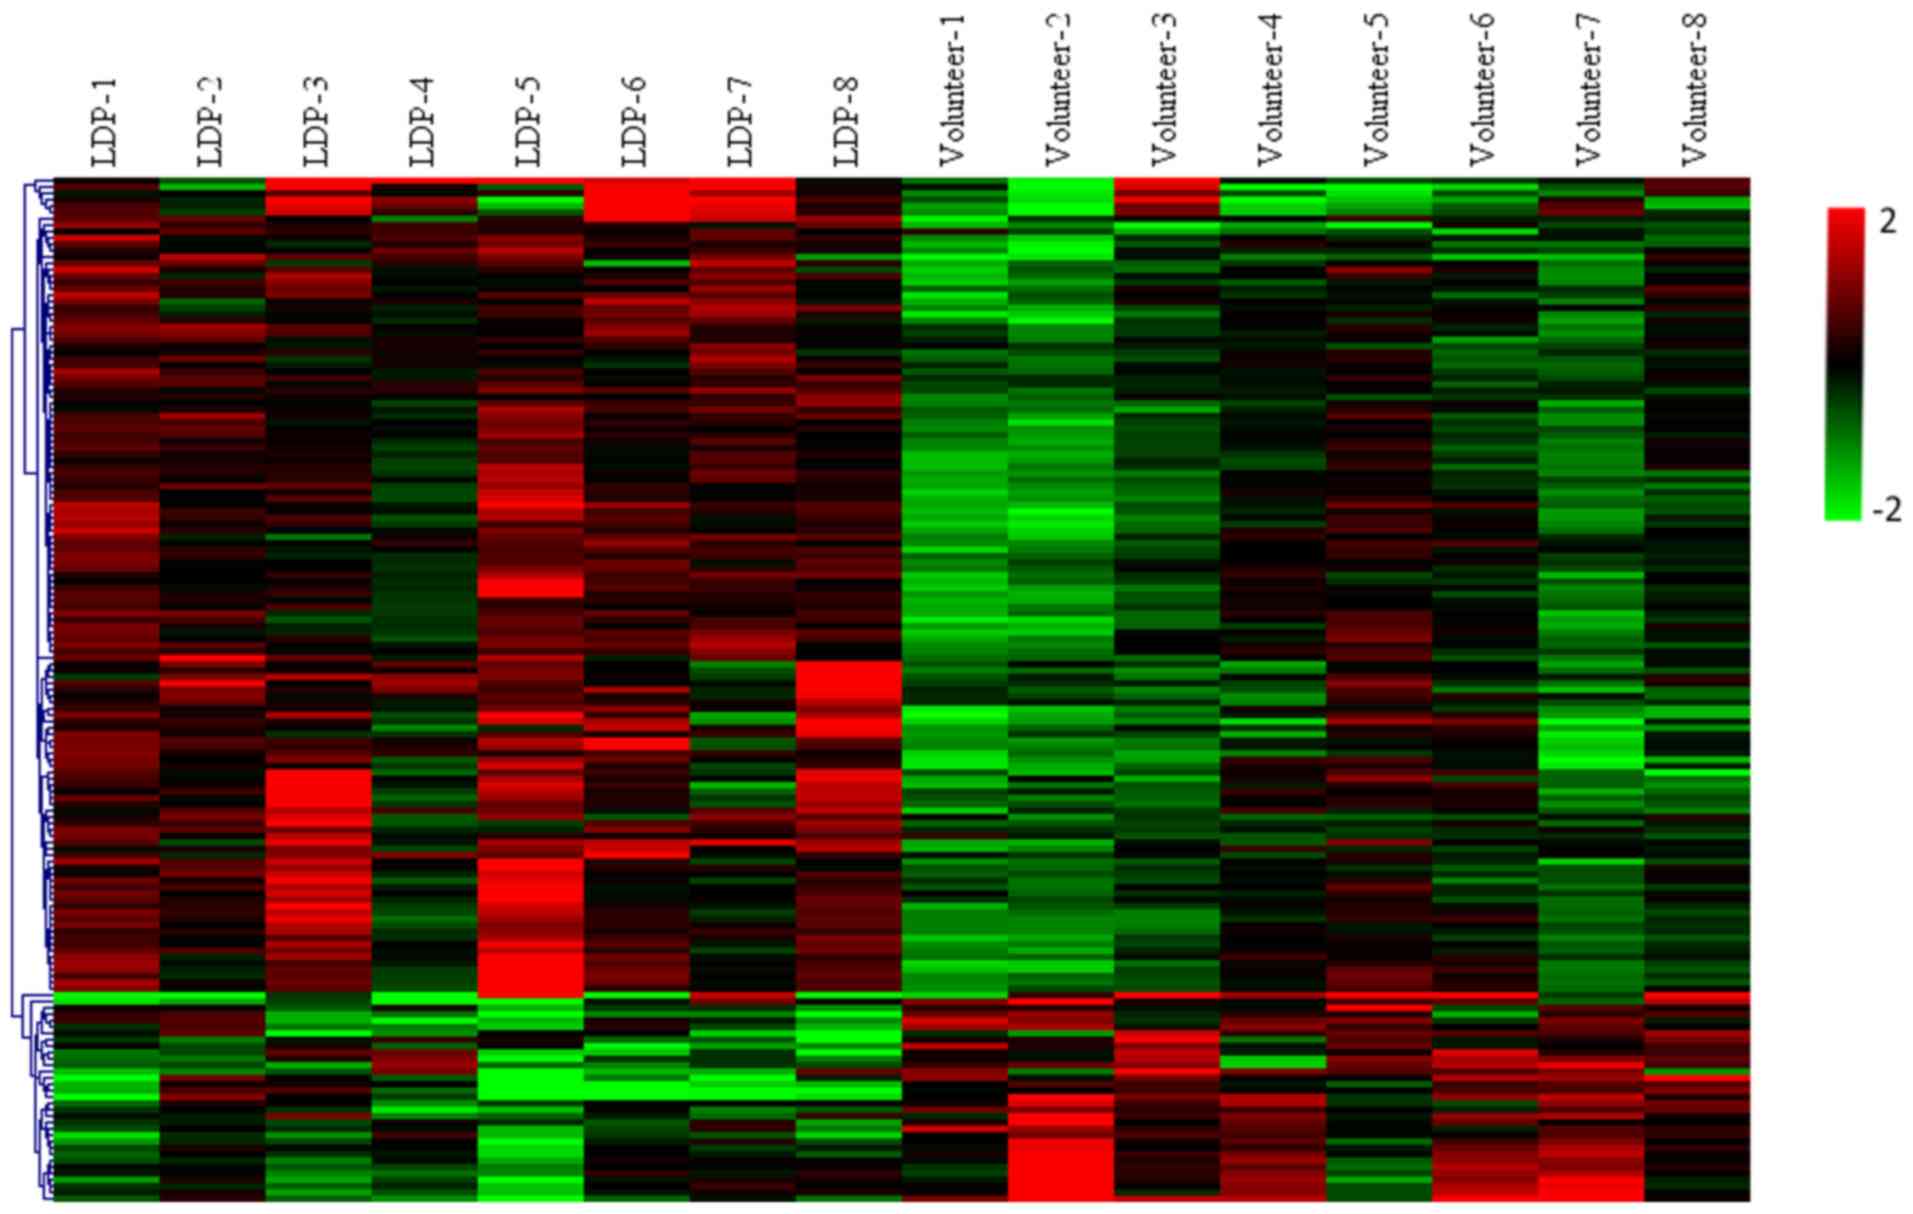
WB-DEGs were upregulated and 33 were downregulated. A volcano plot
(Fig. 1) and an expression heat map
(Fig. 2) were constructed for the
DEGs identified.
Enrichment analysis
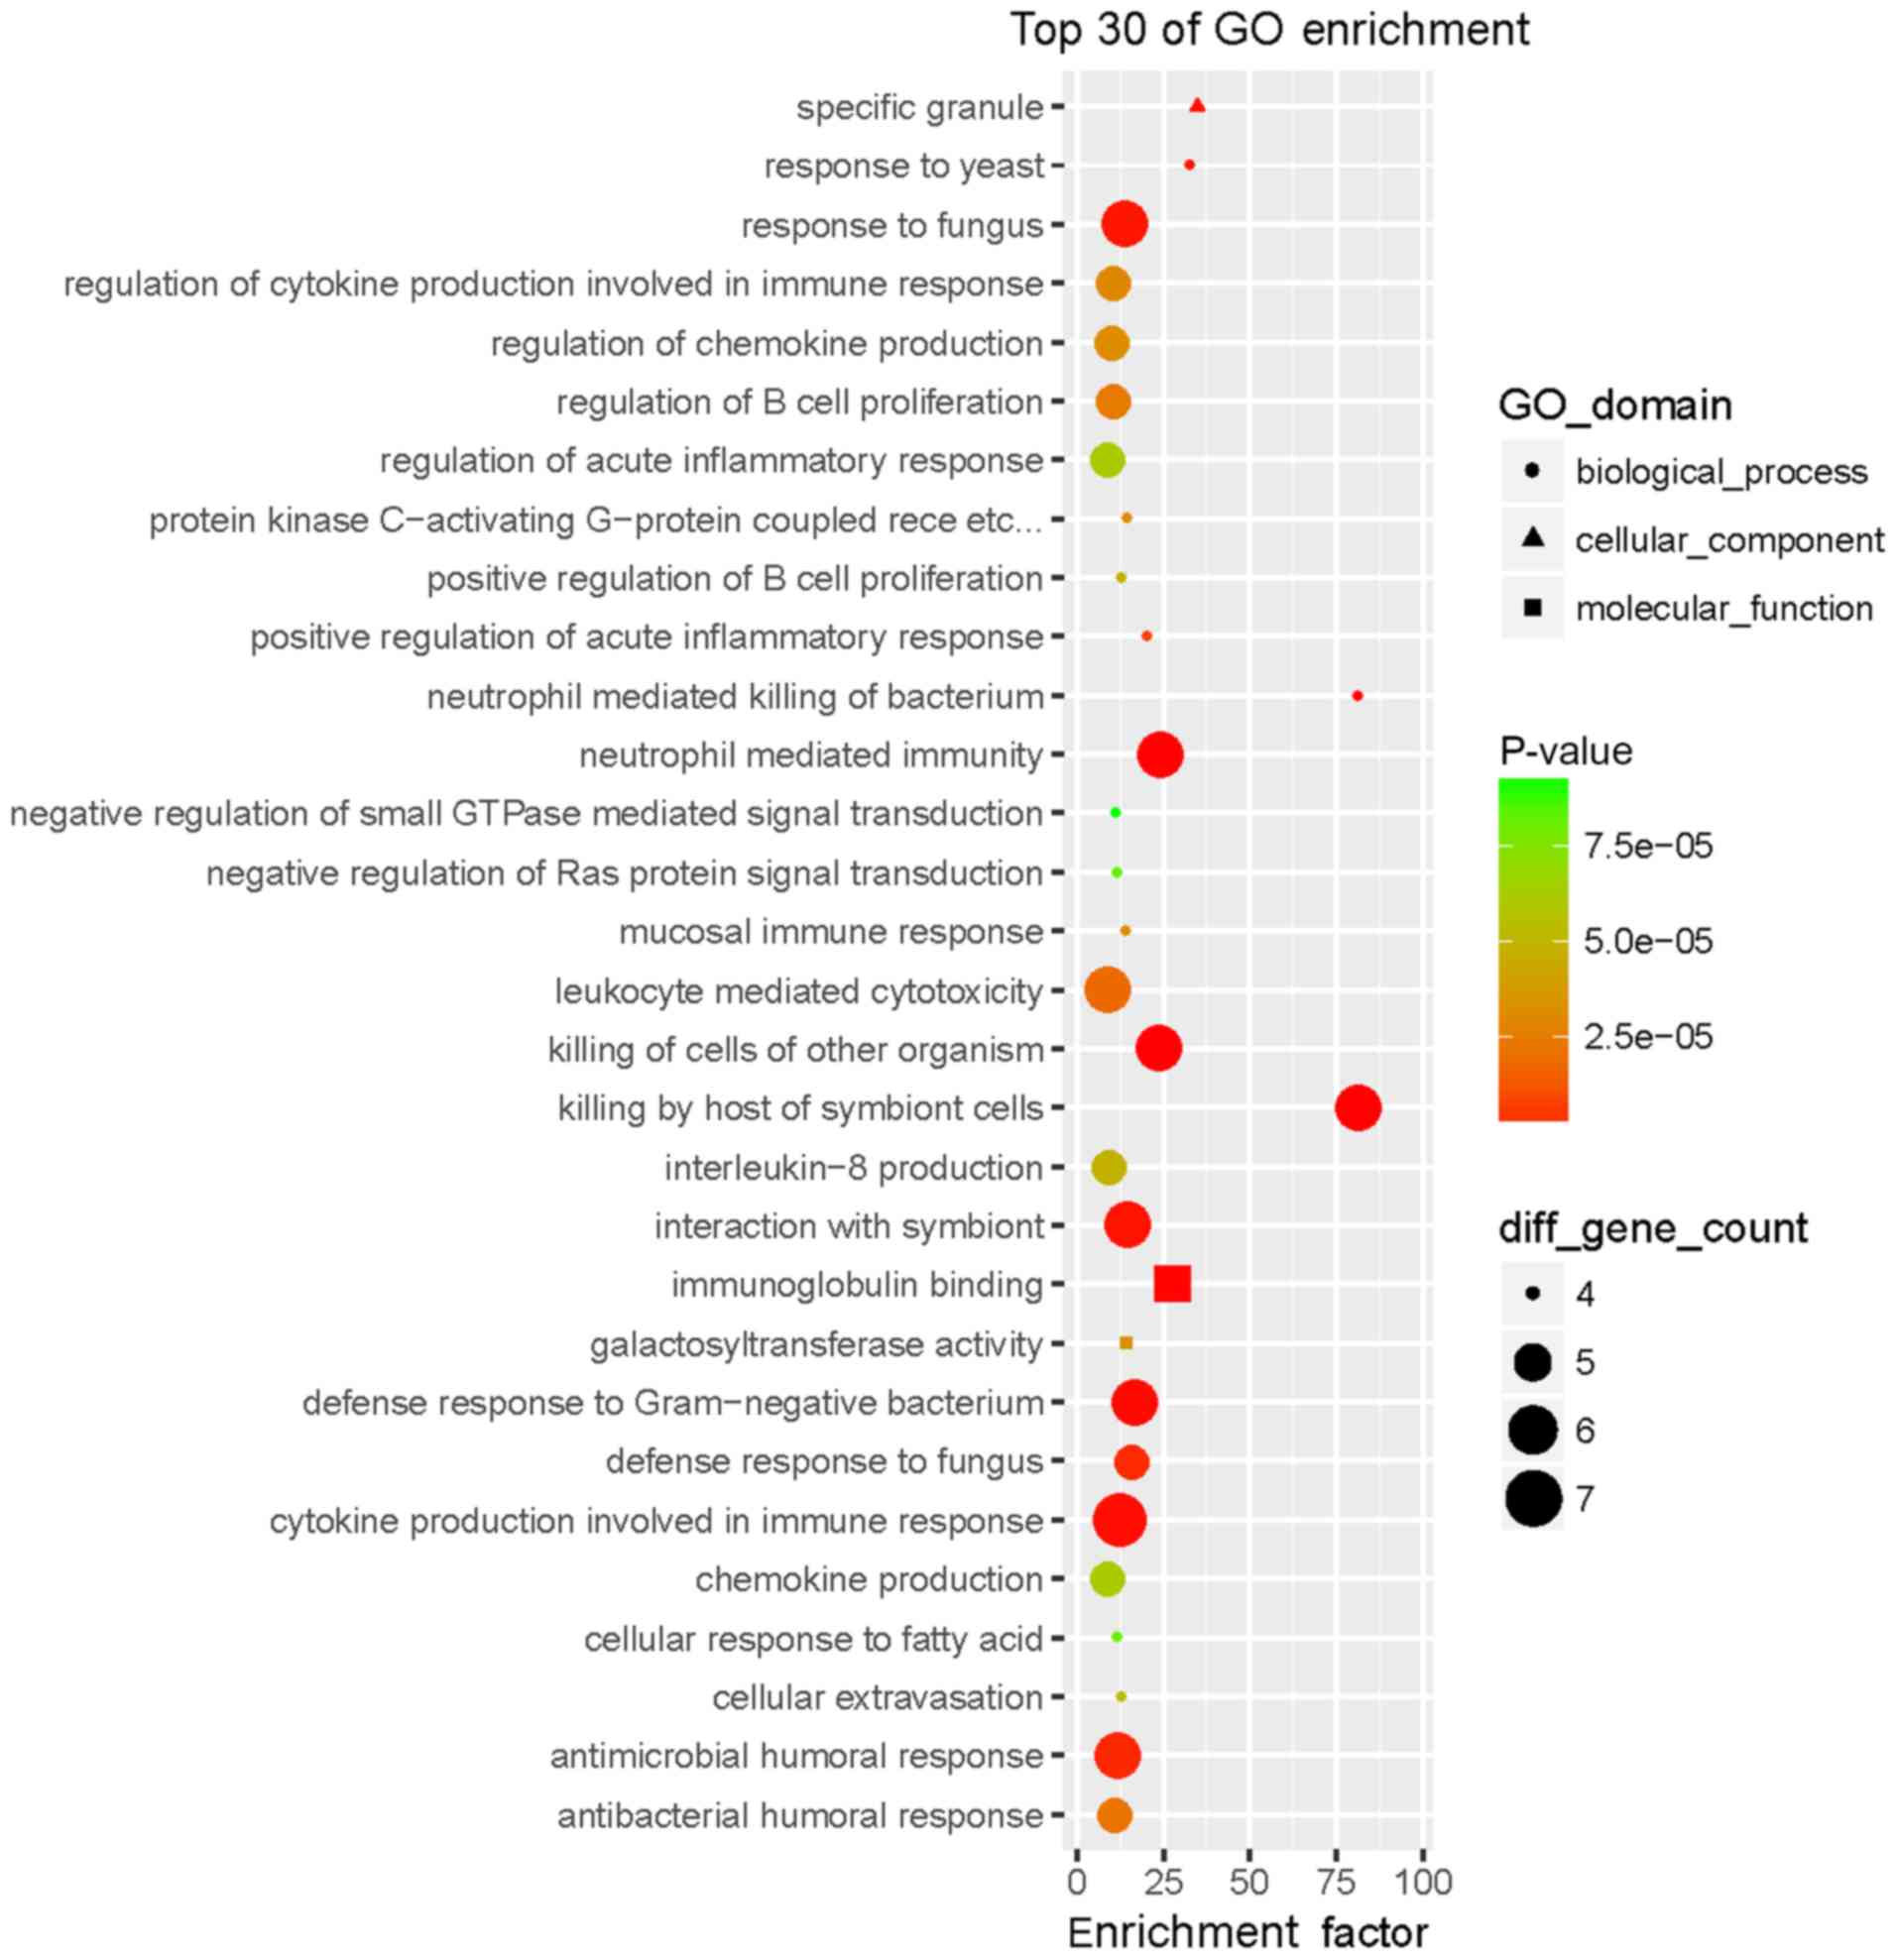
The GO enrichment analysis revealed that the WB-DEGs
were enriched in 293 biological process (BP), 36 cellular component
(CC) and 21 molecular function (MF) terms. Fig. 3 presents the top 30 GO terms of the
161 DEGs ranked according to their enrichment factor and Table I presents data regarding the top 10
GO terms. Of the GO terms in the category BP, ‘neutrophil-mediated
killing of bacterium’ and ‘killing by host of symbiont cells’ had
the highest enrichment factors, ‘specific granule’ had the highest
enrichment factor in the category CC and ‘immunoglobulin binding’
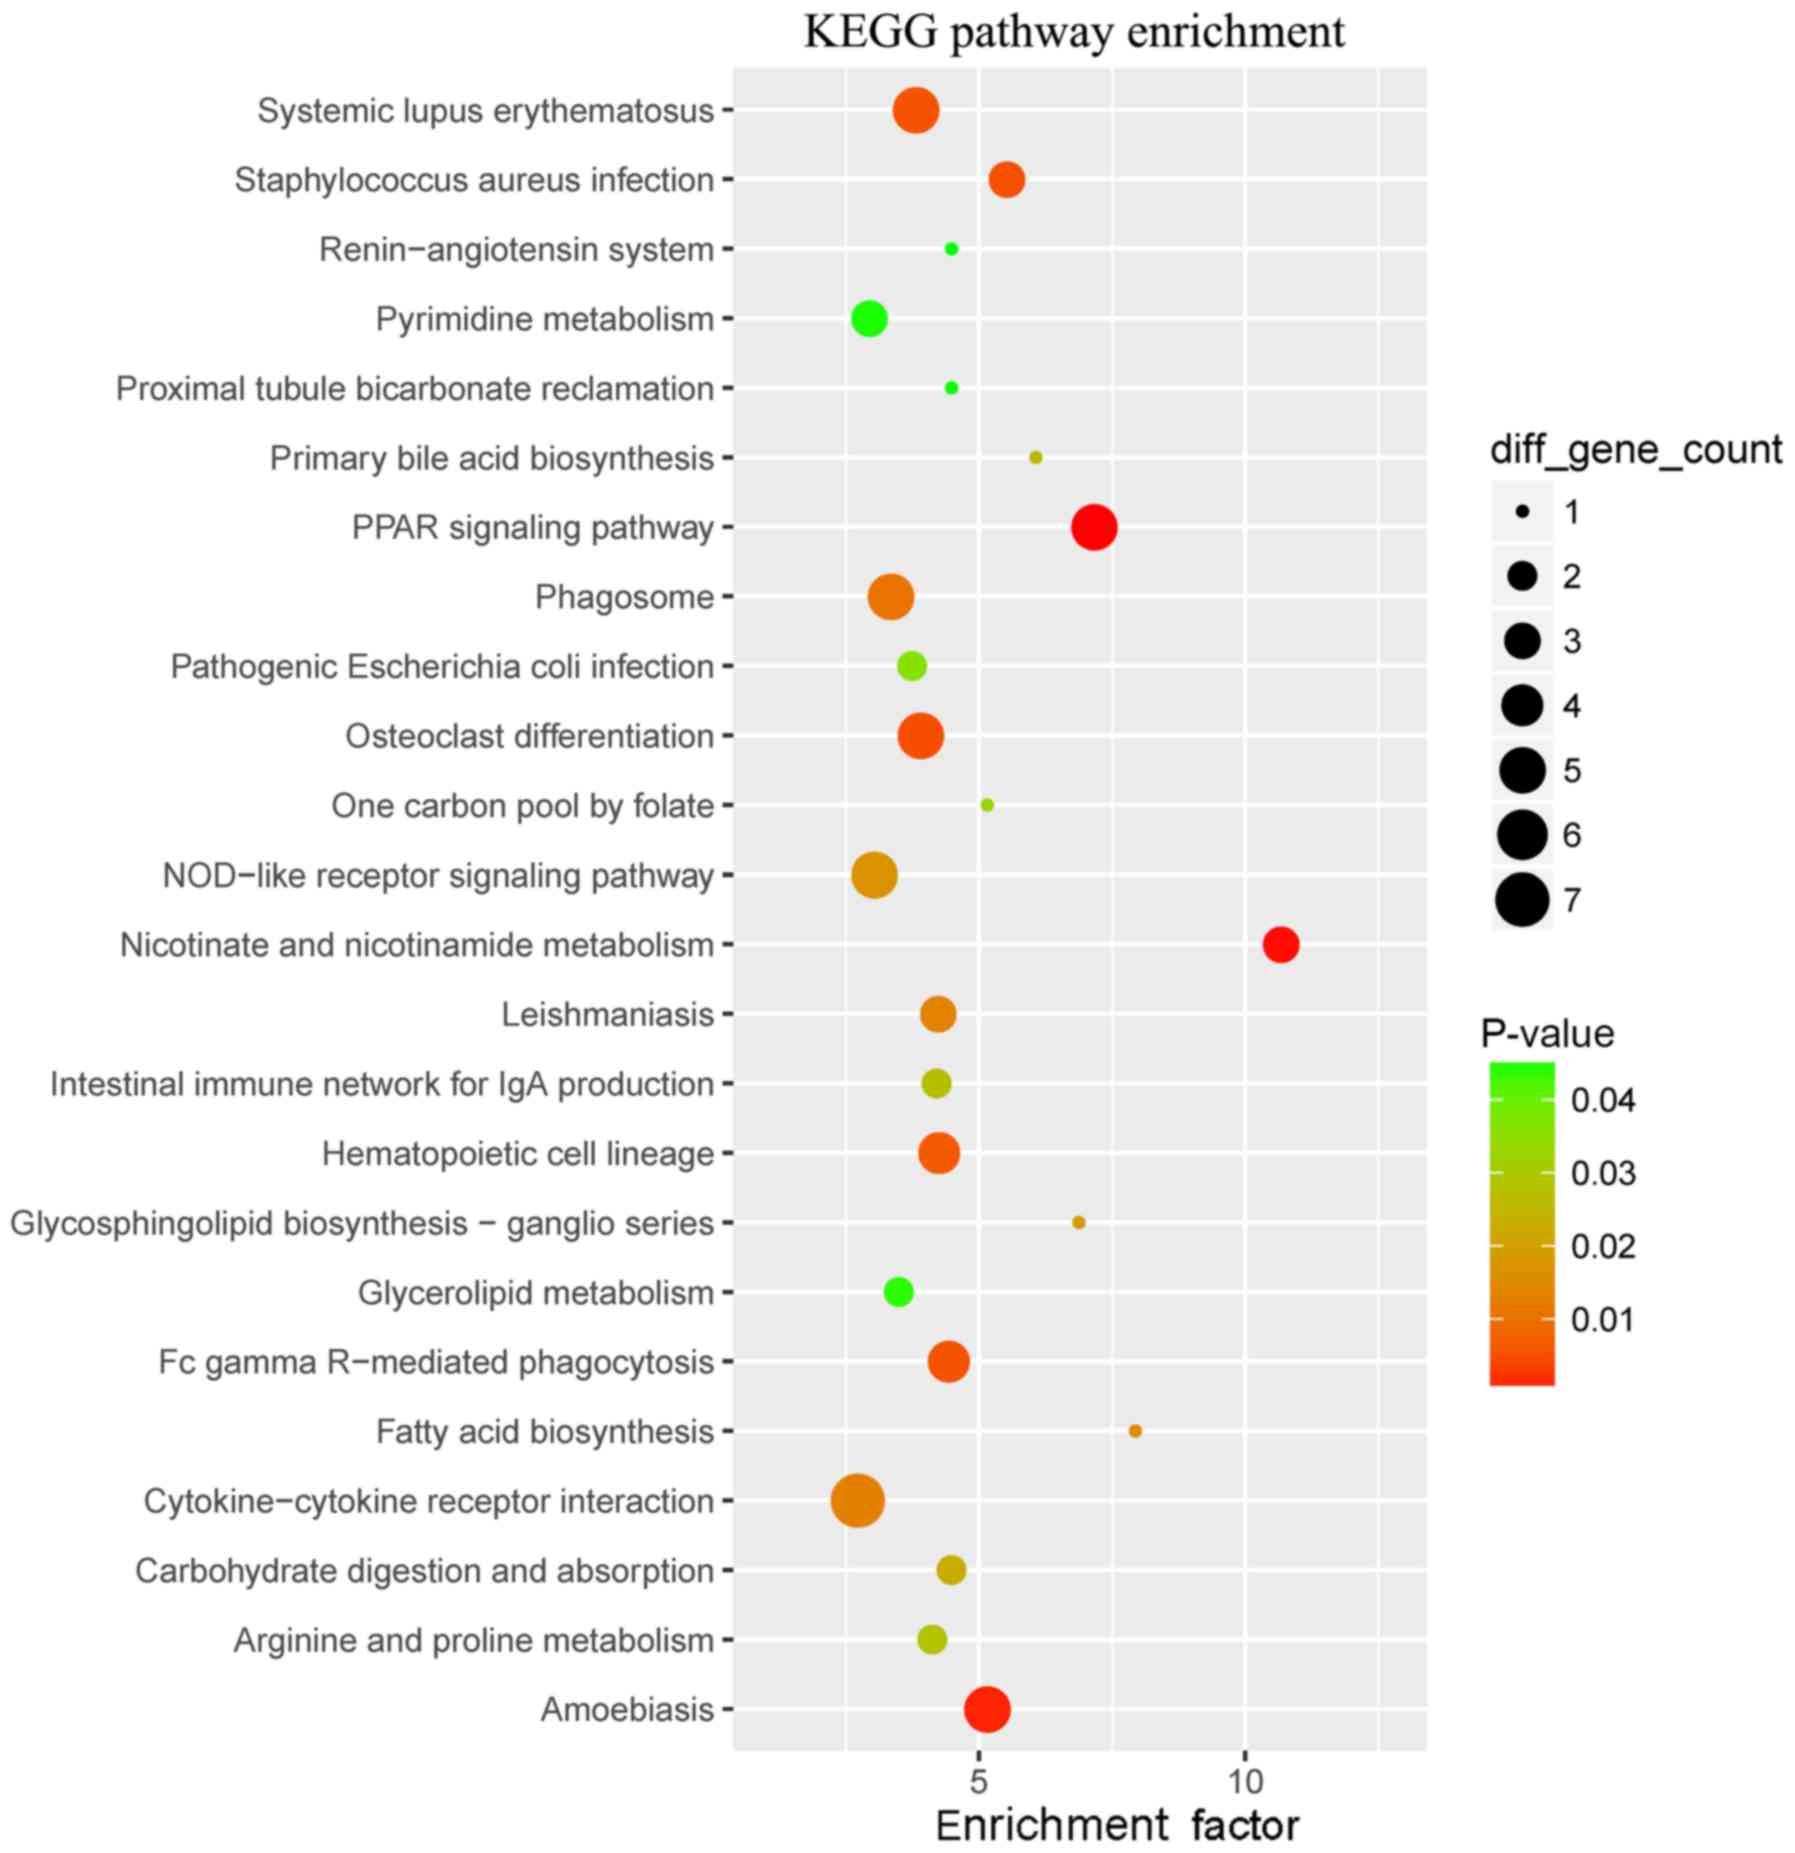
had the highest enrichment factor in the category MF. The WB-DEGs
were enriched in a total of 24 KEGG pathways, as presented in
Fig. 4 and Table II, of which ‘primary bile acid
biosynthesis’ and ‘one-carbon pool by folate’ had the highest
enrichment factors.
 | Table I.Top 10 GO terms ranked according to
enrichment factors. |
Table I.
Top 10 GO terms ranked according to
enrichment factors.
| GO ID | GO term | Description | Gene ratio (%) | P-value | Q-value | Count | Genes | Enrichment
factor |
|---|
| GO:0070944 | BP | Neutrophil-mediated
killing of bacterium | 2.61 | 3.15
×10−8 |
1.46×10⁻⁵ | 4 | CTSG, TREM1, AZU1,
NCF1 | 81.34 |
| GO:0051873 | BP | Killing by host of
symbiont cells | 3.92 |
5.03×10⁻¹¹ |
5.43×10⁻⁸ | 6 | CTSG, TREM1, NCF1,
ELANE, CAMP, AZU1 | 81.34 |
| GO:0042581 | CC | Specific
granule | 2.61 |
7.51×10⁻⁷ |
1.28×10⁻⁴ | 4 | ANXA3, OLFM4, CAMP,
ADAM8 | 34.86 |
| GO:0001878 | BP | Response to
yeast | 2.61 |
9.94×10⁻⁷ |
1.53×10⁻⁴ | 4 | NCF1, CAMP, ELANE,
ADM | 32.54 |
| GO:0019865 | MF | Immunoglobulin
binding | 3.27 |
1.87×10⁻⁷ |
4.65×10⁻⁵ | 5 | FCGR2B, IGJ, FCAR,
FCGR1A, FCGR1B | 27.73 |
| GO:0002446 | BP | Neutrophil-mediated
immunity | 3.92 |
3.90×10⁻⁸ |
1.58×10⁻⁵ | 6 | CTSG, ANXA3, ELANE,
AZU1, TREM1, NCF1 | 24.4 |
| GO:0031640 | BP | Killing of cells of
other organism | 3.92 |
4.75×10⁻⁸ |
1.54×10⁻⁵ | 6 | CTSG,
CAMP, ELANE, AZU1, TREM1, NCF1 | 23.62 |
| GO:0002675 | BP | Positive regulation
of acute inflammatory response | 2.61 |
7.17×10⁻⁶ |
7.03×10⁻⁴ | 4 | FFAR2, FFAR3,
ADAM8, OSM | 20.34 |
| GO:0050829 | BP | Defense response to
Gram-negative bacterium | 3.92 |
3.97×10⁻⁷ |
9.18×10⁻⁵ | 6 | AZU1, TREM1, TLR4,
SLC11A1, CAMP, ADM | 16.64 |
| GO:0050832 | BP | Defense response to
fungus | 3.27 |
3.13×10⁻⁶ |
3.49×10⁻⁴ | 5 | NCF1, CTSG, ELANE,
CAMP, ADM | 16.05 |
| Table II.Top 10 KEGG pathways ranked according
to enrichment factors. |
Table II.
Top 10 KEGG pathways ranked according
to enrichment factors.
| Pathway ID | Description | Gene ratio (%) | P-value | Q-value | Count | Genes | Enrichment
factor |
|---|
| hsa04614 | Renin-angiotensin
system | 1.59 | 0.04 | 0.16 | 1 | CTSG | 4.49 |
| hsa04964 | Proximal tubule
bicarbonate reclamation | 1.59 | 0.04 | 0.16 | 1 | SLC4A4 | 4.49 |
| hsa00240 | Pyrimidine
metabolism | 4.76 | 0.04 | 0.17 | 3 | ENTPD1, TYMS,
NT5C2 | 2.95 |
| hsa00561 | Glycerolipid
metabolism | 3.17 | 0.04 | 0.17 | 2 | DGAT2, GK | 3.50 |
| hsa05130 | Pathogenic
Escherichia coli infection | 3.17 | 0.04 | 0.15 | 2 | TLR5, TLR4 | 3.75 |
| hsa00670 | One carbon pool by
folate | 1.59 | 0.03 | 0.15 | 1 | TYMS | 5.16 |
| hsa00330 | Arginine and
proline metabolism | 3.17 | 0.03 | 0.13 | 2 | ARG1, SAT1 | 4.13 |
| hsa04672 | Intestinal immune
network for IgA production | 3.17 | 0.03 | 0.13 | 2 | TNFSF13B, CCR9 | 4.21 |
| hsa00120 | Primary bile acid
biosynthesis | 1.59 | 0.03 | 0.13 | 1 | CYP27A1 | 6.07 |
| hsa04973 | Carbohydrate
digestion and absorption | 3.17 | 0.02 | 0.13 | 2 | MGAM, SLC2A5 | 4.49 |
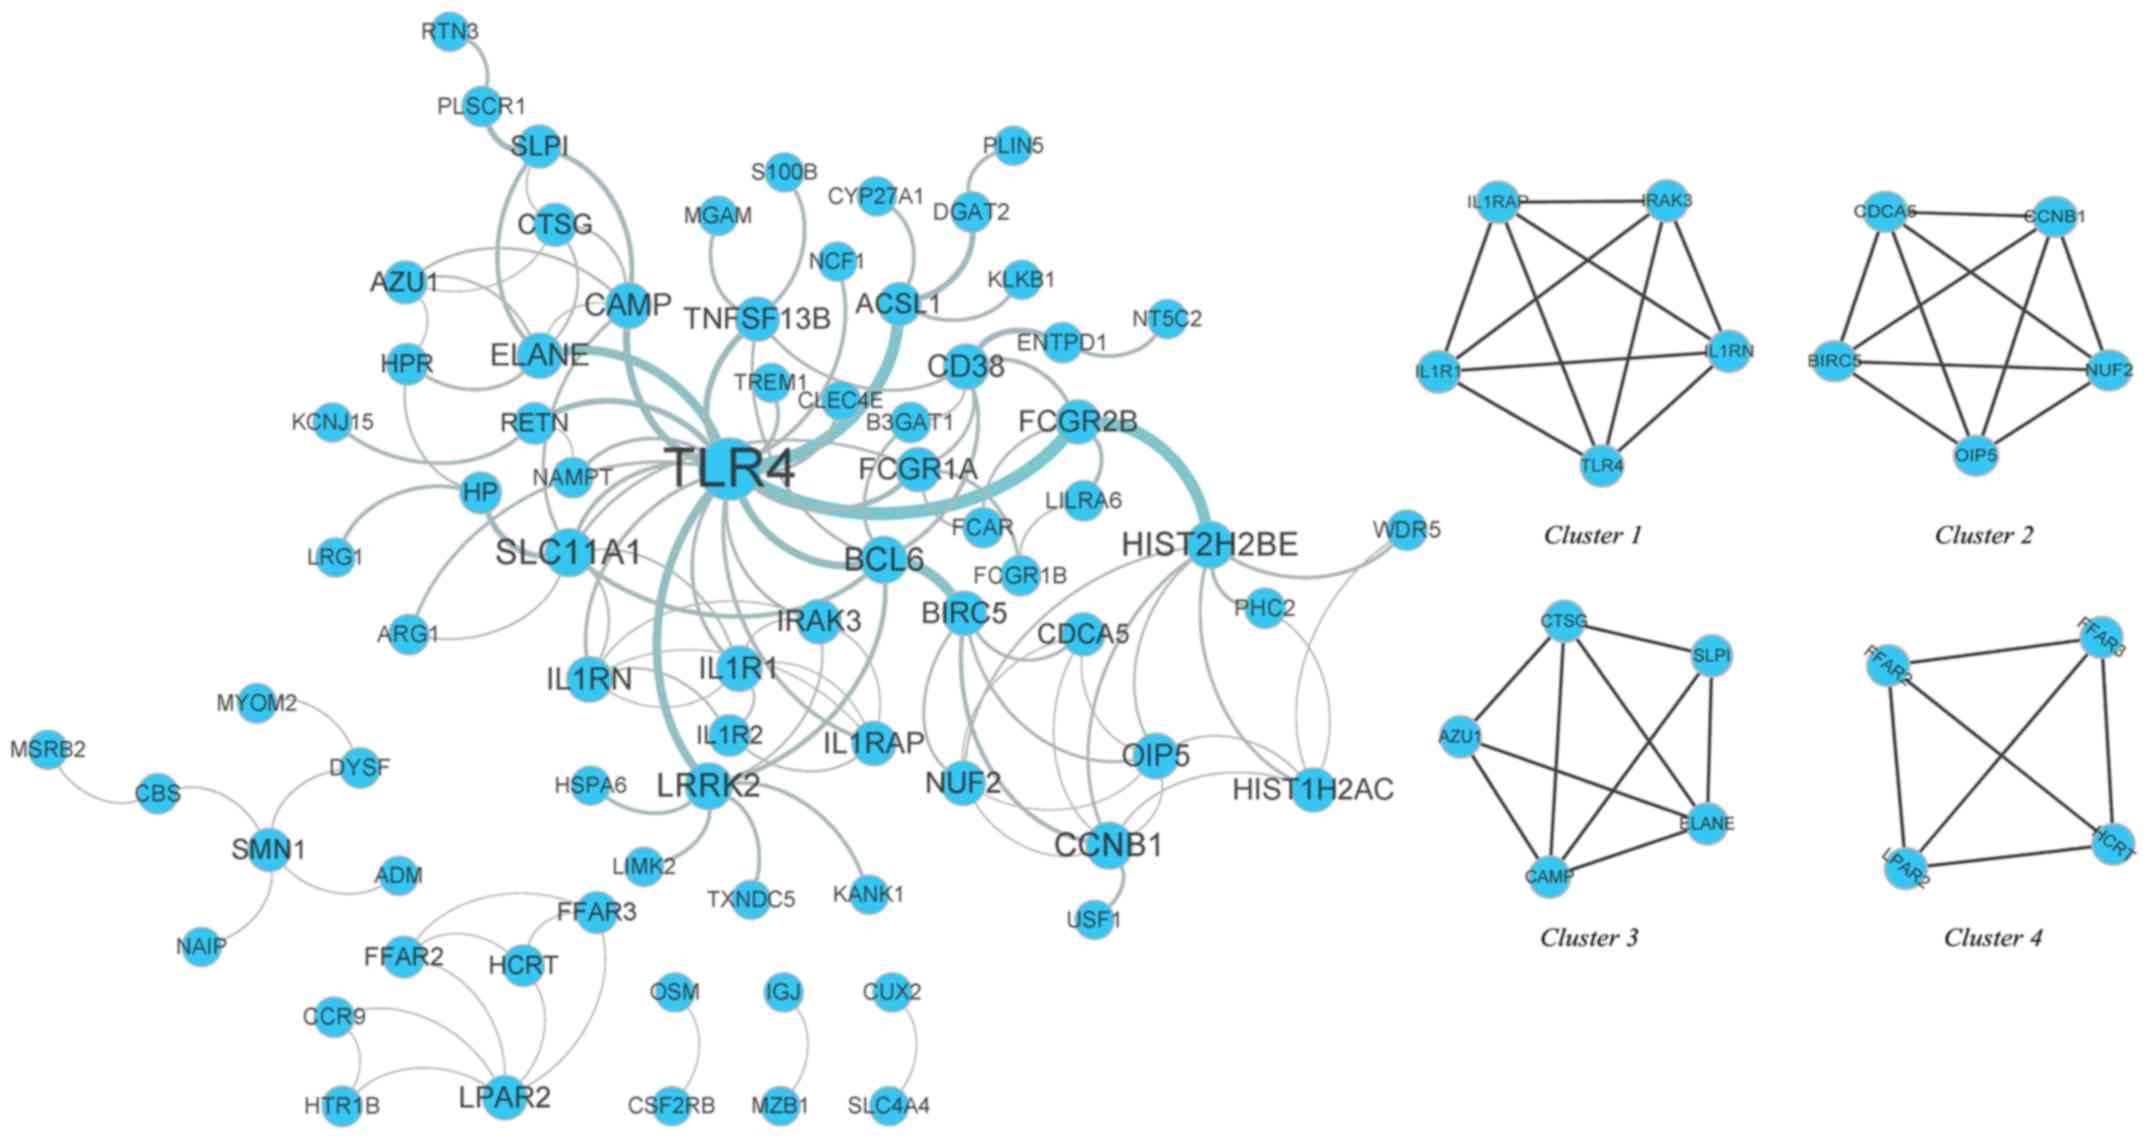
PPI network and submodules
The DEGs were mapped using the STRING database, and
a PPI network was then constructed using Cytoscape software. The
PPI network included 146 connected nodes and 119 edges. The MCODE
analysis revealed that 19 WB-DEGs were clustered in 4 submodules in
the PPI network (Fig. 5). To
identify the hub nodes, the degree centrality of each node was
calculated with the plug-in CentiScaPe, indicating that Toll-like
receptor 4 (TLR4) had the highest degree centrality (Table III).
| Table III.Degree centrality of the 19 DEGs
calculated by CentiScaPe. |
Table III.
Degree centrality of the 19 DEGs
calculated by CentiScaPe.
| Node/gene | Degree
centrality | MCODE cluster | MCODE score |
|---|
| TLR4 | 19 | 1 | 4.0 |
| IL1R1 | 6 | 1 | 4.0 |
| IL1RN | 6 | 1 | 4.0 |
| IRAK3 | 5 | 1 | 4.0 |
| IL1RAP | 5 | 1 | 4.0 |
| CCNB1 | 7 | 2 | 4.0 |
| OIP5 | 6 | 2 | 4.0 |
| NUF2 | 5 | 2 | 4.0 |
| BIRC5 | 5 | 2 | 4.0 |
| CDCA5 | 4 | 2 | 4.0 |
| CAMP | 6 | 3 | 2.7 |
| ELANE | 6 | 3 | 2.7 |
| AZU1 | 4 | 3 | 3.0 |
| CTSG | 4 | 3 | 2.7 |
| SLPI | 4 | 3 | 3.0 |
| LPAR2 | 5 | 4 | 3.0 |
| HCRT | 3 | 4 | 3.0 |
| FFAR2 | 3 | 4 | 3.0 |
| FFAR3 | 3 | 4 | 3.0 |
Common DEGs
WB-DEGs, AF-DEGs and NP-DEGs with a threshold
P-value of 0.05 and FC of 1.5 were identified, and statistical data
regarding these DEGs are presented in Table IV. Hierarchical heat maps of
WB-DEGs, AF-DEGs and NP-DEGs are provided in Fig. 6A-C, respectively. As illustrated in a
Venn diagram (Fig. 6D), 22 DEGs that
overlapped among the three groups and were identified as common
DEGs. Data regarding the dysregulation of these 22 common DEGs are
provided in Table V.
 | Figure 6.Heatmap and Venn diagram of AF-DEGs,
NP-DEGs and WB-DEGs. Heatmaps of (A) AF-DEGs - the gene sample
(GSM) number for each column is 1725780, 1725782, 1725784, 1725786,
1725788, 1725790, 1725792, 1725794, 1725796, 1725798, 1725802,
1725804, 1725806, 1725808, 1725817, 1725819, 1725821, 1725825,
1725800, 1725810, 1725813, 1725814, 1725823, 1725827 from left to
right; (B) NP-DEGs - the GSM number for each column is 1725781,
1725783, 1725785, 1725787, 1725789, 1725791, 1725793, 1725795,
1725797, 1725799, 1725803, 1725805, 1725807, 1725809, 1725816,
1725818, 1725820, 1725824, 1725801, 1725811, 1725812, 1725815,
1725822, 17258276 from left to right; (C) WB-DEGs - the GSM number
for each column is 3526782, 3526783, 3526784, 3526785, 3526786,
3526787, 3526788, 3526789, 3526790, 3526791, 3526792, 3526793,
3526794, 3526795, 3526796, 3526797 from left to right. (D) Venn
diagram illustrating the numbers of exclusive and 22 DEGs
overlapping among the WB-DEGs, AF-DEGs and NP-DEGs. DEGs,
differentially expressed genes; WB-DEGs, DEGs in whole blood;
AF-DEGs, DEGs in annulus fibrosis; NP-DEGs, DEGs in nucleus
pulposus. |
| Table IV.Statistical data regarding the DEGs
in WB, AF and NP. |
Table IV.
Statistical data regarding the DEGs
in WB, AF and NP.
| Type of sample | Total DEGs | Proportion of
transcriptome (%) | Upregulated
(n) | Downregulated
(n) |
|---|
| WB | 862 | 1.48 | 484 | 378 |
| AF | 846 | 1.58 | 455 | 391 |
| NP | 902 | 1.65 | 305 | 597 |
| Table V.Dysregulation of 22 common DEGs in
WB, AF and NP. |
Table V.
Dysregulation of 22 common DEGs in
WB, AF and NP.
|
| Fold change |
|---|
|
|
|
|---|
| Gene symbol | WB-DEGs | AF-DEGs | NP-DEGs |
|---|
| ABLIM1 | −1.59 | −1.73 | −2.97 |
| ACKR3 | −1.53 | −2.77 | −2.21 |
| ARG1 | 7.36 | −1.90 | −2.95 |
| AVIL | 2.211 | −2.44 | −2.13 |
| BACH2 | −1.78 | −2.38 | −2.20 |
| C1orf21 | −1.57 | −1.69 | −1.69 |
| ENPP4 | −1.55 | 1.80 | 2.05 |
| FKBP11 | −1.60 | 1.76 | 1.79 |
| FRY | 1.61 | −1.68 | 1.83 |
| HSPA13 | −1.59 | 1.91 | 1.66 |
| KLF3-AS1 | −1.86 | −2.07 | −1.63 |
| MRVI1 | 2.43 | −1.70 | −1.61 |
| PDIA4 | −1.74 | 1.99 | 1.68 |
| SLC19A3 | 1.54 | −1.67 | −1.66 |
| SLC25A37 | 1.59 | −1.50 | 1.53 |
| SOD2 | 1.59 | 2.80 | 1.54 |
| SSH2 | 1.76 | −1.90 | −2.56 |
| THEM4 | −1.53 | −1.63 | −1.66 |
| TNFAIP6 | 2.65 | 2.22 | 3.00 |
| TREM1 | 2.12 | 3.02 | 2.87 |
| ZBTB41 | −1.53 | 1.52 | 1.58 |
| ZNF185 | 1.52 | −1.66 | −2.19 |
Expression of DEGs
RT-qPCR was performed using WB samples to verify the
gene chip hybridization results for selected DEGs. Of the WB-DEGs,
the expression of TLR4, cytochrome P450 family 27 subfamily A
member 1 (CYP27A1), perilipin 5 (PLIN5), acyl-CoA synthetase
long-chain family member 1 (ACSL1), tumor necrosis factor
superfamily member 13b (TNFSF13B) and interleukin 1 receptor
antagonist (IL1RN) was validated. As presented in Fig. 7, the expression levels of TLR4,
CYP27A1, PLIN5, ACSL1 and TNFSF13B were higher in WB obtained from
LDP patients compared with those in WB obtained from healthy
volunteers, while the expression level of IL1RN was lower in WB
obtained from LDP patients compared with that in WB obtained from
healthy volunteers. Furthermore, the results suggested that the
gene expression levels of CYP27A1 were significantly different
between the patient group and the control group (P<0.05).
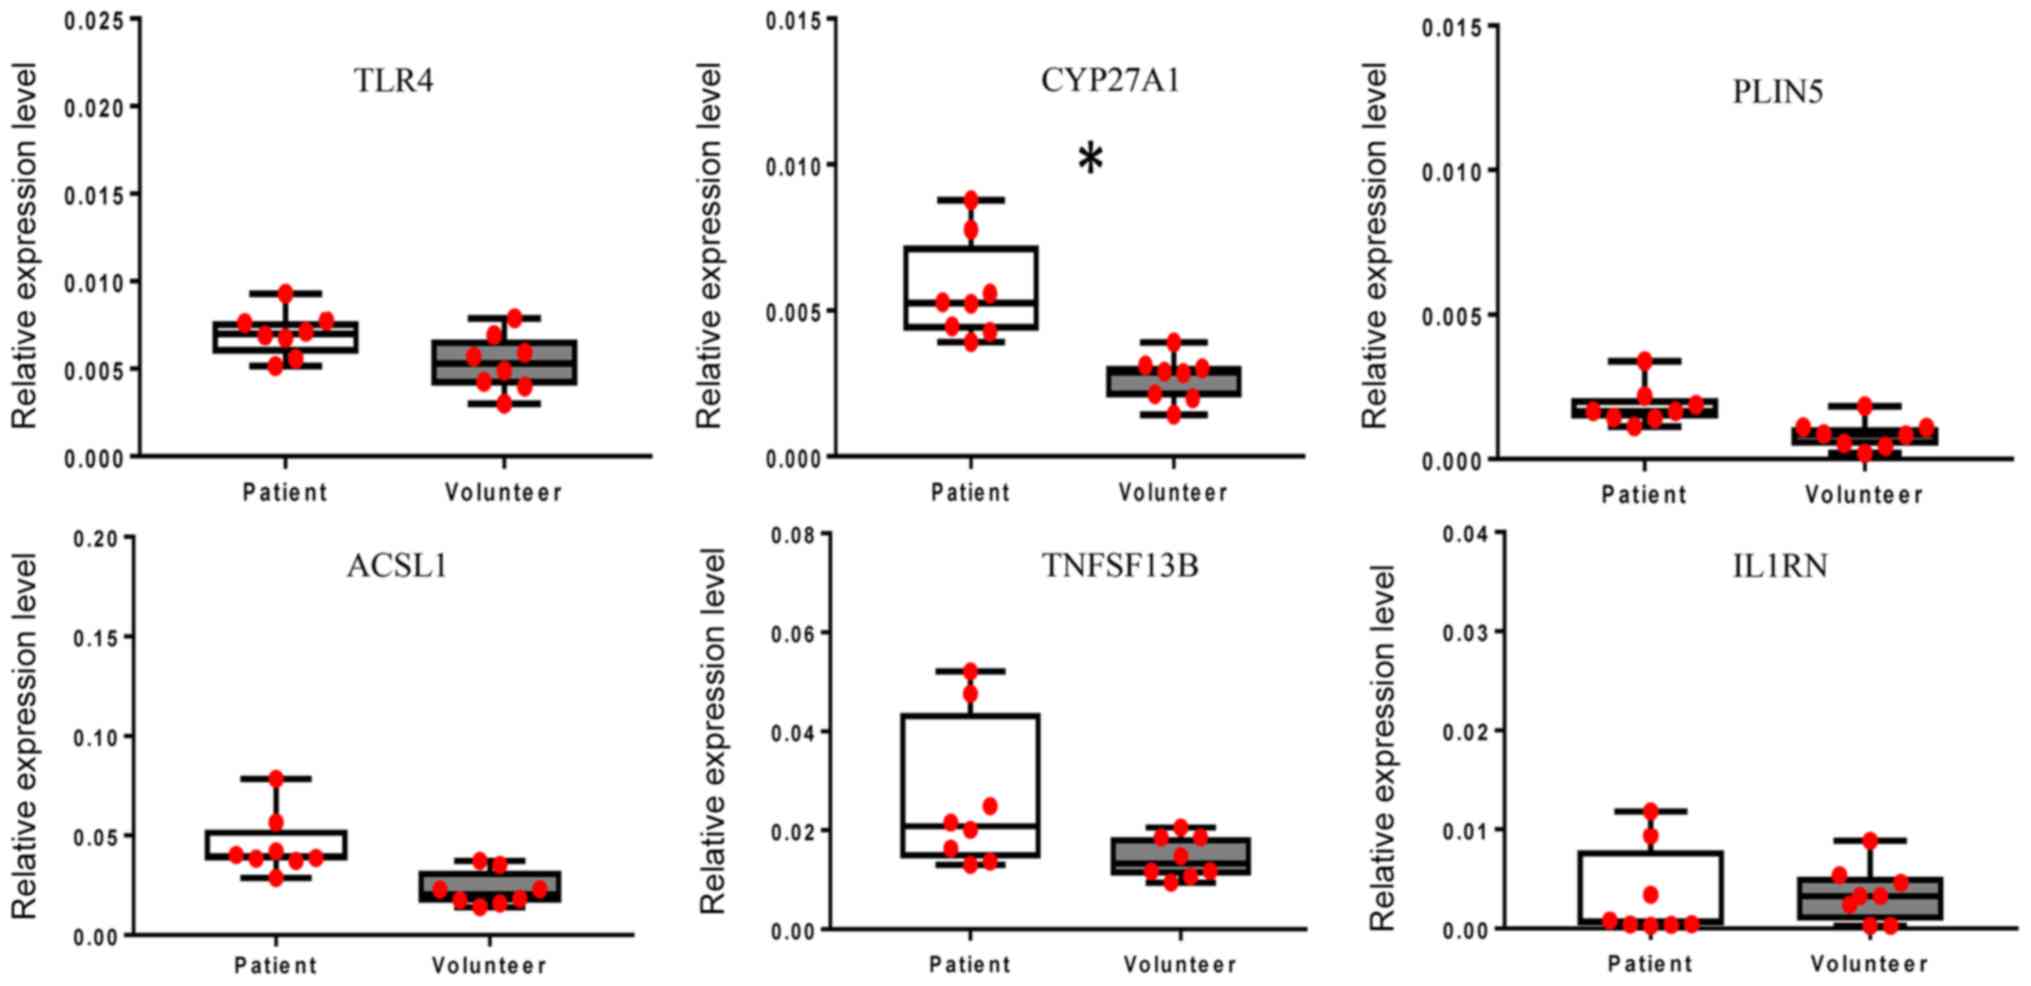 | Figure 7.Confirmation of the aberrant
expression of the differentially expressed genes in whole blood
TLR4, CYP27A1, PLIN5, ACSL1, TNFSF13B and IL1RN. All reverse
transcription-quantitative PCR experiments were performed as three
independent replicates and the average Cq value was used to
calculate the ΔCq and ΔΔCq value regarding the internal reference.
The relative expression levels are provided as 2−ΔΔCq
(n=8). The gene expression levels of CYP27A1 were significantly
different between the patient group and the control group.
*P<0.05. TLR4, Toll-like receptor 4; CYP27A1, cytochrome P450
family 27 subfamily A member 1; PLIN5, perilipin 5; ACSL1, acyl-CoA
synthetase long-chain family member 1; TNFSF13B, tumor necrosis
factor superfamily member 13b; IL1RN, interleukin 1 receptor
antagonist; Cq, quantification cycle. |
Of the common DEGs, the expression of protein
disulfide isomerase family A member 4 (PDIA4), FKBP prolyl
isomerase 11 (FKBP11), ectonucleotide
pyrophosphatase/phosphodiesterase 4 (ENPP4), superoxide dismutase 2
(SOD2) and actin-binding LIM protein 1 (ABLIM1) were validated. As
presented in Fig. 8, the expression
of PDIA4, FKBP11, ENPP4 and ABLIM1 was downregulated in WB from IDD
patients compared with that in healthy volunteers, whereas the
expression of SOD2 in WB from IDD patients was significantly higher
than that in healthy volunteers. Furthermore, the results suggested
that the gene expression levels of PDIA4, FKBP11, ENPP4 and SOD2
were significantly different between the patient group and
volunteer group (P<0.05). The results obtained by RT-qPCR
analysis of WB were consistent with those of the gene chip
hybridization, suggesting that the microarray data correlated well
with the RT-qPCR data, demonstrating the reliability of the
microarray results.
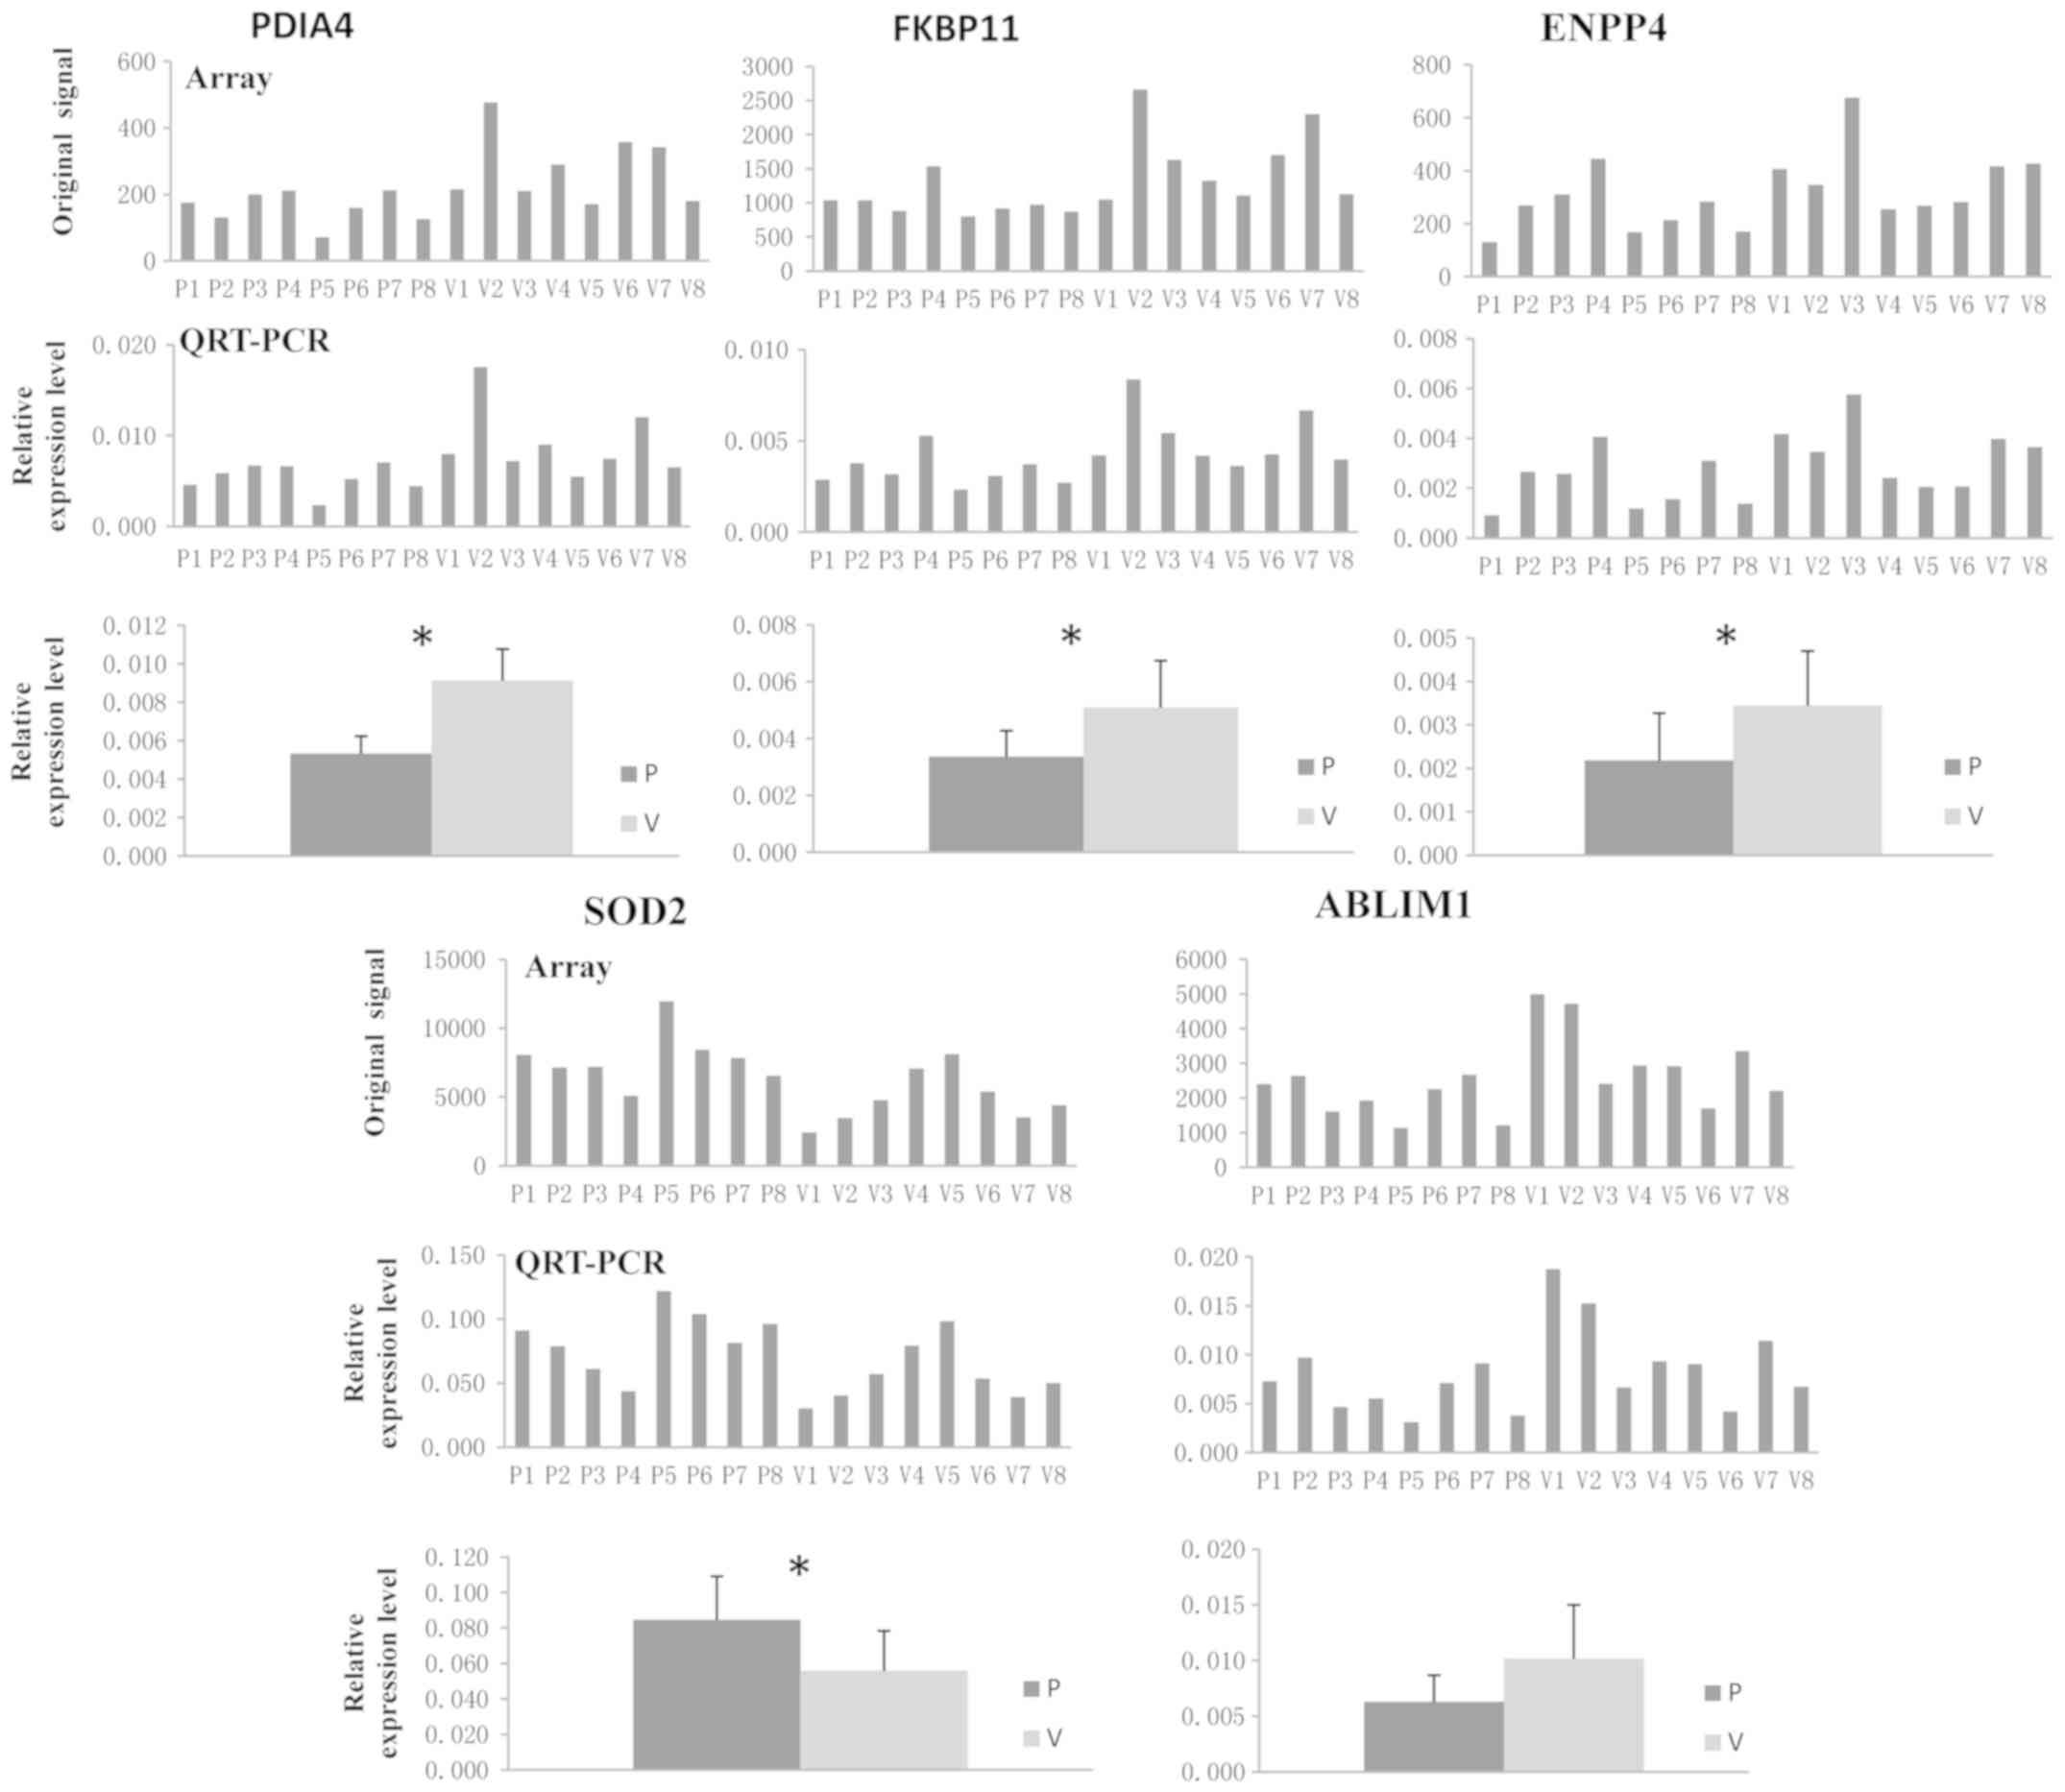 | Figure 8.Experimental confirmation of DEGs
common to WB-DEGs, AF-DEGs and NP-DEGs, PDIA4, FKBP11, ENPP4, SOD2
and ABLIM1 in whole blood. All RT-qPCR experiments were performed
as three independent replicates and the average Cq value was used
to calculate the ΔCq and ΔΔCq value regarding the internal
reference. The relative expression levels are provided as
2−ΔΔCq (n=8). The gene expression levels of PDIA4,
FKBP11, ENPP4 and SOD2 were significantly different between the
patient group and the control group. *P<0.05. Cq, quantification
cycle; SOD2, superoxide dismutase 2; PDIA4, protein disulfide
isomerase family A member 4; FKBP11, FKBP prolyl isomerase 11;
ENPP4, ectonucleotide pyrophosphatase/phosphodiesterase 4; ABLIM1,
actin-binding LIM protein 1; RT-qPCR, reverse
transcription-quantitative; P, patient; V, healthy volunteer. |
Discussion
Lower back pain and sciatica caused by LDP are
substantial sources of pain in patients and seriously affect their
quality of life. As the prevalence of IDD increases with age, with
up to 90% of asymptomatic individuals aged >60 years presenting
with IDD (18), lower back pain
observed in IDD has been extensively investigated (19). However, the mechanisms underlying LDP
and IDD are not exactly the same. Previous studies have mostly
focused on AF and NP (8–15), which may only be evaluated during
surgery. However, to the best of our knowledge, they have not
investigated the gene expression in WB obtained from patients with
LDP.
In the present study, a total of 161 DEGs were
identified in WB obtained from patients with LDP vs. healthy
volunteers, including 128 up- and 33 downregulated genes. GO
enrichment indicated that ‘neutrophil-mediated killing of
bacterium’ and ‘killing by host of symbiont cells’ had the highest
enrichment factor in the category BP, ‘specific granule’ had the
highest enrichment factor in the category CC and ‘immunoglobulin
binding’ had the highest enrichment factor in MF. Pathway
enrichment analysis indicated that ‘primary bile acid biosynthesis’
and ‘one-carbon pool by folate’ had the highest enrichment factors.
To the best of our knowledge, no previous study has demonstrated
the role of these GO terms and pathways in LDP; thus, they may
represent new directions for studying LDP. In the PPI network, 4
submodules were identified and TLR4 with the highest degree
centrality was identified as the hub gene in the PPI network,
indicating that these submodules and TLR4 may have an important
role in LDP. The results of the bioinformatics analysis require
further experimental verification. Furthermore, 22 common DEGs
between WB-DEGs, AF-DEGs and NP-DEGs were identified. The RT-qPCR
results confirmed that the expression levels of CYP27A1, SOD2,
PDIA4, FKBP11 and ENPP4 were significantly different between the
patient group and volunteer group (P<0.05); thus, these genes
may represent potential biomarkers in WB for LDP.
In a genome-wide expression analysis, Schubert et
al (13) identified 5 AF markers
and 6 NP markers. None of these 11 markers was dysregulated in the
WB obtained from the patients of the present study. Guo et
al (9) compared the gene
expression profiles of degenerative and non-degenerative IVDs and
identified 35 DEGs with a FC>2 that overlapped between AF and
NP. None of these 35 common DEGs overlapped with the DEGs
identified in WB in the present study. Using a microarray analysis,
Kazezian et al (10)
identified 17 molecular markers of AF degeneration. However, none
of those molecular markers was among the WB-DEGs determined in the
present study. Zhang et al (15) compared the results of an expression
array analysis of peripheral blood mononuclear cells obtained from
IDD patients and those obtained from non-IDD individuals and
identified 62 DEGs, including 33 upregulated and 24 downregulated
genes. Between their and the present study, only the upregulation
of Annexin A3 was consistent.
TLR4 is a member of the TLR family and was reported
to be expressed in IVD cells in AF and NP (20). TLR4 has been demonstrated to
substantially contribute to neuropathic pain (21), and the activation of TLR4 has been
indicated to result in the initiation of the inflammatory cascade
and the inhibition of extracellular matrix anabolism in IVD
(20). Inflammation has an important
role in IDD (22,23), and IDD has been characterized as a
disease involving extracellular matrix degradation (24). In the present study, TLR4 was
identified as the hub gene in the PPI network, indicating that it
may be crucial to the process of LDP. CYP27A1 has been previously
demonstrated to promote cholesterol efflux (25,26), and
patients with higher serum lipid levels of total cholesterol are at
a higher risk of lumbar disc herniation (27). On the other hand, elevated blood
lipid levels of cholesterol contribute to atherosclerosis, and
aortic atherosclerosis-induced damage to the lumbar nutrition
supply has been associated with IDD (28). IDD is an age-associated process that
is accompanied and accelerated by the accumulation of oxidative
damage and inflammation (29). Blood
vessels grow into the IVD during the process of IDD (30), and the resulting neovascularization
exposes the avascular tissue of the IVD to high oxygen tension and
subsequent oxidative injury (31).
SOD2 has an anti-oxidative role by converting superoxide radicals
into H2O2, which may be broken down into
harmless H2O and O2 by anti-oxidative enzymes
(32) and is critical for the
regulation of oxidative stress resistance (33). Excessive reactive oxygen species may
cause protein, DNA and membrane damage and are associated with
cellular inflammatory responses by inducing the expression of
cytokines and chemokines (34). The
inflammatory response has a critical role in the initiation and
progression of IDD (22,35–38).
Thus, the elimination of superoxide radicals by SOD2 may be
considered an anti-inflammatory process. SOD2 may be protective
against IVD through anti-oxidant and anti-inflammatory mechanisms
in the process of IDD. Data regarding the biological actions of
PDIA4, FKBP11 and ENPP4 in IDD are limited, and their roles in IDD
require further investigation.
In conclusion, in the present study, CYP27A1, SOD2,
PDIA4, FKBP11 and ENPP4 were identified as potential WB biomarkers
of LDP, and TLR4 was identified as a hub gene in the PPI network.
Furthermore, several GO terms, KEGG pathways and submodules of the
PPI network may be involved in LDP through unknown mechanisms. LDP
is based on IDD and the degree of histopathologic degeneration of
LDD increases with age (39). All of
the patients of the present study were confirmed to have LDP by
MRI. To the best of our knowledge, previous studies have not
described the degree of histopathologic degeneration at which IDD
may be observed by MRI. Young individuals are more representative
of subjects without IDD or low IDD; thus, young individuals were
recruited as controls, as previously described (16). In the case of such groupings, WB-DEGs
may be linked to other aging-associated processes and not just IDD.
Thus, the intersection of the WB-DEGs, AF-DEGs and NP-DEGs was
focused on to obtain molecular markers in WB. However, age may be a
confounding factor that affects gene expression. The present
results still require further experimental verification with large
sample sizes and mechanistic study.
Supplementary Material
Supporting Data
Acknowledgements
Not applicable.
Funding
The present study was supported by the Sichuan
Science and Technology Program, China (grant no. 2018SZ0075).
Availability of data and materials
The datasets generated and/or analyzed during the
current study are available in the GEO database (accession no.
GSE124272).
Authors' contributions
YW, GD and LTL designed the current study, and
together with LL, LJ, SWL, SL, FW, WD and YL, performed the data
analysis and wrote the manuscript. GD and YW obtained funding and
together with LTL, LL, LJ and SWL, advised on the study design and
writing. SL, FW, WD and YL contributed to writing and English
proofreading. All authors made substantial contributions to the
conception and design of the current study, and gave final approval
of the version to be published.
Ethics approval and consent to
participate
The design of the present study adhered to the
tenets of the Declaration of Helsinki and the protocol was reviewed
and approved by the institutional review board and ethics committee
of Sichuan Provincial Orthopedic Hospital (approval no.
2018SZ0075). All patients and donors enrolled in the study provided
written informed consent to participate in this study.
Patient consent for publication
Not applicable.
Competing interests
The authors declare that they have no competing
interests.
Glossary
Abbreviations
Abbreviations:
|
LDP
|
lumbar disc prolapse
|
|
DDD
|
disc degeneration disease
|
|
IDD
|
intervertebral disc degeneration
|
|
IVD
|
intervertebral disc
|
|
AF
|
annulus fibrosis
|
|
NP
|
nucleus pulpous
|
|
WB
|
whole blood
|
|
RT-qPCR
|
reverse transcription-quantitative
PCR
|
|
DEGs
|
differentially expressed genes
|
|
FC
|
fold change
|
|
GO
|
Gene Ontology
|
|
KEGG
|
Kyoto Encyclopedia of Genes and
Genomes
|
|
PPI
|
protein-protein interaction
|
|
BP
|
biological process
|
|
CC
|
cellular component
|
|
MF
|
molecular function
|
|
TLR4
|
Toll-like receptor 4
|
|
CYP27A1
|
cytochrome P450 family 27 subfamily A
member 1
|
|
PLIN5
|
perilipin 5
|
|
ACSL1
|
acyl-CoA synthetase long-chain family
member 1
|
|
TNFSF13B
|
tumor necrosis factor superfamily
member 13b
|
|
IL1RN
|
interleukin 1 receptor antagonist
|
References
|
1
|
Ahsan K, Najmus-Sakeb, Hossain A, Khan SI
and Awwal MA: Discectomy for primary and recurrent prolapse of
lumbar intervertebral discs. J Orthop Surg (Hong Kong). 20:7–10.
2012. View Article : Google Scholar : PubMed/NCBI
|
|
2
|
Kepler CK, Ponnappan RK, Tannoury CA,
Risbud MV and Anderson DG: The molecular basis of intervertebral
disc degeneration. Spine J. 13:318–330. 2013. View Article : Google Scholar : PubMed/NCBI
|
|
3
|
Adams MA and Roughley PJ: What is
intervertebral disc degeneration, and what causes it? Spine.
31:2151–2161. 2006. View Article : Google Scholar : PubMed/NCBI
|
|
4
|
Daly C, Ghosh P, Jenkin G, Oehme D and
Goldschlager T: A review of animal models of intervertebral disc
degeneration: Pathophysiology, regeneration, and translation to the
clinic. BioMed Res Int. 2016:59521652016. View Article : Google Scholar : PubMed/NCBI
|
|
5
|
Beattie PF: Current understanding of
lumbar intervertebral disc degeneration: A review with emphasis
upon etiology, pathophysiology, and lumbar magnetic resonance
imaging findings. J Orthop Sports Phys Ther. 38:329–340. 2008.
View Article : Google Scholar : PubMed/NCBI
|
|
6
|
Weber KT, Jacobsen TD, Maidhof R,
Virojanapa J, Overby C, Bloom O, Quraishi S, Levine M and Chahine
NO: Developments in intervertebral disc disease research:
Pathophysiology, mechanobiology, and therapeutics. Curr Rev
Musculoskelet Med. 8:18–31. 2015. View Article : Google Scholar : PubMed/NCBI
|
|
7
|
Colombini A, Lombardi G, Corsi MM and
Banfi G: Pathophysiology of the human intervertebral disc. Int J
Biochem Cell Biol. 40:837–842. 2008. View Article : Google Scholar : PubMed/NCBI
|
|
8
|
Chen K, Wu D, Zhu X, Ni H, Wei X, Mao N,
Xie Y, Niu Y and Li M: Gene expression profile analysis of human
intervertebral disc degeneration. Genet Mol Biol. 36:448–454. 2013.
View Article : Google Scholar : PubMed/NCBI
|
|
9
|
Guo W, Zhang B, Li Y, Duan HQ, Sun C, Xu
YQ and Feng SQ: Gene expression profile identifies potential
biomarkers for human intervertebral disc degeneration. Mol Med Rep.
16:8665–8672. 2017. View Article : Google Scholar : PubMed/NCBI
|
|
10
|
Kazezian Z, Gawri R, Haglund L, Ouellet J,
Mwale F, Tarrant F, O'Gaora P, Pandit A, Alini M and Grad S: Gene
expression profiling identifies interferon signalling molecules and
IGFBP3 in human degenerative annulus fibrosus. Sci Rep.
5:156622015. View Article : Google Scholar : PubMed/NCBI
|
|
11
|
Liu C, Fei HD, Sun ZY and Tian JW:
Bioinformatic analysis of the microarray gene expression profile in
degenerative intervertebral disc cells exposed to TNF-α. Eur Rev
Med Pharmacol Sci. 19:3332–3339. 2015.PubMed/NCBI
|
|
12
|
Markova DZ, Kepler CK, Addya S, Murray HB,
Vaccaro AR, Shapiro IM, Anderson DG, Albert TJ and Risbud MV: An
organ culture system to model early degenerative changes of the
intervertebral disc II: Profiling global gene expression changes.
Arthritis Res Ther. 15:R1212013. View
Article : Google Scholar : PubMed/NCBI
|
|
13
|
Schubert AK, Smink JJ, Arp M, Ringe J,
Hegewald AA and Sittinger M: Quality assessment of surgical disc
samples discriminates human annulus fibrosus and nucleus pulposus
on tissue and molecular level. Int J Mol Sci. 19:E17612018.
View Article : Google Scholar : PubMed/NCBI
|
|
14
|
Tang Y, Wang S, Liu Y and Wang X:
Microarray analysis of genes and gene functions in disc
degeneration. Exp Ther Med. 7:343–348. 2014. View Article : Google Scholar : PubMed/NCBI
|
|
15
|
Zhang YG, Guo X, Sun Z, Jia G, Xu P and
Wang S: Gene expression profiles of disc tissues and peripheral
blood mononuclear cells from patients with degenerative discs. J
Bone Miner Metab. 28:209–219. 2010. View Article : Google Scholar : PubMed/NCBI
|
|
16
|
Tsai TT, Lai PL, Liao JC, Fu TS, Niu CC,
Chen LH, Lee MS, Chen WJ, Fang HC, Ho NY, et al: Increased
periostin gene expression in degenerative intervertebral disc
cells. Spine J. 13:289–298. 2013. View Article : Google Scholar : PubMed/NCBI
|
|
17
|
Thompson JP, Pearce RH, Schechter MT,
Adams ME, Tsang IK and Bishop PB: Preliminary evaluation of a
scheme for grading the gross morphology of the human intervertebral
disc. Spine. 15:411–415. 1990. View Article : Google Scholar : PubMed/NCBI
|
|
18
|
Livak KJ and Schmittgen TD: Analysis of
relative gene expression data using real-time quantitative PCR and
the 2(−ΔΔC(T)) method. Methods. 25:402–408. 2001. View Article : Google Scholar : PubMed/NCBI
|
|
19
|
Brinjikji W, Luetmer PH, Comstock B,
Bresnahan BW, Chen LE, Deyo RA, Halabi S, Turner JA, Avins AL,
James K, et al: Systematic literature review of imaging features of
spinal degeneration in asymptomatic populations. AJNR Am J
Neuroradiol. 36:811–816. 2015. View Article : Google Scholar : PubMed/NCBI
|
|
20
|
Luoma K, Riihimäki H, Luukkonen R,
Raininko R, Viikari-Juntura E and Lamminen A: Low back pain in
relation to lumbar disc degeneration. Spine. 25:487–492. 2000.
View Article : Google Scholar : PubMed/NCBI
|
|
21
|
Rajan NE, Bloom O, Maidhof R, Stetson N,
Sherry B, Levine M and Chahine NO: Toll-Like Receptor 4 (TLR4)
expression and stimulation in a model of intervertebral disc
inflammation and degeneration. Spine. 38:1343–1351. 2013.
View Article : Google Scholar : PubMed/NCBI
|
|
22
|
Nicotra L, Loram LC, Watkins LR and
Hutchinson MR: Toll-like receptors in chronic pain. Exp Neurol.
234:316–329. 2012. View Article : Google Scholar : PubMed/NCBI
|
|
23
|
Risbud MV and Shapiro IM: Role of
cytokines in intervertebral disc degeneration: Pain and disc
content. Nat Rev Rheumatol. 10:44–56. 2014. View Article : Google Scholar : PubMed/NCBI
|
|
24
|
Shamji MF, Setton LA, Jarvis W, So S, Chen
J, Jing L, Bullock R, Isaacs RE, Brown C and Richardson WJ:
Proinflammatory cytokine expression profile in degenerated and
herniated human intervertebral disc tissues. Arthritis Rheum.
62:1974–1982. 2010.PubMed/NCBI
|
|
25
|
Vo NV, Hartman RA, Yurube T, Jacobs LJ,
Sowa GA and Kang JD: Expression and regulation of
metalloproteinases and their inhibitors in intervertebral disc
aging and degeneration. Spine J13. 331–341. 2013. View Article : Google Scholar
|
|
26
|
von Bahr S, Movin T, Papadogiannakis N,
Pikuleva I, Rönnow P, Diczfalusy U and Björkhem I: Mechanism of
accumulation of cholesterol and cholestanol in tendons and the role
of sterol 27-hydroxylase (CYP27A1). Arterioscler Thromb Vasc Biol.
22:1129–1135. 2002. View Article : Google Scholar : PubMed/NCBI
|
|
27
|
Escher G, Krozowski Z, Croft KD and
Sviridov D: Expression of sterol 27-hydroxylase (CYP27A1) enhances
cholesterol efflux. J Biol Chem. 278:11015–11019. 2003. View Article : Google Scholar : PubMed/NCBI
|
|
28
|
Zhang Y, Zhao Y, Wang M, Si M, Li J, Hou
Y, Jia J and Nie L: Serum lipid levels are positively correlated
with lumbar disc herniation - a retrospective study of 790 Chinese
patients. Lipids Health Dis. 15:802016. View Article : Google Scholar : PubMed/NCBI
|
|
29
|
Kauppila LI: Atherosclerosis and disc
degeneration/low-back pain--a systematic review. Eur J Vasc
Endovasc Surg. 37:661–670. 2009. View Article : Google Scholar : PubMed/NCBI
|
|
30
|
Bank RA, Bayliss MT, Lafeber FP, Maroudas
A and Tekoppele JM: Ageing and zonal variation in
post-translational modification of collagen in normal human
articular cartilage. The age-related increase in non-enzymatic
glycation affects biomechanical properties of cartilage. Biochem J.
330:345–351. 1998. View Article : Google Scholar : PubMed/NCBI
|
|
31
|
Ali R, Le Maitre CL, Richardson SM,
Hoyland JA and Freemont AJ: Connective tissue growth factor
expression in human intervertebral disc: Implications for
angiogenesis in intervertebral disc degeneration. Biotech
Histochem. 83:239–245. 2008. View Article : Google Scholar : PubMed/NCBI
|
|
32
|
Nasto LA, Robinson AR, Ngo K, Clauson CL,
Dong Q, St Croix C, Sowa G, Pola E, Robbins PD, Kang J, et al:
Mitochondrial-derived reactive oxygen species (ROS) play a causal
role in aging-related intervertebral disc degeneration. J Orthop
Res. 31:1150–1157. 2013. View Article : Google Scholar : PubMed/NCBI
|
|
33
|
Flekac M, Skrha J, Hilgertova J, Lacinova
Z and Jarolimkova M: Gene polymorphisms of superoxide dismutases
and catalase in diabetes mellitus. BMC Med Genet. 9:302008.
View Article : Google Scholar : PubMed/NCBI
|
|
34
|
Landis GN and Tower J: Superoxide
dismutase evolution and life span regulation. Mech Ageing Dev.
126:365–379. 2005. View Article : Google Scholar : PubMed/NCBI
|
|
35
|
Nel A, Xia T, Mädler L and Li N: Toxic
potential of materials at the nanolevel. Science. 311:622–627.
2006. View Article : Google Scholar : PubMed/NCBI
|
|
36
|
Tian Y, Yuan W, Fujita N, Wang J, Wang H,
Shapiro IM and Risbud MV: Inflammatory cytokines associated with
degenerative disc disease control aggrecanase-1 (ADAMTS-4)
expression in nucleus pulposus cells through MAPK and NF-κB. Am J
Pathol. 182:2310–2321. 2013. View Article : Google Scholar : PubMed/NCBI
|
|
37
|
Wang H, Tian Y, Wang J, Phillips KL, Binch
AL, Dunn S, Cross A, Chiverton N, Zheng Z, Shapiro IM, et al:
Inflammatory cytokines induce NOTCH signaling in nucleus pulposus
cells: Implications in intervertebral disc degeneration. J Biol
Chem. 288:16761–16774. 2013. View Article : Google Scholar : PubMed/NCBI
|
|
38
|
Molinos M, Almeida CR, Caldeira J, Cunha
C, Gonçalves RM and Barbosa MA: Inflammation in intervertebral disc
degeneration and regeneration. J R Soc Interface. 12:201504292015.
View Article : Google Scholar : PubMed/NCBI
|
|
39
|
Boos N, Weissbach S, Rohrbach H, Weiler C,
Spratt KF and Nerlich AG: Classification of age-related changes in
lumbar intervertebral discs: 2002 Volvo Award in basic science.
Spine. 27:2631–2644. 2002. View Article : Google Scholar : PubMed/NCBI
|