Introduction
Lower back pain (LBP) is one of the most common
musculoskeletal complaints, with ~84% of the population
encountering LBP at a certain period during their lifetime
(1). Although there are numerous
potential sources of pain in the lumbar spine, intervertebral disc
degeneration (IDD) is considered to be a major contributor to LBP
(2). It is reported that ~40% of LBP
is of discogenic origin (3) and in
the clinic, lumbar disc herniation (LDH) was observed to be a major
contributor to LBP (4-6).
Herniation, which refers to the displacement of intervertebral disc
material beyond the normal margins of the disc space, was initially
described as disc ‘rupture’ (1). In
China, LDH has an incidence rate of 4.26%, affecting 1.9-7.6% of
males and 2.2-5.0% of females (7).
MRI, with its high sensitivity to the tissue water
content, has become an accurate tool for assessing IDD (8). Although the five-level Pfirrmann
grading system is commonly used in clinical practice, there is a
lack of information about biochemical changes that occur in the
disc (9). At present, numerous
quantitative MRI diagnostic methods have already been used to
quantitatively explore the process of IDD, which include in
vivo 23Na MRI, quantitative high-resolution magic
angle spinning nuclear MR spectroscopy, proton T2 imaging and T1rho
imaging (10). However, these novel
MRI techniques mainly monitor the concentration of proteoglycans
and water in the discs and are not suited to evaluate the changes
in collagen content and structure within the nucleus pulposus (NP).
Furthermore, the requirements for tissue processing, including
fixation, dehydration and staining, are major disadvantages of
routine pathological and histological diagnostic methods due to the
possibility of introducing artifacts (11).
Raman spectroscopy, based on inelastic scattering of
light, is an emerging optical technique (12). It is widely used in the fields of
medicine and life sciences due to its advantages of being
label-free, non-invasive and an objective diagnostic tool at the
molecular level. The advantage of a label-free technique is the
ability to provide important information on the unmodified target
molecules (13-15).
Raman spectroscopy is able to detect biological macromolecules,
including proteins, lipids, and DNA in biological samples and it
provides abundant molecular information at the microscopic level
(16). In recent years, the
significant developments in Raman spectroscopic technology have
facilitated it becoming a research hotspot for the early stages of
disease and intra-operative diagnosis (17,18).
To the best of our knowledge, the present study was
the first to use Raman spectroscopy to identify compositional and
structural changes in the NP from patients with LDH, in addition to
exploring the biochemical mechanisms of IDD at the microscopic
level.
Materials and methods
Patient samples
The study protocol was approved by the Ethics Review
Board of Tianjin First Central Hospital (TFCH; Tianjin, China); the
sample collection was approved by the Clinical Research Ethics
Committee of TFCH and written informed consent was obtained from
all patients. A total of 30 NP samples were obtained from 30
patients (19 males and 11 females; age, 26-75 years; mean age, 51.7
years), who were diagnosed with LDH and received spinal fusion
surgery to relieve LBP, between June 2016 and June 2018. Surgery is
only appropriate in patients with nerve-root compression that is
confirmed by CT or MRI, who present with a corresponding sciatica
syndrome and have no response to 6 weeks of conservative therapy
(1).
Preparation of NP samples
The patients' NP tissues were removed for treatment
purposes during surgery and stored in a sterile plastic container
with the patient's data. The NP samples were maintained on ice
during transportation to the laboratory, which was completed within
30 min. NP samples were subsequently washed with physiological
saline solution to remove the blood, sliced into 4-mm2
thick sections and embedded in optimal cutting temperature medium
(OCT) within a plastic mould, which was then frozen in liquid
nitrogen. All frozen tissue blocks were cryosectioned to a
thickness of 30 µm, mounted on glass coverslips and stored at -20˚C
until required for further use. All procedures were performed in a
sterile environment.
Pre-operative MRI measurements and
assessment
All patients underwent a routine lumbar MRI scan
prior to surgery. MRI imaging of the lumbar spine
(L1/L2 to L5/S1) was
performed using T2-weighted sequences with a Siemens 3.0 T scanner
(Siemens Healthineers) at the MRI center of TFCH. A T2-weighted
imaging (T2WI) sequence was recorded using the following
parameters: Axis T2WI repetition time (TR), 4,600 msec; echo time
(TE), 94 msec; field of view (FOV), 210x210 mm; slice thickness,
4.0 mm; scanning slice number, 3; Voxel size, 0.7x0.5x4.0 mm;
sagittal T2WI:TR, 3,000 msec; TE, 48 msec; FOV, 280x280 mm; slice
thickness, 3.0 mm; scanning slice number, 12; Voxel size,
1.2x0.9x3.0 mm.
The grade of IDD was evaluated using T2-weighted
images according to the Pfirrmann classification system (19). All MRI scans were reviewed
independently and randomly by two experienced radiologists who were
blinded to the clinical data and disagreements between the two
observers were resolved by consensus following consultation with a
third radiologist. After 3 months, the two observers evaluated all
MRI images independently and randomly for a second time (the
observers were not aware that they were evaluating the same
images).
T2 signal intensity value measurement
of NP
The T2 signal intensity value of the NP was measured
using Siemens post-processing software on sagittal T2-weighted
images. A single operator placed small, round regions of interest
(20-40 mm2) within the anterior, middle and posterior
positions of the NP on the target intervertebral disc. The recorded
values were then averaged over three successive measurements at
each selected location (8). The same
method was used to measure the cerebrospinal fluid brightness value
of the lumbar segment. The T2 signal intensity value of the NP was
calculated using the following formula: Brightness value of
NP/brightness value of cerebrospinal fluid (20).
Raman spectroscopy
Frozen sections of NP samples were thawed completely
at room temperature and the OCT was then thoroughly washed with
physiological saline solution and subsequently scanned using Raman
spectroscopy. During the Raman measurement, NP samples were kept
hydrated with physiological saline solution. Raman measurements
were performed using a Laser Micro-Raman Spectrometer (Thermo
Scientific DXR Raman Microscope) at room temperature. Collection
parameters were set as follows: Laser wavelength, 532 nm (DXR 532
nm LASER); microscope objective, 50X; laser power, 10.0 mW; spot
size, 1.1 µm; spectral range, 800-1,800 cm-1; grating,
900 lines/mm; resolution, 5 cm-1. The data were
collected at 10 randomly chosen points on the surface of the NP
samples (21-23).
The time of exposure to obtain individual Raman spectra was 16 sec,
with five scans taken. In order to acquire high-quality spectra,
re-focusing was necessary.
Data were pre-processed with OMINIC 9.3.32 software
(Thermo Fisher Scientific, Inc.). For baseline correction, a linear
baseline was fit automatically to the whole spectral range and
subtracted from each spectrum of the dataset. Gaussian/Lorentzian
functions were used throughout the spectral fitting computation.
Raman band data (intensity or area) were imported to Microsoft
Excel 2010 and band intensity ratios were calculated.
Statistical analysis
Statistical analysis was performed using SPSS 16.0
software (SPSS, Inc.) and data are expressed as the mean ± standard
deviation. Statistically significant differences between groups
were determined using one-way analysis of variance, followed by
Tukey's test for multiple comparisons. The inter-observer
agreements of the IDD were assessed with κ statistics. The
association between spectral data and Pfirrmann grades was
evaluated using Spearman's correlation test. The association
between the T2 signal intensity value and the relative content of
proteoglycans was evaluated using bivariate correlations. The
graphs were produced with GraphPad Prism 5.0 Software (GraphPad
Software, Inc.). P<0.05 was considered to indicate a
statistically significant difference.
Results
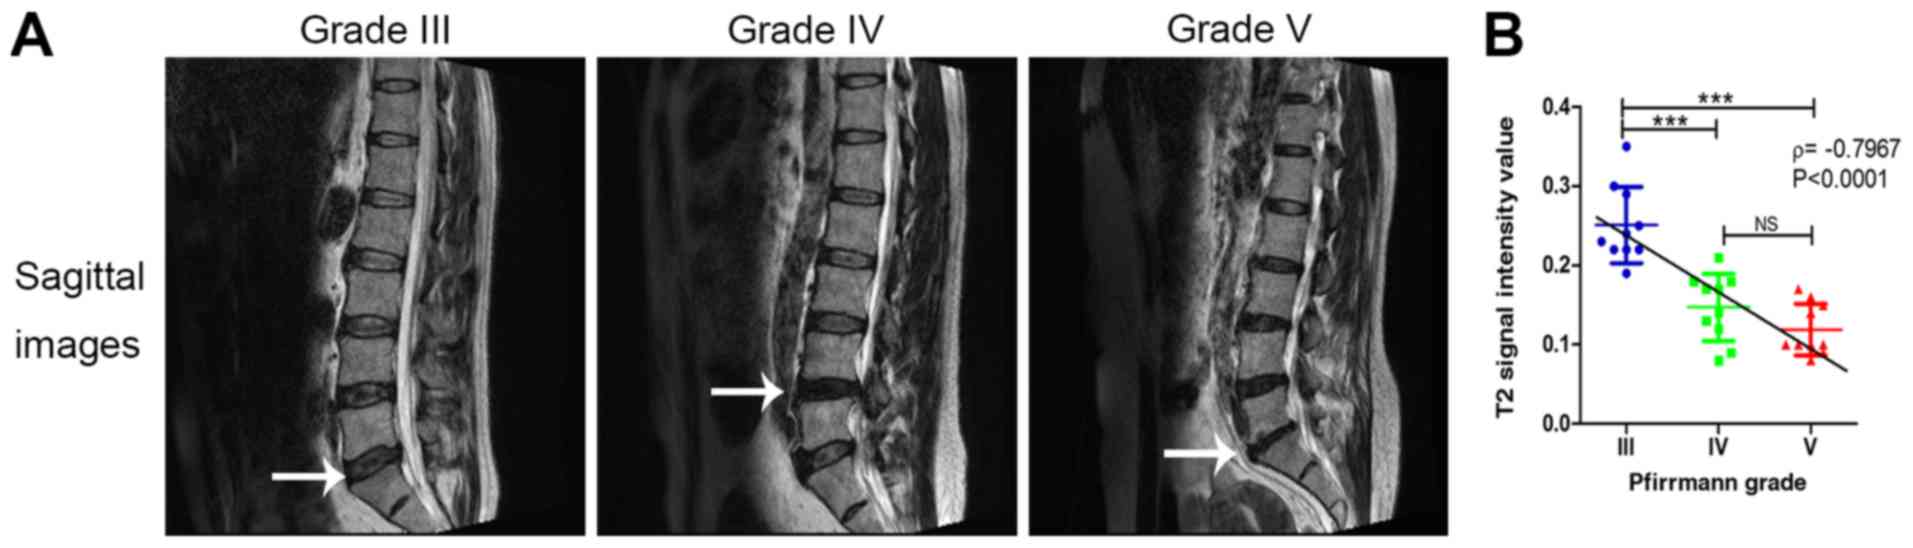
Pfirrmann grading
Representative MRI images of different patients are
provided in Fig. 1A. The κ value of
the first measurement was 0.734, indicating a good interobserver
agreement (P<0.001) and the κ value of the second measurement
was 0.774 (P<0.001). The grading results are listed in Table I: Grade III, n=10; grade IV, n=10;
and grade V, n=10. None of the discs were graded as Pfirrmann grade
I or II.
 | Table ILevel of lumbar disc herniation in
Pfirrmann grades. |
Table I
Level of lumbar disc herniation in
Pfirrmann grades.
| | Level of lumbar
disc herniation | |
|---|
| Grade |
L1-L2 |
L3-L4 |
L4-L5 |
L5-S1 | Total |
|---|
| III | 0 | 1 | 5 | 4 | 10 |
| IV | 0 | 1 | 6 | 3 | 10 |
| V | 0 | 0 | 7 | 3 | 10 |
| Total | 0 | 2 | 18 | 10 | 30 |
Analysis of the T2 signal intensity
value
The T2 signal intensity value in patients with
Pfirrmann grade IV and V was significantly lower compared with that
in grade III (P<0.001); however, the T2 signal intensity value
was not significantly different between grade IV and grade V
(P>0.05). Spearman's rank correlation analysis demonstrated that
the T2 signal intensity value was significantly inversely
correlated with the Pfirrmann grade (r=-0.7967, P<0.0001;
Fig. 1B).
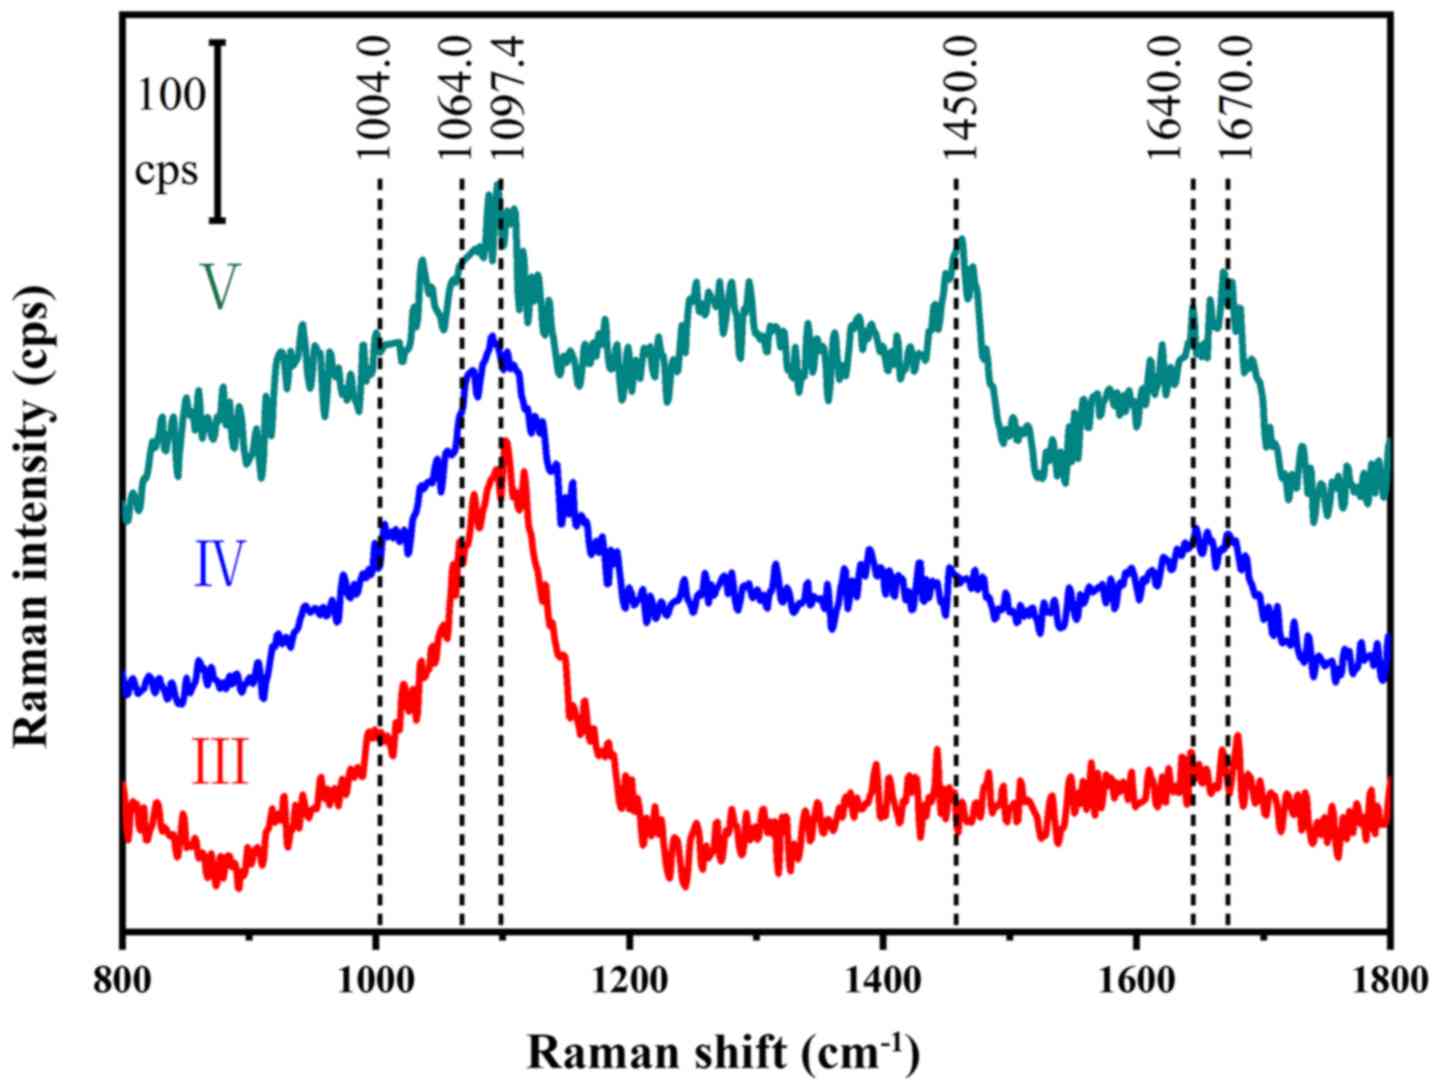
Characteristics of Raman spectra
The Raman spectra of the NP samples with different
Pfirrmann grades are presented in Fig.
2 and a list of bands and corresponding assignments observed in
the average spectra are listed in Table
II. The proteoglycans peaked at 1,064-1,065 cm-1,
which corresponded to the glycosaminoglycans, which were previously
identified in the Raman spectra of chondroitin sulfate and
proteoglycans (11). The peak of the
phenylalanine ring breathing band was at 1,004 cm-1.
This was used to calculate the relative content, as it is not
sensitive to local chemical environment (24). Due to the irregularity of biological
material surfaces influencing the band intensity, band intensity
ratios and band area integrals were employed to display
compositional and structural changes of proteoglycans and collagen
in NP samples. These parameters provide information on the
association between proteoglycans, collagen content and structure
in NP samples. In the present study, the intensity ratio of the two
peaks (I1064/I1004) provided information
about the relative content of proteoglycans (13).
| Table IIBand position and assignments of
selected Raman bands from ex vivo human nucleus pulposus
tissue, using the interval 800-1,800 cm-1. |
Table II
Band position and assignments of
selected Raman bands from ex vivo human nucleus pulposus
tissue, using the interval 800-1,800 cm-1.
| Band position
(cm-1) | Assignments | Chemical
compounds | (Refs.) |
|---|
| 1,004 | Phenylalanine | Protein | (24) |
| 1,064 |
OSO3- stretching;
glycoaminoglycan | Proteoglycan | (11) |
| 1,200-1,300 | Amide III, major
collagen band | Protein | (25-27) |
| 1,640 | Amide I, ordered
coil, α-helix | Protein | (13,28,29) |
| 1,670 | Amide I, disordered
coil, random coil | Protein | (13,28,29) |
| 1,600-1,700 | Amide I, major
collagen band | Protein | (25-27) |
Collagen serves a major structural role in the
intervertebral disc, which may be detected as Raman bands arising
from the backbone amide groups of collagens. Amide I and III bands
are uniquely useful for collagen conformational analysis. Bands
generated in the 1,200-1,300 and 1,600-1,700 cm-1 range
were identified as amide III and I, respectively, and were
previously identified in the Raman spectra of collagen (25-27).
The intensity ratio of two peaks
(I1670/I1640; amide I) may provide
information on the relative content of disordered coil (random
coil) vs. ordered coil (α-helix) (13,28,29).
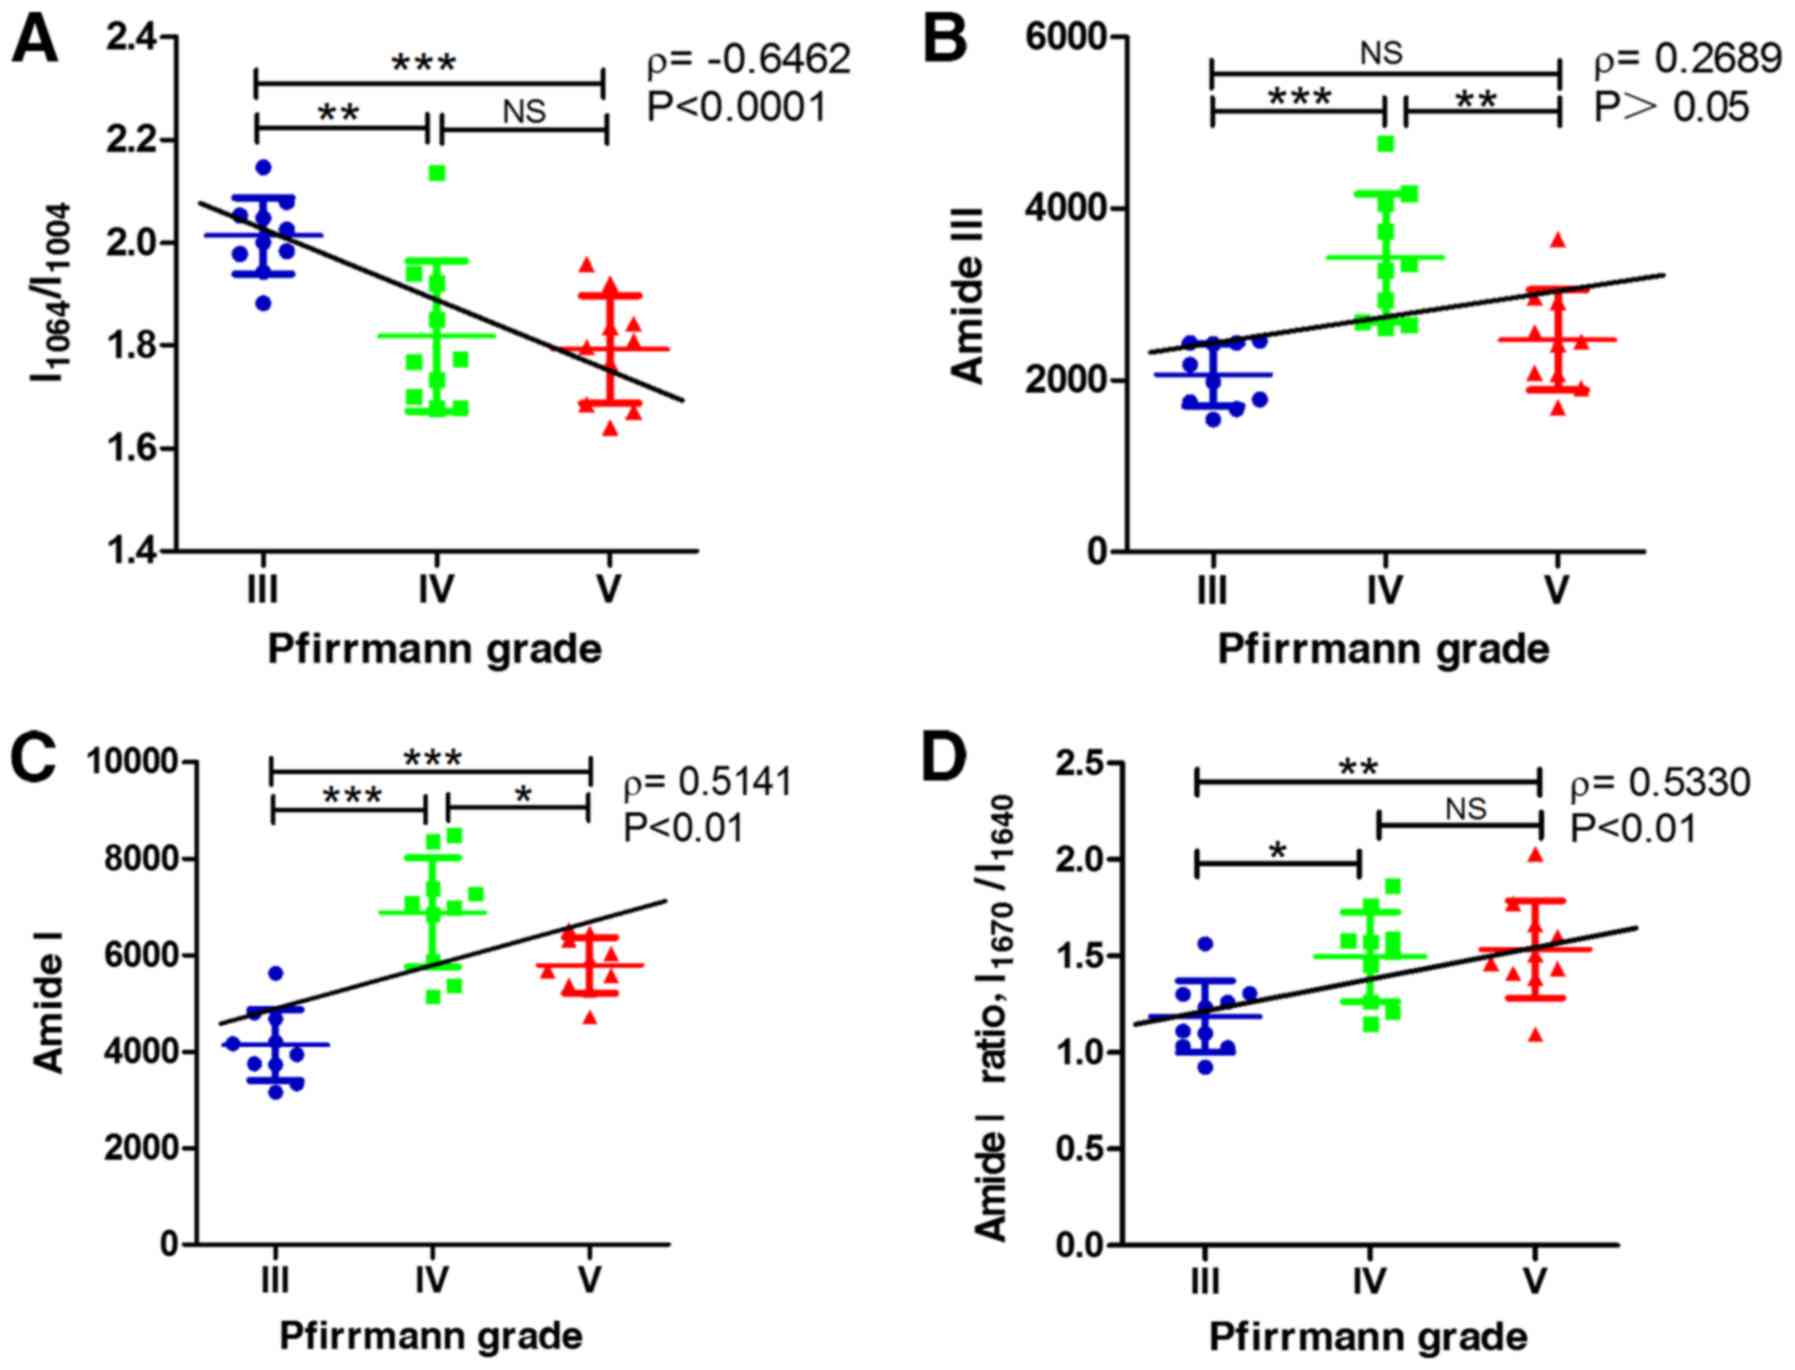
Raman analysis of proteoglycan and
collagen content in NP samples
The relative content of proteoglycans
(I1064/I1004) in grade IV and V samples was
significantly decreased compared with that in grade III (P<0.01
and P<0.001, respectively). Spearman's rank correlation analysis
results demonstrated that the relative content of proteoglycans was
significantly inversely correlated with the Pfirrmann grade
(ρ=-0.6462; P<0.0001; Fig.
3A).
Collagen content was mainly determined through the
area integral under the Raman spectral curve of the amide group
bands. The content of amide III in grade IV was significantly
increased compared with that in grade III and V (P<0.001 and
P<0.01, respectively). Spearman's rank correlation analysis
demonstrated that the content of amide III was not significantly
correlated with the Pfirrmann grade (ρ=0.2689; P>0.05; Fig. 3B). The content of amide I in grade IV
was higher compared with that in grade III and V (Fig. 3C), suggesting it had reached its
maximum at grade IV. Spearman's rank correlation analysis
demonstrated that the content of amide I was significantly
positively correlated with the Pfirrmann grade (ρ=0.5141;
P<0.01).
Raman analysis of collagen structural
changes in NP samples
The intensity ratio of two peaks
(I1670/I1640; amide I) in grade IV and V was
significantly higher compared with that in grade III (P<0.05 and
P<0.01, respectively). Spearman's rank correlation analysis
demonstrated that the intensity ratio of two peaks
(I1670/I1640; amide I) was significantly
positively correlated with the Pfirrmann grade (ρ=0.5330;
P<0.01; Fig. 3D).
Discussion
To the best of our knowledge, the present study was
among the first to use Raman spectroscopy to report compositional
and structural variations of the NP from patients with LDH. In the
present study, 30 NP tissue samples were obtained from 30 patients
who were diagnosed with LDH and received spinal fusion surgery to
relieve LBP. The Pfirrmann grading system, a semi-quantitative
assessment, was used to evaluate the level of IDD according to the
changes in the MRI signal intensity, the disc structure and the
distinction between NP and annulus fibrosus (AF) and disc height.
Although the Pfirrmann grade is widely applied in clinical practice
worldwide, this classification system is subjective and ambiguous
due to the lack of a quantitative index (10). It was observed that the interobserver
agreements of the IDD displayed κ1=0.734 and
κ2=0.774, hence the result is apparently acceptable. At
present, a series of quantitative MRI diagnostic methods and
quantitative MR parameters, including apparent diffusion
coefficient and diffusion-weighted imaging, are used to
quantitatively explore the process of IDD and to detect
imperceptible biochemical changes within the discs. However, the
intrinsic association between these quantitative MRI parameters and
the biological properties of the intervertebral disc has remained
to be completely elucidated. In the present study, the association
between the T2 signal intensity value and the relative content of
proteoglycans was evaluated using bivariate correlations. The
results provided P=0.509 and P<0.01; therefore, their
correlation was significant to the 0.01 level (two-tailed). This
result indicated that the T2 signal intensity value obtained by MRI
is identical to the relative content of proteoglycans
(I1064/I1004) determined using a Raman
spectrometer. On the other hand, Yang et al and Benneker
et al (30,31) reported that the decreased content of
proteoglycans in the NP was responsible for the decrease in the
osmotic pressure of the disc matrices and loss of hydration. These
results lead to the loss of signal intensity on T2-weighted MRI
images. Unfortunately, at present, lumbar MRI is unable to display
changes in collagen content and structure.
Raman spectroscopy is able to not only measure the
chemical composition of complex biological samples, including
biofluids, cells and tissues, but it also provides quantitative
information about its chemical makeup. Subtle vibrational changes
in biological macromolecule content and structure may be detected
by Raman spectroscopy (12). Type II
collagen and proteoglycans are the predominant components of the NP
and decreased content of these two components is the major
characteristic of IDD (19). In the
present study, the relative content of proteoglycans
(I1064/I1004) demonstrated a significant
negative correlation with the Pfirrmann grade. Thus, the relative
content of proteoglycans decreased whilst the Pfirrmann grade
increased, which may be responsible for the loss of hydration and
the T2 signal intensity value of the NP, as the changes in signal
intensity caused by the variations in tissue moisture content have
been indicated to be most sensitive on T2WI (32,33).
In the intervertebral disc, collagen serves a major
structural role, particularly at the NP where type IX collagen
fibers are cross-linked to collagen type II fibers to provide
optimal stability (34). Collagen
may be detected as Raman bands arising from the backbone amide
groups in collagen. In the present study, Raman spectral analysis
demonstrated that the content of amide III and I in grade IV was
significantly higher compared with that in grade III and V;
however, it reached its maximum at grade IV, instead of continuing
to increase with the Pfirrmann grade. Furthermore, Spearman's rank
correlation analysis demonstrated that the content of amide I was
significantly positively correlated with the Pfirrmann grade. This
transition into a more fibrotic type of tissue may produce a
stiffer NP and the 'shock-absorbing' properties of the disc may be
severely limited, eventually contributing to IDD. Decreased content
of type II collagen and proteoglycans are the major features of
IDD; however, the present study observed that the content of
collagen increased with the Pfirrmann grade, which may contribute
to metabolic disorders of the extracellular matrix. It has been
reported that if the boundary between the outer AF and inner NP is
disrupted, this may impair the mechanical function of the
intervertebral disc (35).
Raman spectroscopy is not only able to identify
compositional changes in collagen, but it is also sensitive to
different protein amide linkages in the secondary structures,
including α-helices, β-sheets and random coils (22,36).
Amide III and I bands are uniquely useful for collagen
conformational analysis. The relative content of disordered coil
vs. ordered coil helps define the degree of disorder in the
collagen secondary structure. Kumar et al (13) reported that the intensity ratio of
two peaks (I1245/I1270) provided information
about the relative content of random vs. ordered coil in the
protein structure and the progression of the cartilage disorder.
However, in the present study, it was discovered that the intensity
ratio of two peaks (I1670/I1640; amide I) was
significantly positively correlated with the Pfirrmann grade. The
higher relative intensity ratio of
I1670/I1640 indicates a higher fractional
content of disordered collagen, which is in turn evidence for the
defective collagen structure leading to abnormalities of the NP.
These results may contribute to the further study of the
microcosmic mechanisms of IDD and not only suggested an increase in
the content of defective collagen with the Pfirrmann grade, but
they also illustrated the ability of Raman spectroscopy to detect
minute modifications in the NP at the microscopic level.
There are certain limitations to the present study.
Although the content of proteoglycans and collagen was measured
though band intensity and band area ratios, the relatively high
background in the Raman spectra was unavoidable. Due to the
irregularity of the biological material surfaces being able to
significantly influence the band intensity and background (23), the same problem exists in other Raman
spectroscopy experiments; for instance, in human knee cartilage,
mesenchymal stromal cells and human brain tumors (21-23).
In addition, 10 randomly selected points on the surface of each NP
sample were analyzed by Raman spectrometry. It appears to be
difficult to cover the entire NP. However, Tsao et al
(21) reported that Raman spectra
were obtained from at least 10 locations selected from the surface
of cell samples for each sample preparation, Takahashi et al
(22) reported that Raman spectral
intensity at 10 different locations was randomly recorded within
each of the total 6 areas labeled on each sample and Buchwald et
al (23) reported that 7 Raman
maps were measured in each defined central site of the femur head.
Therefore, future studies should increase the scanning numbers and
points for generating spectra with high quality.
In conclusion, the results of the present study
provided a step towards the potential use of ex vivo Raman
spectroscopy for the investigation of biomarkers in IDD. A higher
relative intensity of the ratio of two peaks
(I1670/I1640; amide I) indicated a higher
fractional content of disordered collagen, which provides evidence
of the defective collagen structure leading to abnormalities of the
NP. In the near future, it is hypothesized that ex vivo
Raman spectroscopy or in vivo studies of the NP will not
only aid in investigating the biochemical mechanisms of IDD at the
microscopic level, but they will also be combined with other MRI
parameters and fiber-optic probes to aid in the early diagnosis of
IDD.
Acknowledgements
Not applicable.
Funding
No funding was received.
Availability of data and materials
The datasets used and/or analyzed during the present
study are available from the corresponding author on reasonable
request.
Authors' contributions
TaZ and ZLi designed the study and revised the
manuscript;XW and JM performed the experiments and drafted the
manuscript; XW and ZLia collected human NP tissue samples;QS and
ToZ were responsible for measuring the T2 signal intensity value
and evaluating the degree of IDD according to Pfirrmann grades; and
JM, ZLi and WWL contributed to performing the measurements and
analyzing the data obtained using Raman spectroscopy. All authors
read and approved the final manuscript.
Ethics approval and consent to
participate
The present study was approved by the Ethics Review
Board of Tianjin First Central Hospital (Tianjin China).
Patient consent for publication
Patients consented to the publication of their MRI
scanning images.
Competing interests
The authors declare that they have no competing
interests.
References
|
1
|
Deyo RA and Mirza SK: Clinical practice.
Herniated lumbar intervertebral disk. N Engl J Med. 374:1763–1772.
2016.PubMed/NCBI View Article : Google Scholar
|
|
2
|
Kepler CK, Ponnappan RK, Tannoury CA,
Risbud MV and Anderson DG: The molecular basis of intervertebral
disc degeneration. Spine J. 13:318–330. 2013.PubMed/NCBI View Article : Google Scholar
|
|
3
|
Kallewaard JW, Geurts JW, Kessels A,
Willems P, van Santbrink H and van Kleef M: Efficacy, safety, and
predictors of intradiscal methylene blue injection for discogenic
low back pain: Results of a multicenter prospective clinical
series. Pain Pract. 16:405–412. 2016.PubMed/NCBI View Article : Google Scholar
|
|
4
|
Cunha C, Silva AJ, Pereira P, Vaz R,
Goncalves RM and Barbosa MA: The inflammatory response in the
regression of lumbar disc herniation. Arthritis Res Ther.
20(251)2018.PubMed/NCBI View Article : Google Scholar
|
|
5
|
Cheung KM, Karppinen J, Chan D, Ho DW,
Song YQ, Sham P, Cheah KS, Leong JC and Luk KD: Prevalence and
pattern of lumbar magnetic resonance imaging changes in a
population study of one thousand forty-three individuals. Spine
(Phila Pa 1976). 34:934–940. 2009.PubMed/NCBI View Article : Google Scholar
|
|
6
|
Wang Y, Wang H, Lv F, Ma X, Xia X and
Jiang J: Asymmetry between the superior and inferior endplates is a
risk factor for lumbar disc degeneration. J Orthop Res.
36:2469–2475. 2018.PubMed/NCBI View Article : Google Scholar
|
|
7
|
He A, Wang WZ, Qiao PF, Qiao GY, Cheng H
and Feng PY: Quantitative evaluation of compressed l4-5 and s1
nerve roots of lumbar disc herniation patients by diffusion tensor
imaging and fiber tractography. World Neurosurg. 115:e45–e52.
2018.PubMed/NCBI View Article : Google Scholar
|
|
8
|
Zhang W, Ma X, Wang Y, Zhao J, Zhang X,
Gao Y and Li S: Assessment of apparent diffusion coefficient in
lumbar intervertebral disc degeneration. Eur Spine J. 23:1830–1836.
2014.PubMed/NCBI View Article : Google Scholar
|
|
9
|
Radek M, Pacholczyk-Sienicka B, Jankowski
S, Albrecht Ł, Grodzka M, Depta A and Radek A: Assessing the
correlation between the degree of disc degeneration on the
Pfirrmann scale and the metabolites identified in HR-MAS NMR
spectroscopy. Magn Reson Imaging. 34:376–380. 2016.PubMed/NCBI View Article : Google Scholar
|
|
10
|
Xiong X, Zhou Z, Figini M, Shangguan J,
Zhang Z and Chen W: Multi-parameter evaluation of lumbar
intervertebral disc degeneration using quantitative magnetic
resonance imaging techniques. Am J Transl Res. 10:444–454.
2018.PubMed/NCBI
|
|
11
|
Pudlas M, Brauchle E, Klein TJ, Hutmacher
DW and Schenke-Layland K: Non-invasive identification of
proteoglycans and chondrocyte differentiation state by Raman
microspectroscopy. J Biophotonics. 6:205–211. 2013.PubMed/NCBI View Article : Google Scholar
|
|
12
|
Kong K, Kendall C, Stone N and Notingher
I: Raman spectroscopy for medical diagnostics-from in-vitro
biofluid assays to in-vivo cancer detection. Adv Drug Deliv Rev.
89:121–134. 2015.PubMed/NCBI View Article : Google Scholar
|
|
13
|
Kumar R, Singh GP, Gronhaug KM, Afseth NK,
de Lange Davies C, Drogset JO and Lilledahl MB: Single cell
confocal Raman spectroscopy of human osteoarthritic chondrocytes: A
preliminary study. Int J Mol Sci. 16:9341–9353. 2015.PubMed/NCBI View Article : Google Scholar
|
|
14
|
Keating ME and Byrne HJ: Raman
spectroscopy in nanomedicine: Current status and future
perspective. Nanomedicine (Lond). 8:1335–1351. 2013.PubMed/NCBI View Article : Google Scholar
|
|
15
|
Nima ZA, Biswas A, Bayer IS, Hardcastle
FD, Perry D, Ghosh A, Dervishi E and Biris AS: Applications of
surface-enhanced Raman scattering in advanced bio-medical
technologies and diagnostics. Drug Metab Rev. 46:155–175.
2014.PubMed/NCBI View Article : Google Scholar
|
|
16
|
Gong B, Oest ME, Mann KA, Damron TA and
Morris MD: Raman spectroscopy demonstrates prolonged alteration of
bone chemical composition following extremity localized
irradiation. Bone. 57:252–258. 2013.PubMed/NCBI View Article : Google Scholar
|
|
17
|
Lu FK, Calligaris D, Olubiyi OI, Norton I,
Yang W, Santagata S, Xie XS, Golby AJ and Agar NY: Label-free
neurosurgical pathology with stimulated Raman imaging. Cancer Res.
76:3451–3462. 2016.PubMed/NCBI View Article : Google Scholar
|
|
18
|
Pence I and Mahadevan-Jansen A: Clinical
instrumentation and applications of Raman spectroscopy. Chem Soc
Rev. 45:1958–1979. 2016.PubMed/NCBI View Article : Google Scholar
|
|
19
|
Wang WJ, Yang W, Ouyang ZH, Xue JB, Li XL,
Zhang J, He WS, Chen WK, Yan YG and Wang C: MiR-21 promotes ECM
degradation through inhibiting autophagy via the PTEN/akt/mTOR
signaling pathway in human degenerated NP cells. Biomed
Pharmacother. 99:725–734. 2018.PubMed/NCBI View Article : Google Scholar
|
|
20
|
Luoma EK, Raininko R, Nummi PJ, Luukkonen
R, Manninen HI and Riihimäki HA: Suitability of cerebrospinal fluid
as a signal-intensity reference on MRI: Evaluation of
signal-intensity variations in the lumbosacral dural sac.
Neuroradiology. 39:728–732. 1997.PubMed/NCBI View Article : Google Scholar
|
|
21
|
Tsao YT, Huang YJ, Wu HH, Liu YA, Liu YS
and Lee OK: Osteocalcin mediates biomineralization during
osteogenic maturation in human mesenchymal stromal cells. Int J Mol
Sci. 18(pii: E159)2017.PubMed/NCBI View Article : Google Scholar
|
|
22
|
Takahashi Y, Sugano N, Takao M, Sakai T,
Nishii T and Pezzotti G: Raman spectroscopy investigation of
load-assisted microstructural alterations in human knee cartilage:
Preliminary study into diagnostic potential for osteoarthritis. J
Mech Behav Biomed Mater. 31:77–85. 2014.PubMed/NCBI View Article : Google Scholar
|
|
23
|
Buchwald T, Niciejewski K, Kozielski M,
Szybowicz M, Siatkowski M and Krauss H: Identifying compositional
and structural changes in spongy and subchondral bone from the hip
joints of patients with osteoarthritis using Raman spectroscopy. J
Biomed Opt. 17(017007)2012.PubMed/NCBI View Article : Google Scholar
|
|
24
|
Caraher MC, Sophocleous A, Beattie JR,
O'Driscoll O, Cummins NM, Brennan O, O'Brien FJ, Ralston SH, Bell
SEJ, Towler M and Idris AI: Raman spectroscopy predicts the link
between claw keratin and bone collagen structure in a rodent model
of oestrogen deficiency. Biochim Biophys Acta Mol Basis Dis.
1864:398–406. 2018.PubMed/NCBI View Article : Google Scholar
|
|
25
|
Quade M, Schumacher M, Bernhardt A, Lode
A, Kampschulte M, Voß A, Simon P, Uckermann O, Kirsch M and
Gelinsky M: Strontium-modification of porous scaffolds from
mineralized collagen for potential use in bone defect therapy.
Mater Sci Eng C Mater Biol Appl. 84:159–167. 2018.PubMed/NCBI View Article : Google Scholar
|
|
26
|
Murab S and Ghosh S: Impact of
osmoregulatory agents on the recovery of collagen conformation in
decellularized corneas. Biomed Mater. 11(065005)2016.PubMed/NCBI View Article : Google Scholar
|
|
27
|
Masic A, Bertinetti L, Schuetz R, Galvis
L, Timofeeva N, Dunlop JW, Seto J, Hartmann MA and Fratzl P:
Observations of multiscale, stress-induced changes of collagen
orientation in tendon by polarized Raman spectroscopy.
Biomacromolecules. 12:3989–3996. 2011.PubMed/NCBI View Article : Google Scholar
|
|
28
|
Unal M, Jung H and Akkus O: Novel Raman
spectroscopic biomarkers indicate that postyield damage denatures
bone's collagen. J Bone Miner Res. 31:1015–1025. 2016.PubMed/NCBI View Article : Google Scholar
|
|
29
|
Lurie JD, Moses RA, Tosteson AN, Tosteson
TD, Carragee EJ, Carrino JA, Kaiser JA and Herzog RJ: Magnetic
resonance imaging predictors of surgical outcome in patients with
lumbar intervertebral disc herniation. Spine (Phila Pa 1976).
38:1216–1225. 2013.PubMed/NCBI View Article : Google Scholar
|
|
30
|
Yang SH, Espinoza Orias AA, Pan CC, Senoo
I, Andersson GBJ, An HS and Inoue N: Spatial geometric and magnetic
resonance signal intensity changes with advancing stages of nucleus
pulposus degeneration. BMC Musculoskelet Disord.
18(473)2017.PubMed/NCBI View Article : Google Scholar
|
|
31
|
Benneker LM, Heini PF, Anderson SE, Alini
M and Ito K: Correlation of radiographic and MRI parameters to
morphological and biochemical assessment of intervertebral disc
degeneration. Eur Spine J. 14:27–35. 2005.PubMed/NCBI View Article : Google Scholar
|
|
32
|
Cassinelli EH, Hall RA and Kang JD:
Biochemistry of intervertebral disc degeneration and the potential
for gene therapy applications. Spine J. 1:205–214. 2001.PubMed/NCBI View Article : Google Scholar
|
|
33
|
Tertti M, Paajanen H, Laato M, Aho H, Komu
M and Kormano M: Disc degeneration in magnetic resonance imaging. A
comparative biochemical, histologic, and radiologic study in
cadaver spines. Spine (Phila Pa 1976). 16:629–634. 1991.PubMed/NCBI View Article : Google Scholar
|
|
34
|
Kalb S, Martirosyan NL, Kalani MY, Broc GG
and Theodore N: Genetics of the degenerated intervertebral disc.
World Neurosurg. 77:491–501. 2012.PubMed/NCBI View Article : Google Scholar
|
|
35
|
Shi C, Wu H, Du D, Im HJ, Zhang Y, Hu B,
Chen H, Wang X, Liu Y, Cao P, et al: Nicotinamide
phosphoribosyltransferase inhibitor APO866 prevents IL-1β-induced
human nucleus pulposus cell degeneration via autophagy. Cell
Physiol Biochem. 49:2463–2482. 2018.PubMed/NCBI View Article : Google Scholar
|
|
36
|
Dehring KA, Smukler AR, Roessler BJ and
Morris MD: Correlating changes in collagen secondary structure with
aging and defective type II collagen by Raman spectroscopy. Appl
Spectrosc. 60:366–372. 2006.PubMed/NCBI View Article : Google Scholar
|