Introduction
Acute deterioration of renal function translates
into a syndrome known as acute kidney injury (AKI). The sudden drop
in the glomerular filtration rate leads to the accumulation of the
end products of creatinine and nitrogen metabolism in the blood.
Diagnosing AKI relies greatly on determining the serum levels of
these products, which causes a delay in emphasizing the kidney
damage (1,2).
Therefore, the need for earlier detection and better
monitoring of these patients is vital. Oxidative stress (OS) is
represented by reactive oxygen and nitrogen species (ROS, RNS) and
free radicals that reach a level that exceeds the endogenous
antioxidant capacity. OS is an important topic in research studies,
and to date it has been declared a pathogenetic factor in many
diseases (3-6).
In the early stages of AKI there are changes and alterations in the
structure and function of the mitochondria leading to ATP depletion
and dysfunction in the energetic metabolism. Mitochondria are a
major source of ROS, but they are also a source of antioxidant
molecules (7-10).
Despite the numerous studies that have focused on this topic, the
precise mechanisms that generate reactive species (RS) in AKI
continue to be unknown. Homeostasis is maintained by counteracting
the physiological production of RS with a continuous endogenous
production of antioxidants. Antioxidants usually intervene early in
the development of AKI in order to scavenge RS, to downregulate OS
and subsequently to reduce lipid peroxidation and total oxidative
damage (3,5,11).
The main purpose of the present study was to
experimentally define the relationship between mild renal
impairment (pre-AKI) and both the systemic OS and antioxidant
status. In addition, we analyzed multiple markers in order to
identify specific ones that could be further used to discover
kidney injury at earlier stages.
Materials and methods
Animals
A total of 14 adult male Rattus norvegicus
rats, obtained from the Animal Facility of ‘Iuliu Hatieganu’
University of Medicine and Pharmacy, Cluj-Napoca, were used in this
experiment (weighing, 400.07±56.04 g). The animals were housed in
standard cages equipped with wood chip bedding, in a room with an
ambient temperature of 22±1˚C, a 12/12-h light/dark cycle, with
40-50% humidity. Throughout the experiment, all animals were given
ad libitum access to tap water and standard chow for
rodents.
Experimental procedure
Rats were arbitrarily divided equally into two
groups: The control group (n=7) and the gentamicin group
(n=7). Total experiment time was 10 days. All rats were
given 2 days to acclimatize to the environment before starting the
injections. Rats in the control group were injected
intraperitoneally (i.p.) with physiological saline solution for 7
consecutive days. Rats in the gentamicin group were injected i.p.
with gentamicin for 7 consecutive days (KRKA D.D. Novo mesto,
Slovenia, 60 mg/kg/day). The volume of physiological saline volume
was equivalent to the volume of the gentamicin solution. For the
collection of urine, rats were placed in metabolic cages (with
ad libitum access to tap water) for 24 h: 2 rats from each
group between day 8 and 9, and also 2 rats from each group between
day 9 and 10. Blood was collected 24 h after the last injection, by
retro-orbital puncture. Animals were sacrificed by cervical
dislocation. The blood was left undisturbed to coagulate for 1 h at
4˚C, then it was centrifuged at 1,730 x g for 15 min to obtain the
serum. The serum was stored at -20˚C until further analysis.
Biochemical analysis
Serum concentrations of urea and creatinine were
measured in order to determine renal function. The quantitative
determination of urea (serum, urine) was made based on the
principle of enzymatically hydrolyzation of urea into ammonia and
carbon dioxide. Ammonia ions further react with α-ketoglutarate and
glutamate dehydrogenase (GLDH) with simultaneous oxidation of NADH
to NAD+. The urea concentration in the sample was
proportional to the decrease in concentration of NADH. The working
reagent (WR) consisted of R1 buffer (Tris pH 7.8, α-ketoglutarate,
urease) mixed with R2 enzymes (GLDH, NADH), 4:1 (Urea-LQ,
Spinreact). The absorbance was read at 340 nm at 30 sec and 90 sec
after mixing the working reagent with the sample, at room
temperature. To determine the urinary urea (urine/24 h), we used a
1:50 dilution with distilled water and followed the same steps as
previously described (12,13).
The quantitative determination of creatinine in
serum and urine was determined utilizing an assay based on a
reaction described by Jaffé in which creatinine reacts with sodium
picrate, forming a red complex. The intensity of the color is
proportional to the concentration of creatinine in the sample. The
working reagent consisted of R1 picric acid and R2 sodium
hydroxide, 1:1 (Creatinine-J, Spinreact). The reading was carried
out at 492 nm, at 30 sec after the sample addition and again after
90 sec (at room temperature). To determine the urinary
concentration of creatinine, the sample (urine/24 h) was diluted
with distilled water, 1:50, followed by the steps as described
previously (14,15).
OS analysis
Malondialdehyde (MDA), 3-nitrotyrosine (3-NT),
interferon-γ (IFN-γ), nitric oxide (NO) and total oxidative stress
(TOS) were measured to determine the level of OS.
The peroxidation of lipids was determined by
reactive substances with thiobarbituric-reactive substances
(TBARs), using an adapted procedure reported by Pasha and
Sadasivadu (16). Thus, 0.1 ml of
serum was mixed with 0.1 ml 40% TCO, which was further mixed with
0.2 ml 0.67% TBA. The mix was placed in a boiling water bath for 30
min, after which it was cooled in an ice water bath. After cooling,
the mix was centrifuged for 5 min at 3,461 g. Finally, 0.1 ml of
the supernatant was removed and subjected to reading at 530 nm.
TBAR values are expressed as MDA nmol/l.
3-NT was determined using the 3-NT ELISA Kit
(Elabscience®). An amount 50 µl of the sample was added
to each well, together with 50 µl of biotinylated detection Ab
working solution, followed by incubation for 45 min at 37˚C.
Afterwards, the plate was aspirated and washed for 3 times. HRP
conjugate working solution (100 µl) was then added, followed by
incubation for 30 min at 37˚C. The plate was then aspirated and
washed 5 times. Substrate reagent (90 µl) was then added, followed
by another incubation of 15 min at 37˚C. Finally, 50 µl of stop
solution was then added. The plate was immediately read at 450
nm.
Serum concentration of IFN-γ was measured using an
ELISA Kit (Elabscience®). Serum (100 µl) was added to
the wells, and then incubated for 90 min at 37˚C. The liquid was
discarded, followed immediately by the addition of 100 µl
biotinylated detection Ab working solution to each well. Afterwards
the plate was incubated for 60 min at 37˚C. The plate was aspirated
and washed 3 times. HRP conjugate working solution (100 µl) was
then added, followed by incubation for 30 min at 37˚C. The plate
was then aspirated and washed 5 times. Substrate reagent (90 µl)
was then added, followed by another incubation of 15 min at 37˚C.
Finally, 50 µl of stop solution was then added. The plate was
immediately read at 450 nm.
The serum concentration of NO was measured by a
standard nitrate reduction and detection by the
VCl3/Griess assay (17).
A nitrate standard solution (100 µl) was diluted from 200 to 1.6
µM, in duplicate, in a polystyrene microtiter plate with 96
flat-bottomed wells. The medium used for dilution was used as the
standard blank. The 96-well plate was loaded with 100 µl samples,
then VCl3 was added to each well. Immediately after,
Griess reagents, SULF (50 µl) and NEDD (50 µl) were added. To
obtain sample blank values, the diluting medium was substituted for
Griess reagent. After 30 min of incubation at room temperature
using 5% H3PO4 (300 µl total volume), the
absorbance at 540 nm was measured. Results are expressed in
µmol/l.
For the measurement of TOS, an assay calibrated with
hydrogen peroxide was used, with results expressed in terms of
micromolar hydrogen peroxide equivalent per liter (µmol
H2O2 Eq/l) (18). The preparation of R1 consisted in
dissolving 114 mg of xylenol orange and 8.18 g of NaCl in 900 ml of
H2SO4 solution, 25 mM. Glycerol was then
added to the solution, 100 ml. The reagent had a pH value of 1.75.
For R2 1.96 g of ferrous ammonium sulfate and 3.17 g of
o-dianisidine dihydrochloride were dissolved in 1,000 ml of
H2SO4 solution, 25 mM. R1 (225 µl) was added
to 35 µl of serum. Then, 11 µl of R2 was then added. The
measurement was made at a 560 nm wavelength. The first absorbance
was taken before the mixing of R1 and R2 (sample blank). The last
absorbance was taken after the reaction trace drew a plateau line
(3-4 min after mixing).
For the measurement of the serum levels of protein
thiol groups (-SH) we used Ellman's reagent (19). Serum (50 µl) was mixed with 1 ml
Tris (0.25M)-EDTA (20 mM), pH 8.2. Afterwards, 20 µl of DTNB (10
mM) was added. After 15 min of incubation at room temperature, the
measurement was made at 412 nm. Results are expressed in
µmol/l.
Antioxidant status analysis
The serum levels of interleukin-10 (IL-10) and total
antioxidant capacity (TAC) were measured in order to evaluate the
antioxidant capacity.
Serum IL-10 was determined using an ELISA Kit
(Elabscience®). Serum 100 µl was added to the wells and
incubated at 37˚C for 90 min. The liquid was then discarded, and
then 100 µl of biotinylated detection Ab working solution was added
to each well, followed by 60 min of incubation at 37˚C. The plate
was then aspirated and washed for 3 times. HRP conjugate working
solution (100 µl) was then added to each well, followed by another
incubation at 37˚C for 30 min. The plate was aspirated and washed
for 5 times. Substrate reagent was added, 90 µl, followed by
incubation (15 min, 37˚C), and then by stop solution, 50 µl. The
plate was immediately read at 450 nm.
Serum TAC was measured using an automated
measurement method, developed by Erel (20). R1 consisted of o-dianisidine
(10 mM) and ferrous ammonium sulfate (45 µM) that were added in
KCl/HCl solution (75 mM, pH 1.8). R2 consisted of
H2O2 (7.5 mM). Serum (5 µl) was mixed with
200 µl of R1 and 10 µl of R2. The measurement was made at 444 nm.
The first absorbance was taken before the mixing of R1 and R2
(sample blank). The last absorbance was taken at 3-4 min after the
mixing with the serum. The results are expressed in mmol Trolox
equivalent/l.
Statistical analysis
All results are presented as means ± standard error
of the mean value. Student's paired t-test was used for the
analysis of experimental data with a Gaussian distribution. Data
with non-Gaussian distribution were compared using the unpaired
t-test. P-values <0.05 were considered statistically
significant. Statistical analyses were performed using Excel and QI
Macros package Windows® 2020.
Results
The survival rate of the rats was 100% during the
experimental procedures. The characteristics of our study groups
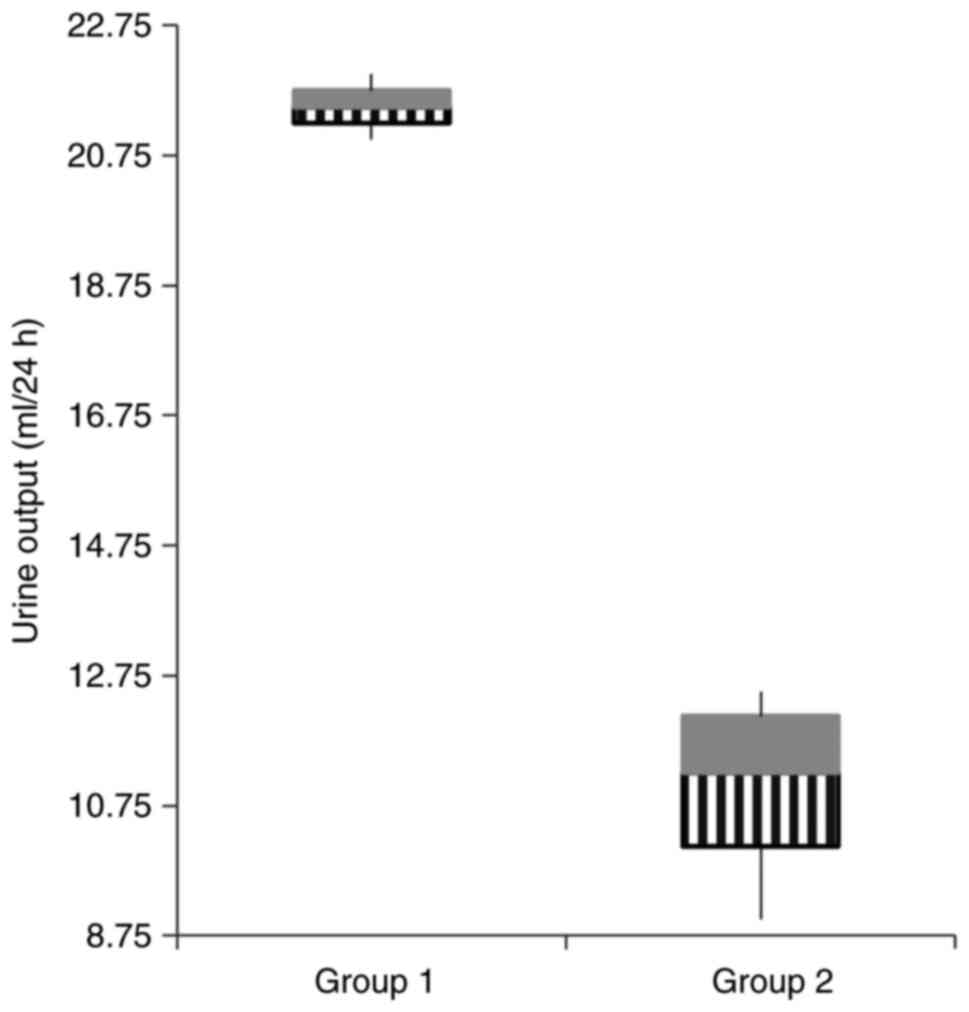
are summarized in Table I. As
Table I shows, there was no
statistical difference between the two groups concerning body
weight before and after the injection period, but a significant
difference was observed in the 24 h urine output between the two
groups (Fig. 1, P=0.001).
 | Table ICharacteristics of the control group
(group 1, physiological saline) and the study group (group 2,
gentamicin). |
Table I
Characteristics of the control group
(group 1, physiological saline) and the study group (group 2,
gentamicin).
|
Characteristics | Group 1 (n=7)
Control group | Group 2 (n=7)
Gentamicin group | P-value |
|---|
| Initial body weight
(g) | 383.57±44.86 | 416.57±64.47 | NS |
| Final body weight
(g) | 388.57±47.60 | 392.42±66.76 | NS |
| Urine volume (ml/24
h) |
21.5±0.70a |
11±1.58b | 0.001 |
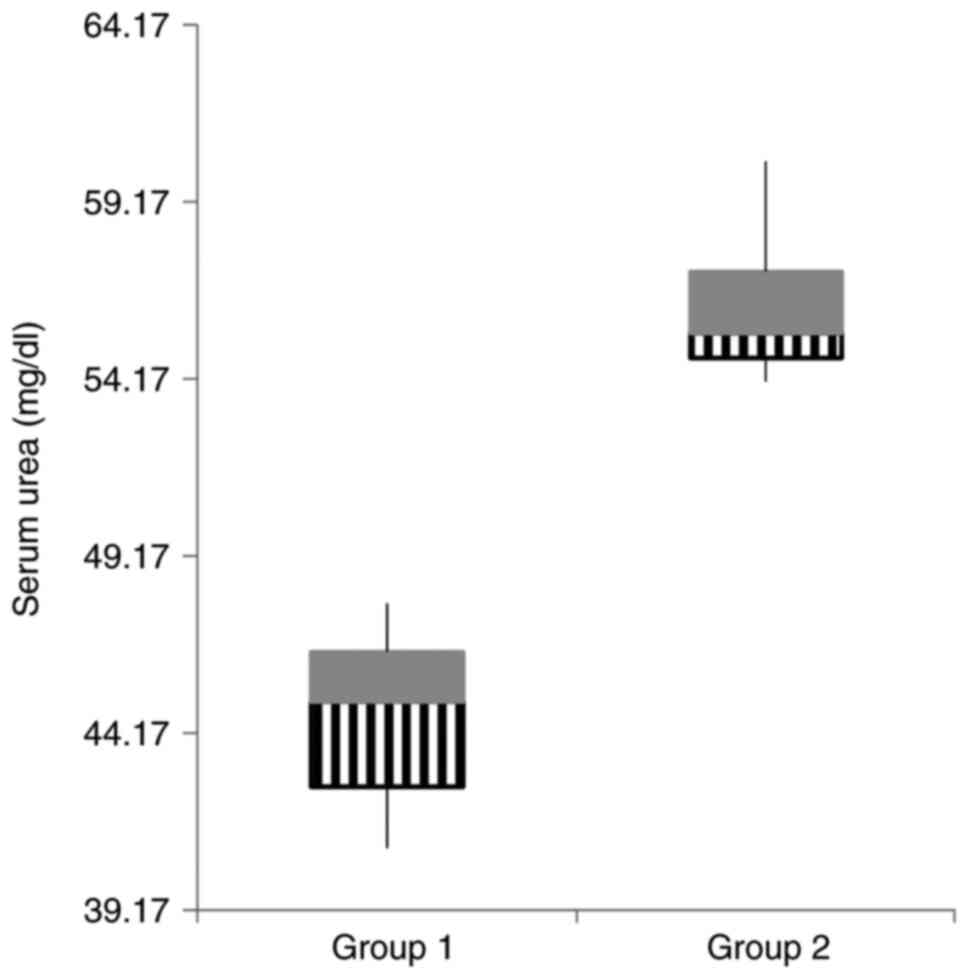
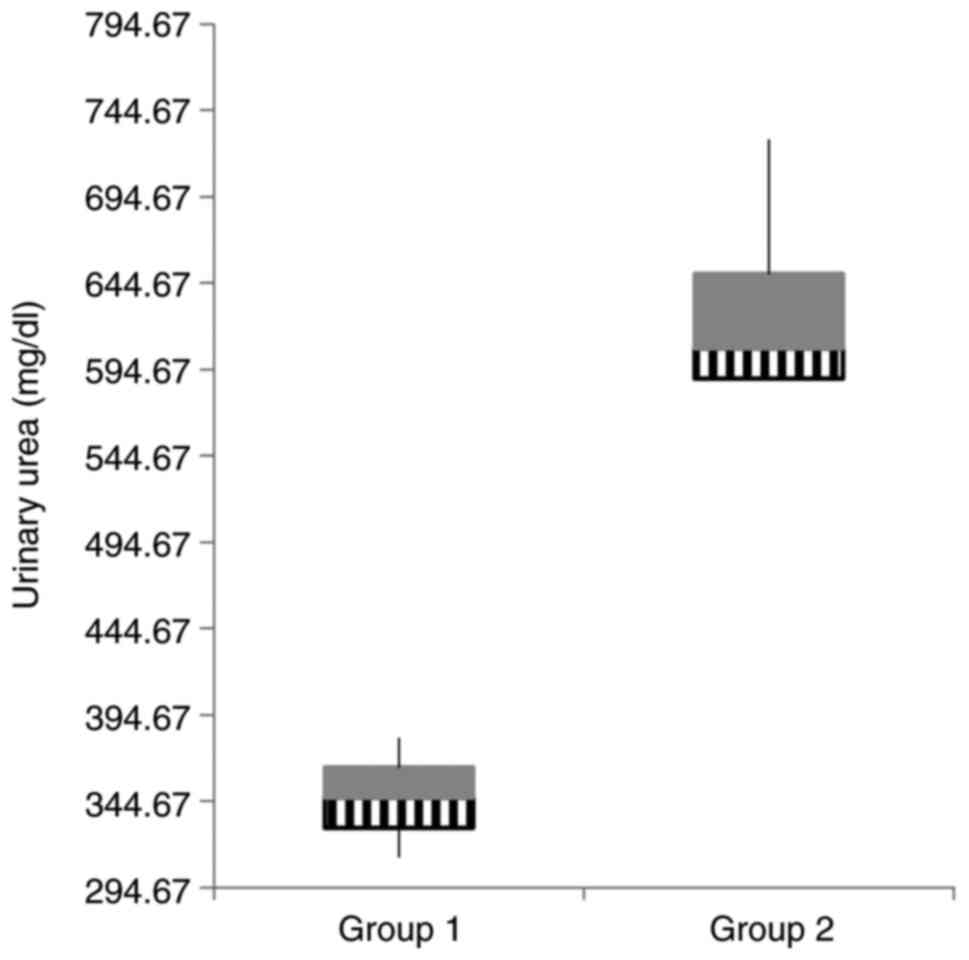
There were significant differences between the two
groups concerning the renal function parameters. The gentamicin
group presented markedly elevated urea values in both blood and
urine compared to the values of creatinine (Table II, Figs. 2 and 3).
| Table IIRenal function parameters (serum and
urinary) in the study groups. |
Table II
Renal function parameters (serum and
urinary) in the study groups.
| Parameters | Group 1 (n=7)
Control group | Group 2 (n=7)
Gentamicin group | P-value |
|---|
| Serum urea
(mg/dl) | 44.57±6.84 | 56.25±5.67 |
<0.0001 |
| Serum creatinine
(mg/dl) | 0.77±0.001 | 0.88±0.01 | 0.020 |
| Urinary urea
(mg/dl) |
346.66±2,403.55 |
632.66±4,306.37 | 0.013 |
| Urinary creatinine
(mg/dl) | 35.01±2.47 | 47.09±130.19 | NS |
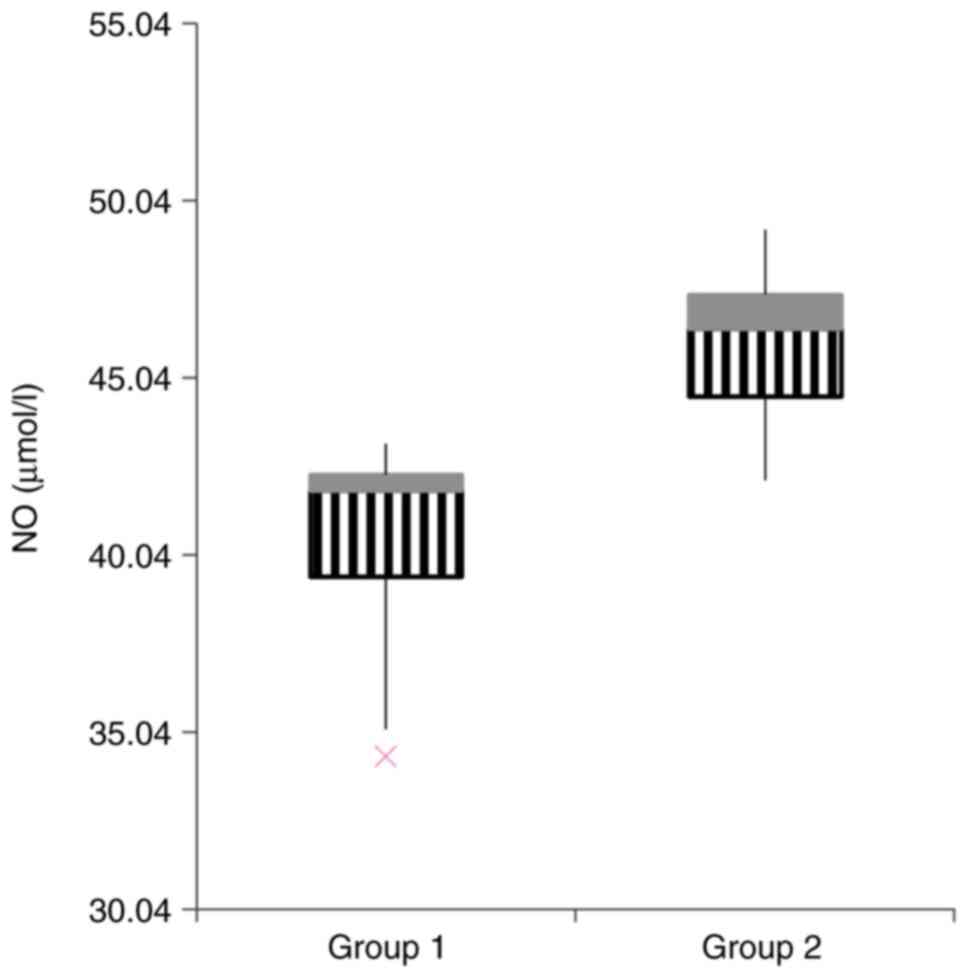
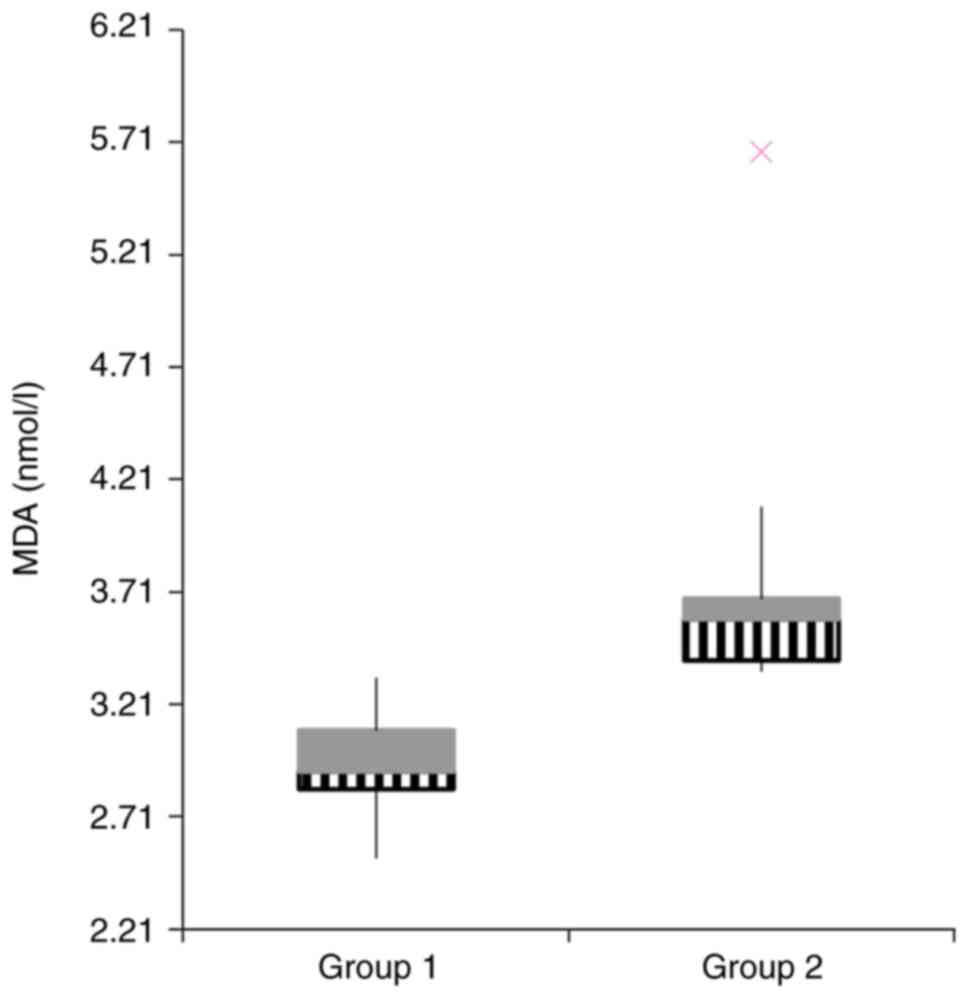
OS parameters and antioxidant status were assessed
in the two study groups and are summarized in Table III. Concerning the OS parameters,
we observed a significant difference between the two groups for NO
(Fig. 4), MDA (Fig. 5), but no statistical difference was
obtained for 3-NT, thiols (TS) and IFN-γ.
| Table IIIOxidative stress parameters and
antioxidant status in the study groups. |
Table III
Oxidative stress parameters and
antioxidant status in the study groups.
| Parameters | Group 1 (n=7)
Control group | Group 2 (n=7)
Gentamicin group | P-value |
|---|
| 3-NT (ng/ml) | 19.53±32.67 | 28.87±701.46 | NS |
| NO (µmol/l) | 40.40±9.30 | 45.94±5.93 | 0.01 |
| MDA (nmol/l) | 2.94±0.068 | 3.82±0.67 | 0.01 |
| Thiols
(µmol/l) | 394.14±3334.47 | 322.42±267.61 | NS |
| IFN-γ (pg/ml) | 24.27±45.71 | 19.97±8.30 | NS |
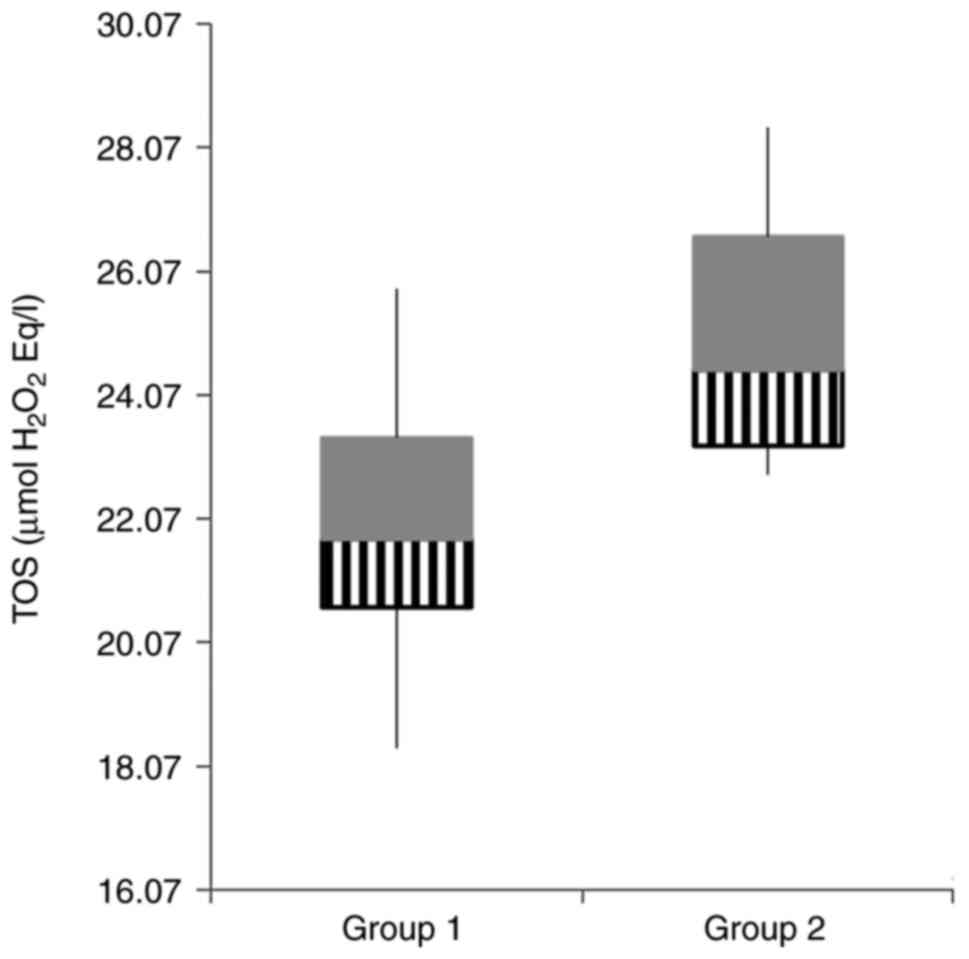
| TOS (µmol
H2O2 Eq/l) | 21.98±5.91 | 25.05±5.04 | 0.03 |
| IL-10 (pg/ml) | 15.81±16.12 | 13.57±0.44 | NS |
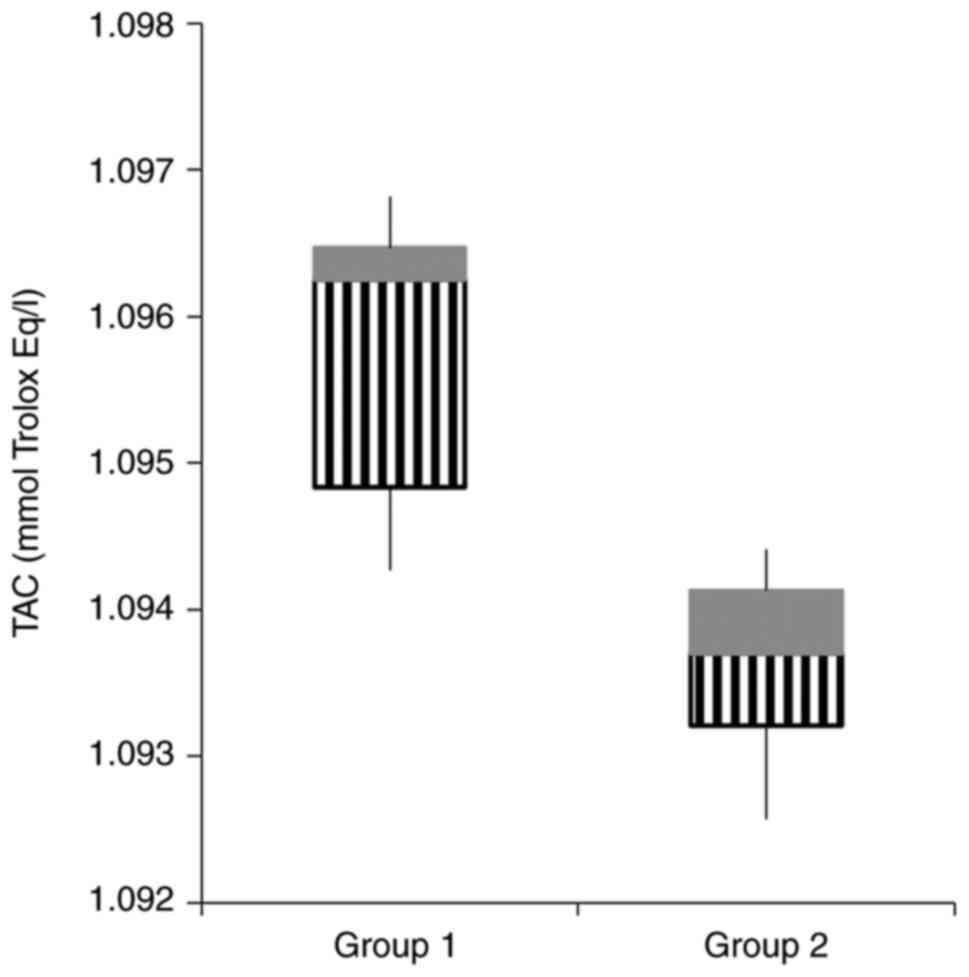
| TAC (mmol Trolox
Eq/l) | 1.09±1.04 | 1.09±4.81 | 0.001 |
| OSI (TOS/TAC) | 20.05±4.91 | 22.90±4.20 | 0.014 |
In the gentamicin group TOS was found to be
significantly higher compared to the control group (Fig. 6, P=0.03).
The antioxidant status was evaluated using IL-10 and
TAC, with TAC being statistically higher in the control group
(Fig. 7). Oxidative stress index
(OSI) was significantly higher in the gentamicin group compared to
the control group (P=0.014).
Discussion
In the present study, we were able to induce a mild
form of renal function impairment by injecting gentamicin (60
mg/kg/day, i.p.) for 7 consecutive days, as shown by the reduced
urine output in the gentamicin group, correlated with increased
serum values of both urea and creatinine. In addition, even though
it was not statistically significant, a decrease in the weight of
the rats in the gentamicin group was observed. These findings are
in line with previous studies conducted on rats with kidney injury
induced by gentamicin (21-23).
However, due to the fact that our animals received a smaller dose
of gentamicin compared to the rats in the previously mentioned
studies who received 100 mg/kg/day, the creatinine level was
increased only 1.14-fold compared to the control group, showing
that our animals did not achieve stage I AKI (a 1.5-fold increase
was needed). However, our results showed a greater increase in the
urea values compared to the values of creatinine, both in serum
(1.26-fold vs. 1.14-fold) and in urine (1.82-fold vs.
1.34-fold). Increased serum levels of urea might also be due to
dehydration, heart failure, gastrointestinal bleeding, high-protein
diet or catabolic state, but in our case these criteria were not
met, since the only difference between our groups was the
administration of gentamicin (24).
Therefore, in our study, the differences in the urea values were
due to an impairment in renal function, secondary to the
nephrotoxic effect of gentamicin. Our result confirmed that urea
reaches higher concentrations faster than creatinine. The
accumulation of these end products in the blood demonstrated that
gentamicin exerted a nephrotoxic effect on our rats, with mild
renal function impairment, consistent with a pre-AKI stage.
With regard to TOS, it proved to be higher in the
gentamicin group compared to the control group, which was corelates
with an OSI which was also higher in the same group. Furthermore,
we were able to identify two OS markers that were significantly
higher in the group receiving gentamicin: NO and MDA.
NO production takes place in reaction to an
inflammatory stimulus and can be triggered by increased levels of
IFN-γ, tumor necrosis factor (TNF)-α, and IL-1β (25). Larger levels of NO produce
NO-derived reactive species that can further nitrosate TS. Previous
studies have shown that NO represents a marker of OS that is
upregulated in AKI (26-29).
Pathak and Mayeux used an animal model of sepsis-induced kidney
injury and showed that the generation of NO significantly increased
compared to the control group (26). In accordance with these results, in
our case, NO reached significantly higher serum levels after
gentamicin administration compared to the control group, in spite
of the rats in this group not having fully achieved stage I of AKI.
This confirms that NO may play a crucial role in the early
diagnosis of kidney damage or it may be used as a marker of
nephrotoxicity.
MDA has been accepted as a reliable marker of OS, as
it represents one of the lipid peroxidation products (30). In our study, MDA was 1.29-fold
higher in rats with exposure to gentamicin compared to the control.
In comparison, Su et al confirmed that Panx1-knockout
mice had decreased MDA levels in kidney tissues when subjected to
ischemic AKI compared to wild-type mice, which further demonstrates
that MDA plays a pathogenetic role in AKI (31). Awodele et al conducted a
study demonstrating that MDA is significantly increased in rats
receiving gentamicin compared to the controls. They concluded that
the mechanism of toxicity caused by gentamicin was via OS and
subsequent lipid peroxidation (32). Lipid peroxidation was also
demonstrated in an animal model of kidney injury induced by
cisplatin (33). Kovalčíková et
al showed that AKI leads to increased systemic OS, but they
also demonstrated increased lipid oxidation markers in the frontal
cortex that may explain uremic encephalopathy (34). These data show that lipid
peroxidation is consistent in kidney damage, and MDA can be used as
a marker in AKI.
However, 3-NT, TS and IFN-γ were confirmed to have
similar concentrations in the serum of the two groups. In contrast,
there are experimental and clinical studies that show a higher
concentration of these markers in subjects with AKI compared to the
control. One study included 158 patients with AKI and found that
3-NT was significantly higher in those subjects compared to healthy
controls and to critically ill subjects without AKI (P<0.001),
concluding that 3-NT levels are associated with mortality of
patients with AKI, independent of the gravity of the disease
(35). TS were also previously
associated with AKI, as Boekhoud et al confirmed in their
study conducted on 301 critically ill patients (36). Burks et al extensively
investigated the effects of pulsed focused ultrasound (pFUS) on
mesenchymal stem cells (MSCs) in mice with cisplatin-induced AKI.
They demonstrated that following the infusion of cisplatin and
subsequent AKI, pFUS was able to upregulate renal IFN-γ which
further stimulated MSCs that were subsequently infused to
upregulate IL-10 and therefore to promote healing (37). Even though IFN-γ represents an OS
marker, they showed that the IFN-γ/IL-10 cytokine axis plays an
essential role in the outcome of AKI (38).
In the present study, IL-10 had similar
concentrations in the serums of the two groups. In contrast, IL-10
proved to reduce injury in several models of AKI (39-44).
Our results may be due to the fact that our rats did not achieve
stage I of AKI. It is to be mentioned that IL-10 was 1.16-fold
higher in the control group compared to gentamicin group, with a
P-value of 0.09.
TAC was significantly higher in the control group
compared to the pre-AKI group, which further demonstrates that the
nephrotoxic effect of gentamicin impairs the oxidant-antioxidant
balance, in favour of OS.
One limitation of our study is represented by the
fact that we could not verify the renal parameters of the
gentamicin group before injecting the nephrotoxic drug. In
addition, another limitation is given by the fact that we were not
able to collect urine from all of our animals due to a limited
number of metabolic cages available; therefore, we could not
calculate the precise glomerular filtration rate of the
animals.
In conclusion, our study demonstrated that the
oxidant-antioxidant balance is impaired in favour of OS in renal
damage induced by gentamicin, a nephrotoxic drug. In addition, it
provides strong evidence that lipid peroxidation plays a crucial
role in gentamicin nephrotoxicity. Moreover, MDA and NO may be used
as markers of early kidney damage when changes in serum creatinine
are not yet fully relevant. The novelty brought by this study is
represented by the fact that our animals suffered only mild renal
impairment, in contrast with other experimental studies where the
animals achieved different stages of AKI. Even so, we were able to
pinpoint certain OS markers that were significantly modified in the
gentamicin group compared to the control group. More studies are
needed in order to validate these markers in other types of AKI
(ischemic, sepsis-induced).
Acknowledgements
We would like to acknowledge Mr. Mirel Molnar
(Department of Pathophysiology) for his essential work as a
laboratory technician.
Funding
Funding: Anamaria Magdalena Tomşa is the recipient of an
internal grant from ‘Iuliu Hatieganu’ University of Medicine and
Pharmacy, Cluj-Napoca, Romania. This study was funded by this
grant.
Availability of data and materials
All data analyzed during this study are included in
this published article.
Authors' contributions
AMT, ALR, LMJ and AEP conceived the experimental
protocol. AMT performed the in vivo experiment. SLP, AB and
AU performed the measurements. AMT and ALR analyzed the data and
prepared the manuscript. LMJ and AEP performed the critical
revision of the manuscript. All authors read and approved the
manuscript and agree to be accountable for all aspects of the
research in ensuring that the accuracy or integrity of any part of
the work are appropriately investigated and resolved.
Ethics approval and consent to
participate
This study was approved by the Ethics Committee of
the ‘Iuliu Hatieganu’ University of Medicine and Pharmacy,
Cluj-Napoca, Romania (authorization no. 193/18.05.2020). This study
was also approved by The National Sanitary Veterinary and Food
Safety Authority (authorization no. 225/22.06.2020). This study was
carried out according to relevant national legislation.
Patient consent for publication
Not applicable.
Competing interests
The authors state that they have no competing
interests.
References
|
1
|
Susantitaphong P, Cruz DN, Cerda J,
Abulfaraj M, Alqahtani F, Koulouridis I and Jaber BL: Acute Kidney
Injury Advisory Group of the American Society of Nephrology. World
incidence of AKI: A meta-analysis. Clin J Am Soc Nephrol.
8:1482–1493. 2013.PubMed/NCBI View Article : Google Scholar
|
|
2
|
Bellomo R, Kellum JA and Ronco C: Acute
kidney injury. Lancet. 380:756–766. 2012.PubMed/NCBI View Article : Google Scholar
|
|
3
|
Singh A, Kukreti R, Saso L and Kukreti S:
Oxidative stress: A key modulator in neurodegenerative diseases.
Molecules. 24(1583)2019.PubMed/NCBI View Article : Google Scholar
|
|
4
|
Himmelfarb J, McMonagle E, Freedman S,
Klenzak J, McMenamin E, Le P, Pupim LB and Ikizler TA: The PICARD
Group. Oxidative stress is increased in critically ill patients
with acute renal failure. J Am Soc Nephrol. 15:2449–2456.
2004.PubMed/NCBI View Article : Google Scholar
|
|
5
|
Ratliff BB, Abdulmahdi W, Pawar R and
Wolin MS: Oxidant mechanisms in renal injury and disease. Antioxid
Redox Signal. 25:119–146. 2016.PubMed/NCBI View Article : Google Scholar
|
|
6
|
Schieber M and Chandel NS: ROS function in
redox signaling and oxidative stress. Current Biology.
24:R453–R462. 2014.PubMed/NCBI View Article : Google Scholar
|
|
7
|
Sureshbabu A, Ryter SW and Choi ME:
Oxidative stress and autophagy: Crucial modulators of kidney
injury. Redox Biol. 4:208–214. 2015.PubMed/NCBI View Article : Google Scholar
|
|
8
|
Hall AM, Rhodes GJ, Sandoval RM, Corridon
PR and Molitoris BA: In vivo multiphoton imaging of mitochondrial
structure and function during acute kidney injury. Kidney Int.
83:72–83. 2013.PubMed/NCBI View Article : Google Scholar
|
|
9
|
Tanaka S, Tanaka T, Kawakami T, Takano H,
Sugahara M, Saito H, Higashijima Y, Yamaguchi J, Inagi R and
Nangaku M: Vascular adhesion protein-1 enhances neutrophil
infiltration by generation of hydrogen peroxide in renal
ischemia/reperfusion injury. Kidney International. 92:154–164.
2017.PubMed/NCBI View Article : Google Scholar
|
|
10
|
Tracz MJ, Juncos JP, Croatt AJ, Ackerman
AW, Grande JP, Knutson KL, Kane GC, Terzic A, Griffin MD and Nath
KA: Deficiency of heme oxygenase-1 impairs renal hemodynamics and
exaggerates systemic inflammatory responses to renal ischemia.
Kidney Int. 72:1073–1080. 2007.PubMed/NCBI View Article : Google Scholar
|
|
11
|
Dennis JM and Witting PK: Protective role
for antioxidants in acute kidney disease. Nutrients.
9(718)2017.PubMed/NCBI View Article : Google Scholar
|
|
12
|
Kaplan A: Urea. In: Clinical Chemistry. CV
Mosby Co., St. Louis. Princeton, Toronto, pp1257-1260 and 437 and
418, 1984.
|
|
13
|
Burtis AC and Ashwood ER: Tietz Textbook
of Clinical Chemistry. 3rd edition. Saunders, Philadelphia, PA,
1999.
|
|
14
|
Murray RL: Creatinine. In: Clinical
Chemistry. CV Mosby Co., St. Louis. Princeton, Toronto, pp1261-1266
and 418, 1984.
|
|
15
|
Young DS: Effects of disease on Clinical
Lab Tests. 4th edition. AACC, Washington, DC, 2001.
|
|
16
|
Pasha KV and Sadasivudu B: Intracellular
content of thiol compounds, thiobarbituric acid reactive substances
and gamma-glutamyl transpeptidase in rat brain during anoxia.
Neurosci Lett. 46:209–214. 1984.PubMed/NCBI View Article : Google Scholar
|
|
17
|
Miranda MK, Espey GM and Wink AD: A rapid,
simple spectrophotometric method for simultaneous detection of
nitrate and nitrite. Nitric Oxide. 5:62–71. 2001.PubMed/NCBI View Article : Google Scholar
|
|
18
|
Erel O: A new automated colorimetric
method for measuring total oxidant status. Clin Biochem.
38:1103–1111. 2005.PubMed/NCBI View Article : Google Scholar
|
|
19
|
Hu ML: Measurement of protein thiol groups
and glutathione in plasma. Methods Enzymol. 233:380–384.
1994.PubMed/NCBI View Article : Google Scholar
|
|
20
|
Erel O: A novel automated direct
measurement method for total antioxidant capacity using a new
generation, more stable ABTS radical cation. Clin Biochem.
37:277–285. 2004.PubMed/NCBI View Article : Google Scholar
|
|
21
|
Erdem A, Gündoğan NU, Usubütün A, Kilinç
K, Erdem SR, Kara A and Bozkurt A: The protective effect of taurine
against gentamicin-induced acute tubular necrosis in rats. Nephrol
Dial Transplant. 15:1175–1182. 2000.PubMed/NCBI View Article : Google Scholar
|
|
22
|
Medić B, Stojanović M, Rovčanin B, Kekić
D, Škodrić SR, Jovanović GB, Vujović KS, Divac N, Stojanović R,
Radenković M, et al: Pioglitazone attenuates kidney injury in an
experimental model of gentamicin-induced nephrotoxicity in rats.
Sci Rep Sep. 9(13689)2019.PubMed/NCBI View Article : Google Scholar
|
|
23
|
Sodimbaku V, Pujari L, Mullangi R and
Marri S: Carrot (Daucus carota L.): Nephroprotective against
gentamicin-induced nephrotoxicity in rats. Indian J Pharmacol.
48:122–127. 2016.PubMed/NCBI View Article : Google Scholar
|
|
24
|
Weiner ID, Mitch WE and Sands JM: Urea and
ammonia metabolism and the control of renal nitrogen excretion.
Clin J Am Soc Nephrol. 10:1444–1458. 2015.PubMed/NCBI View Article : Google Scholar
|
|
25
|
McSorley SJ and Liew FY: Nitric oxide. In:
Encyclopedia of Immunology. 2nd edition. Elsevier, Berkeley, CA,
pp1859-1861, 1998.
|
|
26
|
Pathak E and Mayeux PR: In vitro model of
sepsis-induced renal epithelial reactive nitrogen species
generation. Toxicol Sci. 115:475–481. 2010.PubMed/NCBI View Article : Google Scholar
|
|
27
|
Pathak E, MacMillan-Crow LA and Mayeux PR:
Role of mitochondrial oxidants in an in vitro model of
sepsis-induced renal injury. J Pharmacol Exp Ther. 340:192–201.
2012.PubMed/NCBI View Article : Google Scholar
|
|
28
|
Tomsa AM, Alexa AL, Junie ML, Rachisan AL
and Ciumarnean L: Oxidative stress as a potential target in acute
kidney injury. PeerJ. 7(e8046)2019.PubMed/NCBI View Article : Google Scholar
|
|
29
|
Ling H, Edelstein C, Gengaro P, Meng X,
Lucia S, Knotek M, Wangsiripaisan A, Shi Y and Schrier R:
Attenuation of renal ischemia-reperfusion injury in inducible
nitric oxide synthase knockout mice. Am J Physiol. 277:F383–F390.
1999.PubMed/NCBI View Article : Google Scholar
|
|
30
|
Mitev D, Gradeva H, Stoyanova Z, Petrova
N, Dimov D, Iliev V, Koychev A, Prakova G and Vlaykova T:
Evaluation of thiol compounds and lipid peroxidative products in
plasma of patients with COPD. Trakia J Sci. 8:306–314. 2010.
|
|
31
|
Su L, Jiang X, Yang C, Zhang J, Chen B, Li
Y, Yao S, Xie Q, Gomez H, Murugan R and Peng Z: Pannexin 1 mediates
ferroptosis that contributes to renal ischemia/reperfusion injury.
J Biol Chem. 294:19395–19404. 2019.PubMed/NCBI View Article : Google Scholar
|
|
32
|
Awodele O, Tomoye OP, Quashie NB, Amagon
KI and Ogunnowo SA: Gentamicin nephrotoxicity: Animal experimental
correlate with human pharmacovigilance outcome. Biomed J.
38:125–130. 2015.PubMed/NCBI View Article : Google Scholar
|
|
33
|
Mata-Miranda MM, Bernal-Barquero CE,
Martinez-Cuazitl A, Guerrero-Robles CI, Sanchez-Monroy V,
Rojas-Lopez M and Vazquez-Zapien GJ: Nephroprotective effect of
embryonic stem cells reducing lipid peroxidation in kidney injury
induced by cisplatin. Oxid Med Cell Longev.
2019(5420624)2019.PubMed/NCBI View Article : Google Scholar
|
|
34
|
Kovalčíková A, Gyurászová M,
Vavrincová-Yaghi D, Vavrinec P, Tóthová Ľ, Boor P, Šebeková K and
Celec P: Oxidative stress in the brain caused by acute kidney
injury. Metab Brain Dis. 33:961–967. 2018.PubMed/NCBI View Article : Google Scholar
|
|
35
|
Qian J, You H, Zhu Q, Ma S, Zhou Y, Zheng
Y, Liu J, Kuang D, Gu Y, Hao C and Ding F: Nitrotyrosine level was
associated with mortality in patients with acute kidney injury.
PLoS One. 8(e79962)2013.PubMed/NCBI View Article : Google Scholar
|
|
36
|
Boekhoud L, Koeze J, van der Slikke EC,
Bourgonje AR, Moser J, Zijlstra JG, Muller Kobold AC, Bulthuis MLC,
van Meurs M, van Goor H and Bouma HR: Acute kidney injury is
associated with lowered plasma-free thiol levels. Antioxidants
(Basel). 9(1135)2020.PubMed/NCBI View Article : Google Scholar
|
|
37
|
Burks SR, Nagle ME, Bresler MN, Kim SJ,
Star RA and Frank JA: Mesenchymal stromal cell potency to treat
acute kidney injury increased by ultrasound-activated
interferon-γ/interleukin-10 axis. J Cell Mol Med. 22:6015–6025.
2018.PubMed/NCBI View Article : Google Scholar
|
|
38
|
Hubackova S, Kucerova A, Michlits G,
Kyjacova L, Reinis M, Korolov O, Bartek J and Hodny Z: IFNγ induces
oxidative stress, DNA damage and tumor cell senescence via
TGFβ/SMAD signaling-dependent induction of Nox4 and suppression of
ANT2. Oncogene. 35:1236–1249. 2016.PubMed/NCBI View Article : Google Scholar
|
|
39
|
Deng J, Kohda Y, Chiao H, Wang Y, Hu X,
Hewitt SM, Miyaji T, McLeroy P, Nibhanupudy B, Li S and Star RA:
Interleukin-10 inhibits ischemic and cisplatin-induced acute renal
injury. Kidney Int. 60:2118–2128. 2001.PubMed/NCBI View Article : Google Scholar
|
|
40
|
Jung M, Sola A, Hughes J, Kluth DC,
Vinuesa E, Viñas JL, Pérez-Ladaga A and Hotter G: Infusion of
IL-10-expressing cells protects against renal ischemia through
induction of lipocalin-2. Kidney Int. 81:969–982. 2012.PubMed/NCBI View Article : Google Scholar
|
|
41
|
Wise AF, Williams TM, Kiewiet MB, Payne
NL, Siatskas C, Samuel CS and Ricardo SD: Human mesenchymal stem
cells alter macrophage phenotype and promote regeneration via
homing to the kidney following ischemia-reperfusion injury. Am J
Physiol Renal Physiol. 306:F1222–F1235. 2014.PubMed/NCBI View Article : Google Scholar
|
|
42
|
Tomşa AM, Picoş A, Picoş AM and Răchişan
AL: Mitochondrial nanotargeting in malignancies (Review). Exp Ther
Med. 20:3444–3451. 2020.PubMed/NCBI View Article : Google Scholar
|
|
43
|
Tomşa AM, Răchişan AL, Aldea AA and
Ciumărnean L: Perspectives of gold nanoparticles and their
applications in pancreatic cancer (Review). Exp Ther Med.
21(258)2021.PubMed/NCBI View Article : Google Scholar
|
|
44
|
Xia Y, Chen Y, Tang L, Wang Z and Zheng Y:
Pterostilbene attenuates acute kidney injury in septic mice. Exp
Ther Med. 15:3551–3555. 2018.PubMed/NCBI View Article : Google Scholar
|