Introduction
Drug-eluting stents (DES) have markedly decreased
the incidence and risk of in-stent restenosis (ISR) compared with
bare-metal stents, ISR rates after DES implantation have fallen
below 10% (1,2). However, ISR remains a challenging
problem for patients receiving DES implantation following
percutaneous coronary intervention (PCI), occurring in 3-20% of the
patient population (3). Since there
are very few treatment options, numerous studies have focused on
the mechanisms, prognosis, predictors and effective treatments of
ISR (4-6).
It has been revealed that image guidance, such as intra-vascular
ultrasound (IVUS) and optical coherence tomography, during stent
implantation may be an effective way of decreasing the incidence of
ISR; therefore, intracoronary imaging assessments should be
performed more frequently to determine the cause of lesions in ISR
(7).
Phenotypic modulation and proliferation of vascular
smooth muscle cells (VSMCs) are considered as two crucial pathways
underlying the pathological process of atherosclerosis (8). SMC transformations from systolic to
synthetic phenotypes are regulated by osteopontin (OPN), which
promotes the proliferation and migration of SMCs (9). The prevention of SMC migration and
proliferation is one of the main approaches to prevent the intimal
hyperplasia that causes ISR, which is also a key treatment goal in
using DES. Inhibiting mTOR complex 1 (mTORC1) using drugs within a
stent, such as sirolimus, has demonstrated marked effects in
blocking the development of atherosclerotic plaques; additionally,
statins and metformin indirectly inhibit mTORC1 via activating
AMP-activated protein kinase (AMPK), which slows the development
and progression of atherosclerosis (10). Furthermore, it has been previously
reported that the activation of AMPK suppresses VSMC proliferation
and migration (11,12). Additionally, AMPK downregulates the
activity of downstream acetyl-CoA carboxylase (ACC) via
phosphorylation, decreasing the synthesis of fatty acids and
increasing its oxidation (13).
Therefore, the activation of AMPK may serve as the key to inhibit
intimal hyperplasia resulting from SMC proliferation and
migration.
Adropin was first discovered in 2008 by Kumar et
al (14) in the liver and brain
of mice, and was considered to represent a novel metabolic protein
that modulates glucose and lipid metabolism. Recently, growing
evidence has suggested that adropin is a potential regulator of
cardiovascular functions and serves a protective role in the
development of cardiovascular diseases (15-17).
A systematic review indicated that adropin may be a potential serum
biomarker for the early diagnosis of heart disease (18). Additionally, it has been previously
reported that serum levels of adropin in patients with coronary
heart disease were negatively correlated with the Synergy between
PCI with Taxus and Cardiac Surgery (SYNTAX) score and the
homocysteine level (19). However,
the mechanism underlying the ability of adropin to inhibit
atherosclerosis is not well understood. Recently, Sato et al
(20) described how adropin
functioned to prevent atherosclerosis development via suppressing
the migration and proliferation of SMCs, which was achieved by
downregulating ERK1/2 and Bax, and by upregulating PI3K/Akt/Bcl2.
Currently, little is known about the role of adropin in the
migration and proliferation of SMCs in atherosclerosis (20). The present study investigated the
association between patients with neointimal hyperplasia and serum
adropin levels, and aimed to elucidate the underlying mechanisms of
adropin on the phenotypic modulation and proliferation of SMCs, as
induced by angiotensin II (Ang II), providing a novel strategy and
target for the prevention and treatment of ISR and
atherosclerosis.
Materials and methods
Patients
A total of 56 patients who had been followed up for
1 year after Zotarolimus-eluting stent implantation at The Second
Affiliated Hospital of Soochow University (Suzhou, China) were
recruited between April 2016 and March 2019. ISR was defined as
lumen stenosis ≥50% within the stent (1), as confirmed by coronary angiography.
In the present study, all recruited patients had objective and
obvious evidence of myocardial ischemia, as determined through
electrocardiography findings and typical symptom presentation,
including chest pain, sweating, and palpitations. Patients with
thrombotic lesions, complete occlusion and recurrent restenosis
were excluded from the present study. IVUS was performed according
to the degree of restenosis and the willingness of patients and
their families. Finally, a total of 56 (age, 58-85 years) patients
who were admitted to the hospital consecutively and who underwent
IVUS were enrolled in the study. Of these, 25 were defined as
having an ISR lesion. All patients provided written informed
consent. The present study was approved by the Ethics Committee of
The Second Affiliated Hospital of Soochow University.
Blood chemistry
Samples of 2 ml venous blood were collected after
overnight fasting. A commercial ELISA kit was used to detect the
serum adropin levels, according to the manufacturer's protocol
(cat. no. MM-0897R1, JRDUN Biotechnology Co., Ltd.). Serum lipid
profiles, including triglyceride, low-density lipoprotein
cholesterol and high-density lipoprotein cholesterol levels, were
assessed using automated enzymatic procedures (cat. no. 3500,
Hitachi, Ltd.).
Quantitative coronary angiography
(CAG), IVUS imaging protocol and analysis
CAG was performed following the intravenous
injection of heparin and intracoronary injection of sodium
nitroprusside. Quantitative CAG was determined via an analysis
system (Philips DSA Fd10; Philips Healthcare). The quantitative
analysis took place at the end-diastolic phase. An outer diameter
guiding catheter filled with iopamidol (a contrast agent) was
regarded as the reference standard to detect the reference vessel
diameter, minimal lumen diameter and lesion length, and to
calculate the diameter stenosis percentage. According to Mehran's
classification, patterns of ISR were classified as focal (≤10 mm in
length) or diffuse (>10 mm in length) lesions using CAG
(21).
Conventional IVUS results were acquired using a
Galaxy system (Boston Scientific Corporation) with a 40 MHz
mechanically rotating IVUS catheter (Boston Scientific
Corporation), with automated transducer pullback at 0.5 mm/s. The
image was acquired at a point that was ≥10 mm (proximally and
distally) from the stent. The conventional IVUS measurements were
performed according to the standards established by the American
College of Cardiology (22). The
transducer was operated between the proximal and distal 5-mm
reference segments to measure the parameters of the lumen, stent
and lesion. In-stent segments were analyzed at a 1-mm axial
interval. The cross-sectional area (CSA) of the lumen, the stent
CSA, and the neointimal CSA were assessed via two-dimensional
conventional IVUS. The neointimal CSA was equal to the stent CSA
minus the lumen CSA, which was calculated by the IVUS system. The
total volumes of the stent CSA, lumen CSA and neointimal CSA at a
1-mm axial interval constituted conventional three-dimensional IVUS
images; associated parameters included stent volume, lumen volume
and neointimal volume.
Rat aorta smooth muscle cells (RASMCs)
isolation and treatment
Six-week-old male Sprague Dawley (SD) rats (180-200
g) were obtained from the Shanghai SLAC Laboratory Animal Co., Ltd.
and housed at 25˚C under a 12-h light/dark cycle in a specific
pathogen-free environment, with free access to food and water.
After one week of adaptive feeding, a total of 10 SD rats were used
in the present study and were euthanized by intravenous injection
of a lethal dose of pentobarbital sodium (100 mg/kg). After the
rat's breathing and heartbeat stop, the rat thoracic aortas were
isolated and rinsed three times with PBS. The separated rat aorta
was cut into 2-3 mm2 small pieces and digested with
collagenase at 37˚C for 30 min. After centrifugation at 1,000 rpm
(1,000 x g, 4˚C) for 5 min, the supernatant was discarded, followed
by another cycle of PBS washing and centrifugation as
aforementioned. The supernatant was discarded, and 2 ml of DMEM
containing 10% FBS (both HyClone; Cytiva) was added to the aortic
tissue precipitate. After resuspension, the cells were cultured at
37˚C with 5% CO2. The cells between passages 6 and 12
were used in the present study. Primary cells extracted from rat
arteries contain impurities and a number of endothelial cells (ECs)
(23); therefore, primary smooth
muscle cells were not directly used in the present study. Previous
experience from performing similar techniques indicated that smooth
muscle cells have ideal purity and stability after the 6th passage.
Furthermore, more passages will cause cell senescence (24), resulting in unstable test results.
For example, Jojima et al (25) used SMCs of passages 6-12.
Additionally, mycoplasma infection was ruled out by inspecting
phase contrast microscopy images. RASMCs were identified via
immunocytochemistry (performed as described below in the
immunofluorescence assay section) using a monoclonal antibody
against α-smooth muscle actin (α-SMA; 1:500; cat. no. ab7817;
Abcam) to further confirm the purity of the primary cell culture
(Fig. S1).
All animal experiments were conducted according to
the National Institutes of Health Guidelines for for Care and Use
of Laboratory Animals in Biomedical Research (2010) (26). The present study was approved by the
Ethics Committee of the Second Affiliated Hospital of Soochow
University.
MTT assay
The MTT assay was used to identify the
IC50 of adropin, as well as to evaluate the
proliferation rate of RASMCs in different groups according to the
manufacturer's protocol (Sigma-Aldrich; Merck KGaA). Briefly, the
isolated cells were cultured to the logarithmic growth stage. The
cell concentration was adjusted to 3x10⁴ cells/ml and
cells were inoculated in 96-well culture plates with 100 µl cell
suspension per well, and cultured at 37˚C with 5% CO2
for 24 h. Subsequently, cells were treated with Ang II (500 ng/ml;
cat. no. ab120183; Abcam) and/or compound C (1 µmol/l; cat. no.
ab120843; Abcam) and/or different concentrations of adropin (0, 1,
10, 100 or 1,000 ng/ml; Phoenix Pharmaceuticals, Inc.) at 37˚C for
48 h. Treated cells were incubated with 15 µl MTT at 37˚C for 4 h.
Subsequently, the supernatant was discarded and 150 µl DMSO was
added. The absorbance was measured at 490 nm using a microplate
spectrophotometer (Thermo Fisher Scientific, Inc.).
Flow cytometry analysis
The cell cycle was analyzed via flow cytometry.
RASMCs with a concentration of 105 cells/ml were seeded
into 6-well culture plates (3 ml/well) and cultured at 37˚C with 5%
CO2 for 24 h. Following treatment with Ang II (500
ng/ml) and/or adropin (1,000 ng/ml) at 37˚C for 48 h, the cells
underwent 0.25% trypsinization at room temperature and were
centrifuged at 1,200 rpm (160 x g) at 4˚C for 3 min. The cells were
harvested and washed, then fixed in ice-cold 70% alcohol at 4˚C
overnight. Subsequently, the samples were incubated with 100 µg/ml
RNase A (cat. no. 19101; Qiagen) at room temperature for 30 min and
stained with 50 µg/ml PI (cat. no. K201; BioVision Inc.) at room
temperature for 30 min. The single-cell suspension (200 µl) was
analyzed using a FACS Calibur flow cytometer (BD Biosciences), and
the results were analyzed using the FlowJo software (version 10.4;
FlowJo LLC).
Reverse transcription-quantitative PCR
(RT-qPCR)
Total RNA from RASMCs was extracted using
TRIzol® reagent (Thermo Fisher Scientific, Inc.).
Reverse transcription (incubation at 42˚C for 60 min and
termination at 70˚C for 5 min) was performed using RevertAid First
Strand cDNA Synthesis kit (Thermo Fisher Scientific, Inc.)
according to the manufacturer's protocol. The forward and reverse
primers (Sangon Biotech Co., Ltd.) used were as follows: GAPDH
forward, 5'-ACAGCAACAGGGTGGTGGAC-3' and reverse,
5'-TTTGAGGGTGCAGCGAACTT-3'; α-SMA forward,
5'-AGATTATGTTTGAGACCTTC-3' and reverse, 5'-AGTCCAGCACAATACCAGTT-3';
and OPN forward, 5'-AGGAGTTTCCCTGTTTCTG-3' and reverse,
5'-TGGTCTTCCCGTTGCTGTC-3'. RT-qPCR was performed using SYBR Green
PCR Master Mix (Thermo Fisher Scientific, Inc.) on an Applied
Biosystems 7500 Fast Real-Time PCR System (Thermo Fisher
Scientific, Inc.). The cycling conditions were as follows: 95˚C for
15 sec, 60˚C for 1 min, 95˚C for 15 sec and 60˚C for 1 min for 40
cycles. The 2-∆∆Cq method (27) was used to calculate the relative
gene expression.
Western blot analysis
RASMCs were lysed in RIPA buffer (medium; cat. no.
P0013C; Beyotime Institute of Biotechnology) and
phenylmethylsulphonyl fluoride (0.5 mM; cat. no. ST505; Beyotime
Institute of Biotechnology) to extract the total protein. The
concentration of the protein samples was determined using a BCA
Protein Assay kit (Biosharp Life Sciences). Next, 12 µl protein
samples were separated via 8-12% SDS-PAGE (depends on the molecular
weight of target protein) and then transferred onto polyvinylidene
fluoride membranes (EMD Millipore). Subsequently, the membranes
were blocked using 5% skimmed milk at room temperature for 1 h,
followed by incubation with the following primary antibodies at 4˚C
overnight: Anti-phosphorylated (p)-ACC (1:2,000; cat. no. ab68191),
anti-ACC (1:2,000; cat. no. ab109368), anti-p-AMPK (1:1,500; cat.
no. ab133448), anti-AMPK (1:2,000; cat. no. ab207442), anti-α-SMA
(1:1,000; cat. no. ab7817), anti-GAPDH (1:5,000; cat. no. ab8245)
and anti-OPN (1:1,000; cat. no. ab8448). All antibodies were
purchased from Abcam. Subsequently, the members were incubated with
HRP-conjugated secondary antibodies (1:10,000; cat. nos. A16104 and
A16072; Thermo Fisher Scientific, Inc.) at room temperature for 1
h. Finally, the protein blots were visualized using an ECL
detection system (ChemiScope 5300 Pro; Clinx Science Instruments
Co., Ltd.). Quantity One software (version 4.4.6; Bio-Rad
Laboratories, Inc.) was used to analyze the density of each band,
which was normalized to the loading control GAPDH. All antibodies
cross-reacted with their bovine homologs as a positive control.
Immunofluorescence assay
RASMCs were fixed in 4% paraformaldehyde (cat. no.
A0000700; Shanghai Richjoint Chemical Reagent Co., Ltd.) at room
temperature for 30 min and incubated with 0.1% Triton at room
temperature for 15 min. After blocking with 5% FBS for 30 min at
37˚C, the cells were incubated overnight with anti-α-SMA (1:500;
cat. no. ab7817; Abcam) and anti-OPN (1:500; cat. no. ab8448;
Abcam) primary antibodies at 4˚C. Subsequently, cells were
incubated with FITC-labeled goat anti-mouse Antibody (1:200; cat.
no. 31635; Thermo Fisher Scientific, Inc.) and Cy3-labeled goat
anti-rabbit antibody (1:100; cat. no. BA1032; AMSBIO LLC.) for 45
min at 37˚C. Then, 0.5 ml Hoechst 33258 staining solution (5 µg/ml;
cat. no. C1017; Beyotime Institute of Biotechnology) was added onto
the glass slide loading cells sample for 5 min at room temperature.
Finally, the samples were observed under a fluorescence microscope
with x40 magnification (Olympus Corporation). Image analysis was
performed using ImageJ software (version 1.8.0; National Institutes
of Health).
Statistical analysis
Statistical analysis was performed using SPSS
(version 22.0; IBM Corp.). Statistical power calculated using PASS
software (Version 11.0.7; NCSS LLC). The data are presented as the
mean ± SEM and percentage. For the analysis of the cell
experiments, one-way ANOVA was used, and differences among
individual groups were analyzed using the Bonferroni post-hoc test.
For the analysis of the clinical data, the categorical variables
between the ISR and non-ISR groups were compared using the
χ2 test, and the continuous variables using unpaired
Student's t-test. Simple linear regression analysis and multiple
linear regression analysis were used to assess the association
between neointimal volume in ISR and non-ISR groups and different
parameters. P<0.05 with statistical power >0.75 was
considered to indicate a statistically significant difference.
Results
Baseline patient data
Of the 56 patients enrolled in the present study,
ISR was observed in 25 patients (44.6%). The baseline clinical data
of the ISR and non-ISR groups are shown in Table I. There were no significant
differences between the two groups in age, sex, body mass index,
estimated glomerular filtration rate (eGFR), coronary risk factors
liking hypertension, dyslipidemia, diabetes mellitus, smoking,
lipid profiles at the initial PCI and second CAG, and medications
after stent implanted between the two groups. However, there were
significant differences in adropin levels and diseased vessel count
between the two groups. In addition, the present sample size of 56
patients did not exhibit sex differences in adropin levels between
the two groups (data not shown), although some reports have
indicated that adropin levels are higher in males than in females
(28,29).
 | Table IBaseline characteristics of patients
with ISR (n=25) and without ISR (n=31). |
Table I
Baseline characteristics of patients
with ISR (n=25) and without ISR (n=31).
| Characteristic | ISR | non-ISR | P-value |
|---|
| Age, years | 59.28±10.03 | 61.35±8.85 | 0.423 |
| Female/male | 7/18 | 10/21 | 0.730 |
| Body mass index,
kg/m2 | 23.76±1.75 | 23.95±2.04 | 0.721 |
| eGFR (ml/min/1.73
m2) | 69.54±23.09 | 73.06±25.60 | 0.594 |
| Hypertension | 17 (68.00) | 22 (70.97) | 0.810 |
| Dyslipidemia | 20 (80.00) | 16 (51.61) | 0.243 |
| Diabetes
mellitus | 11 (44.00) | 9 (29.03) | 0.245 |
| Smoking | 12 (48.00) | 8 (25.81) | 0.085 |
| Lipid profiles, at
initial PCI | | | |
|
HDL-C,
mmol/l | 1.27±0.32 | 1.35±0.49 | 0.493 |
|
LDL-C,
mmol/l | 3.38±0.73 | 3.17±0.77 | 0.320 |
|
Triglyceride,
mmol/l | 1.94±1.14 | 1.82±0.97 | 0.683 |
| Lipid profiles, at
second CAG | | | |
|
HDL-C,
mmol/l | 1.37±0.27 | 1.45±0.37 | 0.406 |
|
LDL-C,
mmol/l | 2.96±0.62 | 2.68±0.63 | 0.110 |
|
Triglyceride,
mmol/l | 1.74±1.02 | 1.63±0.79 | 0.644 |
| Adropin, ng/ml | 2.74±0.55 | 3.59±0.65 | <0.001 |
| Diseased vessel
count, n | 1.36±0.49 | 1.10±0.30 | 0.017a |
| Medications after
stent implanted | | | |
|
Aspirin | 25 (100.00) | 31 (100.00) | 1.000 |
|
Clopidogrel | 22 (88.00) | 30 (96.77) | 0.456 |
|
Statin | 20 (80.00) | 29 (93.55) | 0.264 |
|
ACEI/ARB | 14 (56.00) | 18 (58.06) | 0.877 |
|
β-blocker | 10 (40.00) | 14 (45.16) | 0.698 |
|
Calcium
channel blockers | 8 (32.00) | 11 (35.48) | 0.784 |
|
Insulin
treatment | 3 (12.00) | 2 (6.45) | 0.801 |
Characteristics of implanted stent and
stenosis vessels
The detailed characteristics of the implanted stent
and stenosis vessels in the ISR and non-ISR groups are presented in
Table II. Few marked differences
were observed in terms of diseased vessel location and stent
diameter between the two groups. However, the number of stents and
total stent length in the ISR group were significantly higher than
in the non-ISR group. During the quantitative analysis of the CAG
findings, no differences were determined in terms of the reference
vessel diameter between the two groups; however, the minimal lumen
diameter and lesion length in the ISR group were more aggravated
than in the non-ISR group. Furthermore, a significant difference
was detected in the restenosis pattern between the two groups, with
focal lesions more frequently observed in the ISR group and diffuse
lesions more commonly in the non-ISR group.
| Table IICharacteristics of patients with ISR
(n=25) and without ISR (n=31). |
Table II
Characteristics of patients with ISR
(n=25) and without ISR (n=31).
| Characteristic | ISR | non-ISR | P-value |
|---|
| Location | | | 0.678 |
|
Left
anterior descending artery | 11 (44.00) | 12 (38.71) | |
|
Left
circumflex artery | 4 (16.00) | 5 (16.13) | |
|
Right
coronary artery | 10 (40.00) | 14 (45.16) | |
| Stent diameter,
mm | 2.92±0.52 | 3.06±0.47 | 0.291 |
| Total stent length,
mm | 36.96±15.87 | 27.65±11.40 | 0.014 |
| Number of
stents | 1.40±0.50 | 1.10±0.30 | 0.011 |
| Quantitative
coronary angiography | | | |
|
Reference
vessel diameter, mm | 2.85±0.52 | 2.94±0.48 | 0.532 |
|
Minimal
lumen diameter, mm | 1.17±0.24 | 1.98±0.41 | <0.001 |
|
% diameter
stenosis | 59.76±3.79 | 35.06±8.38 | <0.001 |
|
Lesion
length, mm | 9.38±2.82 | 3.55±1.26 | <0.001 |
| Restenosis
pattern | | | 0.001 |
|
Focal | 16 (64.00) | 6 (19.35) | |
|
Diffuse | 9 (36.00) | 25 (80.65) | |
Stenosis characterization determined
via conventional IVUS
Table III shows
the cross-sectional characterizations of ISR in the two groups
assessed by conventional IVUS. In the two-dimensional analysis of
the site of the minimum lumen area, no significant differences in
stent area were observed between the two groups. However, the ISR
group had a significantly smaller lumen area than the non-ISR
group, while the neointimal area of the ISR group was significantly
greater than that of the non-ISR group. In the three-dimensional
analysis within the stented stenosis segment, patients in the ISR
group had significantly greater stent, lumen and neointimal volumes
than those in the non-ISR group. Furthermore, the neointimal volume
percentage in the ISR group was significantly greater than that in
the non-ISR group. These results suggested that neointima in the
stent may be a major cause of ISR.
| Table IIIConventional intravascular ultrasound
characterization of ISR-neointimal hyperplasia in patients with ISR
(n=25) and without ISR (n=31). |
Table III
Conventional intravascular ultrasound
characterization of ISR-neointimal hyperplasia in patients with ISR
(n=25) and without ISR (n=31).
| Analysis | ISR | non-ISR | P-value |
|---|
| Two-dimensional
analysis (minimum lumen area) | | | |
|
Stent area,
mm2 | 6.76±2.56 | 7.39±2.43 | 0.341 |
|
Lumen area,
mm2 | 1.13±0.47 | 3.15±1.45 | <0.001 |
|
Neointimal
area, mm2 | 5.62±2.15 | 4.26±1.60 | 0.008 |
| Three-dimensional
analysis within stented segment | | | |
|
Stent
volume, mm3 | 63.17±31.00 | 26.20±11.34 | <0.001 |
|
Lumen
volume, mm3 | 24.33±10.46 | 17.67±8.36 | 0.010 |
|
Neointimal
volume, mm3 | 38.84±23.09 | 8.53±4.13 | <0.001 |
|
Neointimal
volume, %a | 59.33±11.04 | 31.82±8.79 | <0.001 |
Simple and multiple linear regression
analyses of neointimal volume
Tables IV and
V show the results of the linear
regression analysis between ISR-associated factors and neointimal
volume. In terms of the simple linear regression analysis of the
ISR and non-ISR groups, the increase in adropin levels had a
significant and negative association with neointimal volume;
however, the presence of diabetes mellitus was positively
associated with neointimal volume in the ISR group (r=0.494;
P=0.012). Although stent number and stent length were notably
different between the two groups, they were not significantly
associated with neointimal volume in any group. In addition, other
factors, such as hypertension, stent number and eGFR (Table IV) had no significant association
with neointimal volume. Subsequently, the present study adjusted
for confounding factors and screened for factors with an adjusted
R2 value >0.1. Further multiple linear regression
analyses revealed that only adropin levels, rather than
dyslipidemia and diabetes, were significantly negatively associated
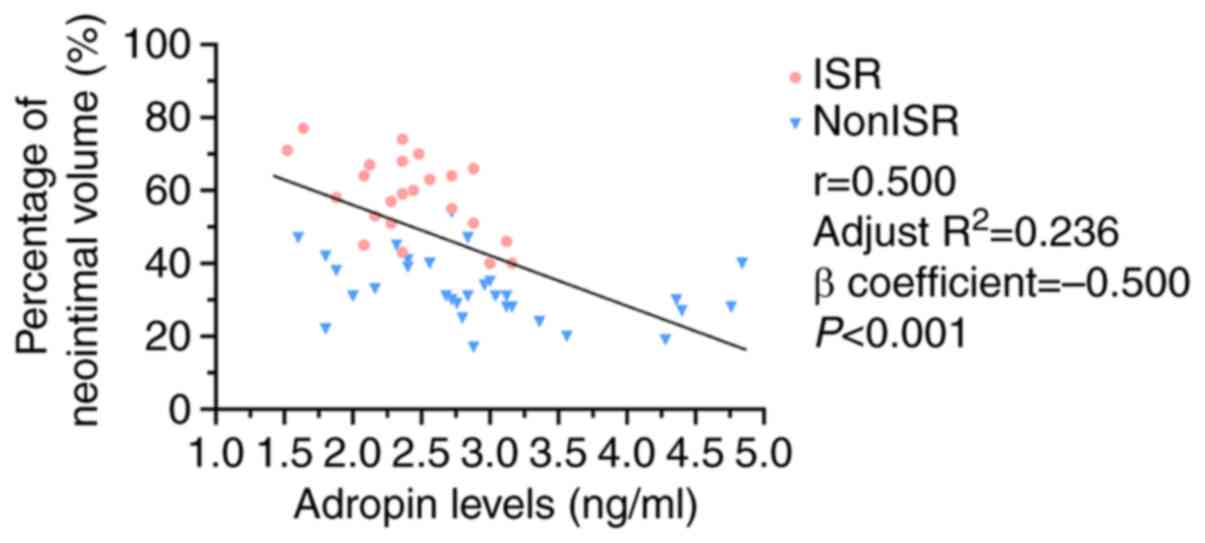
with neointimal volume in both groups (Table V). Subsequently, correlation and
linear regression analyses were performed between overall adropin
levels for the 56 patients and calculated the neointimal volume
percentage; the results revealed a clear negative association
between these two variables (Fig.
1). Therefore, there is evidence suggesting that low serum
adropin levels are associated with increased neointimal volume, may
be a risk factor for ISR.
| Table IVSimple linear regression
analysis. |
Table IV
Simple linear regression
analysis.
| | Neointimal
volume |
|---|
| | ISR group | | non-ISR group |
|---|
| Parameter | r | adjusted
R2 | P-value | r | adjusted
R2 | P-value |
|---|
| Adropin | -0.625 | 0.364 | 0.001 | -0.525 | 0.250 | 0.002 |
| Diabetes | 0.494 | 0.211 | 0.012 | 0.136 | -0.015 | 0.465 |
| Dyslipidemia | 0.375 | 0.103 | 0.065 | 0.008 | -0.034 | 0.966 |
| Body mass
index | 0.368 | 0.098 | 0.070 | 0.182 | 0.000 | 0.326 |
| Hypertension | 0.331 | 0.071 | 0.106 | 0.063 | -0.030 | 0.735 |
| Stent number | 0.308 | 0.056 | 0.134 | 0.260 | 0.036 | 0.157 |
| Stent length | 0.271 | 0.033 | 0.191 | 0.196 | 0.005 | 0.290 |
| CCB | 0.257 | 0.025 | 0.216 | 0.104 | -0.023 | 0.576 |
| ARB/ACEI | 0.253 | 0.024 | 0.222 | 0.315 | 0.068 | 0.084 |
| Statin | 0.229 | 0.011 | 0.271 | 0.143 | -0.013 | 0.444 |
| β-blockers | 0.187 | -0.007 | 0.371 | 0.057 | -0.031 | 0.760 |
| Smoking | 0.184 | -0.008 | 0.378 | 0.072 | -0.029 | 0.700 |
| eGFR | 0.171 | -0.013 | 0.415 | 0.091 | -0.026 | 0.625 |
| Insulin | 0.261 | -0.028 | 0.207 | 0.033 | -0.033 | 0.860 |
| Diseased vessel
count | 0.098 | -0.033 | 0.641 | 0.176 | -0.003 | 0.345 |
| Age | 0.045 | -0.041 | 0.829 | 0.044 | -0.032 | 0.814 |
| Sex | 0.033 | -0.042 | 0.875 | 0.291 | 0.053 | 0.112 |
| Table VMultiple linear regression analysis
for confounding factors. |
Table V
Multiple linear regression analysis
for confounding factors.
| | Neointimal volume
(mm3) |
|---|
| | ISR group | non-ISR group |
|---|
| Parameter | β coefficient | P-value | β coefficient | P-value |
|---|
| Adropin | -0.509 | 0.022 | -0.526 | 0.003 |
| Dyslipidemia | 0.140 | 0.945 | 0.033 | 0.853 |
| Diabetes | -0.256 | 0.198 | -0.158 | 0.370 |
Cytotoxicity of adropin to RASMCs
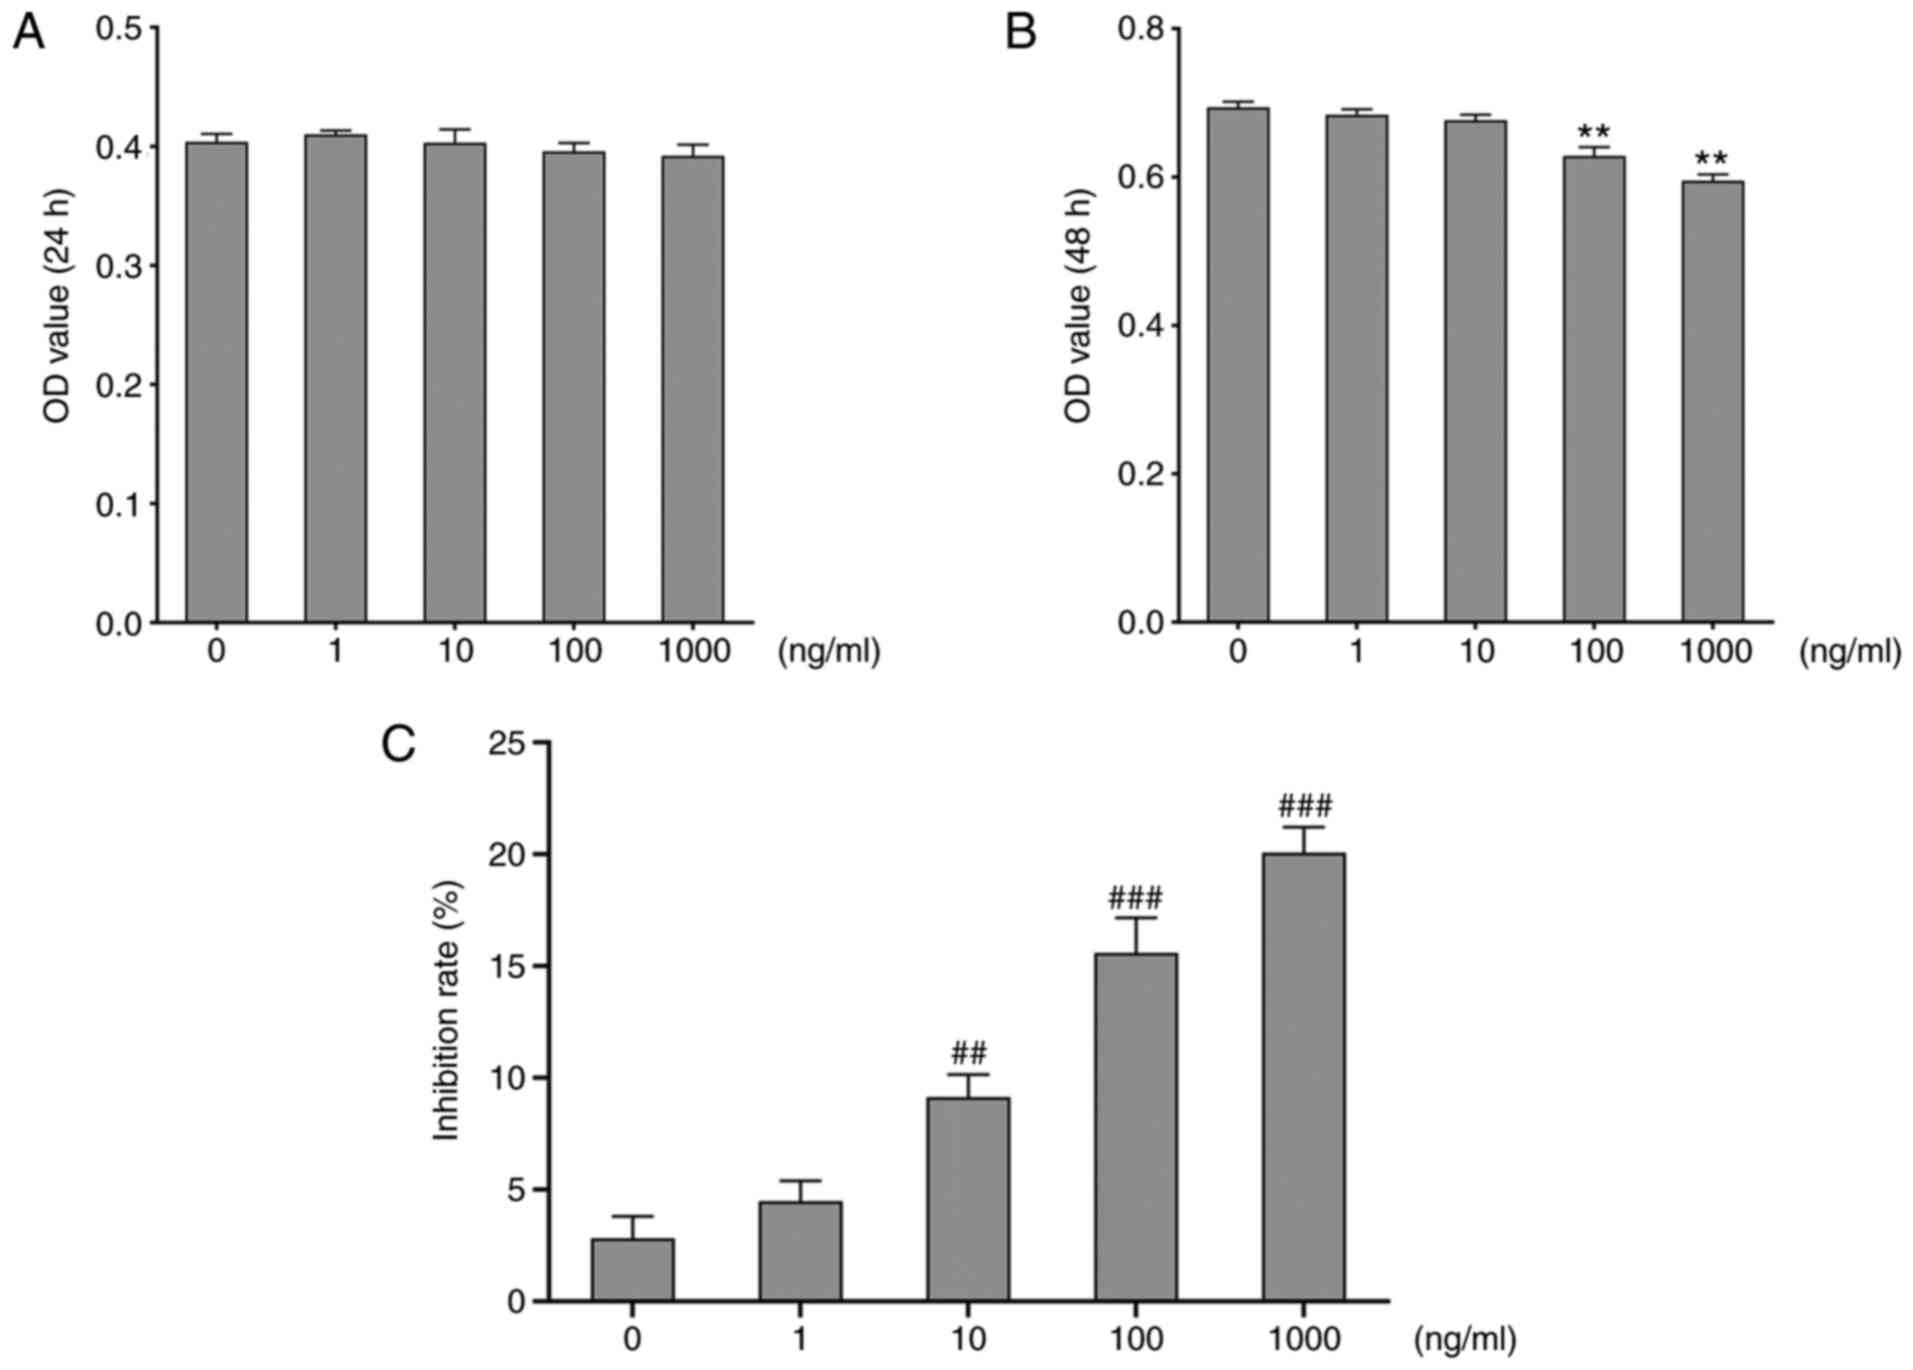
To assess cytotoxicity of adropin on RASMCs, the MTT
assay was used to detect the optical density (OD) value by treating
cells with various concentrations of adropin for 24 or 48 h. The
results at 24 h revealed that the OD values from the RASMCs treated
with different concentrations of adropin were similar among each
other (Fig. 2A). However, at 48 h,
the OD values of the 1,000 ng/ml and 100 ng/ml groups were
significantly lower than those of the 10 ng/ml group (Fig. 2B); this indicated that the effect of
adropin on RASMCs may be time-dependent. Based on these data the
inhibition rates were examined, it showed that adropin inhibited
RASMCs in a dose-dependent manner (Fig.
2C). The IC50 value of adropin on RASMCs was 30,850
ng/ml calculated by SPSS software. The OD results at 24 h were not
significantly different and adropin concentrations >10 ng/ml at
48 h are toxic to RASMCs. Also, 10 ng/ml is closed to physiological
level. Therefore, cells that were treated for 48 h with 10 ng/ml
adropin were selected for subsequent experiments.
Adropin suppresses Ang II-induced
phenotypic modulation of RASMCs
SMCs convert its contractile phenotypes into
synthetic phenotypes, which is accompanied by significantly
decreased α-SMA expression and markedly increased levels of OPN
(30). To verify the effects of
adropin on the phenotype of RASMCs, changes in α-SMA and OPN
expression in RASMCs treated with Ang II were detected. The results
from the RT-qPCR, western blotting and quantitative fluorescence
analyses revealed that Ang II induced significant OPN upregulation
and significant α-SMA downregulation compared with untreated cells;
however, adropin reversed this phenotypic change (Fig. 3A, B,
Ca, Cb and D).
Therefore, it was speculated that adropin may slow down the
phenotypic modulation of RASMCs induced by Ang II. In order to
investigate the effects of adropin on AMPK and ACC, their
expression and phosphorylation levels were assessed. The western
blotting results indicated that adropin recovered the activities of
ACC and AMPK by decreasing the expression levels of p-ACC and
increasing those of p-AMPK, compared with the Ang II group
(Fig. 3B, Cc and Cd).
AMPK is a key factor in inhibiting intimal hyperplasia;
consequently, adropin may contribute to decreasing neointima
through the activation of AMPK.
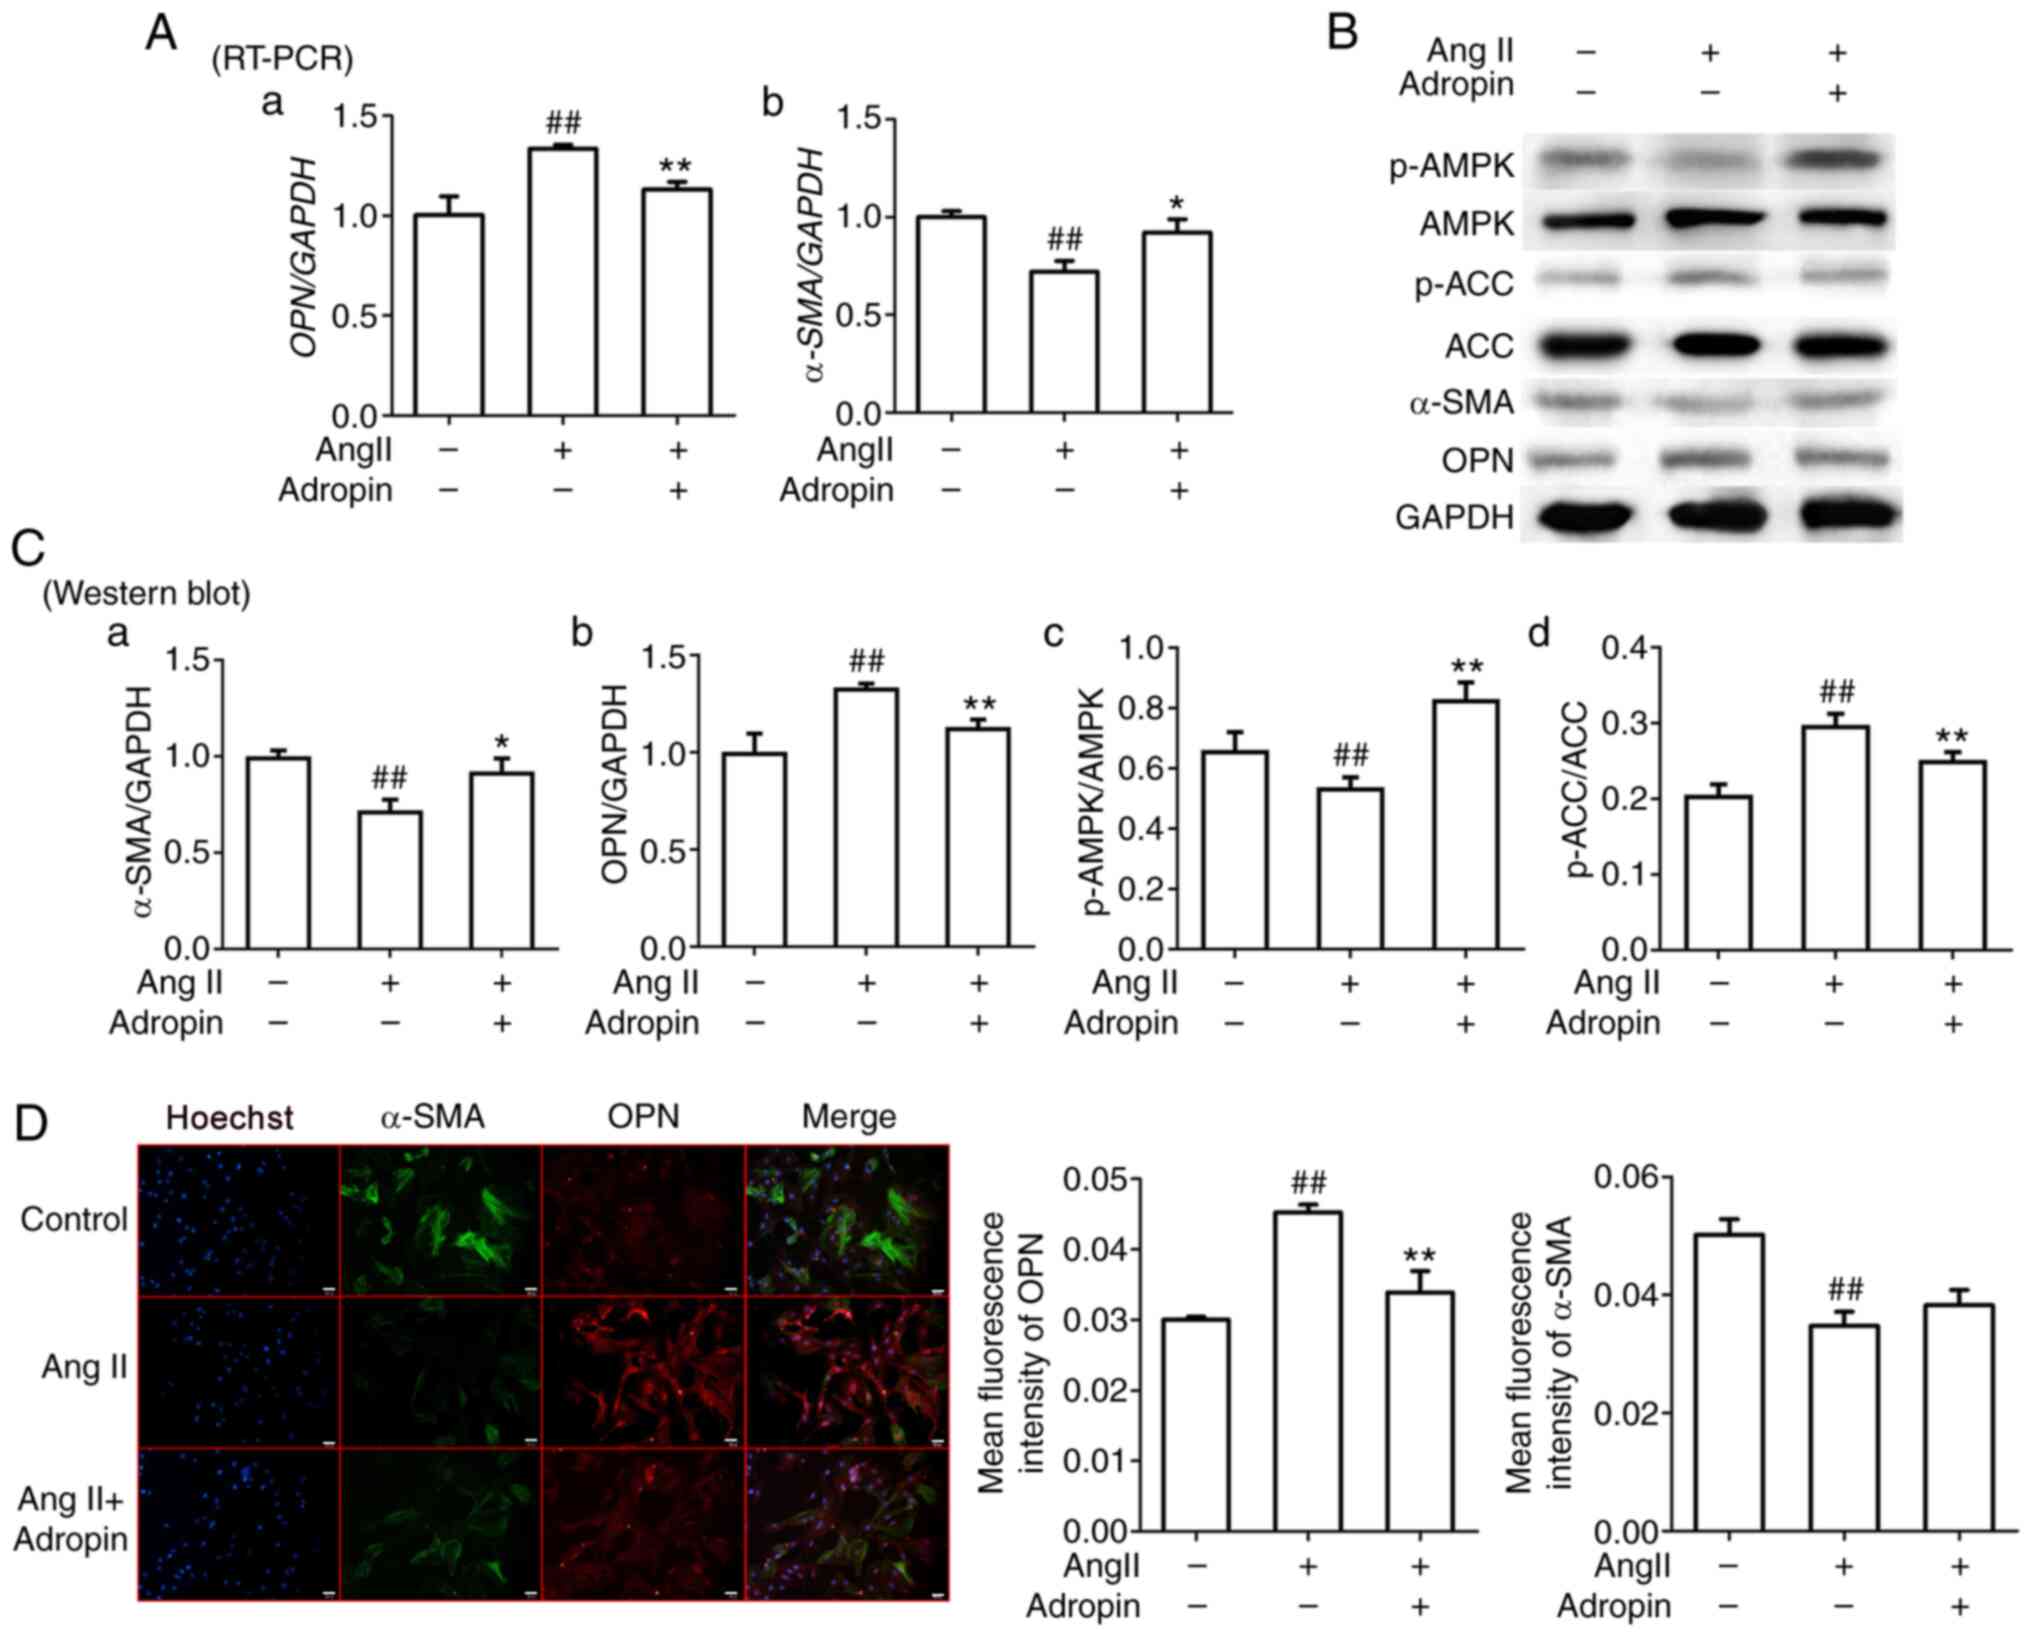 | Figure 3Effects of adropin on the phenotypic
modulation of rat aorta smooth muscle cells and the AMPK/ACC
signaling pathway. (A) RT PCR results of α SMA (Aa) and OPN (Ab)
expression. (B) Western blot results and (C) quantification of
protein expression levels of α SMA (Ca), OPN (Cb), p AMPK/AMPK (Cc)
and p ACC/ACC (Cd). (D) Representative immunofluorescence images of
α SMA and OPN expression. Scale bar, 20 μm. Data are presented as
the mean ± SEM (n=3). *P<0.05, **P<0.01
vs. Ang II. ##P<0.01 vs. control. RT-PCR, reverse
transcription PCR; α-SMA, α-smooth muscle actin; OPN, osteopontin;
p, phosphorylated; AMPK, AMP-activated protein kinase; ACC,
acetyl-CoA carboxylase; Ang II, angiotensin II. |
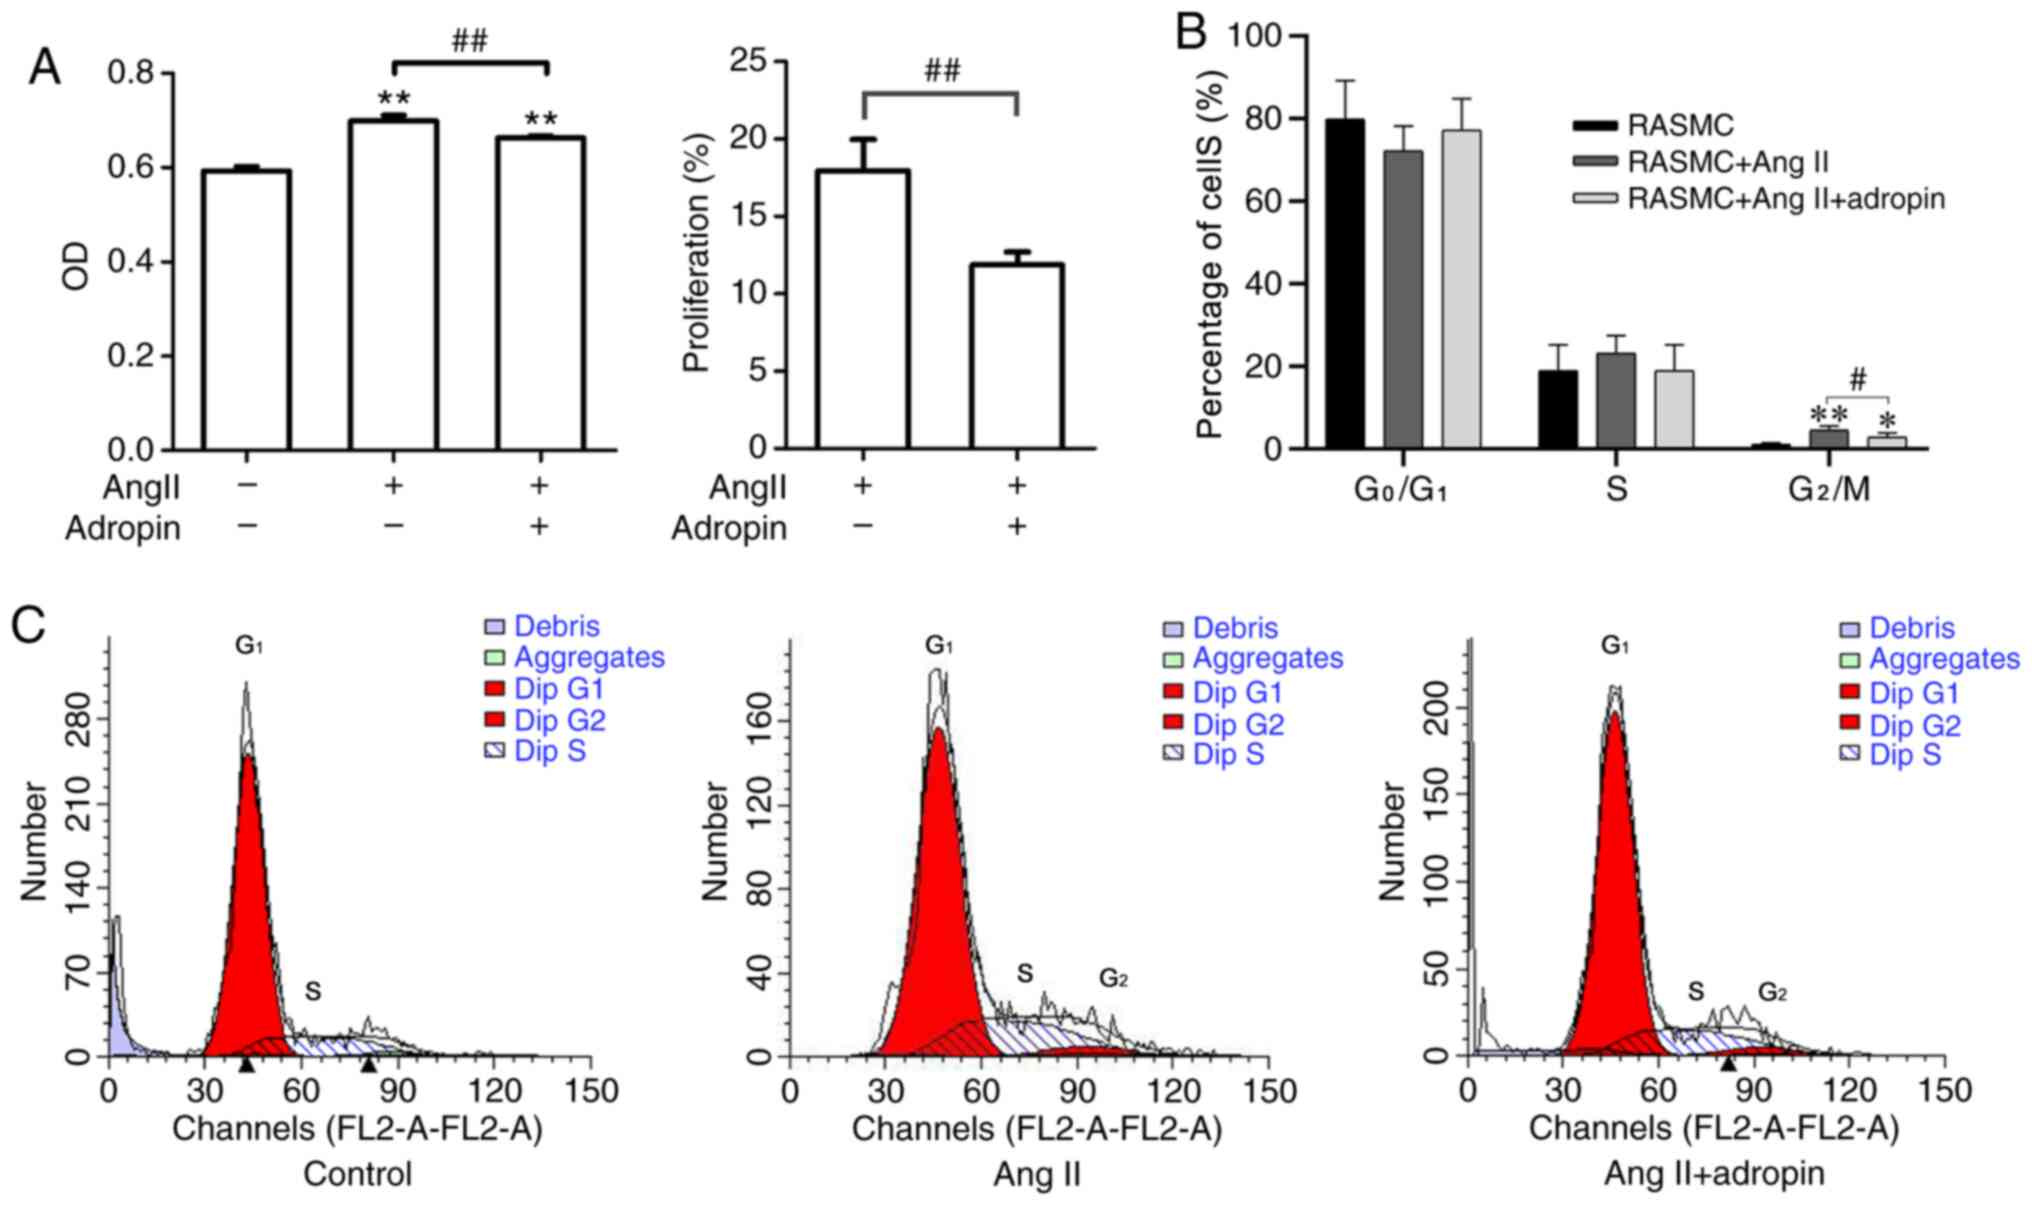
Adropin inhibits Ang II-induced
proliferation of RASMCs
It was demonstrated that RASMCs treated with Ang II
presented a significantly increased proliferation compared with
untreated cells; however, adropin weakened the effect of Ang II on
RASMC proliferation (Fig. 4A).
Furthermore, it was revealed that adropin significantly decreased
the amount of cells in the G2/M phase compared with that
in the Ang II group (Fig. 4B and
C).
Adropin negatively regulates the
phenotypic modulation and proliferation of RASMCs via the AMPK/ACC
signaling pathway
It has been previously reported that the AMPK
signaling pathway influences the cellular phenotype and
proliferation of VSMCs (31,32).
The present study demonstrated that adropin affected the AMPK/ACC
signaling pathway and suppressed the Ang II-induced phenotypic
modulation of RASMCs. Therefore, it was speculated that adropin may
regulate the phenotypic modulation and proliferation of RASMCs
through the APMK/ACC signaling pathway. Compound C, an
AMPK-specific inhibitor, was used to verify the aforementioned
hypothesis. Firstly, the western blotting results revealed that,
compared with the Ang II + compound C group, adropin significantly
increased the ratio of p-AMPK/AMPK and significantly decreased the
ratio of p-ACC/ACC in the Ang II + compound C + adropin group,
suggesting that ACC activity was retained by adropin (Fig. 5A and C). Secondly, the RT-qPCR and western
blotting results indicated that the expression levels of OPN and
α-SMA between the Ang II and Ang II + compound C groups were not
significantly different. Following the addition of adropin to the
Ang II + compound C group, the increase in OPN and decrease in
α-SMA were reversed, compared with no adropin (Fig. 5B and C). Furthermore, the MTT assay revealed
that adropin significantly decreased the RASMC proliferation
induced by Ang II, and presented a similar anti-proliferative
effect with the addition of compound C on RASMCs (Fig. 5D). Therefore, the present results
suggested that adropin inhibited the phenotypic modulation and
proliferation of RASMCs through the AMPK/ACC signaling pathway.
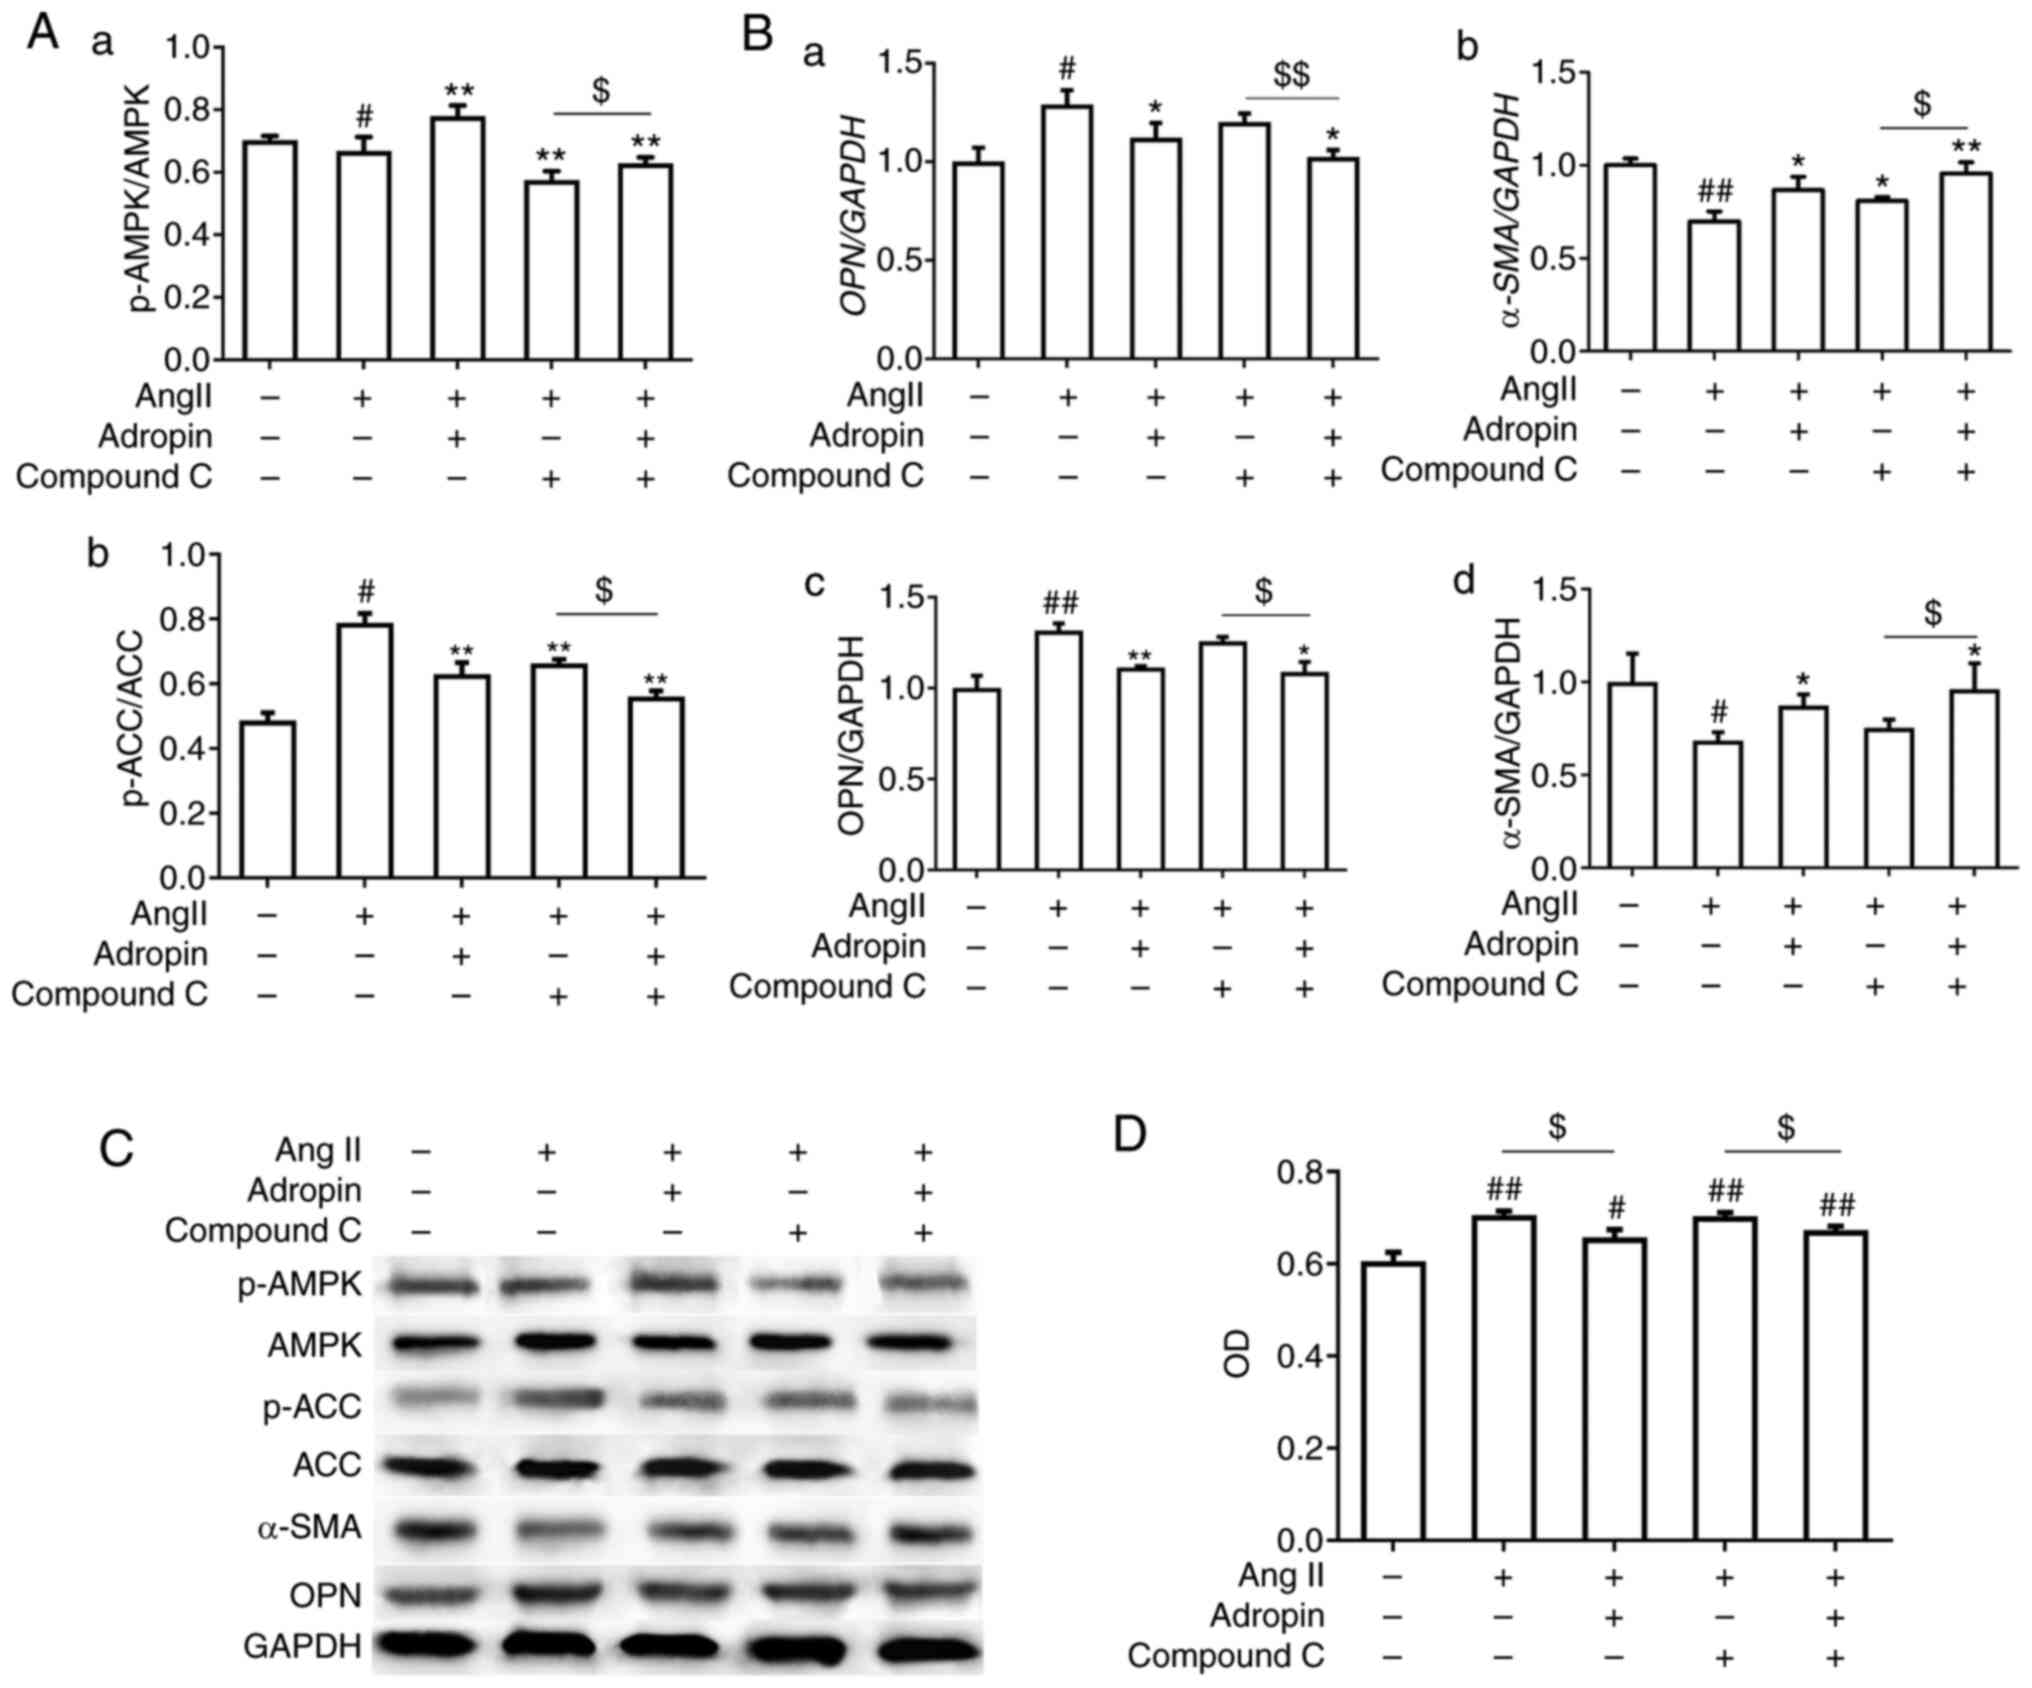 | Figure 5Adropin regulates the phenotypic
modulation and proliferation of RASMCs through the AMPK/ACC
signaling pathway. (A) Western blot results of the variations in
(Aa) p-AMPK/AMPK and (Ab) p-ACC/ACC. (Ba and Bb) reverse
transcription PCR and (Bc and Bd) western blotting results for OPN
and α-SMA expression. (C) Protein bands of p-ACC/ACC, p-AMPK/AMPK,
OPN and α-SMA via western blotting. (D) Proliferation of RASMCs
detected via MTT assay. Data are presented as the mean ± SEM (n=3).
*P<0.05, **P<0.01 vs. Ang II.
#P<0.05, ##P<0.01 vs. control.
$P<0.05, $$P<0.01. RASMCs, rat aorta
smooth muscle cells; α-SMA, α-smooth muscle actin; OPN,
osteopontin; p, phosphorylated; AMPK, AMP-activated protein kinase;
ACC, acetyl-CoA carboxylase; Ang II, angiotensin II. |
Discussion
The present study identified adropin as a novel
regulator of VSMC function, revealing that serum adropin levels in
patients with ISR were negatively associated with neointimal
volume. To the best of our knowledge, the current study
demonstrated for the first time in vitro that adropin
potently inhibited the Ang II-induced phenotypic modulation and
proliferation of RASMCs by regulating the AMPK/ACC signaling
pathway. The aforementioned findings indicated that adropin may be
a potentially important target for the treatment and prediction of
neointimal hyperplasia.
The incidence of ISR in patients after PCI has
remained relatively constant (~10%) despite the technical progress
in DES (7). The causes of ISR are
complex, and can be biological, mechanical and technical (1). Technical causes include stent fracture
or stent underexpansion, while neointimal proliferation and late
neoatherosclerosis constitute the primary biological causes
(7). Although using high-pressure
balloons decreases the occurrence of stent underexpansion, and a
novel stent replaces the restenotic one (33), there are few medical therapies
available to cope with neointimal proliferation. Oral
administration of sirolimus, corticosteroids or the local delivery
of paclitaxel exhibited a limited effect in suppressing intimal
hyperplasia (34). A previous study
investigated the local delivery of nanoparticles containing VEGF
cDNA to a target artery in an animal model to inhibit intimal
hyperplasia (35); however, this
novel therapy requires further investigation and clinical trials to
determine its efficacy and safety. Patients with complications such
as diabetes, chronic kidney disease and bifurcation lesions are
susceptible to ISR (36). In the
present study, differences in coronary risk factors, such as
hypertension, dyslipidemia, diabetes mellitus, and smoking and the
lipid profiles between the ISR and non-ISR groups were not
significant. It was speculated that this may be due to it being a
retrospective study with a small sample size and only featuring a
1-year follow-up time. Numerous studies reported that the most
common pattern of ISR was focal (37-39),
which is in accordance with the current data. However, the cause of
the focal pattern observed in the present study has not been
completely elucidated. Although the total stent length in the ISR
group was significantly greater than that of the non-ISR group, the
total stent length and number of stents were not risk factors for
ISR according to the present regression analysis. A previous study
reported that longer stents were a predictive factor for DES
restenosis; however, the total stent length and number of stents
were not risk factors for ISR (1).
Furthermore, Zhao et al (40) reported that stent length was not a
predictor of ISR in patients, as determined through univariate
logistic regression analysis. Therefore, it is difficult to
precisely evaluate the influence of the total stent length and
stent number in ISR in the present study. Additionally, DES
fracture has been associated with higher major adverse
cardiovascular events, stent thrombosis and ISR (41,42).
Fracture following DES implantation, as seen in a rabbit model,
focally accelerated intimal hyperplasia; however, the
anti-proliferative drugs were under a designed effective release
period (43). Therefore, it is
especially important to identify other methods to inhibit intimal
hyperplasia of ISR.
Neoatherosclerosis and inflammation underlying the
formation of intimal hyperplasia cannot be addressed through stent
implantation (1); therefore, ISR
will inevitably occur to some extent. The present results indicated
that the levels of adropin in the ISR group were significantly
lower than those in the non-ISR group, and that the adropin levels
in both groups were negatively associated with neointimal volume.
Therefore, it was hypothesized that adropin may relieve the
progression of intimal hyperplasia. Subsequent in vitro
experiments indicated that adropin inhibited the phenotypic
modulation and proliferation of RASMCs, and it is well known that
the proliferation and migration of VSMCs are essential processes of
atherosclerosis (44). Adropin is a
protein associated with energy homeostasis and, to the best of our
knowledge, only an extremely small number of studies have
investigated the association between adropin, proliferation and
migration in VSMCs. It has been recently reported that adropin
inhibits TNFα-induced THP1 monocyte adhesion to the vascular
endothelial cells; additionally, adropin restrains the migration
and proliferation of SMCs through the downregulation of ERK1/2 and
Bax, and the upregulation of PI3K/Akt/Bcl2(20). Furthermore, it has been demonstrated
that adropin has a potential protective role on endothelial cells
through the VEGFR2/PI3K signaling pathway (45). The aforementioned functions of
adropin may have contributed to the anti-atherosclerosis effects.
The present study provided evidence to confirm that adropin
suppressed the phenotypic modulation and proliferation of VSMCs,
which may reduce intimal hyperplasia.
In contrast to the PI3K/Akt signaling pathway, which
is a well-studied signaling pathway involving VSMC proliferation,
the present study revealed that adropin significantly attenuated
the proliferative characteristics of the Ang II-induced VSMCs model
via the AMPK/ACC signaling pathway. Generally, AMPK is regarded as
a molecule that promotes ATP synthesis and restores energy
homeostasis in the cell (46).
However, studies have indicated that AMPK has notable effects on
cellular growth arrest (47,48).
The cell-cycle analysis performed in the current study revealed
that adropin induced G0/G1 arrest and
prevented the cell cycle from entering the S phase. Previous
studies have demonstrated that AMPK inhibits SMC proliferation
(49,50), as well as migration (51), and the deletion of AMPK exacerbates
neointimal hyperplasia (52). In
addition, ACC, as one of the downstream targets of AMPK, transmits
signals from AMPK to p53 and p21, which induces cell-cycle arrest
(53). The present study revealed
that the phosphorylation of AMPK inhibited ACC activity by
increasing the ratio of p-ACC/ACC, leading to weakened
proliferation and migration in VSMCs. Although the current study
revealed that adropin may be an upstream factor that activates
AMPK, to the best of our knowledge there are currently no studies
reporting the effect of adropin on AMPK in VSMCs. Therefore, the
present study reported, for the first time, that adropin may
activate AMPK to inhibit the proliferation and migration of
VSMCs.
The AMPK signaling pathway is a well-known energy
metabolism pathway, especially involved in the promotion of fatty
acid β-oxidative metabolism (54).
Adropin promotes the oxidation of fatty acids and lipoproteins
(55,56), and in the present study, it
inhibited neointimal hyperplasia via activating the AMPK/ACC
signaling pathway. Although the AMPK/ACC signaling pathway is
crucial in the oxidation of fatty acids (57), the effect of adropin on substrate
oxidation preferences, such as fatty acids or glucose, remains
unclear. Gao et al (58)
reported that adropin promotes carbohydrate oxidation over fat
oxidation in skeletal muscle. Additionally, adropin increases the
inhibitory effect of insulin on cardiac fatty acid oxidation,
accompanied by a strong stimulation of glucose oxidation (16). However, a recent study suggested
that, in contrast to skeletal muscle, metabolic effects of adropin
on cardiac cells may occur primarily through the regulation of
glucose utilization, rather than the inhibition of fatty acid
metabolism, and that adropin did not differentially phosphorylate
AMPK and ACC (59). Therefore,
although the present study revealed that adropin promoted the
activation of the AMPK signaling pathway, it is difficult to
directly attribute the effect of adropin on ISR inhibition to the
function of adropin that promotes fatty acid metabolism, since the
effects of adropin on fatty acid metabolism in cardiovascular
disease remain unclear. Carnitine O-palmitoyl transferase 1 (CPT1A)
and peroxisomal acyl-coenzyme A oxidase 1 (ACOX1) participate in an
important step of the mitochondrial uptake of long-chain fatty
acids and their subsequent β-oxidation in the mitochondrion, and
they serve essential roles in triglyceride metabolism (60-62).
Therefore, CPT1a and ACOX1 may be ideal markers for detecting the
function of adropin on fatty acid β-oxidative metabolism. Future
studies should investigate whether adropin may decrease ISR
occurrence via promoting fatty acid metabolism.
The current study presents some limitations. It has
been previously reported that adropin is a risk factor for the
development of cardiovascular disease (19,62),
which is in accordance with the conclusions of the present study.
Although statistical power was achieved to ensure that the results
were credible, the current retrospective study only consisted of 56
patients. The small number of patients with ISR may render the
linear regression results unstable. In future studies, the sample
size should be increased to investigate the exact association
between adropin and neointima. Furthermore, there was no marked
difference between the two β-coefficient values of adropin in the
multiple linear regression analysis of the ISR and non-ISR groups;
therefore, adropin seems to have predictive significance in both
groups. Additionally, the median time from DES implantation to ISR
occurrence is 14 months (37), but
in the present study, the prognosis of the 56 patients was only
followed up for 1 year; therefore, the efficacy of adropin over a
longer period of time in intimal hyperplasia could not be
determined.
Overall, independent, negative associations were
identified between adropin levels and intimal hyperplasia, and
adropin inhibited the phenotypic modulation and proliferation of
VSMCs by activating the AMPK/ACC signaling pathway. Therefore, the
present results indicated that adropin may represent a potentially
novel target for the treatment and prediction of intimal
hyperplasia.
Supplementary Material
Identification of RASMCs via the
specific marker α‑SMA. Scale bar, 20 μm. RASMCs, rat aorta smooth
muscle cells; α‑SMA, alpha‑smooth muscle actin.
Acknowledgements
Not applicable.
Funding
Funding: The present study was funded by the Suzhou Science and
Technology Development Program Guidance Project Fund (grant no.
SYSD2013093), the Youth Natural Science Fund of Soochow University
(grant no. SDY2013A32), Xinxin Heart (SIP) Foundation
(2019-CCA-ACCESS-058), and the Research Fund of the Second
Affiliated Hospital of Soochow University (grant no.
SDFEYGJ1405).
Availability of data and materials
The datasets used and/or analyzed during the current
study are available from the corresponding author on reasonable
request.
Authors' contributions
LPZ designed the study and revised the manuscript.
LW, YQC, XSC and HX assisted with data acquisition and
interpretation. DMZ, WTX and JCC performed the statistical analysis
and drafted the manuscript. All authors read and approved the final
manuscript.
Ethics approval and consent to
participate
The present study was approved by the Ethics
Committee of The Second Affiliated Hospital of Soochow University.
(Suzhou, China). Written informed consent was obtained from the
patients or their guardians. All animal experiments were conducted
according to the National Institutes of Health Guidelines for
Animal Care, eighth edition, revised 2011(25).
Patient consent for publication
Not applicable.
Competing interests
The authors declare that they have no competing
interests.
References
|
1
|
Dangas GD, Claessen BE, Caixeta A, Sanidas
EA, Mintz GS and Mehran R: In-stent restenosis in the drug-eluting
stent era. J Am Coll Cardiol. 56:1897–1907. 2010.PubMed/NCBI View Article : Google Scholar
|
|
2
|
Babapulle MN, Joseph L, Bélisle P, Brophy
JM and Eisenberg MJ: A hierarchical bayesian meta-analysis of
randomised clinical trials of drug-eluting stents. Lancet.
364:583–591. 2004.PubMed/NCBI View Article : Google Scholar
|
|
3
|
Solinas E, Dangas G, Kirtane AJ, Lansky
AJ, Franklin-Bond T, Boland P, Syros G, Kim YH, Gupta A, Mintz G,
et al: Angiographic patterns of drug-eluting stent restenosis and
one-year outcomes after treatment with repeated percutaneous
coronary intervention. Am J Cardiol. 102:311–315. 2008.PubMed/NCBI View Article : Google Scholar
|
|
4
|
Lu WD, Huang CW, Li YH and Chen JY:
Multiple mechanisms in 1 in-stent restenosis assessed by optical
coherence tomography. JACC Cardiovasc Interv. 10:2340–2341.
2017.PubMed/NCBI View Article : Google Scholar
|
|
5
|
Kim WJ, Yoon SE, Kang SM, Jo U, Park HW,
Cho YR, Park GM, Lee JY, Park DW, Kang SJ, et al: Long term
prognosis of in-stent restenosis after drug-eluting stent
implantation and predictors of recurrent restenosis: Data from the
ASAN DES-ISR registry. Am J Cardiol. 111 (7 Suppl)(27B)2013.
|
|
6
|
Farb A, Sangiorgi G, Carter AJ, Walley VM,
Edwards WD, Schwartz RS and Virmani R: Pathology of acute and
chronic coronary stenting in humans. Circulation. 99:44–52.
1999.PubMed/NCBI View Article : Google Scholar
|
|
7
|
Shlofmitz E, Iantorno M and Waksman R:
Restenosis of drug-eluting stents: A new classification system
based on disease mechanism to guide treatment and state-of-the-art
review. Circ Cardiovasc Interv. 12(e007023)2019.PubMed/NCBI View Article : Google Scholar
|
|
8
|
Ross R: Atherosclerosis-an inflammatory
disease. N Engl J Med. 340:115–126. 1999.PubMed/NCBI View Article : Google Scholar
|
|
9
|
Isoda K, Nishikawa K, Kamezawa Y, Yoshida
M, Kusuhara M, Moroi M, Tada N and Ohsuzu F: Osteopontin plays an
important role in the development of medial thickening and
neointimal formation. Circ Res. 91:77–82. 2002.PubMed/NCBI View Article : Google Scholar
|
|
10
|
Kurdi A, De Meyer GR and Martinet W:
Potential therapeutic effects of mTORinhibition in atherosclerosis.
Br J Clin Pharmacol. 82:1267–1279. 2016.PubMed/NCBI View Article : Google Scholar
|
|
11
|
Zhao Y, Liu Y, Jing Z, Peng L, Jin P, Lin
Y, Zhou Y, Yang L, Ren J, Xie Q and Jin X: N-oleoylethanolamide
suppresses intimal hyperplasia after balloon injury in rats through
AMPK/PPARα pathway. Biochem Biophys Res Commun. 496:415–421.
2018.PubMed/NCBI View Article : Google Scholar
|
|
12
|
Peng L, Huang X, Jin X, Jing Z, Yang L,
Zhou Y, Ren J and Zhao Y: Wedelolactone, a plant coumarin, prevents
vascular smooth muscle cell proliferation and injury-induced
neointimal hyperplasia through Akt and AMPK signaling. Exp
Gerontol. 96:73–81. 2017.PubMed/NCBI View Article : Google Scholar
|
|
13
|
Kim MK, Kim SH, Yu HS, Park HG, Kang UG,
Ahn YM and Kim YS: The effect of clozapine on the AMPK-ACC-CPT1
pathway in the rat frontal cortex. Int J Neuropsychopharmacol.
15:907–917. 2012.PubMed/NCBI View Article : Google Scholar
|
|
14
|
Kumar KG, Trevaskis JL, Lam DD, Sutton GM,
Koza RA, Chouljenko VN, Kousoulas KG, Rogers PM, Kesterson RA,
Thearle M, et al: Identification of adropin as a secreted factor
linking dietary macronutrient intake with energy homeostasis and
lipid metabolism. Cell Metab. 8:468–481. 2008.PubMed/NCBI View Article : Google Scholar
|
|
15
|
Wu L, Fang J, Yuan X, Xiong C and Chen L:
Adropin reduces hypoxia/reoxygenation-induced myocardial injury via
the reperfusion injury salvage kinase pathway. Exp Ther Med.
18:3307–3314. 2019.PubMed/NCBI View Article : Google Scholar
|
|
16
|
Altamimi TR, Gao S, Karwi QG, Fukushima A,
Rawat S, Wagg CS, Zhang L and Lopaschuk GD: Adropin regulates
cardiac energy metabolism and improves cardiac function and
efficiency. Metabolism. 98:37–48. 2019.PubMed/NCBI View Article : Google Scholar
|
|
17
|
Thapa D, Xie B, Zhang M, Stoner MW,
Manning JR, Huckestein BR, Edmunds LR, Mullett SJ, McTiernan CF,
Wendell SG, et al: Adropin treatment restores cardiac glucose
oxidation in pre-diabetic obese mice. J Mol Cell Cardiol.
129:174–178. 2019.PubMed/NCBI View Article : Google Scholar
|
|
18
|
Yosaee S, Soltani S, Sekhavati E and
Jazayeri S: Adropin-a novel biomarker of heart disease: A
systematic review article. Iran J Public Health. 45:1568–1576.
2016.PubMed/NCBI
|
|
19
|
Zhao LP, You T, Chan SP, Chen JC and Xu
WT: Adropin is associated with hyperhomocysteine and coronary
atherosclerosis. Exp Ther Med. 11:1065–1070. 2016.PubMed/NCBI View Article : Google Scholar
|
|
20
|
Sato K, Yamashita T, Shirai R, Shibata K,
Okano T, Yamaguchi M, Mori Y, Hirano T and Watanabe T: Adropin
contributes to anti-atherosclerosis by suppressing
monocyte-endothelial cell adhesion and smooth muscle cell
proliferation. Int J Mol Sci. 19:1293–1309. 2018.PubMed/NCBI View Article : Google Scholar
|
|
21
|
Mehran R, Dangas G, Abizaid AS, Mintz GS,
Lansky AJ, Satler LF, Pichard AD, Kent KM, Stone GW and Leon MB:
Angiographic patterns of in-stent restenosis: Classification and
implications for long-term outcome. Circulation. 100:1872–1878.
1999.PubMed/NCBI View Article : Google Scholar
|
|
22
|
Mintz GS, Nissen SE, Anderson WD, Bailey
SR, Erbel R, Fitzgerald PJ, Pinto FJ, Rosenfield K, Siegel RJ,
Tuzcu EM and Yock PG: American college of cardiology clinical
expert consensus document on standards for acquisition, measurement
and reporting of intravascular ultrasound studies (IVUS). A report
of the American college of cardiology task force on clinical expert
consensus documents. J Am Coll Cardiol. 37:1478–1492.
2001.PubMed/NCBI View Article : Google Scholar
|
|
23
|
Ray JL, Leach R, Herbert JM and Benson M:
Isolation of vascular smooth muscle cells from a single murine
aorta. Methods Cell Sci. 23:185–188. 2001.PubMed/NCBI View Article : Google Scholar
|
|
24
|
Liao N, Shi Y, Zhang C, Zheng Y, Wang Y,
Zhao B, Zeng Y, Liu X and Liu J: Antioxidants inhibit cell
senescence and preserve stemness of adipose tissue-derived stem
cells by reducing ROS generation during long-term in vitro
expansion. Stem Cell Res Ther. 10(306)2019.PubMed/NCBI View Article : Google Scholar
|
|
25
|
Jojima T, Uchida K, Akimoto K, Tomotsune
T, Yanagi K, Iijima T, Suzuki K, Kasai K and Aso Y: Liraglutide, a
GLP-1 receptor agonist, inhibits vascular smooth muscle cell
proliferation by enhancing AMP-activated protein kinase and cell
cycle regulation, and delays atherosclerosis in ApoE deficient
mice. Atherosclerosis. 261:44–51. 2017.PubMed/NCBI View Article : Google Scholar
|
|
26
|
National Research Council (US) Committee
for the Update of the Guide for the Care and Use of Laboratory
Animals: Guide for the care and use of laboratory animals, 8th
edition. National Academic Press (US), Washington, DC, 2011.
|
|
27
|
Livak KJ and Schmittgen TD: Analysis of
relative gene expression data using real-time quantitative PCR and
the 2(-Delta Delta C(T)) method. Methods. 25:402–408.
2001.PubMed/NCBI View Article : Google Scholar
|
|
28
|
Ghoshal S, Stevens JR, Billon C, Girardet
C, Sitaula S, Leon AS, Rao DC, Skinner JS, Rankinen T, Bouchard C,
et al: Adropin: An endocrine link between the biological clock and
cholesterol homeostasis. Mol Metab. 8:51–64. 2018.PubMed/NCBI View Article : Google Scholar
|
|
29
|
Stevens JR, Kearney ML, St-Onge MP,
Stanhope KL, Havel PJ, Kanaley JA, Thyfault JP, Weiss EP and Butler
AA: Inverse association between carbohydrate consumption and plasma
adropin concentrations in humans. Obesity (Silver Spring).
24:1731–1740. 2016.PubMed/NCBI View Article : Google Scholar
|
|
30
|
Zhu LH, Huang L, Zhang X, Zhang P, Zhang
SM, Guan H, Zhang Y, Zhu XY, Tian S, Deng K and Li H: Mindin
regulates vascular smooth muscle cell phenotype and prevents
neointima formation. Clin Sci (Lond). 129:129–145. 2015.PubMed/NCBI View Article : Google Scholar
|
|
31
|
Ding Y, Zhang M, Zhang W, Lu Q, Cai Z,
Song P, Okon IS, Xiao L and Zou MH: AMP-activated protein kinase
alpha 2 deletion induces VSMC phenotypic switching and reduces
features of atherosclerotic plaque stability. Circ Res.
119:718–730. 2016.PubMed/NCBI View Article : Google Scholar
|
|
32
|
Zhao Y, Shang F, Shi W, Zhang J, Zhang J,
Liu X, Li B, Hu X and Wang L: Angiotensin II receptor type 1
antagonists modulate vascular smooth muscle cell proliferation and
migration via AMPK/mTOR. Cardiology. 143:1–10. 2019.PubMed/NCBI View Article : Google Scholar
|
|
33
|
Cuculi F, Bossard M, Zasada W, Moccetti F,
Voskuil M, Wolfrum M, Malinowski KP, Toggweiler S and Kobza R:
Performing percutaneous coronary interventions with predilatation
using non-compliant balloons at high-pressure versus conventional
semi-compliant balloons: Insights from two randomised studies using
optical coherence tomography. Open heart. 7(e001204)2020.PubMed/NCBI View Article : Google Scholar
|
|
34
|
Cassese S, De Luca G, Ribichini F,
Cernigliaro C, Sansa M, Versaci F, Proietti I, Stankovic G,
Stojkovic S, Fernandez-Pereira C, et al: ORAl iMmunosuppressive
therapy to prevent in-stent rEstenosiS (RAMSES) cooperation: A
patient-level meta-analysis of randomized trials. Atherosclerosis.
237:410–417. 2014.PubMed/NCBI View Article : Google Scholar
|
|
35
|
Xie H, Yang J, Han Y, Zhu X and Fang Q:
Inhibition of intimal hyperplasia via local delivery of vascular
endothelial growth factor cDNA nanoparticles in a rabbit model of
restenosis induced by abdominal aorta balloon injury. Exp Ther Med.
10:55–61. 2015.PubMed/NCBI View Article : Google Scholar
|
|
36
|
Theodoropoulos K, Mennuni MG, Dangas GD,
Meelu OA, Bansilal S, Baber U, Sartori S, Kovacic JC, Moreno PR,
Sharma SK, et al: Resistant in-stent restenosis in the drug eluting
stent era. Catheter Cardiovasc Interv. 88:777–785. 2016.PubMed/NCBI View Article : Google Scholar
|
|
37
|
Jensen LO, Vikman S, Antonsen L, Kosonen
P, Niemelä M, Christiansen EH, Kervinen K, Erglis A, Harnek J,
Kumsars I, et al: Intravascular ultrasound assessment of minimum
lumen area and intimal hyperplasia in in-stent restenosis after
drug-eluting or bare-metal stent implantation. The nordic
intravascular ultrasound study (NIVUS). Cardiovasc Revasc Med.
18:577–582. 2017.PubMed/NCBI View Article : Google Scholar
|
|
38
|
Nakamura D, Yasumura K, Nakamura H,
Matsuhiro Y, Yasumoto K, Tanaka A, Matsunaga-Lee Y, Yano M, Yamato
M, Egami Y, et al: Different neoatherosclerosis patterns in
drug-eluting- and bare-metal stent restenosis-optical coherence
tomography study. Circ J. 83:313–319. 2019.PubMed/NCBI View Article : Google Scholar
|
|
39
|
Ando H, Amano T, Takashima H, Harada K,
Kitagawa K, Suzuki A, Kunimura A, Shimbo Y, Harada K, Yoshida T, et
al: Differences in tissue characterization of restenotic neointima
between sirolimus-eluting stent and bare-metal stent: integrated
backscatter intravascular ultrasound analysis for in-stent
restenosis. Eur Heart J Cardiovasc Imaging. 14:996–1001.
2013.PubMed/NCBI View Article : Google Scholar
|
|
40
|
Zhao SG, Xu JJ, Tao ZH, Jin L, Liu Q,
Zheng WY, Jiang LQ and Wang NF: CHA2DS2-Vasc
score and CHA2DS2-Vasc-HS score are poor
predictors of in-stent restenosis among patients with coronary
drug-eluting stents. J Int Med Res. 47:2533–2544. 2019.PubMed/NCBI View Article : Google Scholar
|
|
41
|
Umeda H, Kawai T, Misumida N, Ota T,
Hayashi K, Iwase M, Izawa H, Sugino S, Shimizu T, Takeichi Y, et
al: Impact of sirolimus-eluting stent fracture on 4-year clinical
outcomes. Circ Cardiovasc Interv. 4:349–354. 2011.PubMed/NCBI View Article : Google Scholar
|
|
42
|
Kubo S, Kadota K, Ozaki M, Ichinohe T,
Eguchi H, Miyake K, Hyodo Y, Saito N, Otsuji H, Otsuru S, et al:
Difference in clinical and angiographic characteristics of very
late stent thrombosis between drug-eluting and bare-metal stent
implantations. Circ J. 77:1453–1460. 2013.PubMed/NCBI View Article : Google Scholar
|
|
43
|
Conway C, Desany GJ, Bailey LR, Keating
JH, Baker BL and Edelman ER: Fracture in drug-eluting stents
increases focal intimal hyperplasia in the atherosclerosed rabbit
iliac artery. Catheter Cardiovasc Interv. 93:278–285.
2019.PubMed/NCBI View Article : Google Scholar
|
|
44
|
Bochaton-Piallat ML and Gabbiani G:
Modulation of smooth muscle cell proliferation and migration: Role
of smooth muscle cell heterogeneity. Atherosclerosis: Diet and
Drugs. Springer, Berlin, Heidelberg, pp645-663, 2005.
|
|
45
|
Lovren F, Pan Y, Quan A, Singh KK, Shukla
PC, Gupta M, Al-Omran M, Teoh H and Verma S: Adropin is a novel
regulator of endothelial function. Circulation. 122 (Suppl
11):S185–S192. 2010.PubMed/NCBI View Article : Google Scholar
|
|
46
|
Herzig S and Shaw RJ: AMPK: Guardian of
metabolism and mitochondrial homeostasis. Nat Rev Mol Cell Biol.
19:121–135. 2018.PubMed/NCBI View Article : Google Scholar
|
|
47
|
Stone JD, Narine A, Shaver PR, Fox JC,
Vuncannon JR and Tulis DA: AMP-activated protein kinase inhibits
vascular smooth muscle cell proliferation and migration and
vascular remodeling following injury. Am J Physiol Heart Circ
Physiol. 304:H369–H381. 2013.PubMed/NCBI View Article : Google Scholar
|
|
48
|
Osman I and Segar L: Pioglitazone, a PPARγ
agonist, attenuates PDGF-induced vascular smooth muscle cell
proliferation through AMPK-dependent and AMPK-independent
inhibition of mTOR/p70S6K and ERK signaling. Biochem Pharmacol.
101:54–70. 2016.PubMed/NCBI View Article : Google Scholar
|
|
49
|
Nagata D, Takeda R, Sata M, Satonaka H,
Suzuki E, Nagano T and Hirata Y: AMP-activated protein kinase
inhibits angiotensin II-stimulated vascular smooth muscle cell
proliferation. Circulation. 110:444–451. 2004.PubMed/NCBI View Article : Google Scholar
|
|
50
|
Igata M, Motoshima H, Tsuruzoe K, Kojima
K, Matsumura T, Kondo T, Taguchi T, Nakamaru K, Yano M, Kukidome D,
et al: Adenosine monophosphate-activated protein kinase suppresses
vascular smooth muscle cell proliferation through the inhibition of
cell cycle progression. Circ Res. 97:837–844. 2005.PubMed/NCBI View Article : Google Scholar
|
|
51
|
Peyton KJ, Yu Y, Yates B, Shebib AR, Liu
XM, Wang H and Durante W: Compound C inhibits vascular smooth
muscle cell proliferation and migration in an AMP-activated protein
kinase-independent fashion. J Pharmacol Exp Ther. 338:476–484.
2011.PubMed/NCBI View Article : Google Scholar
|
|
52
|
Song P, Wang S, He C, Wang S, Liang B,
Viollet B and Zou MH: AMPKalpha2 deletion exacerbates neointima
formation by upregulating Skp2 in vascular smooth muscle cells.
Circ Res. 109:1230–1239. 2011.PubMed/NCBI View Article : Google Scholar
|
|
53
|
Kim SY, Jeoung NH, Oh CJ, Choi YK, Lee HJ,
Kim HJ, Kim JY, Hwang JH, Tadi S, Yim YH, et al: Activation of
NAD(P)H:Quinone oxidoreductase 1 prevents arterial restenosis by
suppressing vascular smooth muscle cell proliferation. Circ Res.
104:842–850. 2009.PubMed/NCBI View Article : Google Scholar
|
|
54
|
Smith BK and Steinberg GR: AMP-activated
protein kinase, fatty acid metabolism, and insulin sensitivity.
Curr Opin Clin Nutr Metab Care. 20:248–253. 2017.PubMed/NCBI View Article : Google Scholar
|
|
55
|
Bonnefont JP, Djouadi F, Prip-Buus C,
Gobin S, Munnich A and Bastin J: Carnitine palmitoyltransferases 1
and 2: Biochemical, molecular and medical aspects. Mol Aspects Med.
25:495–520. 2004.PubMed/NCBI View Article : Google Scholar
|
|
56
|
Ferdinandusse S, Denis S, Van Roermund CW,
Wanders RJ and Dacremont G: Identification of the peroxisomal
beta-oxidation enzymes involved in the degradation of long-chain
dicarboxylic acids. J Lipid Res. 45:1104–1111. 2004.PubMed/NCBI View Article : Google Scholar
|
|
57
|
Lochner M, Berod L and Sparwasser T: Fatty
acid metabolism in the regulation of T cell function. Trends
Immunol. 36:81–91. 2015.PubMed/NCBI View Article : Google Scholar
|
|
58
|
Gao S, McMillan RP, Jacas J, Zhu Q, Li X,
Kumar GK, Casals N, Hegardt FG, Robbins PD, Lopaschuk GD, et al:
Regulation of substrate oxidation preferences in muscle by the
peptide hormone adropin. Diabetes. 63:3242–3252. 2014.PubMed/NCBI View Article : Google Scholar
|
|
59
|
Thapa D, Stoner MW, Zhang M, Xie B,
Manning JR, Guimaraes D, Shiva S, Jurczak MJ and Scott I: Adropin
regulates pyruvate dehydrogenase in cardiac cells via a novel
GPCR-MAPK-PDK4 signaling pathway. Redox Biol. 18:25–32.
2018.PubMed/NCBI View Article : Google Scholar
|
|
60
|
Gobin S, Thuillier L, Jogl G, Faye A, Tong
L, Chi M, Bonnefont JP, Girard J and Prip-Buus C: Functional and
structural basis of carnitine palmitoyltransferase 1A deficiency. J
Biol Chem. 278:50428–50434. 2003.PubMed/NCBI View Article : Google Scholar
|
|
61
|
Oaxaca-Castillo D, Andreoletti P, Vluggens
A, Yu S, Van Veldhoven PP, Reddy JK and Cherkaoui-Malki M:
Biochemical characterization of two functional human liver acyl-CoA
oxidase isoforms 1a and 1b encoded by a single gene. Biochem
Biophys Res Commun. 360:314–319. 2007.PubMed/NCBI View Article : Google Scholar
|
|
62
|
Wu L, Fang J, Chen L, Zhao Z, Luo Y, Lin C
and Fan L: Low serum adropin is associated with coronary
atherosclerosis in type 2 diabetic and non-diabetic patients. Clin
Chem Lab Med. 52:751–758. 2014.PubMed/NCBI View Article : Google Scholar
|