Introduction
The main cause of chronic low back pain identified
clinically is intervertebral disc degeneration (IVDD), which
seriously affects physical and mental health and consumes a lot of
manpower and financial resources every year. At present, the
commonly used clinical drugs and surgical treatments are not able
to fundamentally resolve the disease itself, and the recurrence
rate is high. Therefore, it is particularly necessary to develop a
more efficient and thorough strategy for its effective treatment.
IVDD is a multifactorial etiological process, and the specific
mechanism underlying it remains unclear. It is generally considered
to be caused by ageing, lifestyle, genetic predisposition and
certain non-physiological mechanical loads. These variables can
induce an imbalance in the anabolic and catabolic environments of
the extracellular matrix of the intervertebral disc, which causes
the nucleus pulposus (NP) cells to undergo apoptosis, senescence
and inflammation (1-3).
Exosomes are tiny extracellular vesicles with a
double-layer lipid membrane structure and a diameter of 30-150 nm.
They are secreted by mammals and are present in a variety of body
fluids, including blood, cell fluid, breast milk and urine
(4). Although they were originally
considered to be cellular waste, they have since been shown to have
a variety of purposes and to be crucial intercellular communication
mediators in several pathological and physiological processes
(5,6). Exosomes carry proteins, lipids,
microRNAs (miRNAs) and some other RNAs, but a number of their
biological effects have been suggested to be attributed to miRNAs,
which are involved in various physiological and pathological
processes (7-9).
Several studies have confirmed that the miRNA components of
exosomes can slow down IVDD by inhibiting the apoptosis of lumbar
NP cells (10-12).
In the present study, exosomal miRNAs were isolated
from chondrocytes before and after degeneration. Sequencing and
bioinformatics analysis were then performed on the two groups of
exosomal miRNAs. Quantitative analysis of the miRNAs was followed
by the screening of differentially expressed (DE) miRNAs,
prediction of miRNA target genes (TGs), as well as the functional
annotation and enrichment analysis of the DE miRNA TGs. In
addition, known miRNAs were identified and new miRNAs were
predicted.
Materials and methods
Animals and cell collection
One-week-old Sprague Dawley (SD) rats were used. Due
to the protective effect of estrogen on chondrocytes (13), these rats were selected for use in
the present study. They were donated by Nanjing Qinglongshan Zoo
(Nanjing, China) and were maintained under standard specific
pathogen-free conditions. The rats were housed in a stainless-steel
cage with a 12-h light/dark cycle at 25˚C, 40-70% relative humidity
and water and rat food pellets were given on time every day. For
chondrocyte isolation, six 1-week-old female SD rats weighing
~20-30 g were selected. The rats were euthanized via the
intraperitoneal injection of 200 mg/kg pentobarbital sodium, which
induced respiratory arrest. After the rat lumbar vertebrae were
immersed in 75% ethanol for 20 min at room temperature, lumbar
tissues were harvested. The spine was then soaked in PBS and 2%
penicillin/streptomycin for 10 min at 37˚C. The endplate cartilage
was removed from the intervertebral discs, cut up in an Eppendorf
(EP) tube and digested with 0.2% trypsin for 20 min at 37˚C. After
digestion, DMEM/F-12 GlutaPlus, HEPES (cat. no. G4612; Servicebio)
medium containing 15% fetal bovine serum (FBS; cat. no. SA220119;
Procell) was added to the EP tube, and the supernatant was removed
by centrifugation at 157 x g for 2 min at 4˚C. Removal of the
supernatant was performed three times by centrifugation in the same
manner. The obtained precipitate was digested with 0.2% collagenase
for 4 h at 37˚C. Subsequently, the primary rat endplate
chondrocytes were obtained by filtration using a 70-µm cell sieve,
washed with PBS and inoculated in Petri dishes. Finally, DMEM/F12
with 15% FBS and 1% penicillin/streptomycin was added and the
chondrocytes were cultured in an incubator at 37˚C with 5% carbon
dioxide. The supernatant was extracted and stored at 80˚C until the
cells reached 80-90% confluence. Cells were subcultured in two
10-cm dishes to 80-90% confluence and the supernatant was again
collected and stored at 80˚C. Cell morphology was observed and
photographic images were captured daily. The morphology of the
cells was consistent with those of endplate chondrocytes. When the
chondrocytes were cultured in vitro, fibrosis of
chondrocytes became evident in the third generation, as the
chondrocytes exhibited a long fusiform morphology, and the growth
rate began to slow down. After the fourth passage, the cell
morphology became more pronounced, and by the sixth passage, the
cell morphology was mostly long fusiform, similar to fibroblast
morphology. As the cells gradually differentiated, degeneration
ensued. Based on the morphological appearance of the cells,
third-generation chondrocytes were used as the pre-degeneration
cells, and the fifth-generation chondrocytes were used as the
post-degeneration cells. The cell supernatants were stored at -80˚C
for 48-72 h and then added to DMEM/F12 medium with 15% FBS and 1%
penicillin/streptomycin to maintain the culture. The Animal
Research Committee of Yijishan Hospital of Wannan Medical College
(Wuhu, China) approved the experimental protocol (approval no.
LLSC-2022-099).
Exosome isolation and RNA
extraction
Prior to and following degeneration, particles
>0.45 µm in diameter were removed from the cell culture
supernatant by passing it through a 0.45-µm filter. The purified
supernatants were combined using an exoEasy membrane (cat. no.
76064; Qiagen GmbH) affinity centrifuge column with Buffer XBP
(1:1), centrifuged at 500 x g for 1 min at 4˚C and then washed with
Buffer XWP. The mixed exosomes were centrifuged at 4,000 x g for 5
min at 4˚C, and after changing the centrifuge tube, three
independent elutions in 500 µl Buffer XE were performed. The elutes
were stored at -80˚C.
TRIzol® (Thermo Fisher Scientific, Inc.)
was used to extract RNA from the samples. To certify the samples
for transcriptome sequencing, the purity, concentration and
integrity of the RNA samples were verified by Implen
ultramicroultraviolet spectrophotometry (NP40).
Western blot (WB) analysis
A lysis solution containing a protease inhibitor
cocktail was used to extract the total protein from the exosomes.
The lysis solution consisted of 1 ml RIPA lysate combined with 10
µl PMSF, both from Beyotime Institute of Biotechnology. After
lysis, a bicinchoninic acid protein concentration assay kit (cat.
no. PC0020; Solarbio) was used to detect the protein concentration
according to the operating instructions of the kit. Subsequently,
20 µg total protein/lane was separated on a 10% SDS-PAGE gel and
transferred to a polyvinylidene difluoride (PVDF) membrane
(MilliporeSigma). The PVDF membrane was then cleaned once with
TBST. Membranes were then immersed in the blocking solution (cat.
no. P0023B; Beyotime Institute of Biotechnology) and blocked for 2
h at room temperature with gentle shaking, followed by washing with
TBST once. After blocking, the membranes were incubated with
1:1,000 diluted anti-heat shock protein 70 (HSP70) (cat. no.
4876T), anti-alix (cat. no. 2171T), anti-flotillin-1 (cat. no.
18634T) and anti-annexin V (cat. no. 8555T; all from Cell Signaling
Technology, Inc.) antibodies overnight at 4˚C. ECL WB Substrate
(cat. no. PE0010; Beijing Solarbio Science & Technology Co.,
Ltd.) was applied to the PVDF membrane for exposure photography
after incubation with horseradish peroxidase (HRP)-conjugated
anti-rabbit IgG (cat. no. SE134) or HRP-conjugated anti-rat IgG
secondary antibodies (cat. no. SE131; both from Beijing Solarbio
Science & Technology Co., Ltd.) at room temperature for 1 h.
Image processing was performed using ImageJ 1.8 software (National
Institutes of Health) for gray value analysis.
Electron microscopy
Transmission electron microscopy was used to study
the morphology of the exosomes. Briefly, the suspended exosomes
were diluted with PBS and then each sample was put onto a
carbon-coated copper grid. The exosomes were allowed to precipitate
for 10 min and then the remaining solution was adsorbed with
air-flow mesh paper.
Following immersion in 3% glutaraldehyde at room
temperature for 5 min, the mesh was rinsed 10 times with deionized
water. The copper grid was then exposed to 4% uranyl acetate
solution at room temperature for 10 min followed by 1%
methylcellulose solution at room temperature for 5 min. The samples
were dried and inspected using transmission electron microscopy
after 30 min.
Particle size analysis
ZetaView series nanoparticle tracking analyzer
(Particle Metrix GmbH) was performed to examine the size
distribution of the isolated exosomes. PBS was used to dilute the
exosomes. ZetaView software version 8.05.11 (Particle Metrix GmbH)
was used to examine the size and concentration of the
nanoparticles. The Brownian motion of the extracted nanoparticles
was also recorded.
Library preparation for small RNA
(sRNA) sequencing and classification
Utilizing the HiSeq 2500 platform (Illumina Inc.),
RNA sequencing (cat. no. R0024; Beyotime Institute of
Biotechnology) was carried out. In brief, adapters were connected
to the 3' and 5' ends of the RNAs. This was followed by reverse
transcription (RT) for first-strand synthesis (size selection,
50-200 bp). The reaction solution was prepared according to the
real-time PCR reaction system. Double-distilled water
(DDH2O), SYBRGreen qPCR Master Mix, Forward primer,
Reverse primer and cDNA template were added to the PCR reaction
tube and mixed thoroughly. For fragment screening, polyacrylamide
gel electrophoresis was performed, with rubber cutting recycling of
the fragments to produce sRNA libraries. The PCR products were
purified using Agencourt AMPure XP technology (Beckman Coulter,
Inc.) and library quality was evaluated. The raw sequences obtained
by sequencing contained adaptor sequences or low-quality sequences.
In order to ensure the accuracy of information analysis, quality
control of the raw data is required to obtain high-quality
sequences (that is, Clean): i) The adaptor was removed; ii)
sequences shorter than 15 nucleotides or longer than 35 nucleotides
were removed; iii) For each sample, the sequence with low quality
value was removed; iv) reads with the content of unknown base N (N
is the base that cannot be identified) greater than or equal to 10%
were removed. A TruSeq PE Cluster Kit v4-cBot-HS (Illumina, Inc.)
was used to cluster the index-coded samples on a cBot Cluster
Generation System according to the manufacturer's instructions. The
libraries were sequenced on the Illumina platform after cluster
creation and single-end reads (15-35 bp) were produced. Small RNA
sequencing of two samples was completed, and a total of 31.61 M
Clean Reads were obtained.
Using Bowtie software (v1.0.0) (14), clean reads were filtered with the
Silva, GtRNAdb, Rfam and Repbase databases to remove ribosomal RNA
(rRNA) (15-18),
transfer RNA (tRNA), small nuclear RNA (snRNA), small nucleolar RNA
(snoRNA), other non-coding RNA (ncRNA) and repetitions. By
comparing the remaining reads with the genome and known tRNAs from
miRBase version 22 (http://www.mirbase.org/), known and new miRNAs were
identified. For the prediction of the secondary structures of new
miRNAs, Randfold software (http://bioinformatics.psb.ugent.be/supplementary_data/erbon/nov2003/)
was used.
Sequencing data analysis
Reads from the reference genome were matched to
mature sequences of known miRNAs using miRBase with a range of 2
nucleotides (nt) upstream and 5 nt downstream in order to identify
known miRNAs, allowing at most one mismatch. The reads identified
were considered to be known miRNAs. The majority of miRNA
transcription start sites are found in introns, gene spacers and
the reverse complementary regions of coding sequences. miRNA
precursors have a distinctive hairpin shape, and splicing by
Dicer/Dicer-like enzymes results in the production of mature
bodies. The program miRDeep2(19)
was used to predict novel miRNA in the deep sequencing data based
on the biological properties of miRNA. By comparing reads with
genome position data, the miRDeep2 software identified potential
precursor sequences. A Bayesian model was used to assess energy
information for the precursor structure using RNAfold (version
2.1.7) (20) and the read
distribution on the precursor sequence, considering features
associated with miRNA synthesis, mature sequence characteristics,
star sequences and loops, and thereby predict novel miRNA. miRDeep2
is mostly utilized for the prediction of miRNA in animals (19), but by modifying the parameters and
altering the scoring scheme, it can also be used for the prediction
of miRNA in plants (21). The
miRNA expression levels of each sample were counted and then
normalized using the transcript per million (TPM) method (22). The TPM normalization formula is as
follows: TPM=(read count x 1,000,000)/mapped reads. The term read
count represents the number of reads for a specific miRNA, and the
term mapped reads represents the number of reads relative to all
miRNAs.
It is important to choose appropriate software for
differential expression analysis when attempting to identify DE
miRNAs. For biological repeat experiments, DESeq2(23) is appropriate, while for the
acquisition of DE miRNA sets between two biological situations,
differential expression analysis between sample groups may be used.
EdgeR (24) can be utilized to
identify DE miRNAs between two samples in studies without
biological replication. In the present study, the relative
expression levels of the two (groups) samples were compared using
DESeq2 and the DE miRNAs were classified as upregulated or
downregulated miRNAs.
The screening threshold for the discovery of DE
miRNAs was based on the fold change (FC) in expression as follows:
|log2 (FC)|≥0.58; P<0.05. The P-value conveys the
probability of there being no difference between the two groups.
The differential expression analysis of miRNA is an independent
statistical test for the expression of a large number of miRNAs and
false positives may exist. Therefore, the Benjamini-Hochberg method
was used to correct the P-values used in the identification of DE
miRNAs, and reduce the false discovery rate (FDR).
miRNA TG prediction and pathway
analysis
Based on gene sequencing data for the respective
species and newly predicted miRNAs, miRanda (25) and TargetScan (26) were used for the prediction of TGs
in animals. TG sequences were compared with the NR (27), Swiss-Prot (28), GO (29), Clusters of Orthologous Groups of
Proteins (30), KEGG (31), eggNOG (32), Eukaryotic Orthologous Groups
(33) and Pfam (34) databases using the BLAST program to
annotate the TGs. Gene Ontology (GO) enrichment analysis
(http://www.geneontology.org/) of the TGs
was performed using the goseq R tool (35) to implement Wallenius non-central
hypergeometric distribution-based testing. The Kyoto Encyclopedia
of Genes and Genomes (KEGG) database (36) facilitates the understanding of
high-level biological system functions and utilities based on
molecular-level information, particularly large-scale genome
sequencing datasets and other high-throughput technologies
(http://www.genome.jp/kegg/). To examine
the statistical enrichment of the TGs in KEGG pathways, KOBAS
(37) software was utilized.
Culture and treatment of NP cells
The caudal skin of 1-week-old SD rats was cut with a
knife and the tail skin of the rats was peeled off along the
incision. Two hands held the vertebral bodies on both sides of the
intervertebral disc and the punctured intervertebral disc was
squeezed in different directions to squeeze out the gel-like
nucleus pulposus. After washing with PBS, the NP was cut into small
pieces and digested with 0.5% type II collagenase (Roche
Diagnostics) for 2 h at room temperature. Cells were obtained and
maintained in DMEM/F12 basic medium containing 10% FBS and 100 U/ml
penicillin-streptomycin in a humidified incubator containing 5%
CO2 at 37˚C.
NP cell and exosome co-culture
Exosomes were labeled with DiI (cat. no. D4010;
Uelandy) for in vivo tracer experiments. NP cells
(1x10⁶) cultured in DMEM/F12 were seeded in a 6-well
plate and then 20 µg/ml exosomes from the pre- and
post-degeneration groups were added. A normal cell group comprising
only NP cells was also established. The cells were harvested 48 h
later and subsequently used for RT-quantitative PCR (RT-qPCR) and
WB experiments.
Total RNA extraction
Nucleus pulposus cells were digested with trypsin
and collected into 1.5 ml RNase-free centrifuge tubes by
centrifugation at 157 x g, 5˚C for 5 min. RNA was then extracted
using a Total RNA Isolation kit (cat. no. B511321; Sangon Biotech
Co., Ltd.). Total RNA was extracted according to the instructions
of the total RNA kit. This comprised the addition of 500 µl lysis
solution to the RNA, blowing repeatedly and allowing to stand for
5-10 min at room temperature. Subsequently, 0.2 ml chloroform was
added and the mixture was shaken vigorously at room temperature for
30 sec and then left at room temperature for 3 min, followed by
centrifugation at 16,000 x g and 4˚C for 10 min. The upper aqueous
phase was transferred to a clean centrifuge tube, and one-half
volume of anhydrous ethanol was added and mixed in. This mixture
was then added to the adsorption column in the collection tube
using a pipette. After standing for 2 min, the tube was centrifuged
at 16,000 x g for 3 min at 4˚C and the supernatant was removed. The
adsorption column was again placed in the collection tube, 500 µl
RPE solution was added, and after standing for 2 min and
centrifugation at 11,000 x g for 30 sec at 4˚C, the supernatant was
removed; this process was repeated once. The adsorption column was
returned to the collection tube, centrifuged for 2 min at 11,000 x
g at 4˚C and then placed in a clean 1.5-ml centrifuge tube.
Finally, 30 µl diethylpyrocarbonate-treated DDH2O was
added to the center of the adsorption membrane and the RNA was
centrifuged at 16,000 x g for 2 min at 4˚C. The RNA solution was
stored at -70˚C for use in subsequent experiments. After total RNA
was extracted, 1 µl RNA was added to a microcuvette with a German
Implen ultramicroultraviolet spectrophotometer (NP40) and the
absorbance was measured at wavelengths of 230, 260 and 280 nm. The
machine automatically calculated and displayed the content and
purity of RNA.
Synthesis of cDNA
A cDNA synthesis kit (cat. no. AE311; TransGen
Biotech) was used to synthesize cDNA from the RNA. The RT reaction
mixture comprised 7 µl RNA, 1 µl random primer, 10 µl 2xES Reaction
Mix, 1 µl EasyScript® RT/RI Enzyme Mix and 1 µl gDNA
remover. The mixture was incubated at 25˚C for 10 min and at 42˚C
for 15 min. It was then inactivated at 85˚C for 5 sec and stored at
-20˚C.
qPCR amplification
The qPCR primers were synthesized by Shanghai
Shenggong Biology Engineering Technology Service, Ltd. and their
sequences are shown in Table I.
The qPCR reaction system comprising DDH2O, SYBR green
qPCR Master Mix (cat. no. AQ101-01; TransGen Biotech), forward and
reverse primers and cDNA templates was prepared, added to PCR
reaction tubes and thoroughly mixed. The reaction system comprised
10 µl qPCR mix, 0.5 µl forward primer (10 µM), 0.5 µl reverse
primer (10 µM), 2 µl cDNA and 7 µl nuclease-free water (total
volume, 20 µl). PCR amplification was performed using the following
steps: One cycle of predegeneration at 94˚C for 30 sec, and 40
cycles of denaturation at 94˚C for 5 sec and annealing at 61˚C for
35 sec. Finally, 1 cycle of melting curve analysis was performed at
97˚C for 10 sec, 65˚C for 60 sec and 97˚C for 1 sec.
 | Table IPrimer sequences. |
Table I
Primer sequences.
| Primer | Sequence
(5'-3') |
|---|
| GAPDH-F |
GGAAAGCTGTGGCGTGAT |
| GAPDH-R |
TCCACAACGGATACATTGGG |
| Col1A1-F |
CCCACTGGGCTTATGATACC |
| Col1A1-R |
GGCTCCTTCAATAGTCCGAG |
| Col2A1-F |
TTCCTTGACATTGCACCTCT |
| Col2A1-R |
ATCCTTCTCTTTTGCCCACA |
| Aggrecan-F |
GGGCAGAAGAAAGATCGCT |
| Aggrecan-R |
CTCCGTGTGGGTCTCATCG |
Analysis of protein expression in NP
cells by WB
The expression of aggrecan (cat. no. sc377219),
collagen (Col)1A (cat. no. sc293182) and Col2A (cat. no. ab34712;
all from Santa Cruz Biotechnology, Inc.) in NP cells cocultured
with pre- and post-degeneration exosomes and the NP cell control
was analyzed using the aforementioned WB procedure for exosome
markers.
Fluorescence imaging
NP cells in DMEM/F12 were inoculated into the wells
of a 6-well plate at a density of 5x10⁵ cells/well. The
next day, green fluorescent protein (GFP) was introduced into the
cells by transfection with 2 µl lentivirus phHSI-GFP (cat. no.
TSPLA10289; Testobio). A fluorescence quenching agent containing
DAPI was used to seal the cell layer and images were collected
under a fluorescence microscope.
Statistical analysis
The chi-square test was used to compare the
percentage of unannotated reads of exosomes pre- and
post-degeneration using SPSS 22.0 (IBM). Bonferroni's test was used
to compare the exosome concentration, relative mRNA expression and
relative protein levels between the two groups using SPSS 22.0 (IBM
Corporation). Differential expression analysis of two
conditions/groups was carried out using the DESeq2 R tool (version
1.10.1), which uses a model based on a negative binomial
distribution to identify differential expression in digital miRNA
expression data. The Benjamini-Hochberg method for reducing the FDR
was used to modify the obtained P-values. DESeq2 was used to
classify miRNAs with |log2(FC)|≥0.58; P<0.05 as DE
miRNAs.
Results
Characterization of exosomes from
endplate chondrocytes
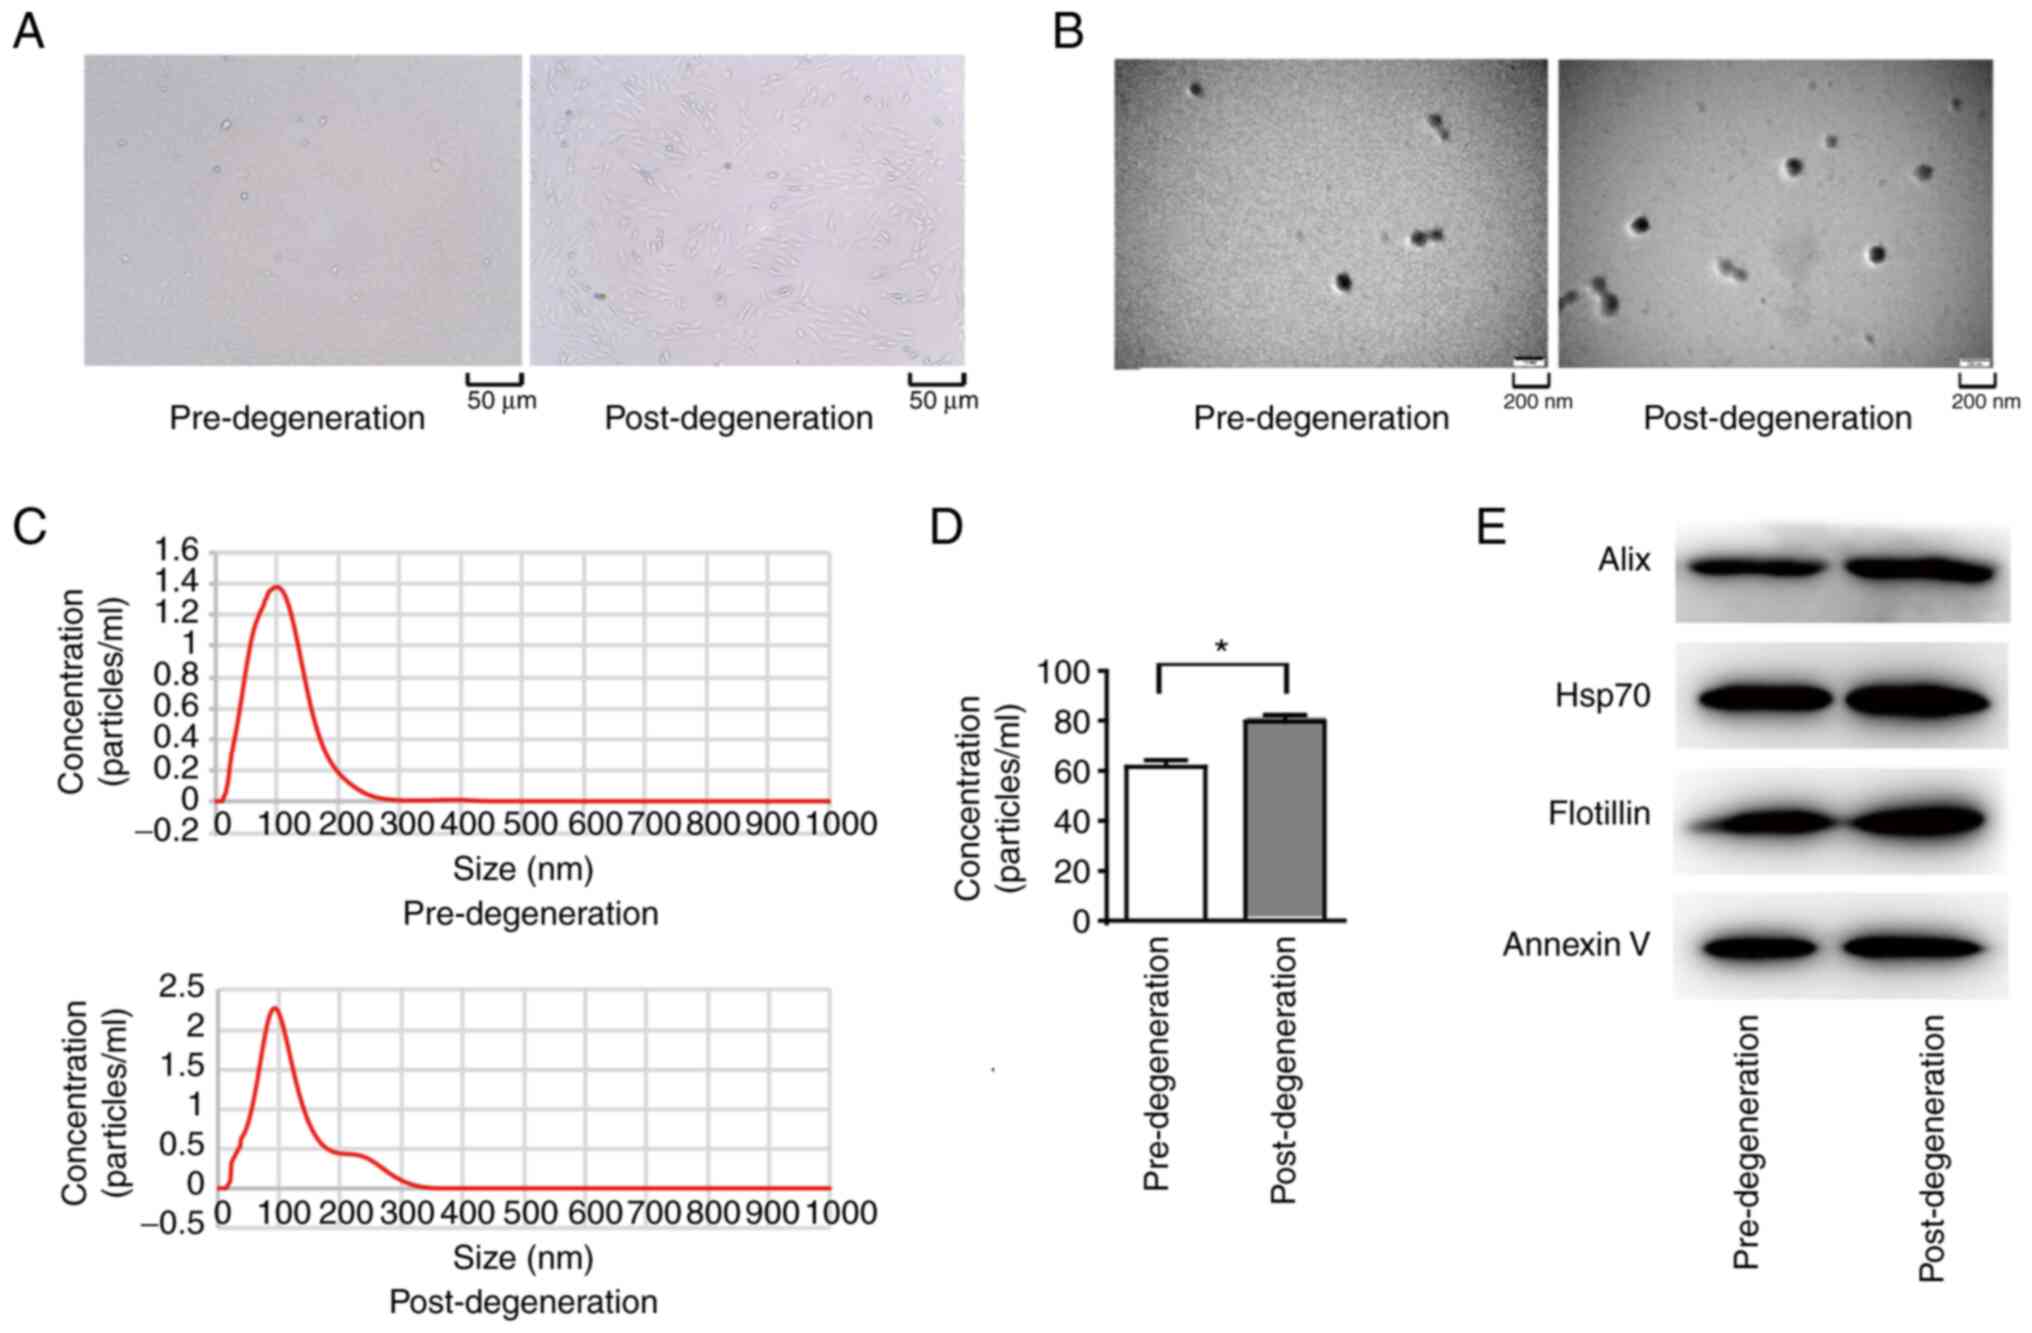
The histological features of endplate chondrocytes
before and after degeneration were examined. The number of endplate
chondrocytes was lower post-degeneration than pre-degeneration, as
shown in Fig. 1A. Electron
microscopy showed that the exosomes obtained from the endplate
chondrocytes were cup-shaped (Fig.
1B). The median diameter of the isolated exosomes was ~100 nm,
according to the NTA results (Fig.
1C). The concentration of chondrogenic exosomes in the endplate
increased markedly following degeneration (P<0.01), from ~60
mg/ml before degeneration to ~80 mg/ml after degeneration (Fig. 1D). Finally, exosome markers were
examined using WB and the results revealed the presence of the
exosome markers alix, HSP70, flotillin and annexin V in the
particles (Fig. 1E).
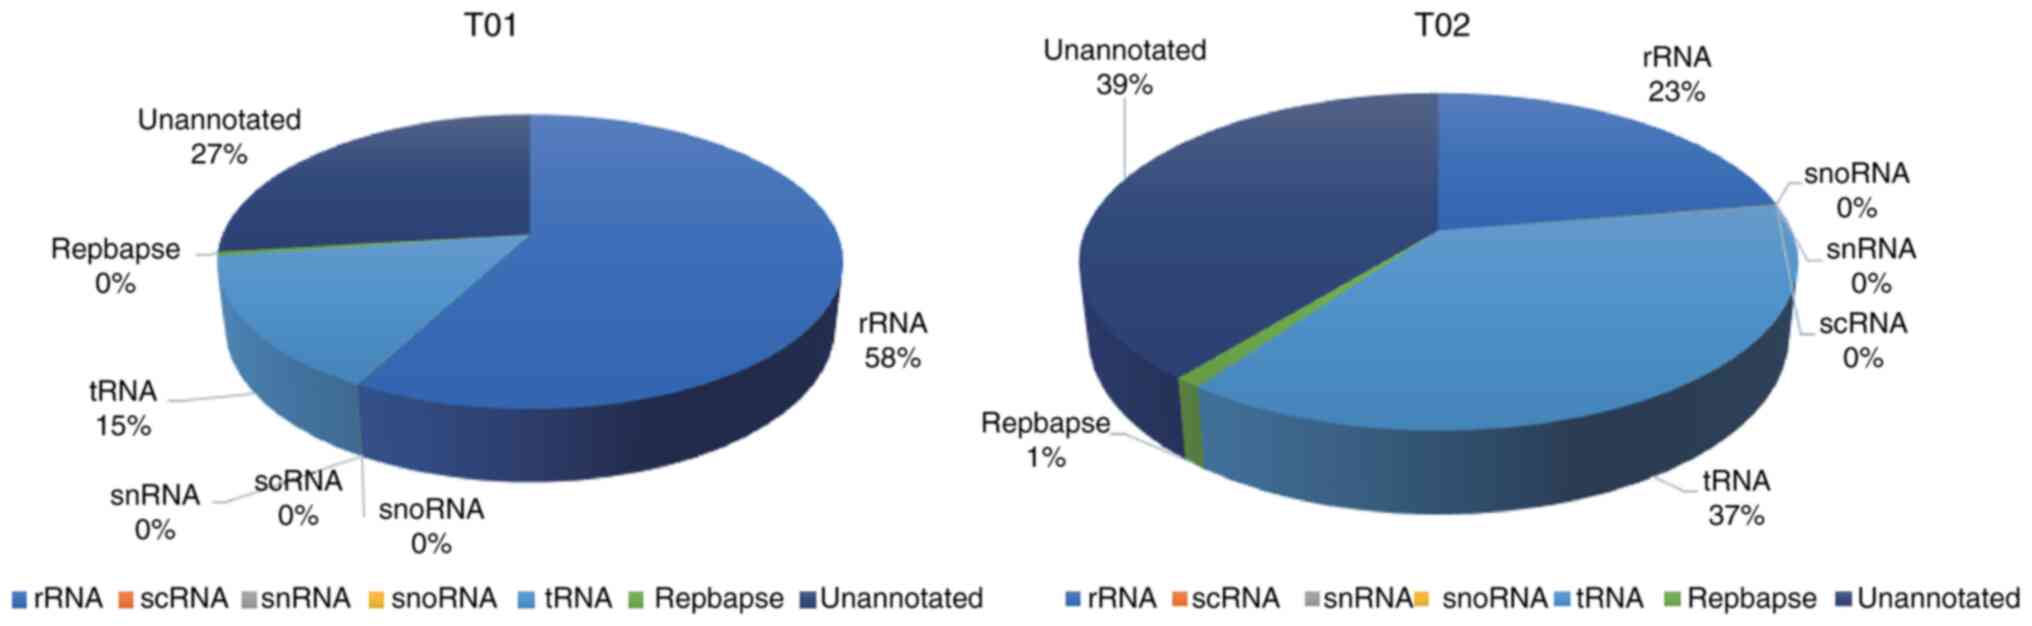
sRNA classification
Numerous forms of sRNA, including miRNA, tRNA, rRNA,
snRNA, snoRNA, small conditional RNA and unannotated RNAs, have
been shown to be present in exosomes (38). Clean reads were filtered using
various databases via the Bowtie program, which removed ncRNAs such
as rRNA, tRNA, snRNA, snoRNA and repeated sequences to provide
unannotated reads containing miRNA. No significant difference was
detected between pre- and post-degeneration exosomes (P=0.07) with
regard to the percentage of unannotated reads containing miRNA in
the total sRNA extracted from pre- and post-degeneration exosomes,
which equated to 26.89 and 39.13%, respectively (Fig. 2).
In total, sRNA sequencing was performed for the pre-
and post-degeneration exosomes and a total of 479 miRNAs were
found, comprising 190 newly predicted miRNAs and 289 known miRNAs
205 and 263 well-known miRNAs were detected in the exosomes pre-
and post-degeneration, respectively, using miRBase 22.0 as a
reference. Let-7i-5p, miR-21-5p, miR-3473, miR-148a-3p, miR-26a-5p,
miR-99a-5p, let-7b-5p, miR-146a-5p, rno-miR-143-3p and
rno-miR-221-3p were the top 10 miRNAs with the highest levels of
expression in the pre- and post-degeneration exosomes (Table II).
| Table IITop 10 most highly expressed miRNAs
in pre- and post-degeneration exosomes. |
Table II
Top 10 most highly expressed miRNAs
in pre- and post-degeneration exosomes.
| Identity | T01 (TPM) | T02 (TPM) | Fold change |
|---|
| rno-let-7i-5p | 17,707 | 134,531 | 7.60 |
| rno-miR-21-5p | 38,135 | 123,008 | 3.23 |
| rno-miR-3473 | 47,884 | 71,730 | 1.50 |
|
rno-miR-148a-3p | 18,536 | 51,394 | 2.77 |
| rno-miR-26a-5p | 16,315 | 34,505 | 2.11 |
| rno-miR-99a-5p | 18,769 | 26,776 | 1.43 |
| rno-let-7b-5p | 6,632 | 17,794 | 2.68 |
|
rno-miR-146a-5p | 2,453 | 15,760 | 6.42 |
| rno-miR-143-3p | 11,971 | 8,031 | 0.67 |
| rno-miR-221-3p | 2,221 | 8,999 | 4.05 |
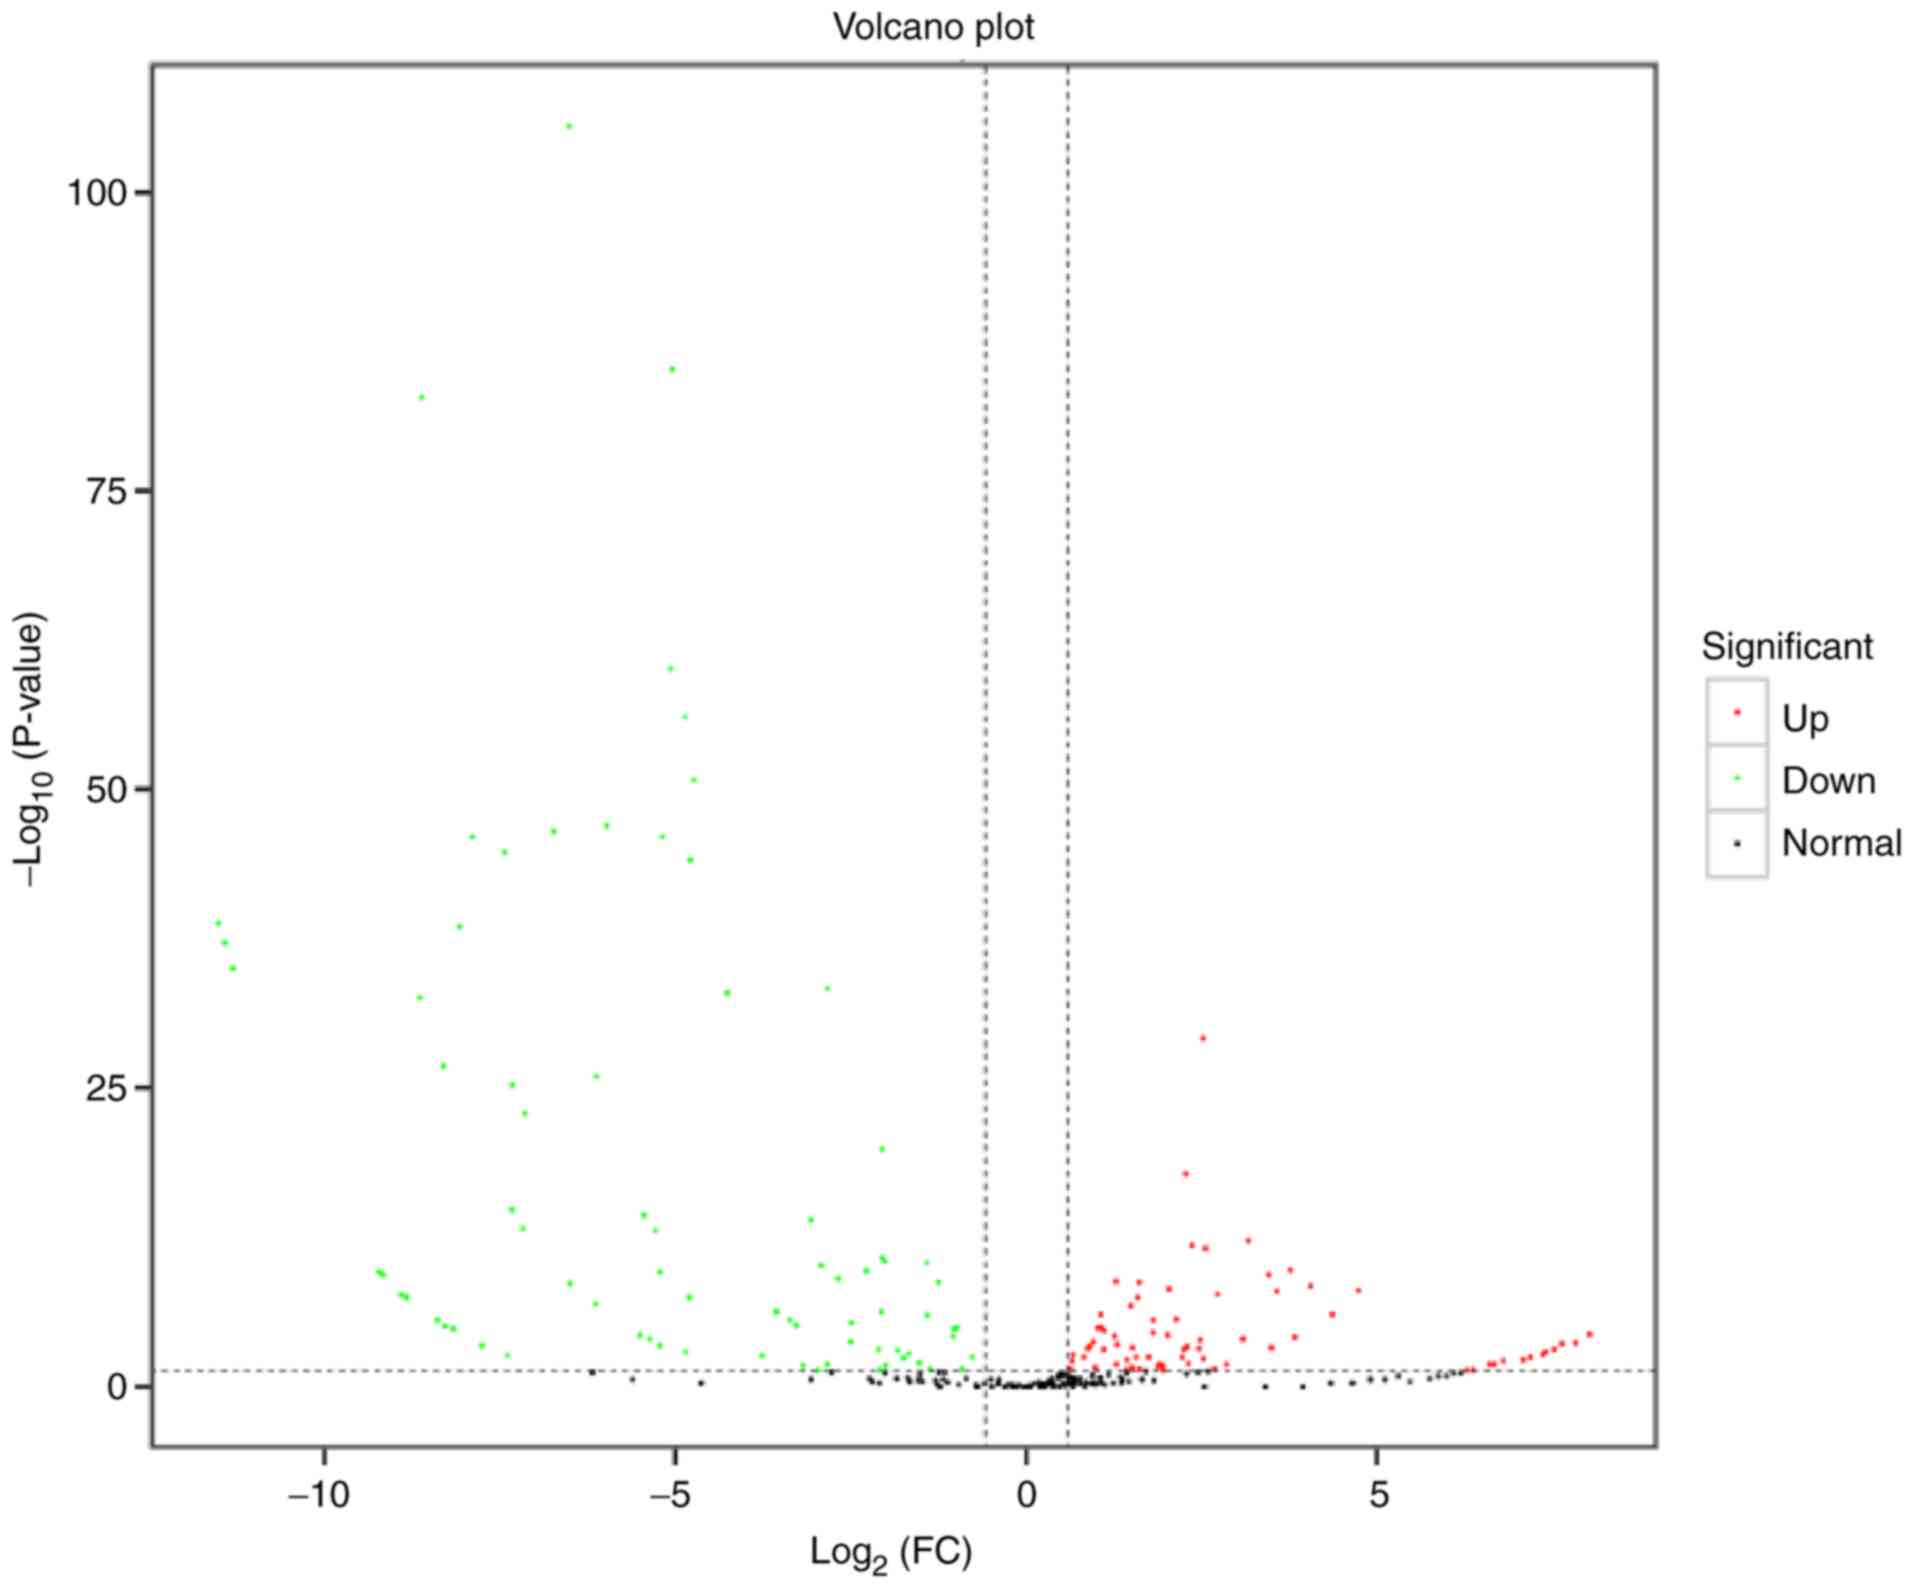
DE miRNAs
The screening threshold for the discovery of DE
miRNAs was |log2 (FC)|≥0.58; P<0.05. The FC of
expression between the two samples and the corresponding P-value
were determined for each miRNA. Post-degeneration exosomes showed
36 up- and 22 downregulated DE miRNAs compared with
pre-degeneration exosomes (Table
III). miR-1b, miR-206-3p, miR-133a-3p, miR-1-3p, let-7i-5p,
miR-146a-5p, miR-29a-3p, miR-127-3p, miR-21-5p and miR-221-3p were
the top 10 DE miRNAs. The DE miRNAs with the greatest expression FC
in expression, miR-1b, has been demonstrated to inhibit apoptosis
(39,40). The statistical significance of the
difference between the miRNA expression levels in the two groups
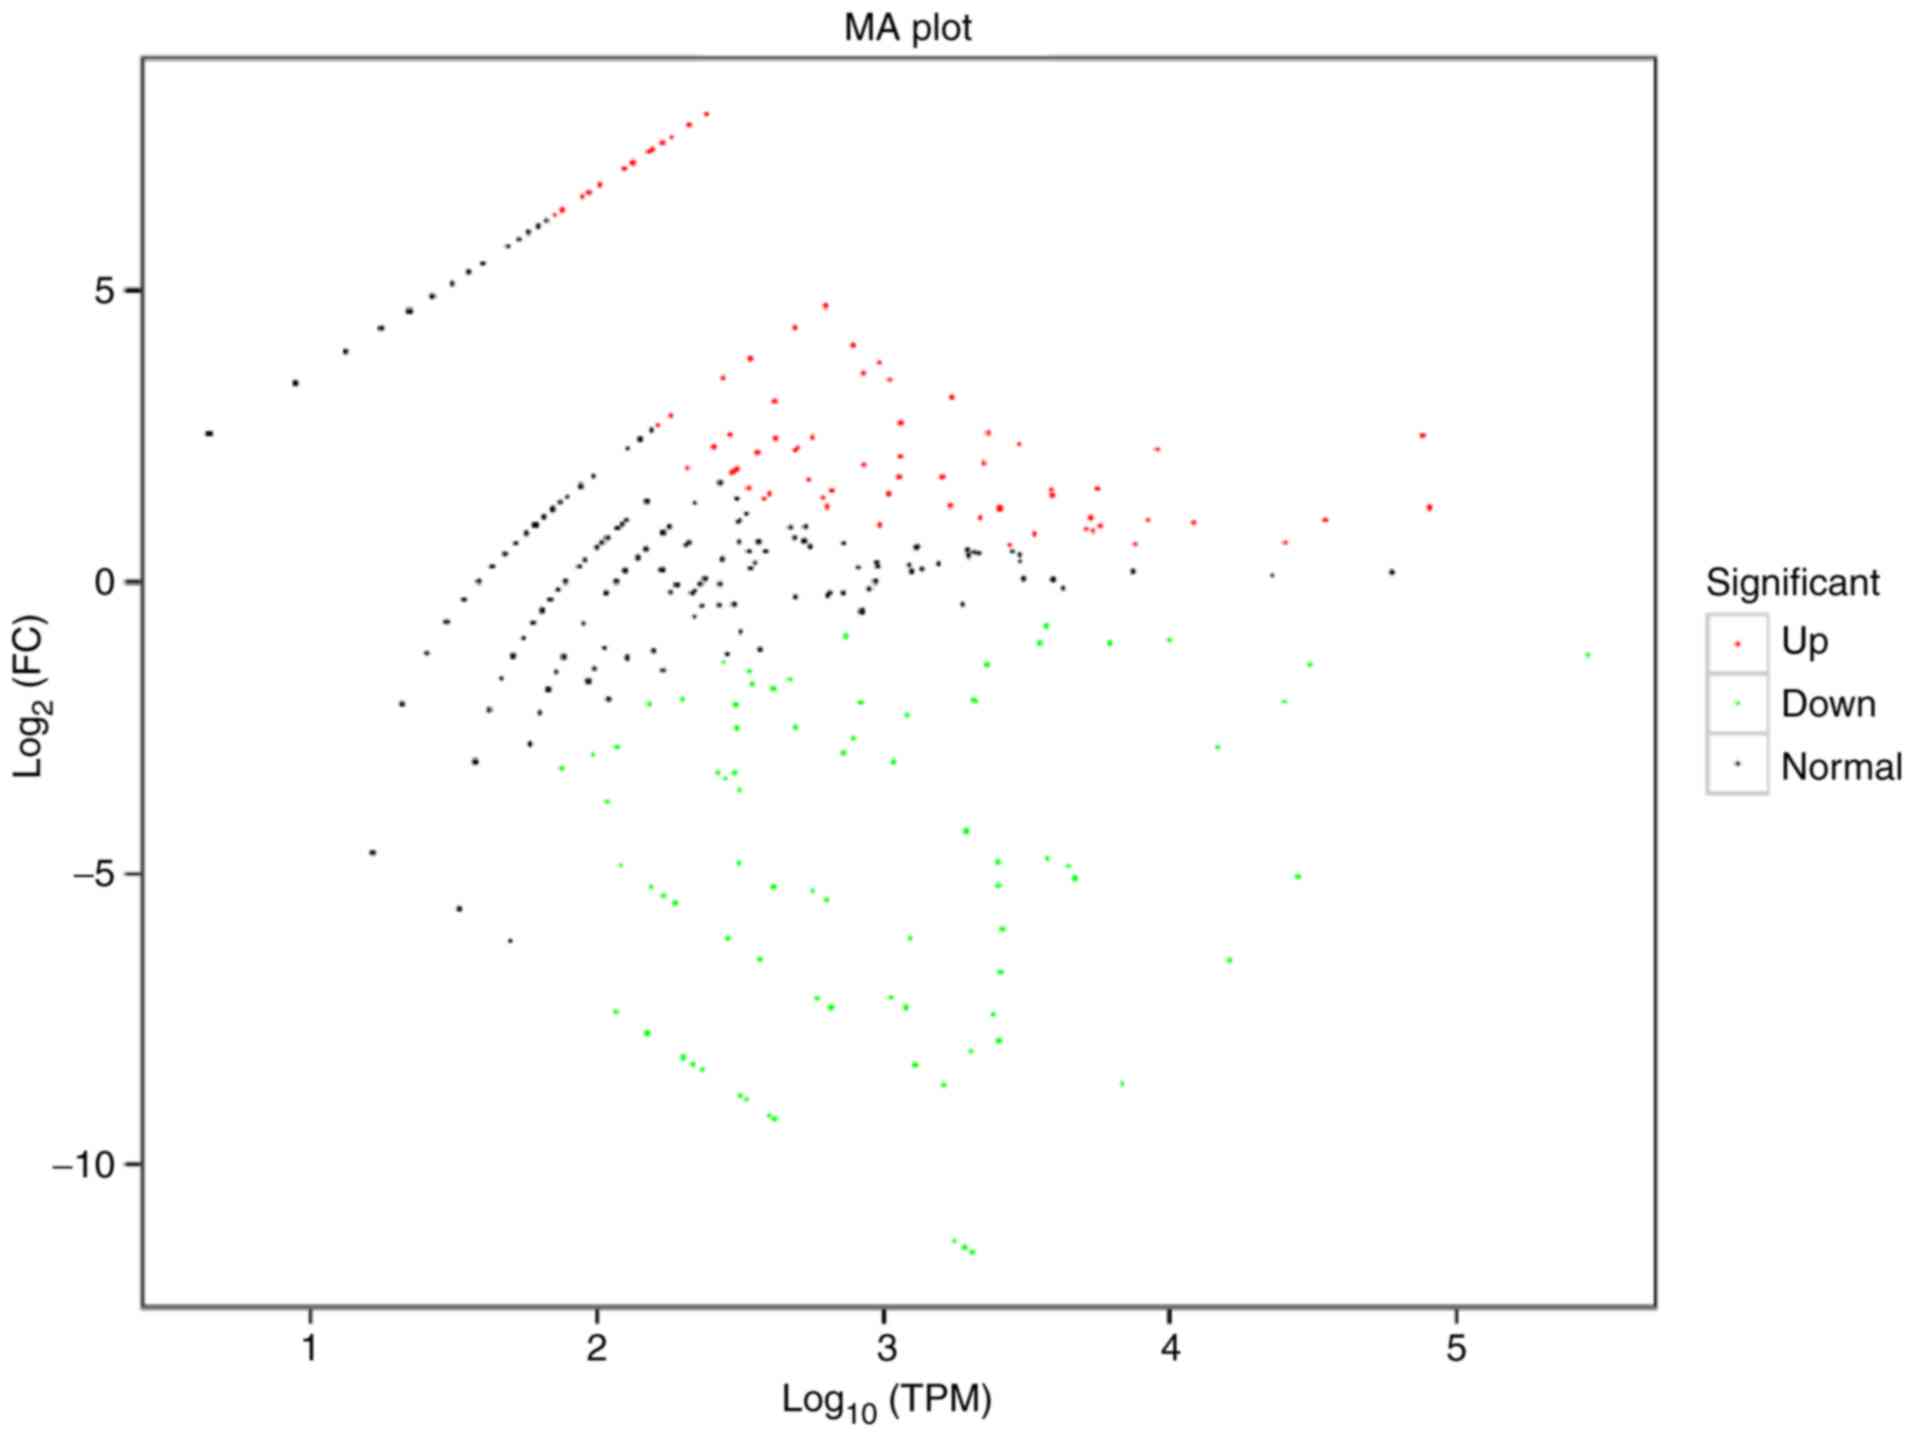
was determined and presented in a volcano plot (Fig. 3). An MA plot was also prepared to
graphically display the general distribution of expression levels
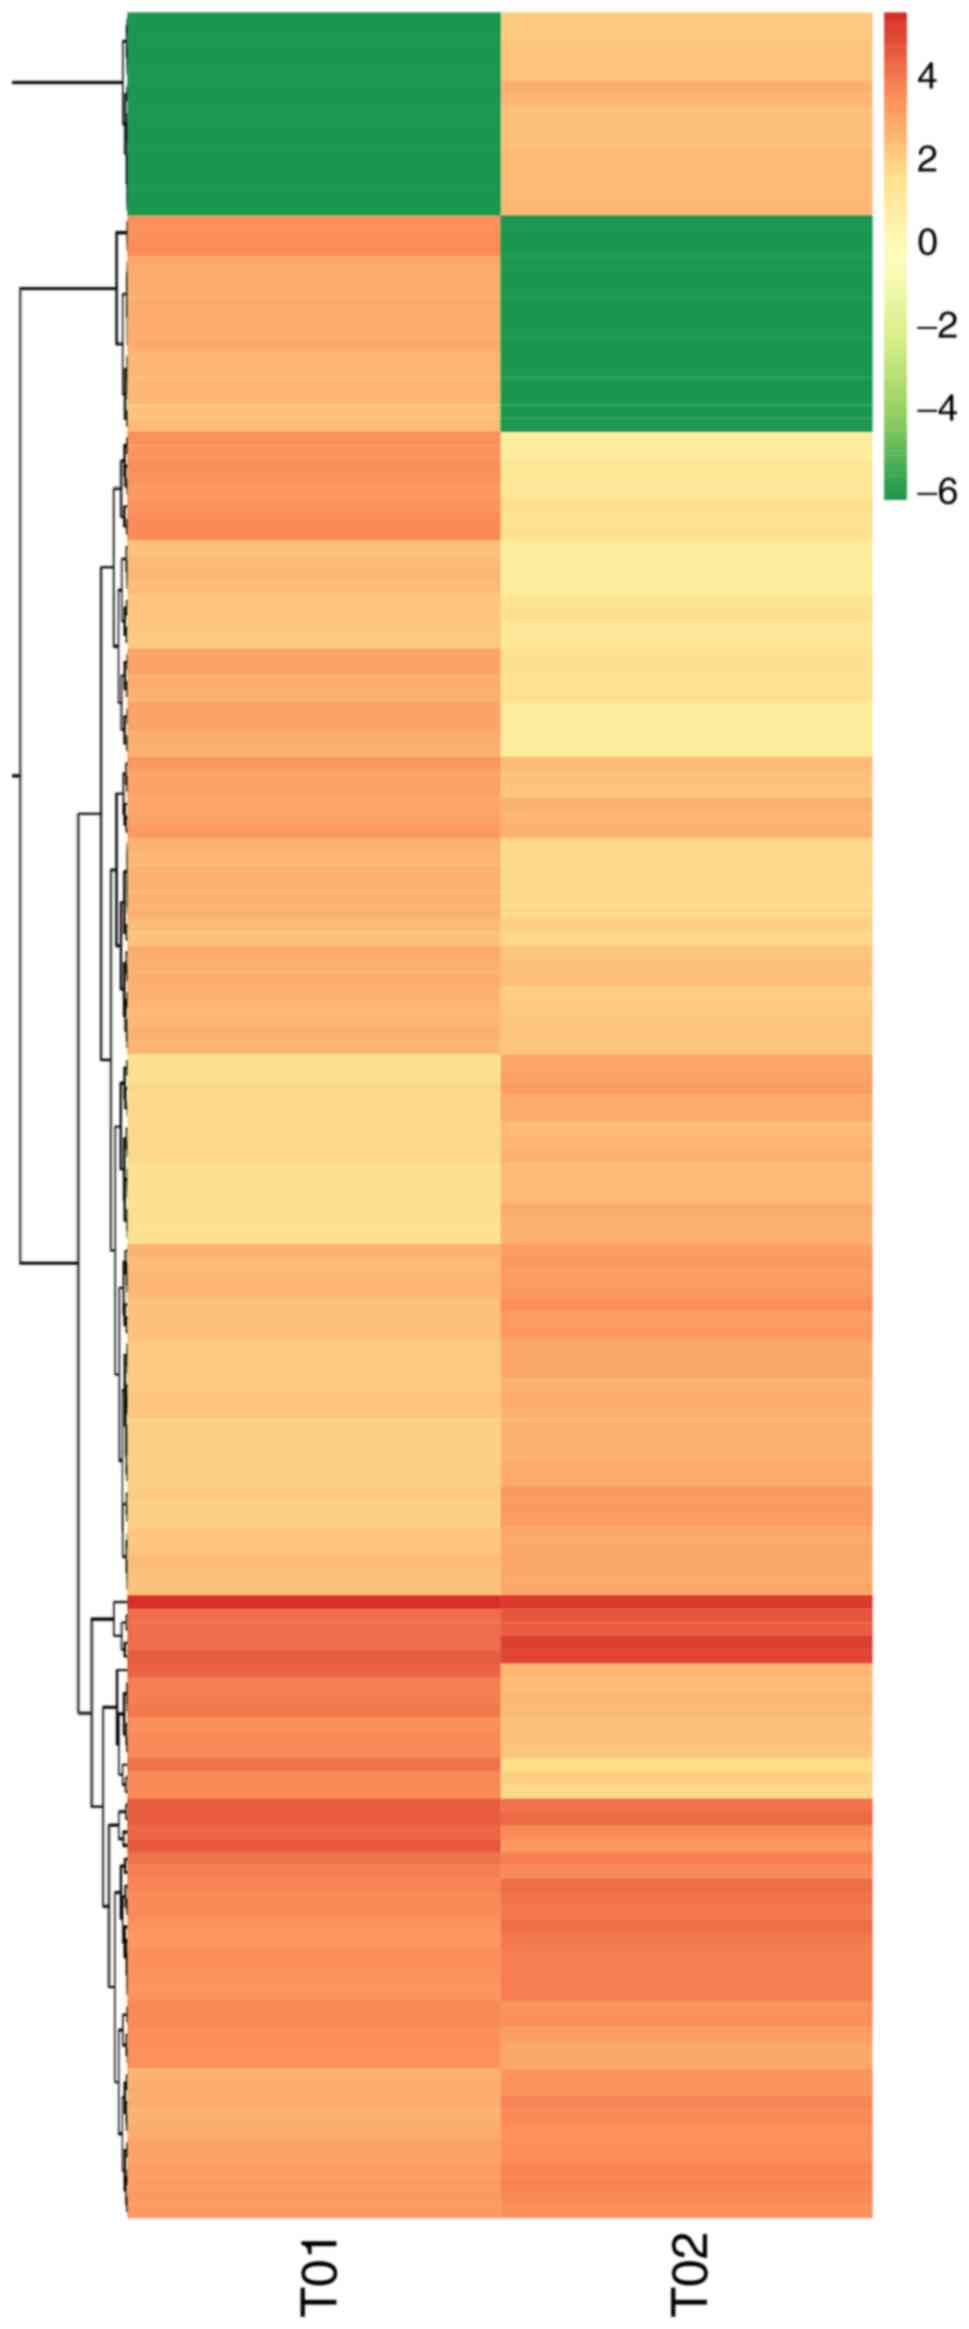
and differential multiples of DE miRNAs in the two groups (Fig. 4). Hierarchical clustering analysis
was carried out on the DE miRNAs, and the miRNAs with the same or
comparable expression behavior were grouped (Fig. 5).
| Table IIIDifferentially expressed miRNAs. |
Table III
Differentially expressed miRNAs.
| Identity | P-value | FDR | Regulated |
|---|
| rno-miR-1b |
6.81x10-86 |
1.63x10-83 | Down |
| rno-miR-206-3p |
3.36x10-47 |
2.01x10-45 | Down |
|
rno-miR-133a-3p |
8.56x10-47 |
4.10x10-45 | Down |
| rno-miR-1-3p |
1.24x10⁻³³ |
3.29x10⁻³² | Down |
| rno-let-7i-5p |
7.17x10⁻³⁰ |
1.72x10⁻²⁸ | Up |
|
rno-miR-146a-5p |
1.72x10⁻¹⁸ |
3.17x10⁻¹⁷ | Up |
| rno-miR-29a-3p |
1.61x10⁻¹² |
2.34x10⁻¹¹ | Up |
| rno-miR-127-3p |
8.04x10⁻¹¹ |
1.01x10⁻⁹ | Down |
| rno-miR-21-5p |
1.45x10⁻⁹ |
1.48x10⁻⁸ | Up |
| rno-miR-221-3p |
1.79x10⁻⁹ |
1.78x10⁻⁸ | Up |
| rno-miR-222-3p |
6.55x10⁻⁹ |
6.03x10⁻⁸ | Up |
| rno-miR-224-5p |
1.73x10⁻⁸ |
1.51x10⁻⁷ | Up |
| rno-miR-23b-3p |
1.74x10⁻⁷ |
1.33x10⁻⁶ | Up |
|
rno-miR-148a-3p |
8.19x10⁻⁷ |
5.85x10⁻⁶ | Up |
|
rno-miR-378a-3p |
1.05x10⁻⁶ |
7.30x10⁻⁶ | Down |
|
rno-miR-125b-1-3p |
2.28x10⁻⁶ |
1.56x10⁻⁵ | Up |
| rno-miR-10a-5p |
4.12x10⁻⁶ |
2.67x10⁻⁵ | Down |
| rno-let-7c-5p |
1.05x10⁻⁵ |
6.29x10⁻⁵ | Up |
| rno-let-7b-5p |
1.17x10⁻⁵ |
6.92x10⁻⁵ | Up |
| rno-miR-143-3p |
1.36x10⁻⁵ |
7.89x10⁻⁵ | Down |
|
rno-miR-199a-3p |
1.37x10⁻⁵ |
7.89x10⁻⁵ | Down |
| rno-miR-22-3p |
2.12x10⁻⁵ |
1.19x10⁻⁴ | Up |
|
rno-miR-196a-5p |
2.79x10⁻⁵ |
1.55x10⁻⁴ | Up |
|
rno-miR-126a-3p |
5.66x10⁻⁵ |
3.01x10⁻⁴ | Down |
| rno-miR-320-3p |
6.08x10⁻⁵ |
3.20x10⁻⁴ | Up |
| rno-miR-30a-5p |
3.02x10⁻⁴ |
1.43x10⁻³ | Up |
|
rno-miR-133b-3p |
3.52x10⁻⁴ |
1.64x10⁻³ | Down |
|
rno-miR-196b-5p |
4.10x10⁻⁴ |
1.89x10⁻³ | Up |
| rno-let-7f-5p |
4.58x10⁻⁴ |
2.09x10⁻³ | Up |
| rno-miR-99b-5p |
6.96x10⁻⁴ |
3.00x10⁻³ | Up |
| rno-miR-499-5p |
7.59x10⁻⁴ |
3.21x10⁻³ | Down |
| rno-miR-128-3p |
8.83x10⁻⁴ |
3.68x10⁻³ | Down |
|
rno-miR-203a-3p |
1.65x10⁻³ |
6.69x10⁻³ | Down |
| rno-miR-26a-5p |
1.92x10⁻³ |
7.74x10⁻³ | Up |
| rno-miR-451-5p |
3.32x10⁻³ |
1.27x10⁻² | Down |
|
rno-miR-218a-5p |
3.39x10⁻³ |
1.27x10⁻² | Up |
| rno-miR-7a-5p |
3.72x10⁻³ |
1.38x10⁻² | Up |
| rno-miR-10b-5p |
3.88x10⁻³ |
1.43x10⁻² | Up |
| rno-miR-184 |
5.46x10⁻³ |
1.98x10⁻² | Up |
|
rno-miR-1839-5p |
5.72x10⁻³ |
2.04x10⁻² | Up |
| rno-miR-22-5p |
6.57x10⁻³ |
2.33x10⁻² | Up |
| rno-miR-122-5p |
6.99x10⁻³ |
2.46x10⁻² | Up |
|
rno-miR-328a-3p |
1.36x10⁻² |
4.66x10⁻² | Up |
| rno-miR-345-3p |
1.40x10⁻² |
4.67x10⁻² | Up |
| rno-miR-676 |
1.40x10⁻² |
4.67x10⁻² | Down |
| rno-miR-16-5p |
1.41x10⁻² |
4.68x10⁻² | Up |
| rno-miR-149-5p |
1.53x10⁻² |
5.07x10⁻² | Up |
| rno-miR-145-5p |
1.62x10⁻² |
5.31x10⁻² | Down |
| rno-miR-139-5p |
1.73x10⁻² |
5.64x10⁻² | Down |
| rno-miR-182 |
1.95x10⁻² |
6.28x10⁻² | Up |
| rno-miR-24-3p |
3.45x10⁻² |
1.07x10⁻¹ | Up |
| rno-miR-142-5p |
3.48x10⁻² |
1.07x10⁻¹ | Down |
| rno-miR-423-3p |
3.79x10⁻² |
1.16x10⁻¹ | Down |
|
rno-miR-450a-5p |
4.20x10⁻² |
1.26x10⁻¹ | Down |
| rno-miR-132-3p |
4.33x10⁻² |
1.28x10⁻¹ | Up |
| rno-miR-183-5p |
4.33x10⁻² |
1.28x10⁻¹ | Up |
|
rno-miR-126a-5p |
4.33x10⁻² |
1.28x10⁻¹ | Down |
|
rno-miR-148b-3p |
4.43x10⁻² |
1.30x10⁻¹ | Up |
Prediction and annotation of miRNA
TGs
Based on the gene sequencing data of existing and
recently identified miRNAs and associated species, TargetFinder was
used to determine the TGs in plants while miRanda and Targetscan
were used for TG prediction in animals. Table SI displays the anticipated TGs of
each miRNA.
Annotation data were available for 14,954 of the
14,982 TGs. Table IV displays the
total number of annotated TGs and the numbers of mRNAs of different
lengths.
| Table IVNumbers of target gene annotations
and mRNAs of different lengths (n). |
Table IV
Numbers of target gene annotations
and mRNAs of different lengths (n).
| Annotation
database | Annotated |
300≤length<1,000 |
Length>1,000 |
|---|
| COG | 4,875 | 288 | 4,586 |
| GO | 11,534 | 1,250 | 10,266 |
| KEGG | 10,046 | 955 | 9,084 |
| KOG | 10,238 | 646 | 9,585 |
| Pfam | 14,063 | 1,460 | 12,585 |
| Swiss-Prot | 14,591 | 1,504 | 13,068 |
| eggNOG | 14,596 | 1,423 | 13,159 |
| nr | 14,934 | 1,633 | 13,270 |
| All | 14,954 | 1,645 | 13,275 |
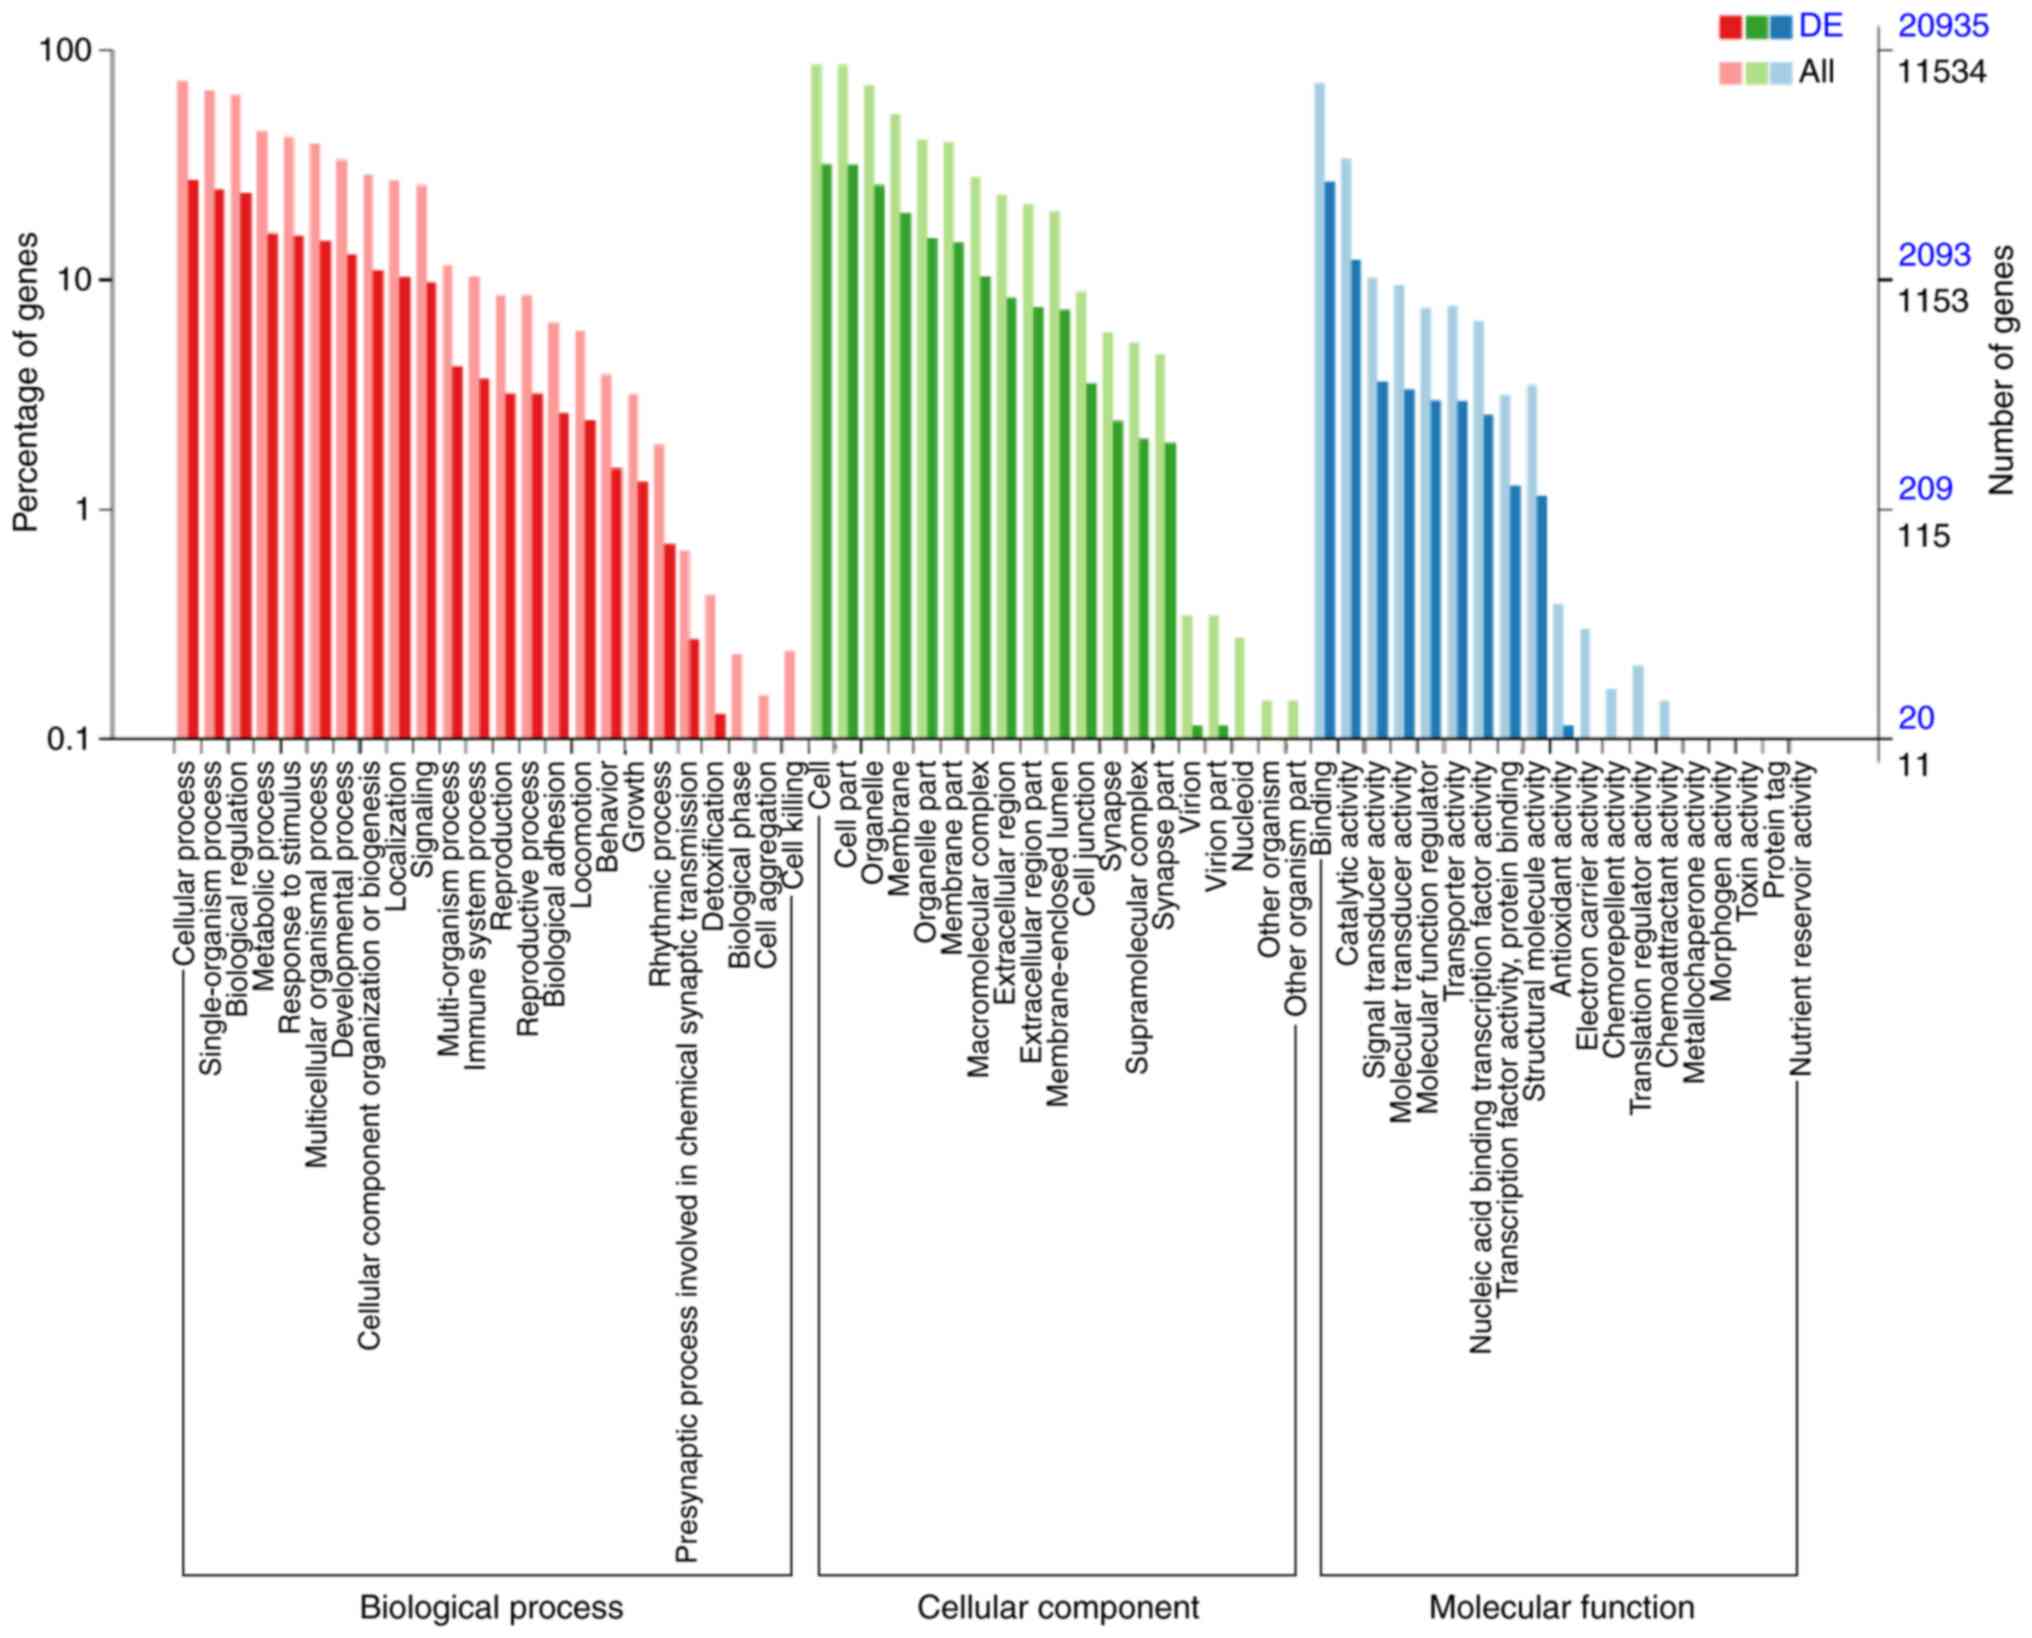
Enriched biological processes and
molecular functions of genes targeted by the DE miRNAs
Enriched biological processes, molecular functions
and cellular components for the DE miRNAs were determined by GO
analysis. The TGs of DE miRNAs in the endplate chondrocyte exosomes
were found to be clearly associated with the biological processes
‘biological regulation’, ‘signaling’, ‘localization’, ‘cellular
component organization or biogenesis’, ‘developmental process’,
‘multicellular organismal process’, ‘response to stimulus’,
‘metabolic process’, ‘single-organism process’ and ‘cellular
process’ (Fig. 6).
‘Antioxidant activity’, ‘structural molecule
activity’, ‘transcription factor activity, protein binding’,
‘nucleic acid binding transcription factor activity’, ‘transporter
activity’, ‘molecular function regulator’, ‘molecular transducer
activity,’ ‘signal transducer activity’, ‘catalytic activity’ and
‘binding’ are among the molecular functions found to be influenced
by the predicted TGs of DE miRNAs in endplate chondrocyte exosomes
(Fig. 6).
‘Membrane-enclosed lumen’, ‘extracellular region
part’, ‘macromolecular complex’, ‘membrane part’, ‘organelle part’,
‘membrane’, ‘organelle’ and ‘cell’ were among the cellular
components suggested to be altered by the projected TGs of DE
miRNAs in the endplate chondrocyte exosomes (Fig. 6).
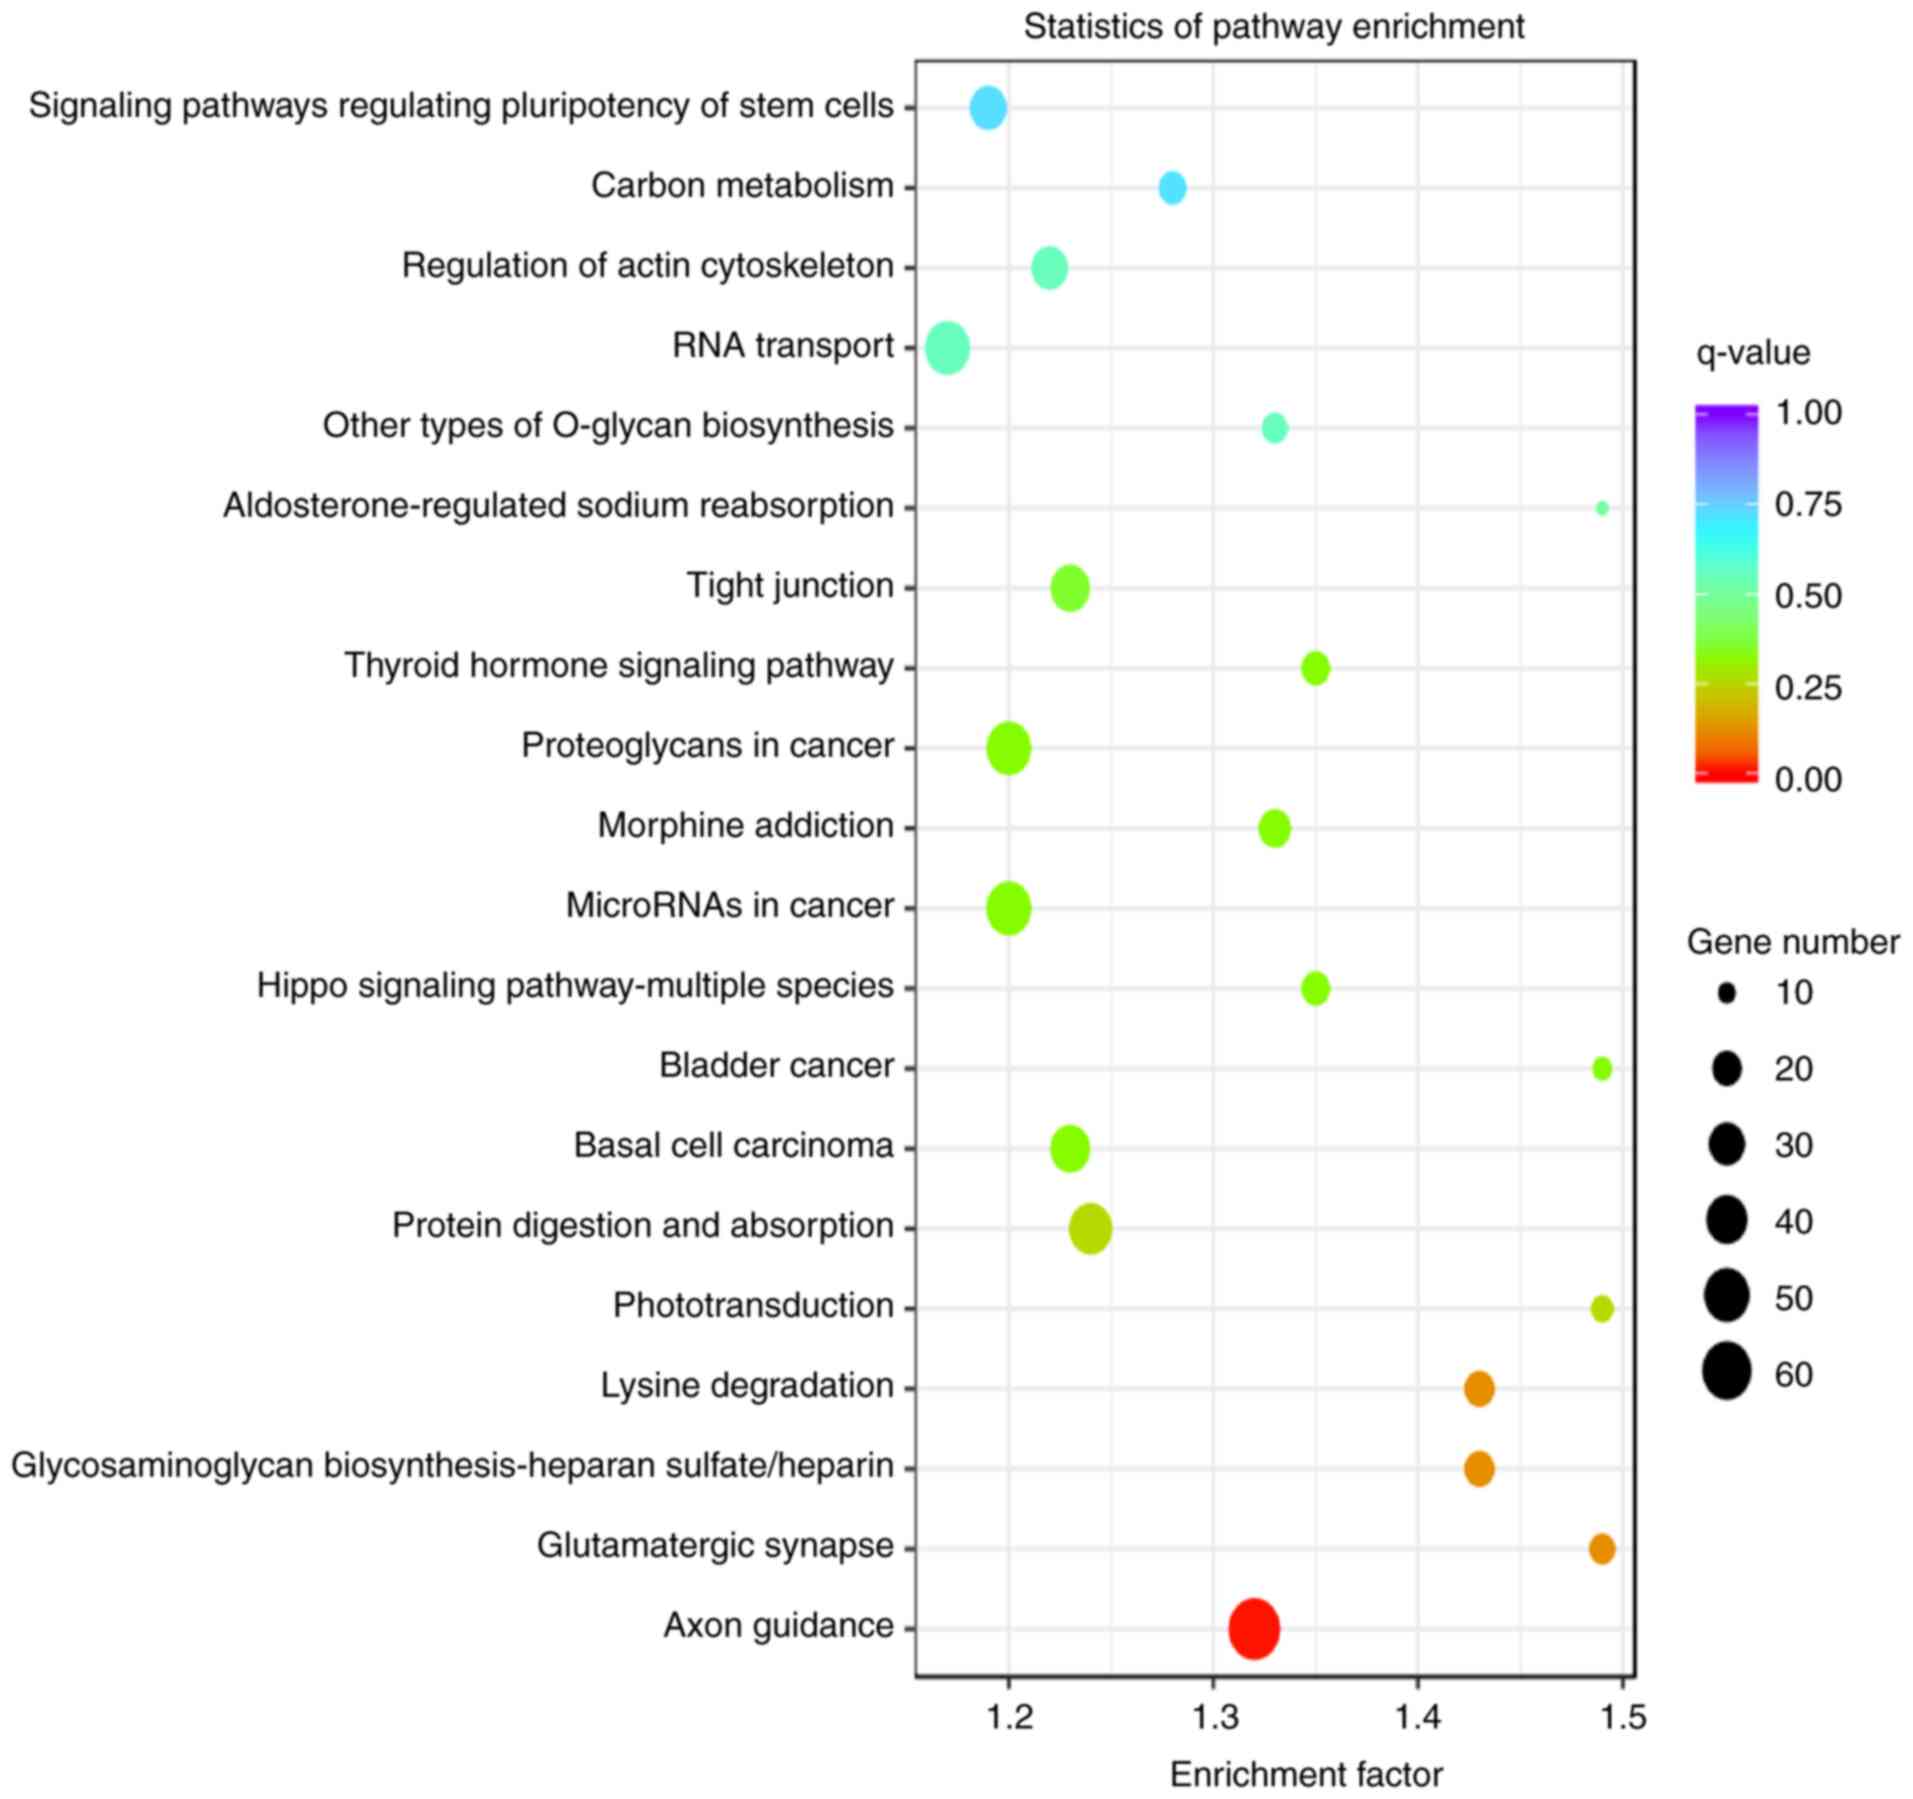
KEGG pathways enriched in the TGs of
DE miRNAs from endplate chondrocyte exosomes
KEGG pathway analysis revealed that the TGs of the
most significant miRNAs were enriched in the following pathways:
‘Axon guidance’, ‘glutamatergic synapse’, ‘glycosaminoglycan
biosynthesis-heparan sulfate/heparin’, ‘lysine degradation’,
‘phototransduction’, ‘protein digestion and absorption’, ‘basal
cell carcinoma’, ‘bladder cancer’, ‘Hippo signaling
pathway-multiple species’ and ‘microRNAs in cancer’ (Fig. 7).
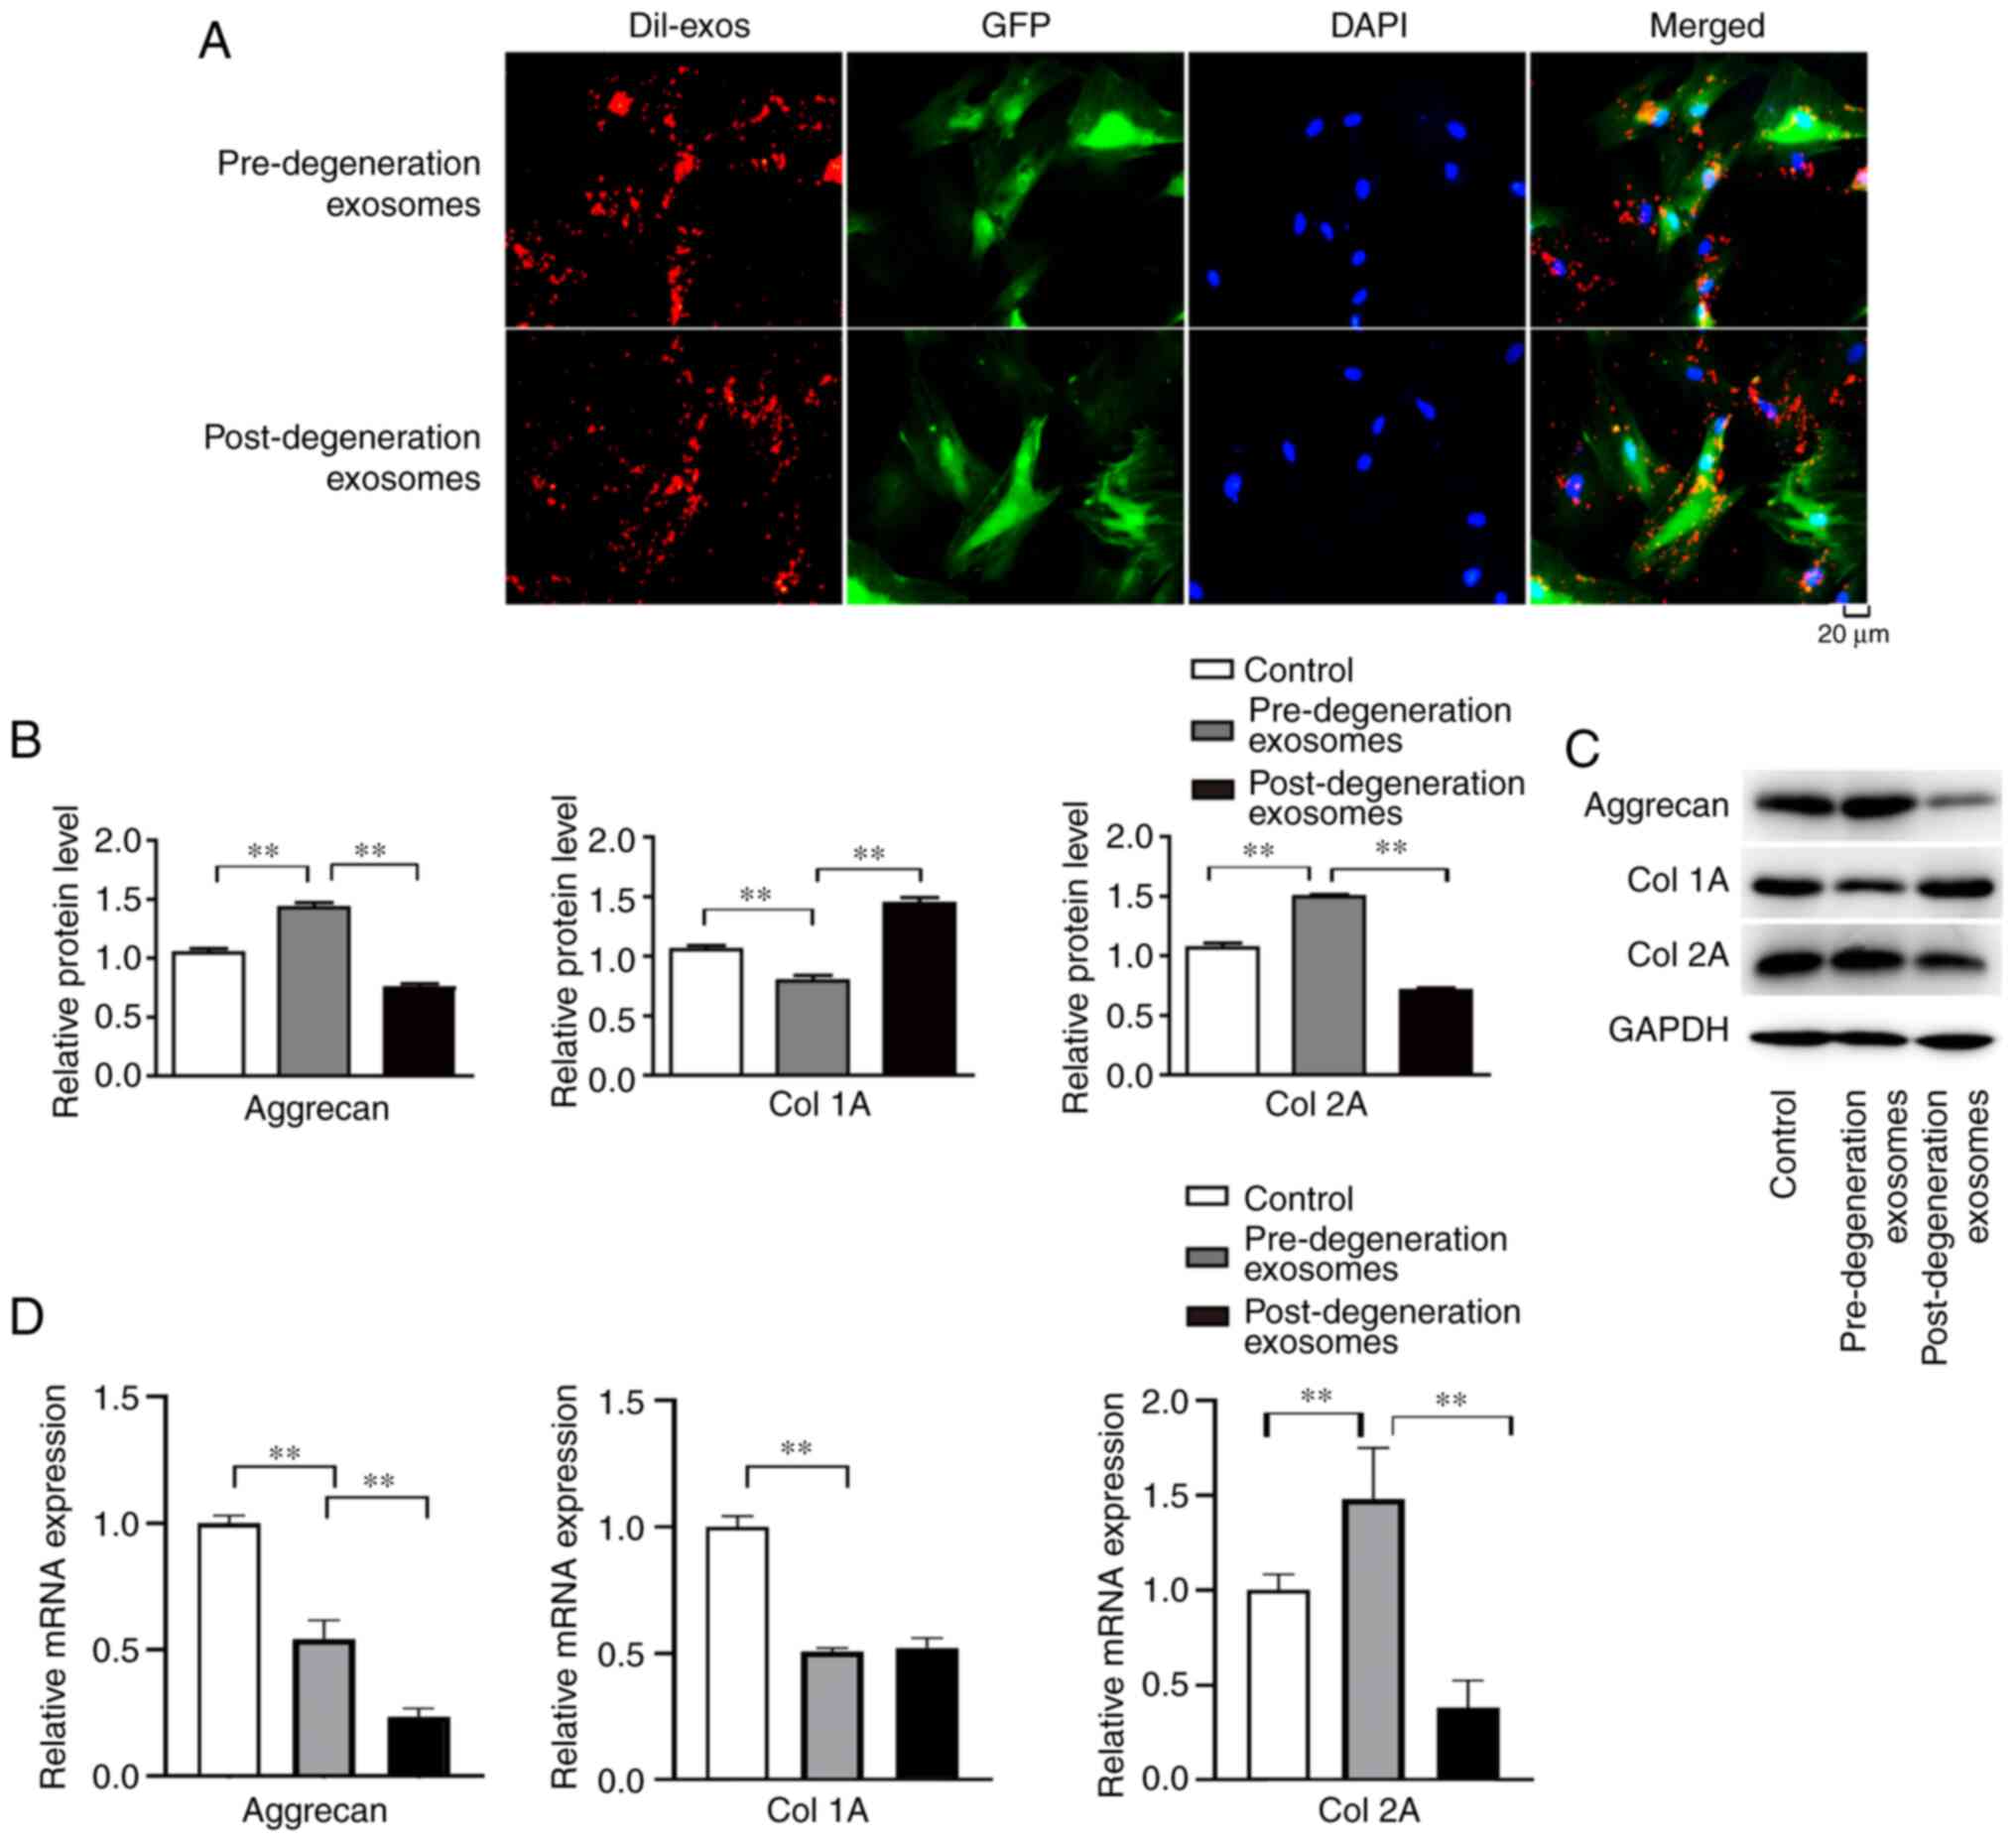
Endplate chondrocyte-derived exosomes
are taken up by NP cells and influence aggrecan and Col1A and -2A
expression
When chondrocyte-derived exosomes were co-cultured
with NP cells, DiI-labelled pre- and post-degradation exosomes were
visible by their red fluorescence in the cytoplasm of NP cells
(Fig. 8A), indicating that the
exosomes were taken up by the NP cells. Following the co-culture of
pre- and post-degeneration exosomes with NP cells, the aggrecan and
Col2A contents in the pre-degeneration exosome group were higher
than those in control and post-degeneration exosome groups
(P<0.01), while the Co11A contents in the pre-degeneration
exosome group were lower than those in control and
post-degeneration exosome groups (P<0.01; Fig. 8B and C). In addition, the RT-qPCR results
indicated that the expression of aggrecan and Col2A in the
pre-degeneration exosome group was higher than that in the
post-degeneration exosome group (P<0.05), the Col1A contents in
the pre-degeneration exosome group were lower than those in control
groups (P<0.01), however, there was no significant difference in
the expression of Col 1A in pre- and post-degeneration exosomes
(P>0.05; Fig. 8D).
Comparison of RNA concentration and
purity after the co-culture of exosomes and NP cells
When NP cells were co-cultured with 20 µg/ml pre-
and post-degeneration exosomes, the total RNA concentration in the
post-degeneration exosome group was lower than that in the
pre-degeneration exosome group (Table
V).
| Table VTotal RNA concentration and
purity. |
Table V
Total RNA concentration and
purity.
| Group | Concentration
(ng/µl) |
OD260/280 |
|---|
| Pre-degeneration
exosomes | 37.16 | 1.99 |
| Post-degeneration
exosomes | 31.59 | 2.01 |
| Control | 59.39 | 2.01 |
Discussion
The results of the present study revealed that rat
endplate chondrogenic exosomes have unique miRNA expression
patterns before and after degeneration. sRNA sequencing was
performed for the pre- and post-degeneration exosomes and a total
of 479 miRNAs were found, comprising 190 newly predicted miRNAs and
289 known miRNAs. The miRNA abundance in the two types of exosomes
was assessed and the DE miRNAs were identified. A total of 14,982
predicted miRNA TGs were identified, and functional annotation and
enrichment analysis of the TGs were carried out. To the best of our
knowledge, this is the first account of the sRNA sequencing of rat
chondrogenic exosomes.
Exosomes are tiny molecular cellular vesicles that
are produced by the majority of body cells and range in size from
30 to 150 nm (4-6).
Proteins, lipids, metabolites, mRNAs, miRNAs and ncRNAs can be
carried by exosomes (7-9).
In the present study, NTA indicated that the exosomes derived from
the rat endplate chondrocytes comprised 100-nm particles. In
addition, the exosome markers alix, HSP70, flotillin and annexin V
were detected in the particles by WB analysis, which is consistent
with the recognized properties of exosomes (41).
In the present study, the chondrocyte-derived
exosomal miRNA signature of the rat endplate was identified pre-
and post-degeneration. The significantly upregulated miRNAs in the
post-degeneration exosomes included let-7i-5p, miR-146a-5p and
miR-29a-3p, and the significantly downregulated miRNAs included
miR-1b, miR-206-3p, miR-133a-3p and miR-1-3p.
Among the DE miRNAs identified in the present study,
miR-146a-5p and miR-222-3p have been linked to IVDD previously.
According to a study conducted by Xi et al (42), the overexpression of HCG18 sponges
miR-146a-5p in NP cells in vitro, thereby inhibiting
proliferation by inducing S-phase cell cycle arrest and apoptosis,
attracting macrophages and promoting hypercalcification.
miR-146a-5p was also shown to be substantially upregulated in the
knee cartilage tissues of patients with osteoarthritis in a study
by Zhang et al (43).
Furthermore, the downregulation of mir-146a-5p facilitated
chondrocyte autophagy and prevented chondrocyte death in
vivo and in vitro. These findings imply that chondrocyte
death may be promoted by the elevated miR-146a-5p concentration of
exosomes. A study by Liu et al (44) demonstrated that the overexpression
of miR-222-3p markedly increased the apoptosis of NP cells and
decreased their proliferation. The study also observed that
miR-222-3p expression was much greater in degenerated
intervertebral disc tissues than in normal intervertebral disc
tissue, and that miR-222-3p reduced the formation of aggrecan and
Col II while increasing that of matrix metalloproteinase-3. Based
on these findings, we hypothesize that miR-146a-5p and miR-222-3p
may be suitable IVDD therapy targets.
GO and KEGG analyses were conducted to predict the
roles of the dysregulated miRNAs in IVDD. The KEGG pathways
associated with the TGs of the miRNAs included ‘Axon guidance’,
‘glutamatergic synapse’, ‘glycosaminoglycan biosynthesis-heparan
sulfate/heparin’, ‘lysine degradation’ and ‘phototransduction’.
IVDD may be associated with human brain development and mental
health since axon guidance is a crucial step in the building of
neuronal networks. In a bioinformatics analysis of anxiety
disorder, Fan et al (45)
found that various pathways associated neuronal brain functioning,
including glutamatergic synapses and axon guidance, were
significantly enriched. It is noteworthy that individuals with
lower back pain often experience anxiety and depression (46). Heparan sulfate/heparin-based
glycosaminoglycan production has also been linked with IVDD. The
ability of the negatively charged glycosaminoglycan side chains
bound to the NP to electrostatically attach polar water molecules
is crucial for maintaining adequate hydration and enabling the disc
to deform reversibly under compression loads (47). The gradual loss of extracellular
matrix molecules, notably glycosaminoglycan-substituted
proteoglycans, is a distinguishing feature of IVDD, which often
coexists with low back and neck pain (48). Exosomes may play a significant role
in IVDD via the aforementioned mechanisms; however, findings
concerning the effects of lysine degradation and phototransduction
on IVDD are limited.
Finally, to investigate the effect of exosomes
derived from endplate chondrocytes on NP cells, pre- and
post-degeneration exosomes were co-cultured with NP cells, and the
expression levels of aggrecan, Col1A and Col2A were analyzed using
WB and RT-qPCR with GAPDH as a control. The WB results showed that
the contents of aggrecan and Col2A in the pre-degeneration exosome
group of NP cells were higher than those in the control and
post-degeneration exosome groups, and the content of Col1A in the
pre-degeneration exosome group was lower than that in the control
and post-degeneration exosome groups. Assessment of the RNA
extracted from the NP cells revealed that the total RNA
concentrations of the pre-degeneration exosome and control groups
were higher than that of the post-degeneration exosome group. In
addition, RT-qPCR showed that the expression levels of aggrecan and
Col2A mRNA in the pre-degeneration exosome group were higher than
those in the post-degeneration exosome group, while the expression
of Col1A in the pre-degeneration exosome group was lower than that
in the post-degeneration exosome group. The results show that
normal exosomes secreted by pre-degeneration endplate chondrocytes
upregulated the protein expression levels of aggrecan and Col2A and
the mRNA expression of Col2A, and downregulated the protein and
mRNA expression levels of Col1A in NP cells. However, following the
co-culture of degraded exosomes with NP cells, the protein and mRNA
expression levels of aggrecan and Col2A were decreased while those
of Col1A were increased compared with the respective levels in NP
cells co-cultured with pre-degeneration exosomes. These results
suggest that chondrocyte-derived exosomes may enhance the
proliferation of NP cells, thus playing a role in the prevention
and treatment of IVDD.
It is important to consider the limitations of the
present study. Although rats are among the most frequently utilized
animal models of IVDD, DE miRNAs require further assessment in
human exosomes as well as other animal models.
In conclusion, the present study indicates that
specific miRNAs may be carried by exosomes during IVDD, which
differ from those pre-degeneration. The DE miRNAs and their TGs may
serve as prospective targets for the identification, prevention and
treatment of IVDD. However, the functions of DE endplate
chondrogenic exosomal miRNAs in the etiology of IVDD require
further investigation.
Supplementary Material
Predicted target genes of
differentially expressed microRNAs.
Datasets generated – nucleotides.
Acknowledgements
The authors would like to thank Yijishan Central
Laboratory of Wannan Medical College (Wuhu, China) for providing
experimental equipment.
Funding
Funding: No funding was received.
Availability of data and materials
The datasets generated and/or analyzed during the
current study are available in the INSDC member repository
(BankIt2645413:OP866295-OP866723; https://www.ncbi.nlm.nih.gov/WebSub/) and in Table SII.
Authors' contributions
QWL was responsible for conceptualization and
methodology. HW performed data curation. QWL and XWC contributed to
the formal analysis. XWC acquired funding and resources and was
responsible for project administration. QWL wrote the original
draft of the manuscript and HW reviewed and edited the manuscript.
XWC and HW confirm the authenticity of all the raw data. All
authors have read and approved the final manuscript.
Ethics approval and consent to
participate
The Animal Care and Use Committee and Animal Ethics
Committee of Yijishan Hospital of Wannan Medical College (Wuhu,
China) authorized the present study (approval no.
LLSC-2022-099).
Patient consent for publication
Not applicable.
Competing interests
The authors declare that they have no competing
interests.
References
|
1
|
Cazzanelli P and Wuertz-Kozak K: MicroRNAs
in intervertebral disc degeneration, apoptosis, inflammation, and
mechanobiology. Int J Mol Sci. 21(3601)2020.PubMed/NCBI View Article : Google Scholar
|
|
2
|
Kos N, Gradisnik L and Velnar T: A Brief
review of the degenerative intervertebral disc disease. Med Arch.
73:421–424. 2019.PubMed/NCBI View Article : Google Scholar
|
|
3
|
Dowdell J, Erwin M, Choma T, Vaccaro A,
Iatridis J and Cho SK: Intervertebral disk degeneration and repair.
Neurosurgery. 80 (3S):S46–S54. 2017.PubMed/NCBI View Article : Google Scholar
|
|
4
|
Yang D, Zhang W, Zhang H, Zhang F, Chen L,
Ma L, Larcher LM, Chen S, Liu N, Zhao Q, et al: Progress,
opportunity, and perspective on exosome isolation-efforts for
efficient exosome-based theranostics. Theranostics. 10:3684–3707.
2020.PubMed/NCBI View Article : Google Scholar
|
|
5
|
Hu Y, Zhang R and Chen G: Exosome and
secretion: Action on? Adv Exp Med Biol. 1248:455–483.
2020.PubMed/NCBI View Article : Google Scholar
|
|
6
|
Whitford W and Guterstam P: Exosome
manufacturing status. Future Med Chem. 11:1225–1236.
2019.PubMed/NCBI View Article : Google Scholar
|
|
7
|
Mori MA, Ludwig RG, Garcia-Martin R,
Brandão BB and Kahn CR: Extracellular miRNAs: From biomarkers to
mediators of physiology and disease. Cell Metab. 30:656–673.
2019.PubMed/NCBI View Article : Google Scholar
|
|
8
|
He X, Kuang G, Wu Y and Ou C: Emerging
roles of exosomal miRNAs in diabetes mellitus. Clin Transl Med.
11(e468)2021.PubMed/NCBI View
Article : Google Scholar
|
|
9
|
Emanueli C, Shearn AI, Angelini GD and
Sahoo S: Exosomes and exosomal miRNAs in cardiovascular protection
and repair. Vascul Pharmacol. 71:24–30. 2015.PubMed/NCBI View Article : Google Scholar
|
|
10
|
Cheng X, Zhang G, Zhang L, Hu Y, Zhang K,
Sun X, Zhao C, Li H, Li YM and Zhao J: Mesenchymal stem cells
deliver exogenous miR-21 via exosomes to inhibit nucleus pulposus
cell apoptosis and reduce intervertebral disc degeneration. J Cell
Mol Med. 22:261–276. 2018.PubMed/NCBI View Article : Google Scholar
|
|
11
|
Xu J, Xie G, Yang W and Wang W, Zuo Z and
Wang W: Platelet-rich plasma attenuates intervertebral disc
degeneration via delivering miR-141-3p-containing exosomes. Cell
Cycle. 20:1487–1499. 2021.PubMed/NCBI View Article : Google Scholar
|
|
12
|
Zhu L, Shi Y, Liu L, Wang H, Shen P and
Yang H: Mesenchymal stem cells-derived exosomes ameliorate nucleus
pulposus cells apoptosis via delivering miR-142-3p: Therapeutic
potential for intervertebral disc degenerative diseases. Cell
Cycle. 19:1727–1739. 2020.PubMed/NCBI View Article : Google Scholar
|
|
13
|
Zai Z, Xu Y, Qian X, Li Z, Ou Z, Zhang T,
Wang L, Ling Y, Peng X, Zhang Y and Chen F: Estrogen antagonizes
ASIC1a-induced chondrocyte mitochondrial stress in rheumatoid
arthritis. J Transl Med. 20(561)2022.PubMed/NCBI View Article : Google Scholar
|
|
14
|
Langmead B, Trapnell C, Pop M and Salzberg
SL: Ultrafast and memory-efficient alignment of short DNA sequences
to the human genome. Genome Biol. 10(R25)2009.PubMed/NCBI View Article : Google Scholar
|
|
15
|
Quast C, Pruesse E, Yilmaz P, Gerken J,
Schweer T, Yarza P, Peplies J and Glöckner FO: The SILVA ribosomal
RNA gene database project: Improved data processing and web-based
tools. Nucleic Acids Res. 41 (Database Issue):D590–D596.
2013.PubMed/NCBI View Article : Google Scholar
|
|
16
|
Chan PP and Lowe TM: GtRNAdb 2.0: An
expanded database of transfer RNA genes identified in complete and
draft genomes. Nucleic Acids Res. 44 (D1):D184–D189.
2016.PubMed/NCBI View Article : Google Scholar
|
|
17
|
Kalvari I, Nawrocki EP, Argasinska J,
Quinones-Olvera N, Finn RD, Bateman A and Petrov AI: Non-coding RNA
analysis using the Rfam database. Curr Protoc Bioinformatics.
62(e51)2018.PubMed/NCBI View
Article : Google Scholar
|
|
18
|
Jurka J, Kapitonov VV, Pavlicek A,
Klonowski P, Kohany O and Walichiewicz J: Repbase update, a
database of eukaryotic repetitive elements. Cytogenet Genome Res.
110:462–467. 2005.PubMed/NCBI View Article : Google Scholar
|
|
19
|
Friedländer MR, Mackowiak SD, Li N, Chen W
and Rajewsky N: miRDeep2 accurately identifies known and hundreds
of novel microRNA genes in seven animal clades. Nucleic Acids Res.
40:37–52. 2012.PubMed/NCBI View Article : Google Scholar
|
|
20
|
Denman RB: Using RNAFOLD to predict the
activity of small catalytic RNAs. Biotechniques. 15:1090–1095.
1993.PubMed/NCBI
|
|
21
|
Zhang Z, Jiang L, Wang J, Gu P and Chen M:
MTide: An integrated tool for the identification of miRNA-target
interaction in plants. Bioinformatics. 31:290–291. 2015.PubMed/NCBI View Article : Google Scholar
|
|
22
|
Li B, Ruotti V, Stewart RM, Thomson JA and
Dewey CN: RNA-Seq gene expression estimation with read mapping
uncertainty. Bioinformatics. 26:493–500. 2010.PubMed/NCBI View Article : Google Scholar
|
|
23
|
Love MI, Huber W and Anders S: Moderated
estimation of fold change and dispersion for RNA-seq data with
DESeq2. Genome Biol. 15(550)2014.PubMed/NCBI View Article : Google Scholar
|
|
24
|
Robinson MD, McCarthy DJ and Smyth GK:
edgeR: A bioconductor package for differential expression analysis
of digital gene expression data. Bioinformatics. 26:139–140.
2010.PubMed/NCBI View Article : Google Scholar
|
|
25
|
Betel D, Wilson M, Gabow A, Marks DS and
Sander C: The microRNA.org resource: Targets and expression.
Nucleic Acids Res. 36 (Database Issue):D149–D153. 2008.PubMed/NCBI View Article : Google Scholar
|
|
26
|
Lewis BP, Shih IH, Jones-Rhoades MW,
Bartel DP and Burge CB: Prediction of mammalian microRNA targets.
Cell. 115:787–798. 2003.PubMed/NCBI View Article : Google Scholar
|
|
27
|
Deng Y, Li J and Wu S, Zhu Y, Chen Y, He
F, Chen Y, Deng LY, Li J and Wu S: Integrated nr database in
protein annotation system and its localization. Comp Eng. 32:71–74.
2006.
|
|
28
|
Apweiler R, Bairoch A, Wu CH, Barker WC,
Boeckmann B, Ferro S, Gasteiger E, Huang H, Lopez R, Magrane M, et
al: UniProt: The universal protein knowledgebase. Nucleic Acids
Res. 32 (Database Issue):D115–D119. 2004.PubMed/NCBI View Article : Google Scholar
|
|
29
|
Ashburner M, Ball CA, Blake JA, Botstein
D, Butler H, Cherry JM, Davis AP, Dolinski K, Dwight SS, Eppig JT,
et al: Gene ontology: Tool for the unification of biology. The gene
ontology consortium. Nat Genet. 25:25–29. 2000.PubMed/NCBI View
Article : Google Scholar
|
|
30
|
Tatusov RL, Galperin MY, Natale DA and
Koonin EV: The COG database: A tool for genome-scale analysis of
protein functions and evolution. Nucleic Acids Res. 28:33–36.
2000.PubMed/NCBI View Article : Google Scholar
|
|
31
|
Kanehisa M, Goto S, Kawashima S, Okuno Y
and Hattori M: The KEGG resource for deciphering the genome.
Nucleic Acids Res. 32 (Database Issue):D277–D280. 2004.PubMed/NCBI View Article : Google Scholar
|
|
32
|
Huerta-Cepas J, Szklarczyk D, Heller D,
Hernández-Plaza A, Forslund SK, Cook H, Mende DR, Letunic I, Rattei
T, Jensen LJ, et al: eggNOG 5.0: A hierarchical, functionally and
phylogenetically annotated orthology resource based on 5090
organisms and 2502 viruses. Nucleic Acids Res. 47 (D1):D309–D314.
2019.PubMed/NCBI View Article : Google Scholar
|
|
33
|
Koonin EV, Fedorova ND, Jackson JD, Jacobs
AR, Krylov DM, Makarova KS, Mazumder R, Mekhedov SL, Nikolskaya AN,
Rao BS, et al: A comprehensive evolutionary classification of
proteins encoded in complete eukaryotic genomes. Genome Biol.
5(R7)2004.PubMed/NCBI View Article : Google Scholar
|
|
34
|
Eddy SR: Profile hidden Markov models.
Bioinformatics. 14:755–763. 1998.PubMed/NCBI View Article : Google Scholar
|
|
35
|
Li Y, Wang M, Li Q, Gao Y, Li Q, Li J and
Cao Y: Transcriptome profiling of longissimus lumborum in Holstein
bulls and steers with different beef qualities. PLoS One.
15(e0235218)2020.PubMed/NCBI View Article : Google Scholar
|
|
36
|
Kanehisa M, Sato Y, Furumichi M, Morishima
K and Tanabe M: New approach for understanding genome variations in
KEGG. Nucleic Acids Res. 47 (D1):D590–D595. 2019.PubMed/NCBI View Article : Google Scholar
|
|
37
|
Mao X, Cai T, Olyarchuk JG and Wei L:
Automated genome annotation and pathway identification using the
KEGG orthology (KO) as a controlled vocabulary. Bioinformatics.
21:3787–3793. 2005.PubMed/NCBI View Article : Google Scholar
|
|
38
|
Chettimada S, Lorenz DR, Misra V, Wolinsky
SM and Gabuzda D: Small RNA sequencing of extracellular vesicles
identifies circulating miRNAs related to inflammation and oxidative
stress in HIV patients. BMC Immunol. 21(57)2020.PubMed/NCBI View Article : Google Scholar
|
|
39
|
Li X, Yuan L, Wang J, Zhang Z, Fu S, Wang
S and Li X: MiR-1b up-regulation inhibits rat neuron proliferation
and regeneration yet promotes apoptosis via targeting KLF7. Folia
Neuropathol. 59:67–80. 2021.PubMed/NCBI View Article : Google Scholar
|
|
40
|
Liu YP, Xu P, Guo CX, Luo ZR, Zhu J, Mou
FF, Cai H, Wang C, Ye XC, Shao SJ and Guo HD: miR-1b overexpression
suppressed proliferation and migration of RSC96 and increased cell
apoptosis. Neurosci Lett. 687:137–145. 2018.PubMed/NCBI View Article : Google Scholar
|
|
41
|
Macías M, Rebmann V, Mateos B, Varo N,
Perez-Gracia JL, Alegre E and González Á: Comparison of six
commercial serum exosome isolation methods suitable for clinical
laboratories. Effect in cytokine analysis. Clin Chem Lab Med.
57:1539–1545. 2019.PubMed/NCBI View Article : Google Scholar
|
|
42
|
Xi Y, Jiang T, Wang W, Yu J, Wang Y, Wu X
and He Y: Long non-coding HCG18 promotes intervertebral disc
degeneration by sponging miR-146a-5p and regulating TRAF6
expression. Sci Rep. 7(13234)2017.PubMed/NCBI View Article : Google Scholar
|
|
43
|
Zhang H, Zheng W, Li D and Zheng J:
miR-146a-5p promotes chondrocyte apoptosis and inhibits autophagy
of osteoarthritis by targeting NUMB. Cartilage. 13 (2
Suppl):1467S–1477S. 2021.PubMed/NCBI View Article : Google Scholar
|
|
44
|
Liu J, Yu J, Jiang W, He M and Zhao J:
Targeting of CDKN1B by miR-222-3p may contribute to the development
of intervertebral disc degeneration. FEBS Open Bio. 9:728–735.
2019.PubMed/NCBI View Article : Google Scholar
|
|
45
|
Fan H, Niu W, He M, Kong L, Zhong A, Zhang
Q, Yan Y and Zhang L: Bioinformatics analysis of differently
expressed microRNAs in anxiety disorder. Zhonghua Yi Xue Yi Chuan
Xue Za Zhi. 32:641–646. 2015.PubMed/NCBI View Article : Google Scholar : (In Chinese).
|
|
46
|
Kao YC, Chen JY, Chen HH, Liao KW and
Huang SS: The association between depression and chronic lower back
pain from disc degeneration and herniation of the lumbar spine. Int
J Psychiatry Med. 57:165–177. 2022.PubMed/NCBI View Article : Google Scholar
|
|
47
|
Wei Q, Zhang X, Zhou C, Ren Q and Zhang Y:
Roles of large aggregating proteoglycans in human intervertebral
disc degeneration. Connect Tissue Res. 60:209–218. 2019.PubMed/NCBI View Article : Google Scholar
|
|
48
|
Silagi ES, Shapiro IM and Risbud MV:
Glycosaminoglycan synthesis in the nucleus pulposus: Dysregulation
and the pathogenesis of disc degeneration. Matrix Biol.
71-72:368–379. 2018.PubMed/NCBI View Article : Google Scholar
|